Hepatocyte Growth Factor-mediated satellite cells niche perturbation promotes development of distinct sarcoma subtypes
- University of Turin, Italy
- Center for Experimental Research and Medical Studies, Italy
- Center for Cancer Research, National Institutes of Health (NIH), United States
- Fondazione IRCCS Istituto Nazionale Tumori, Italy
- Boston Children's Hospital and Harvard Medical School, United States
Figures
Figure 1 with 1 supplement

Met and satellite signatures are both preferentially associated with the ERMS subtype, while UPS show high Met and fibroblast scores.
(A) Unsupervised hierarchical clustering of RMS samples according to the Met or satellite signature genes; colors highlight RMS subtype enrichment in single clusters (ARMSp: translocation positive; ARMSn: translocation negative). (B) Box-plot of the Met signature scores for RMS and muscles in the indicated datasets. ****p<0.0001 (t test). (C) Box-plot of the Met signature scores for ERMS and ARMSp in the indicated datasets. **p<0.01; ****p<0.0001 (t test). (D) Ranked distribution of RMS subtypes according to the indicated signature scores. The boxed area includes the top 25% samples. NSp>0.05; *p<0.05; ***p<0.001; ****p<0.0001 (hypergeometric test). (E) Venn diagrams of ERMS included in the box in D, showing a significant intersection between high Met and high satellite signatures. *p<0.05; ****p<0.0001 (hypergeometric test). (F) Box-plot of the Met signature scores for UPS and other sarcomas in the indicated dataset. ***p<0.001 (t test). (G) Box-plot of the fibroblast signature scores for UPS and RMS in the indicated datasets. ****p<0.0001 (t test).
Figure 1—figure supplement 1
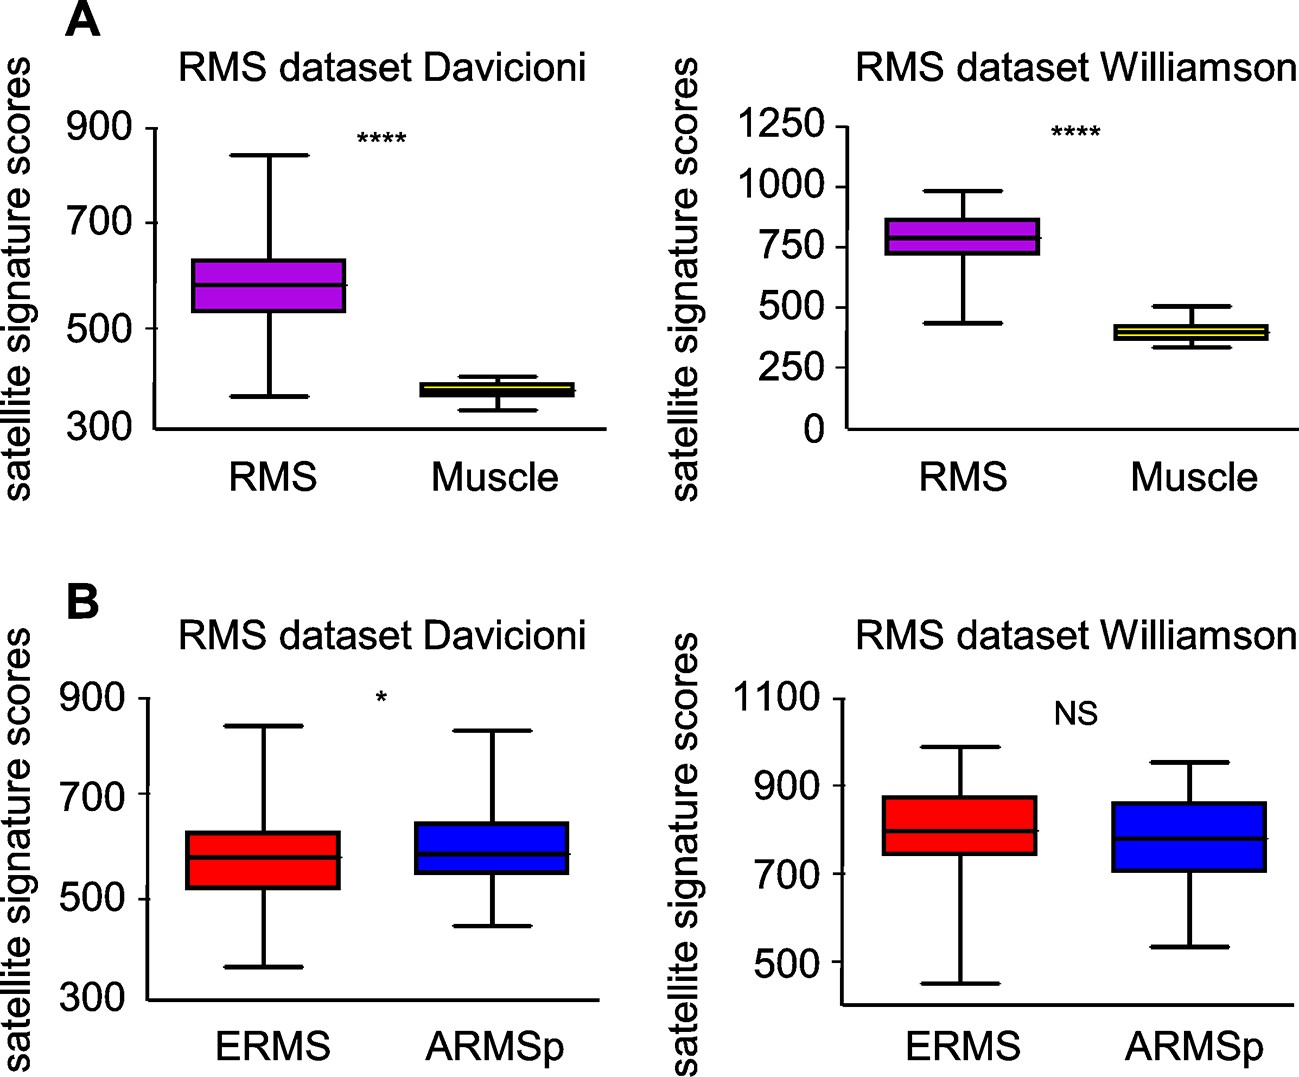
Satellite signature analysis in human RMS datasets.
(A) Box-plot of the satellite signature scores for RMS and muscles in the indicated datasets. ****p<0.0001 (t test). (B) Box-plot of the satellite signature scores for ERMS and ARMSp in the indicated datasets. NSp>0.05; *p<0.05; (t test).
Figure 2 with 1 supplement
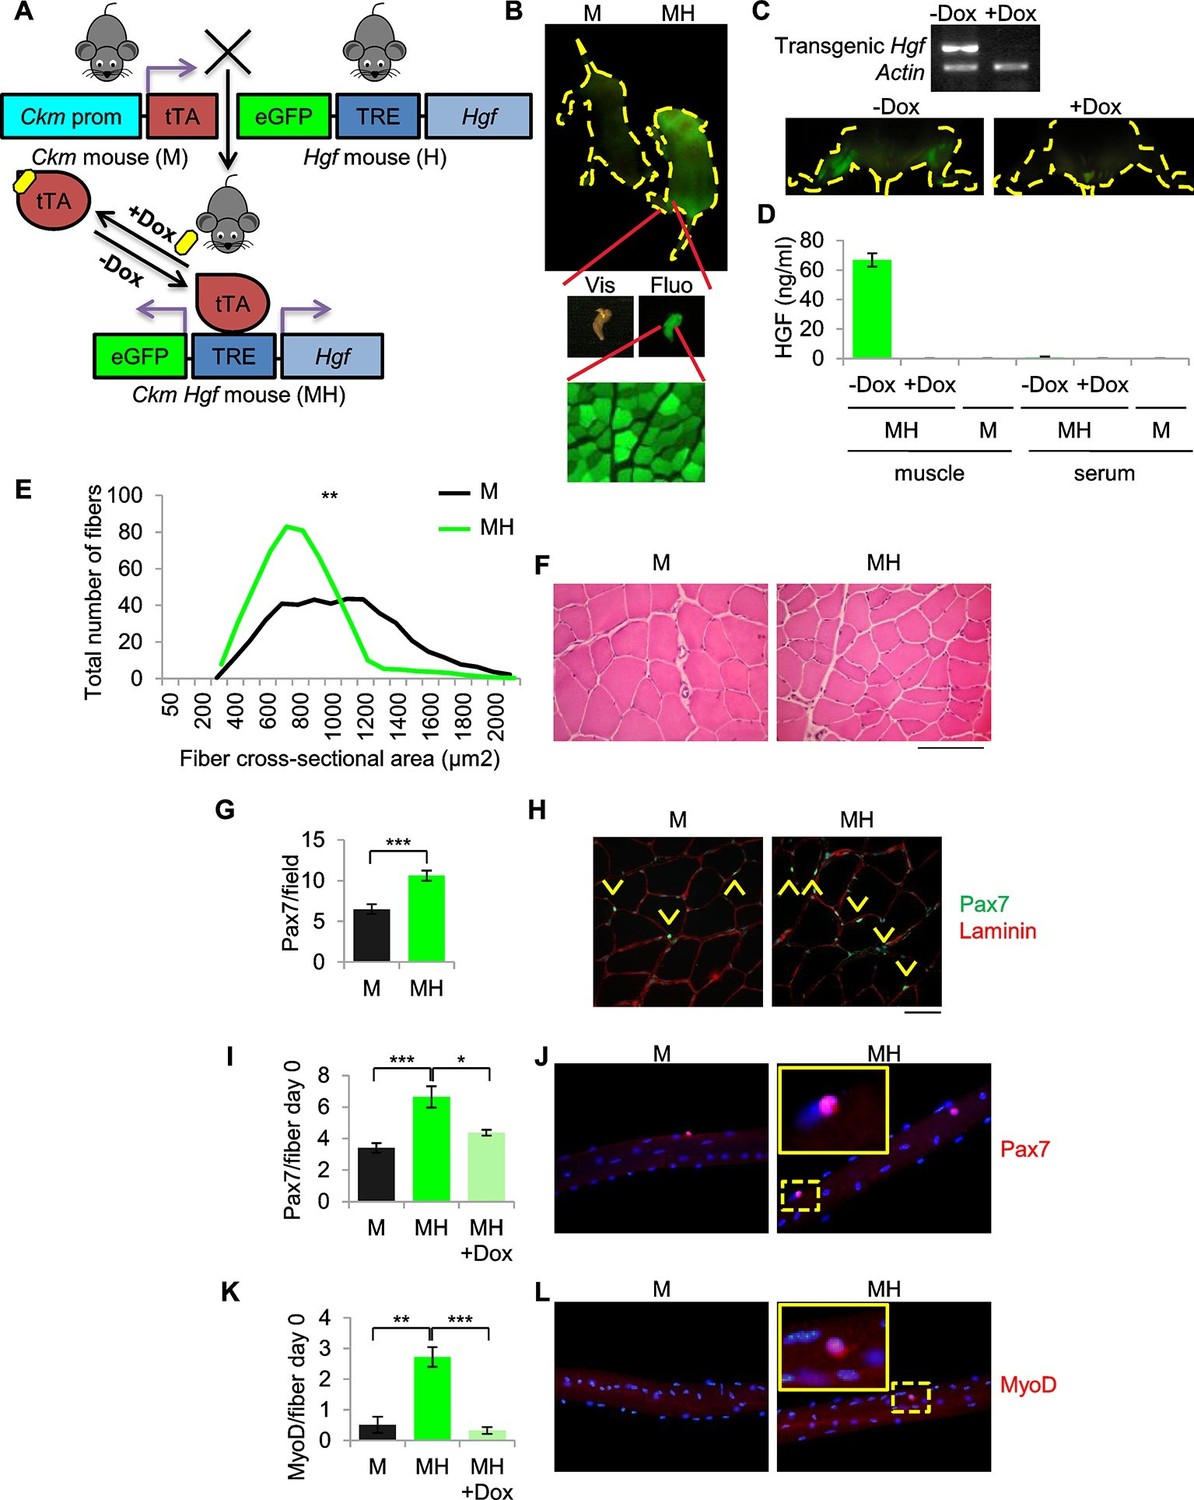
SC niche perturbation results in satellite cells activation.
(A) Schematic representation of the system used to generate Ckm-Tet-Off Hgf (MH) mice. In the absence of Doxycycline (-Dox), tTA binds to the Tetracycline Responsive Element (TRE), inducing the expression of HGF and eGFP in skeletal muscle. (B) Upper panel: fluorescent image of P10 mice. Middle panel: MH hindlimb under visible (Vis) and fluorescent (Fluo) light. Lower panel: fluorescent image of a muscle cross-section of a MH mouse. (C) Upper panel: semi-quantitative RT PCR of the indicated genes on Tibialis anterior muscles. Lower panel: fluorescent images of hindlimbs from a MH mouse with or without Dox treatment. (D) HGF-ELISA quantification in muscle and serum extracts from Dox-treated or control mice. (E) Distribution of Tibialis anterior cross-sectional areas showing a leftward shift in MH mice relative to their respective M controls. The mean value for MH mice was 585 ± 37 µm2 (n=8); the mean value for control M mice was 844 ± 63 µm2 (n=10). **p<0.01 (t test). (F) Representative H&E staining of Tibialis anterior cross sections. (Scale bar = 100 µm). (G) Quantification (mean ± SEM) of Pax7 positive cells/field in Tibialis anterior sections (M mice n=7; MH mice n=6). ***p<0.001 (t test). (H) Representative immunofluorescence of Pax7 (green), Laminin (red) and DAPI (blue) staining in G. Arrowheads indicate Pax7-positive cells. (Scale bar = 50 µm). (I) Quantification (mean ± SEM) of Pax7 positive cells/fiber after single fiber isolation (M mice n=13; MH mice n=12; MH +Dox n=2). *p<0.05; ***p<0.001 (t test). (J) Representative immunofluorescence of Pax7 (red) and DAPI (blue) staining in I. (K) Quantification (mean ± SEM) of MyoD-positive cells/fiber after single fiber isolation (M mice n=3; MH mice n=3; MH +Dox n=4). **p<0.01; ***p<0.001 (t test). (L) Representative immunofluorescence of MyoD (red) and DAPI (blue) staining in K. Dashed areas are shown at threefold magnification.
Figure 2—figure supplement 1
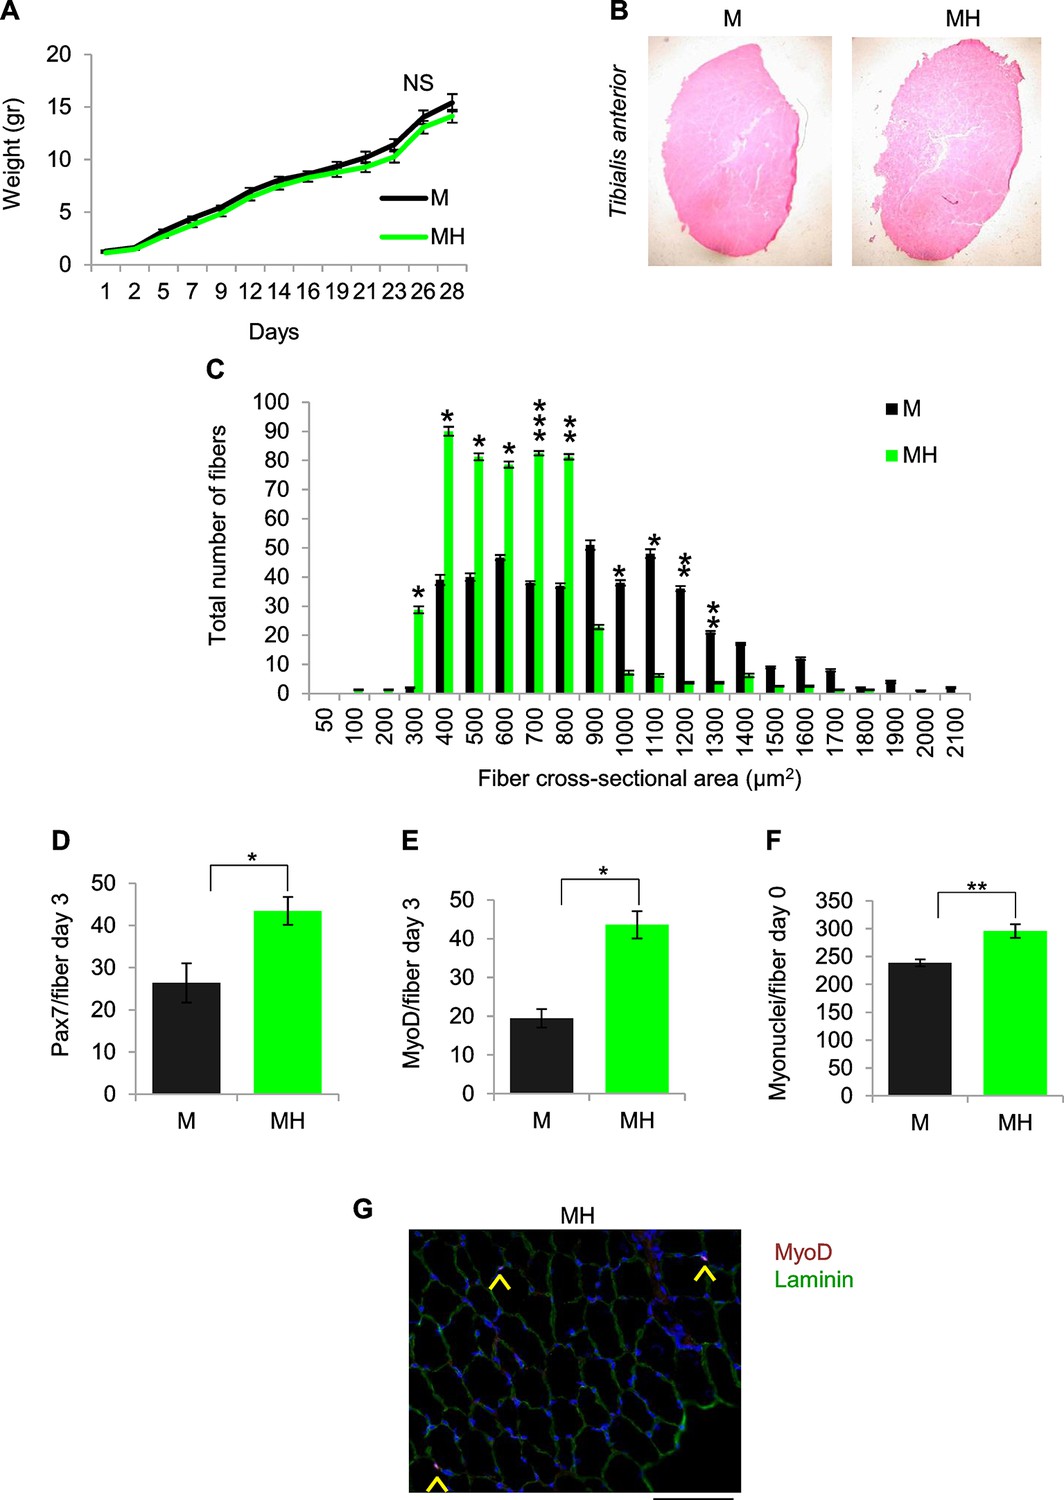
SC niche perturbation results in satellite cells activation.
(A) Body weight (mean ± SEM) of the indicated mice (M mice n=6; MH mice n=9). NSp>0.05 (t test). (B) Representative image of Tibialis anterior cross sections in the indicated mice. (C) Fiber size distribution (mean ± SEM) of Tibialis anterior showing a significant increase in the number of fibers with cross-sectional area of 300–800 μm2 and a significant decrease in the number of fibers with cross-sectional area of 1000–1300 μm2 in MH mice (n=8) respective to control M mice (n=10). *p<0.05; **p<0.01; ***p<0.001 (t test). (D) Quantification (mean ± SEM) of Pax7-positive cells/fiber after three days from single fiber isolation (M mice n=6; MH mice n=5). *p<0.05 (t test). (E) Quantification (mean ± SEM) of MyoD-positive cells/fiber after three days from single fiber isolation (M mice n=2; MH mice n=2). *p<0.05 (t test). (F) Quantification (mean ± SEM) of myonuclei/fiber after single fiber isolation (M mice n=5; MH mice n=7). **p<0.01(t test). (G) Representative immunofluorescence of MyoD (red), Laminin (green) and DAPI (blue) staining. Arrowheads indicate MyoD-positive cells. (Scale bar = 50 µm).
Figure 3 with 2 supplements

SC niche perturbation in Cdkn2a-null mice results in a multi-step model of ERMS development.
(A) Representative image of a control (M) and a hyperplastic mouse (MHI-null). (B) Representative fluorescent images of MHI-null trunk muscles at different stages of progression: normal muscle, hyperplasia and ERMS. (C) Distribution of MHI-null mice developing ERMS with or without hyperplasia. (D) H&E staining and representative immunohistochemical analysis of MHI-null specimens collected at different stages of tumor progression (from hyperplasia to ERMS, stage 1–4). (Scale bar = 100 µm). (E) Representative immunofluorescence on MHI-null hyperplastic muscle sections. Pax7 (red), Laminin (green), Desmin (red) and DAPI (blue). (Scale bar = 100 µm).
Figure 3—figure supplement 1
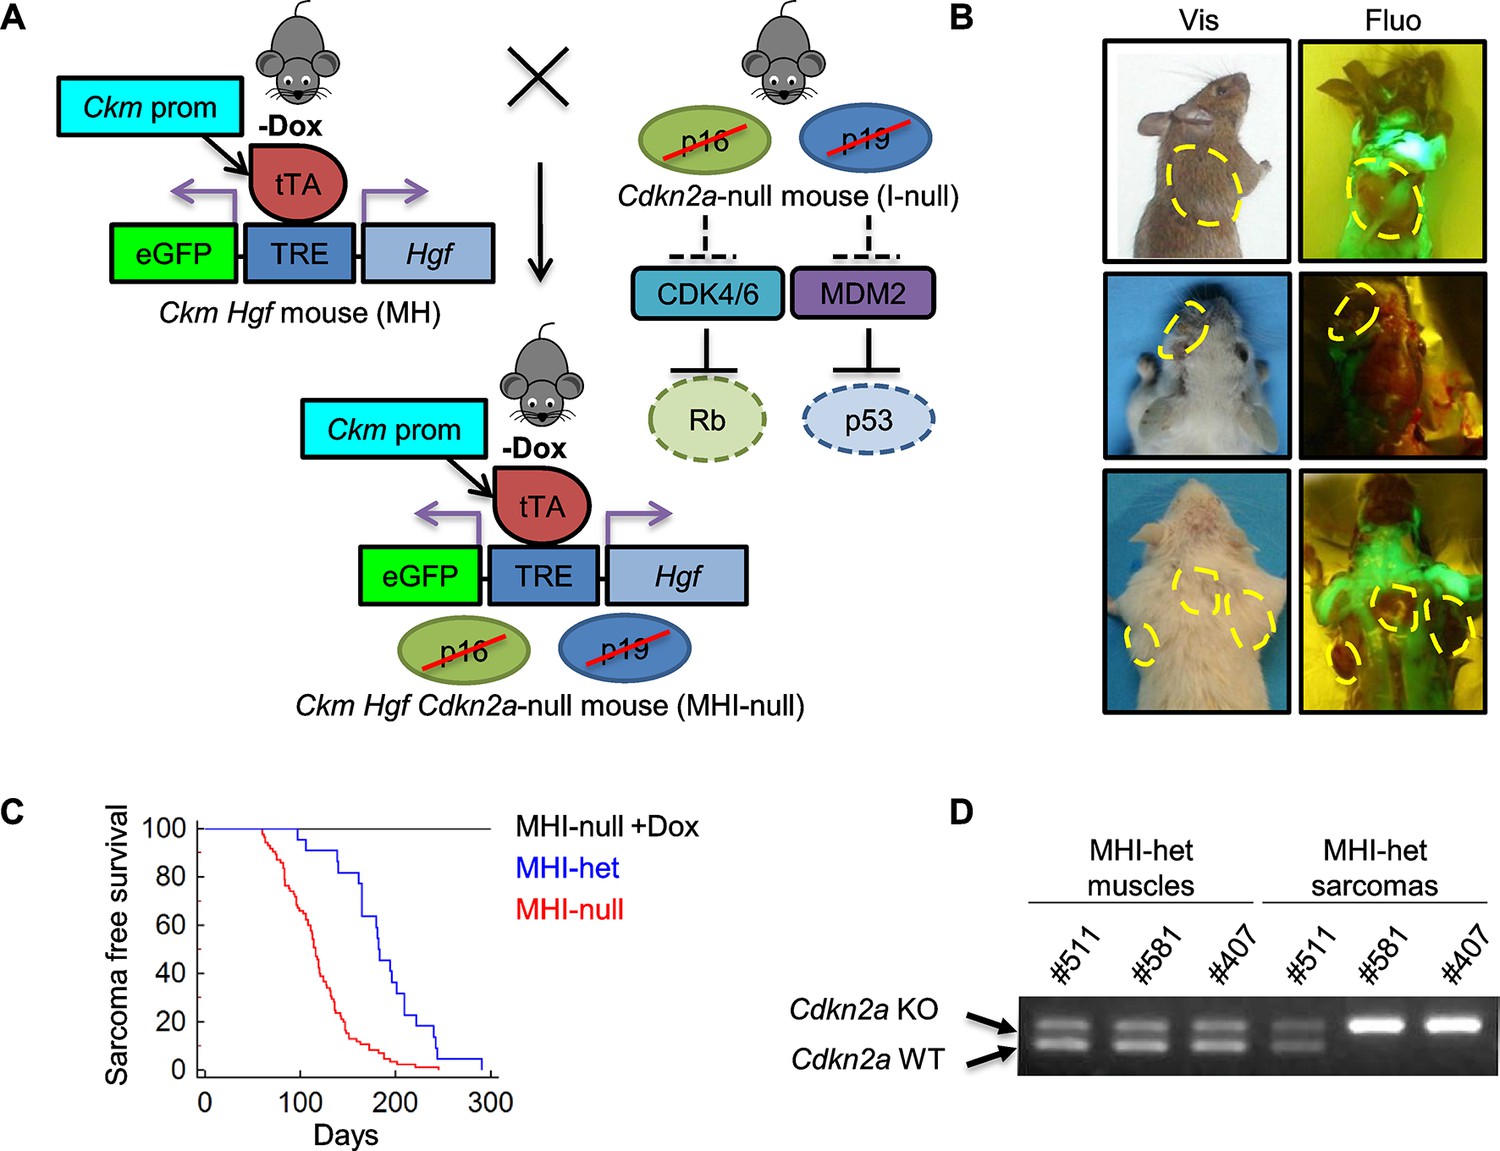
SC niche perturbation in Cdkn2a-null mice results in sarcoma development.
(A) Schematic representation of the system used to generate Ckm Hgf Cdkn2a-null (MHI-null) mice. The effect of Cdkn2a locus loss on Rb and p53 oncosuppressors is also depicted. (B) Representative images of tumor-bearing MHI-null mice under visible (Vis) and fluorescent (Fluo) light. Neoplastic lesions are marked with yellow dashed lines. (C) Kaplan-Meier curve showing the relative sarcoma-free survival of MHI-het and MHI-null mice treated or not with Dox. (D) PCR for Cdkn2a locus on genomic DNA extracted from normal muscles and sarcomas.
Figure 3—figure supplement 2
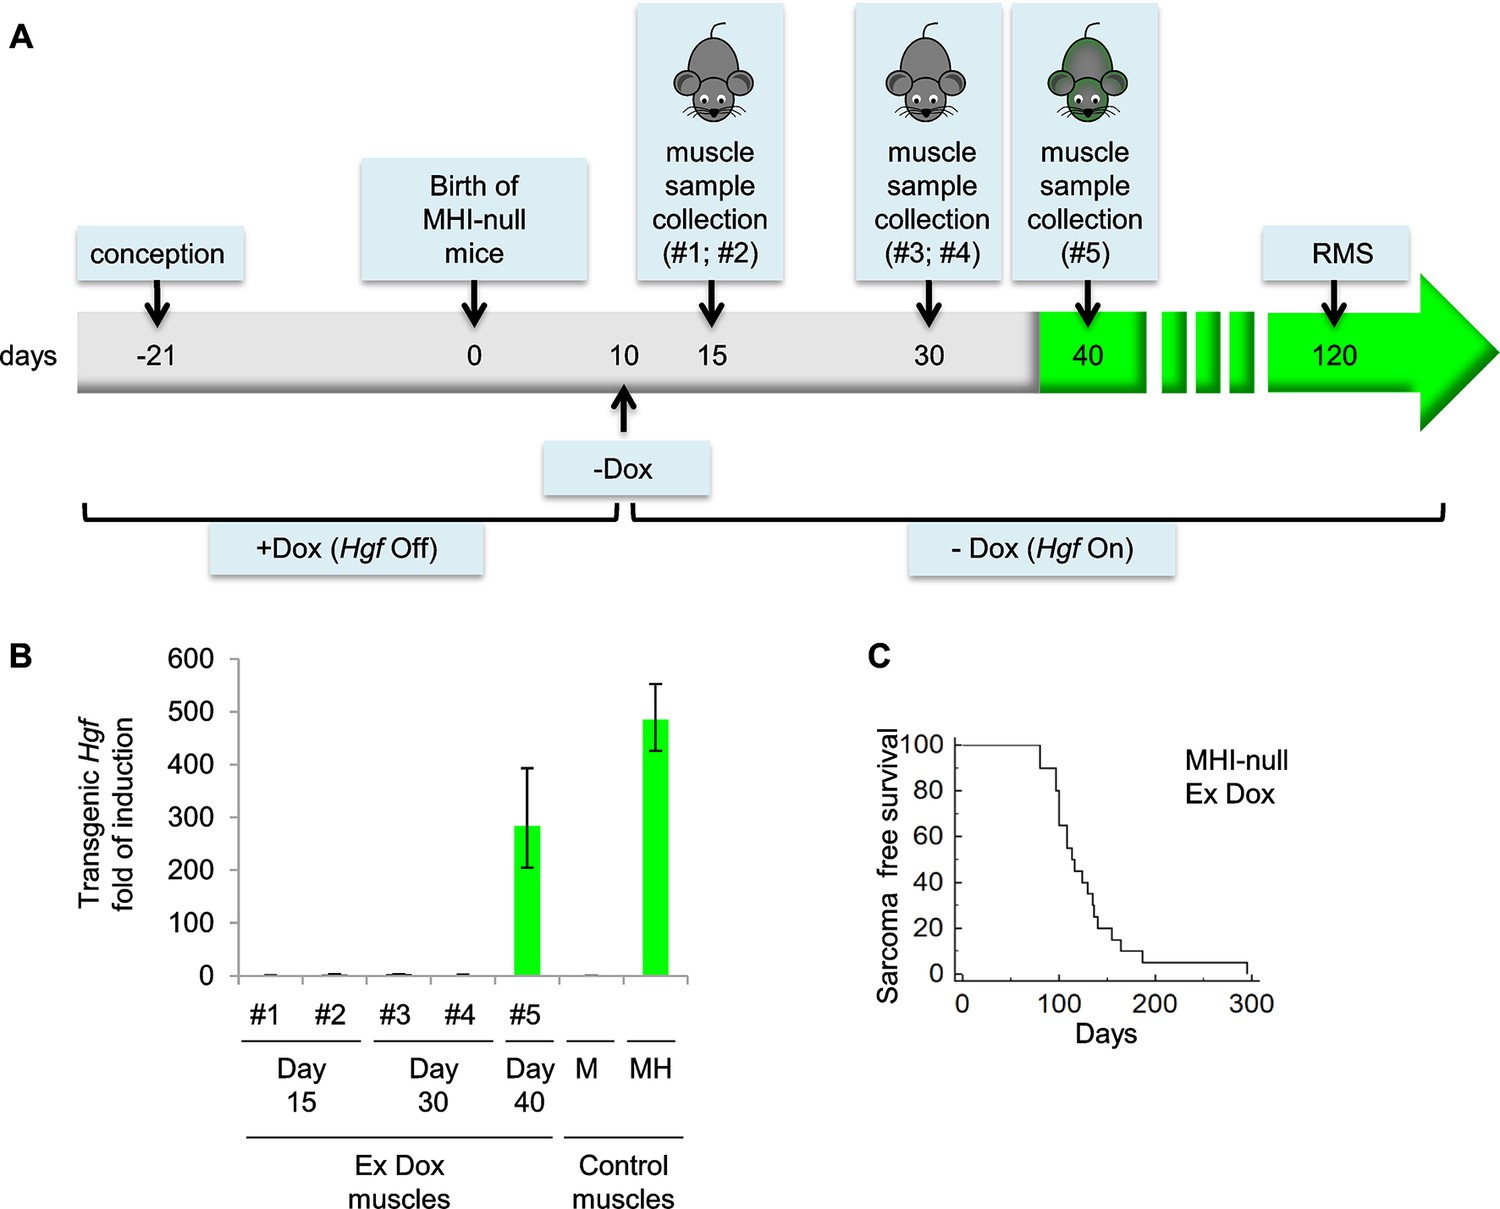
Evaluation of Hgf expression and mortality in MHI-null mice treated with Dox from conception to P10.
(A) Schematic representation of the procedure used to evaluate RMS formation in mice treated with Dox (Hgf Off) from conception to P10. Muscle samples were collected from different mice at the indicated time. Green background corresponds to detectable GFP expression. (B) Real-time PCR analysis of transgenic Hgf expression in MHI-null muscle samples indicated in panel A and in control muscles. (C) Kaplan-Meier curve showing the survival of MHI-null mice treated with Dox from conception to P10 (Ex Dox).
Figure 4
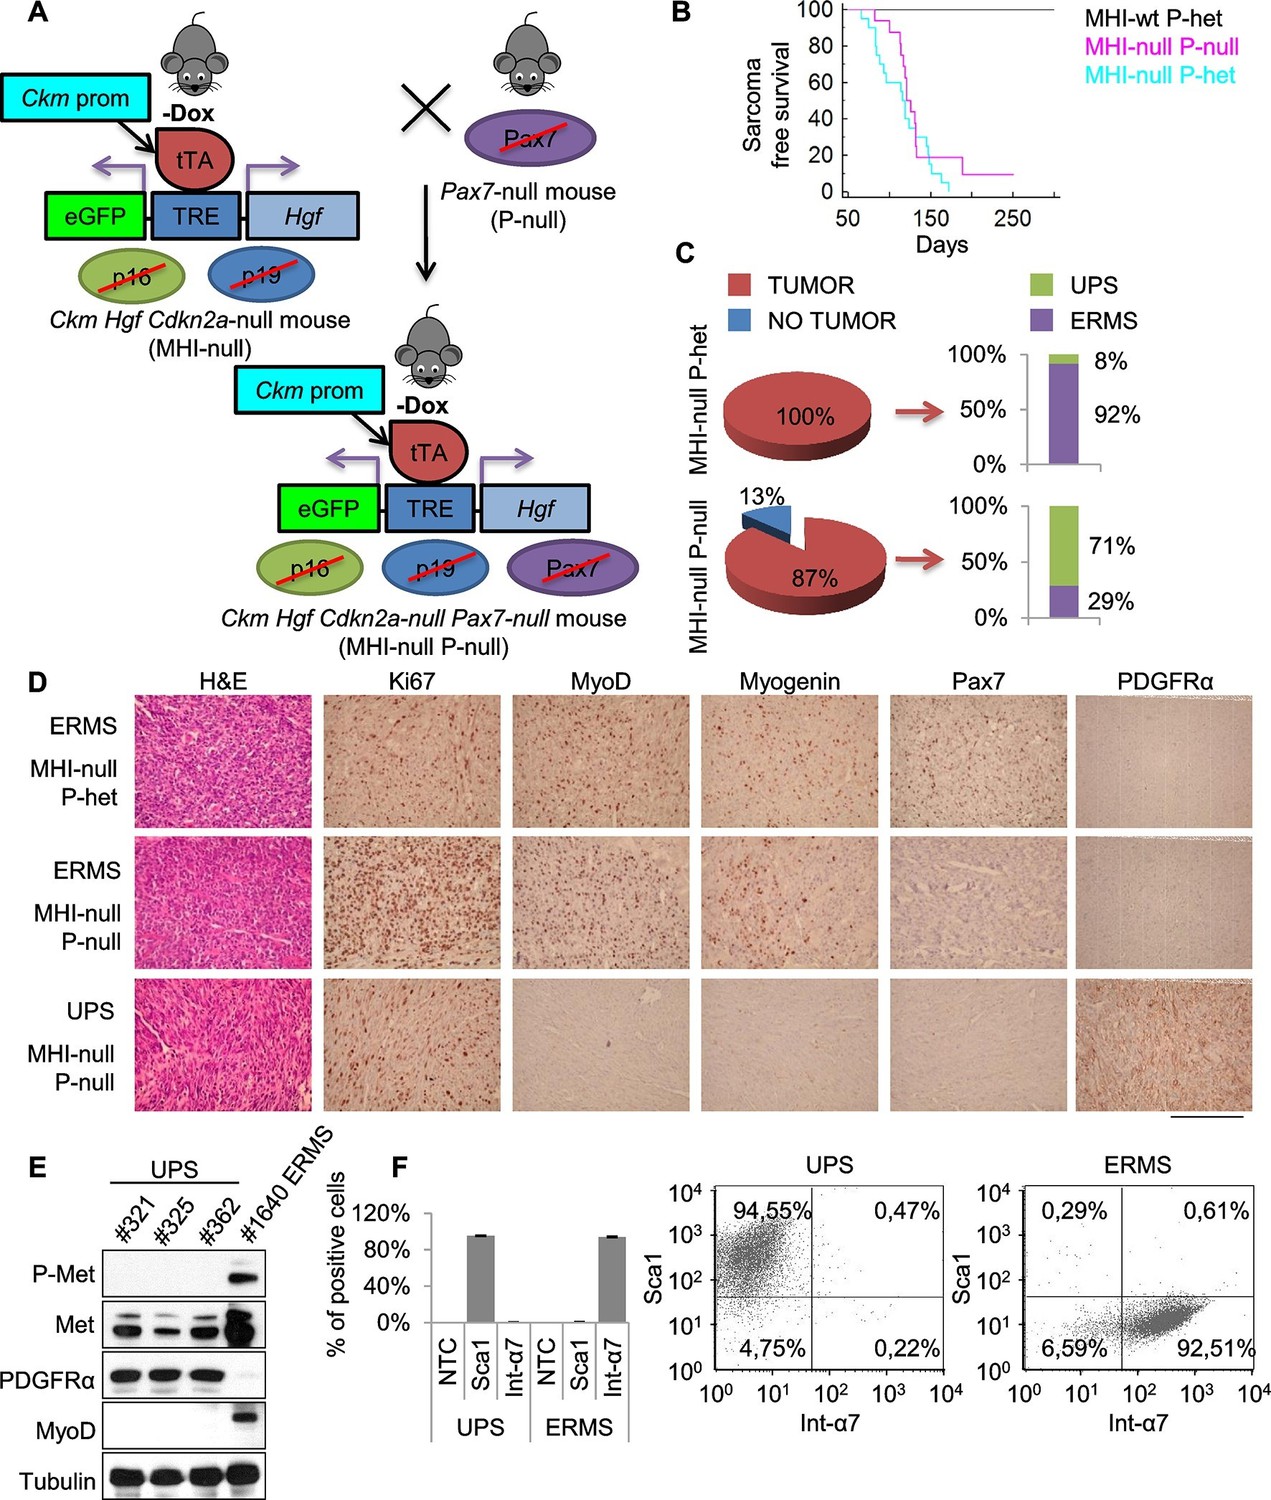
Genetic ablation of Pax7 results mainly in UPS development.
(A) Schematic representation of the system used to generate Ckm Hgf Cdkn2a-null Pax7-null (MHI-null P-null) mice. (B) Kaplan-Meier curve showing the relative sarcoma-free survival in the indicated genotypes. (C) Penetrance (pie charts) and histological distribution (bar graphs) of tumors. (D) Representative immunohistochemical analysis of MHI-null tumors in Pax7 heterozygous or null genetic background. UPS: undifferentiated pleomorphic sarcoma. (Scale bar = 250 µm). (E) Western blot analysis of murine UPS and ERMS probed for the indicate proteins. (F) Sca1 and Int-α7 expression analysis in primary murine UPS and ERMS (left panel, single staining; center and right panels, double staining).
Figure 5 with 4 supplements
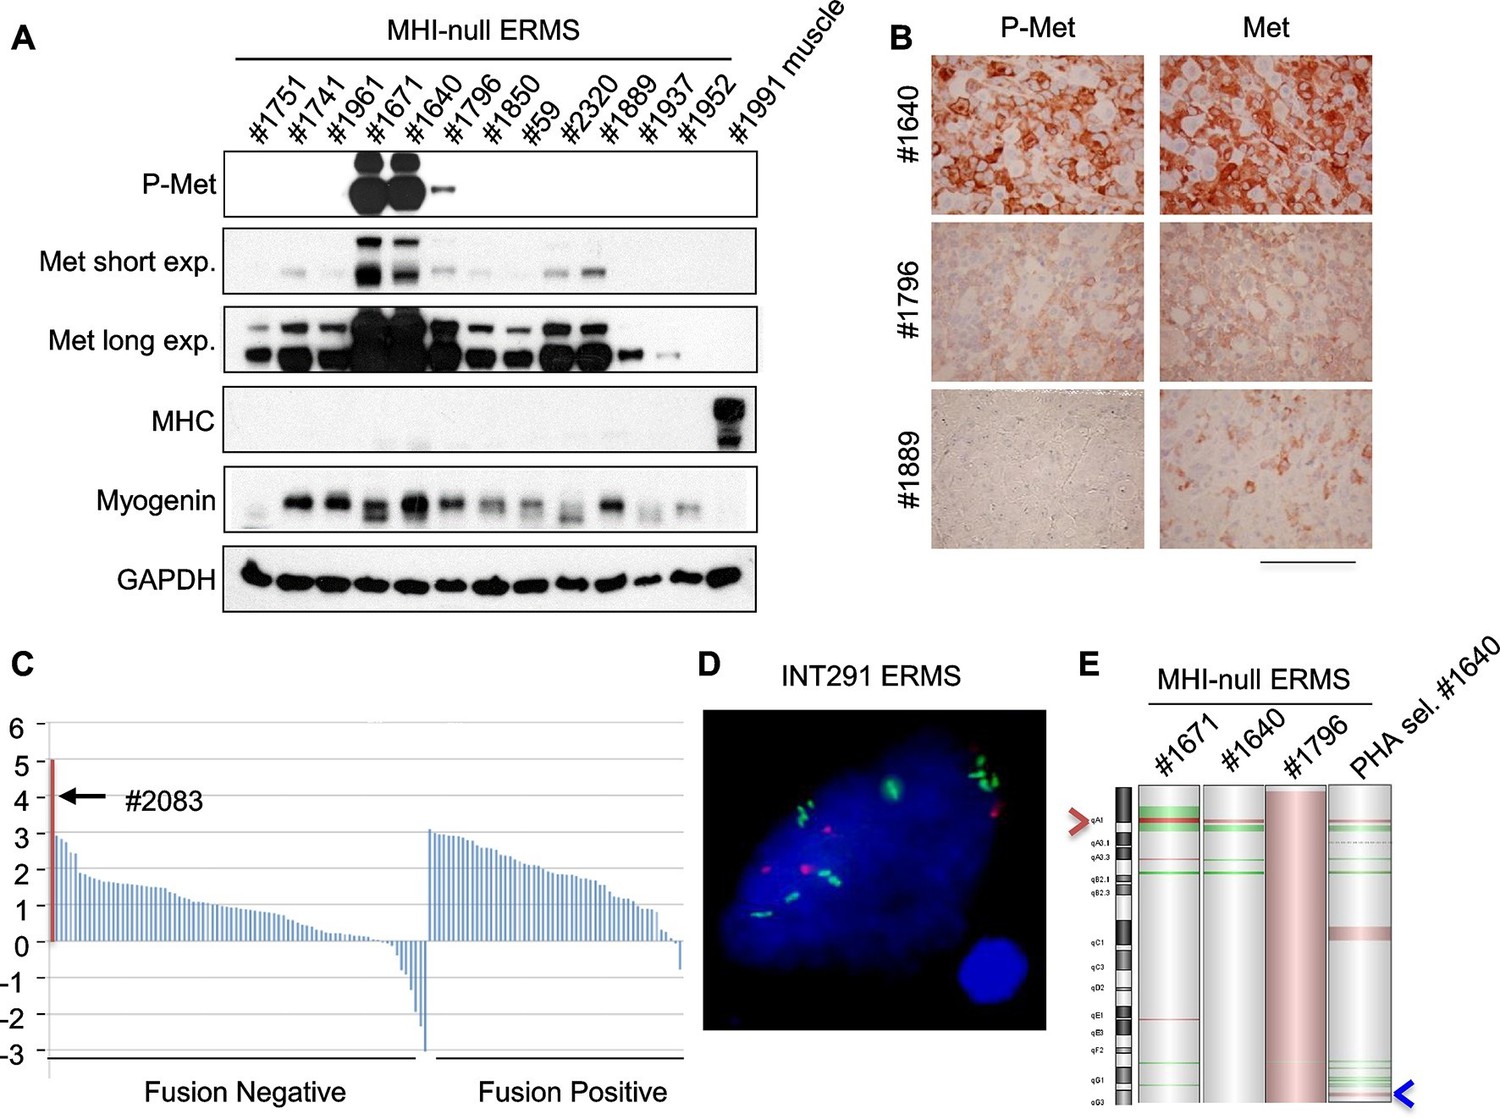
Only a minor fraction of ERMS harbors MET amplification.
(A) Western blot analysis in a panel of primary murine MHI-null ERMS probed for the indicate proteins. (B) Immunohistochemical analysis of primary murine MHI-null ERMS shown in A, probed for Met and phosphorylated Met. (Scale bar = 100 µm). (C) Waterfall plot showing the MET Z-score expression from a panel of previously characterized human RMS tumors (Shern et al., 2014) (http://pob.abcc.ncifcrf.gov/cgi-bin/JK). The exceptionally high MET expression in Patient 2083 (highlighted) is associated with focal amplification of chromosome 7q31.2 (Shern et al., 2014). (D) FISH for MET in a human ERMS sample (INT291) characterized by small cluster signals (with an average of 9 signals per cell; MET is labeled in green and centromeres in red). (E) CGH analysis of murine MHI-null ERMS. Red indicates copy number gain, green indicates copy number loss. Arrowheads mark the Met (red) and Kras (blue) loci.
Figure 5—figure supplement 1
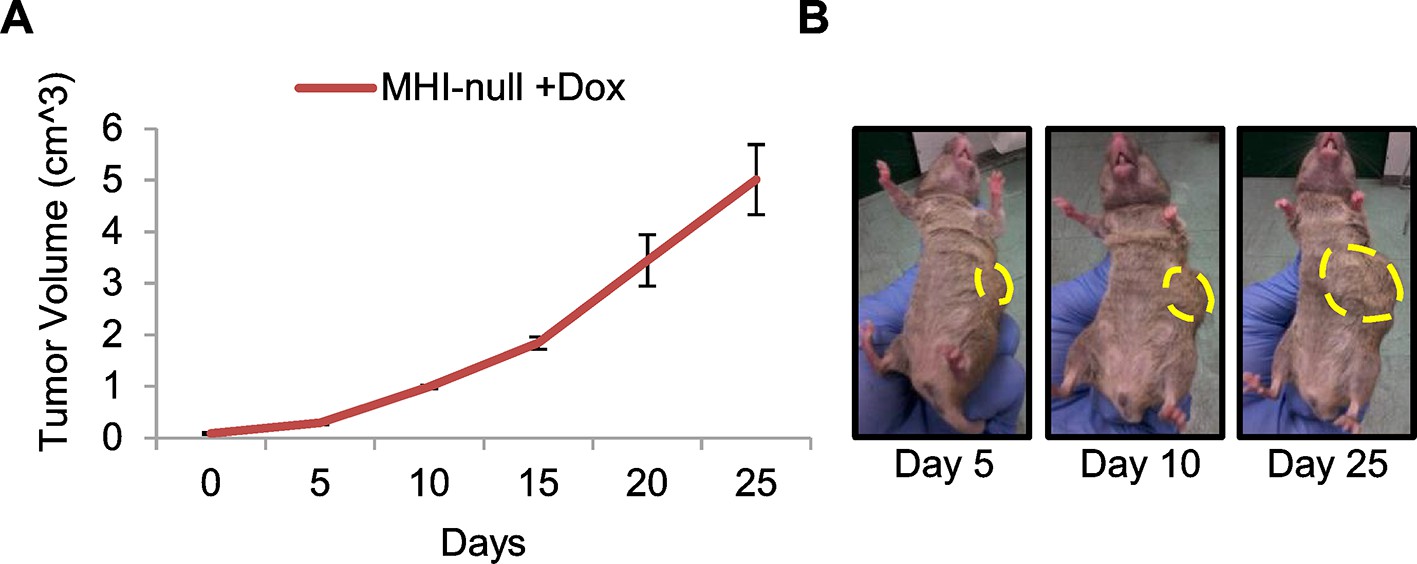
Transgenic Hgf downmodulation does not impair tumor growth.
(A) Growth curve (mean ± SEM) of tumors in MHI-null mice treated with Dox when tumors became palpable (n=3). (B) Representative images of a MHI-null mouse described in A.
Figure 5—figure supplement 2
Determination of the level of Met protein and phosphorylation in rhabdomyosarcomagenesis.
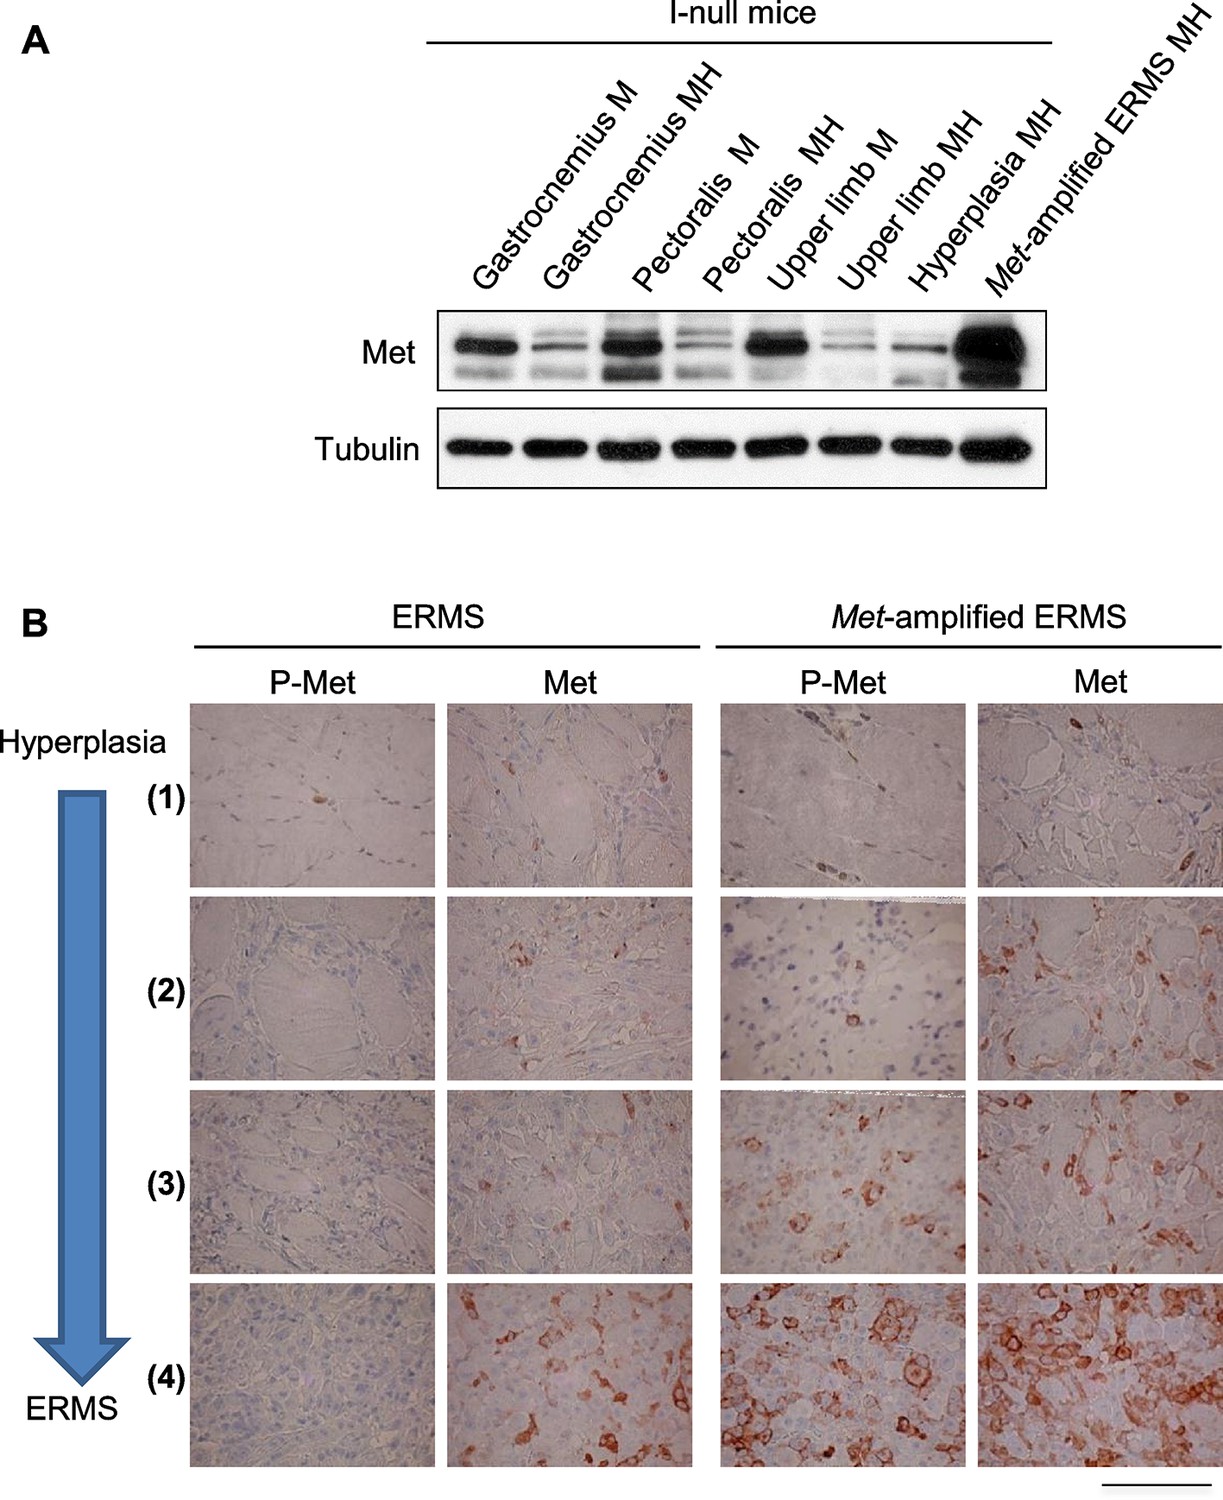
(A) Western blot analysis in the indicated samples of control (MI-null) and MHI-null mice, probed for the indicate proteins. (B) Representative immunohistochemical analysis of Met and P-Met in ERMS carrying or not Met amplification. For the indicated stages of rhabdomyosarcomagenesis see Figure 3D. (Scale bar = 100 µm).
Figure 5—figure supplement 3
Only a minor fraction of murine ERMS displays Met activation and amplification.
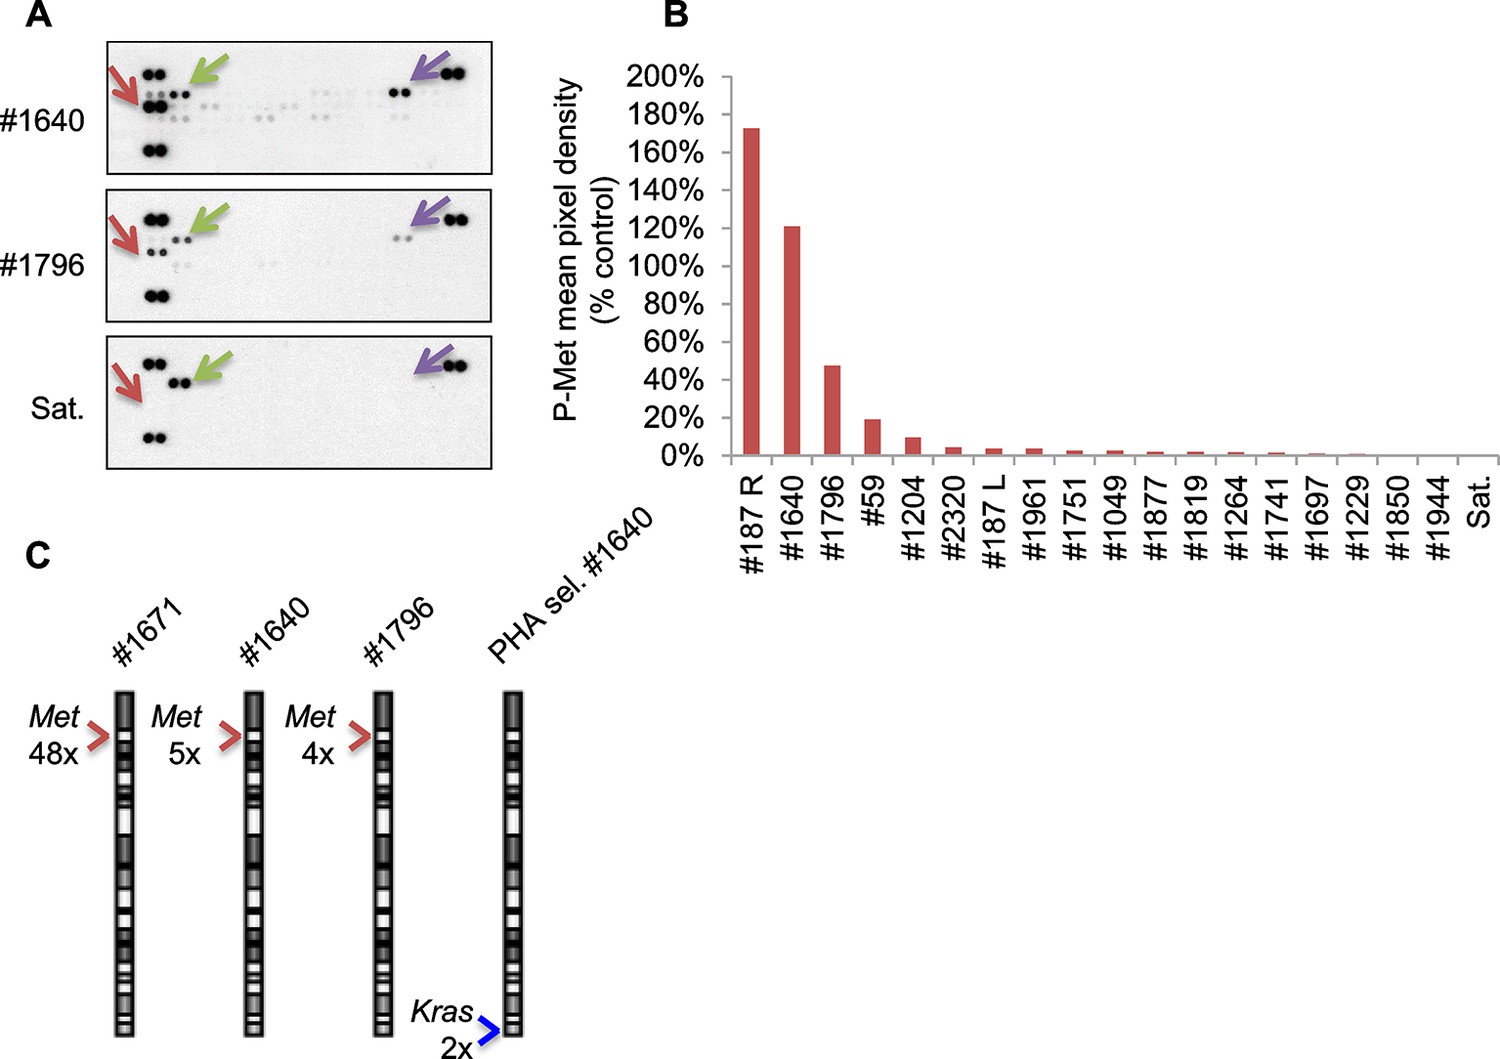
(A) Array-based detection of phosphorylated RTKs (p-RTK) in the indicated cell lysates. Arrows indicate duplicate signals for P-Met (in red), P-Erbb2 (in green) and P-Axl (in violet); positive controls are shown on the top left, top right, and lower left corners. (B) Densitometric quantification of P-Met signal detected through p-RTK analysis in the indicated MHI-null ERMS-derived cell lysates. (C) Real-time PCR analysis of Met and Kras relative copy number variation (CNV) performed in the indicated MHI-null ERMS. Arrowheads mark the Met (red) and Kras (blue) loci.
Figure 5—figure supplement 4

Evaluation of Met expression in human RMS datasets.
(A) Box plot of MET mRNA expression level in primary human RMS tumors and skeletal muscles in the indicated datasets. NSp>0.05; **p<0.01; (t test). (B) Box plot of MET mRNA expression level in human ARMSp tumors and in ERMS+ARMSn tumors in the indicated datasets. *p<0.05; ****p<0.0001 (t test).
Figure 6 with 1 supplement
Murine ERMS are genetically heterogeneous, with subsets specifically sensitive to pharmacological inhibition of distinct drivers.
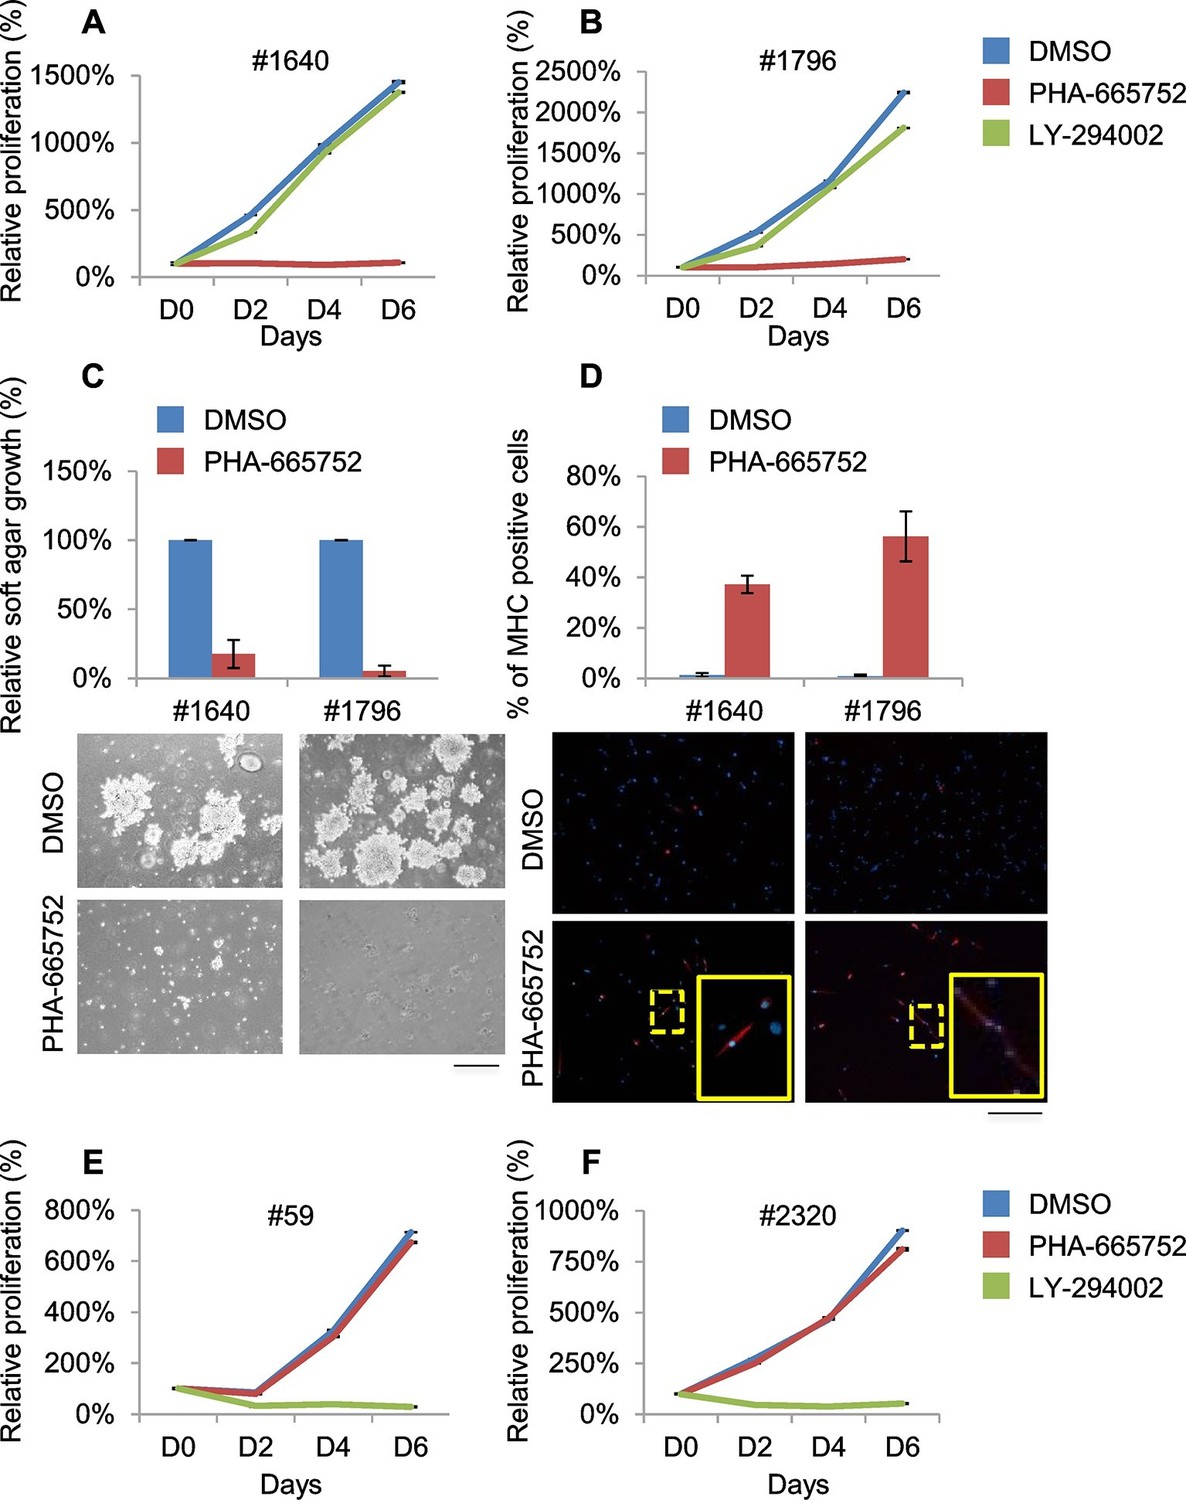
(A, B) Proliferation analysis (mean ± SD) of the indicated MHI-null ERMS cells treated with Met (PHA) and PI3K (LY) inhibitors. The number of cells at day 0 was set at 100%, representative assay of at least 2 independent experiments. (C) Quantification and representative images of soft agar growth assays of cells treated with PHA. The number of colonies obtained from cells maintained in DMSO control was set at 100% (3 independent experiments, mean ± SEM). (Scale bar = 500 µm). (D) MHC expression analysis and representative MHC immunostaining of cells treated with PHA for 3 days (3 independent experiments, mean ± SEM). Dashed areas are shown at threefold magnification. (Scale bar = 250 µm). (E, F) Proliferation analysis (mean ± SD) of the indicated MHI-null ERMS cells treated with Met (PHA) and PI3K (LY) inhibitors. The number of cells at day 0 was set at 100%, representative assay of at least 2 independent experiments.
Figure 6—figure supplement 1
Murine ERMS are genetically heterogeneous, with subsets specifically sensitive to pharmacological inhibition of distinct drivers.
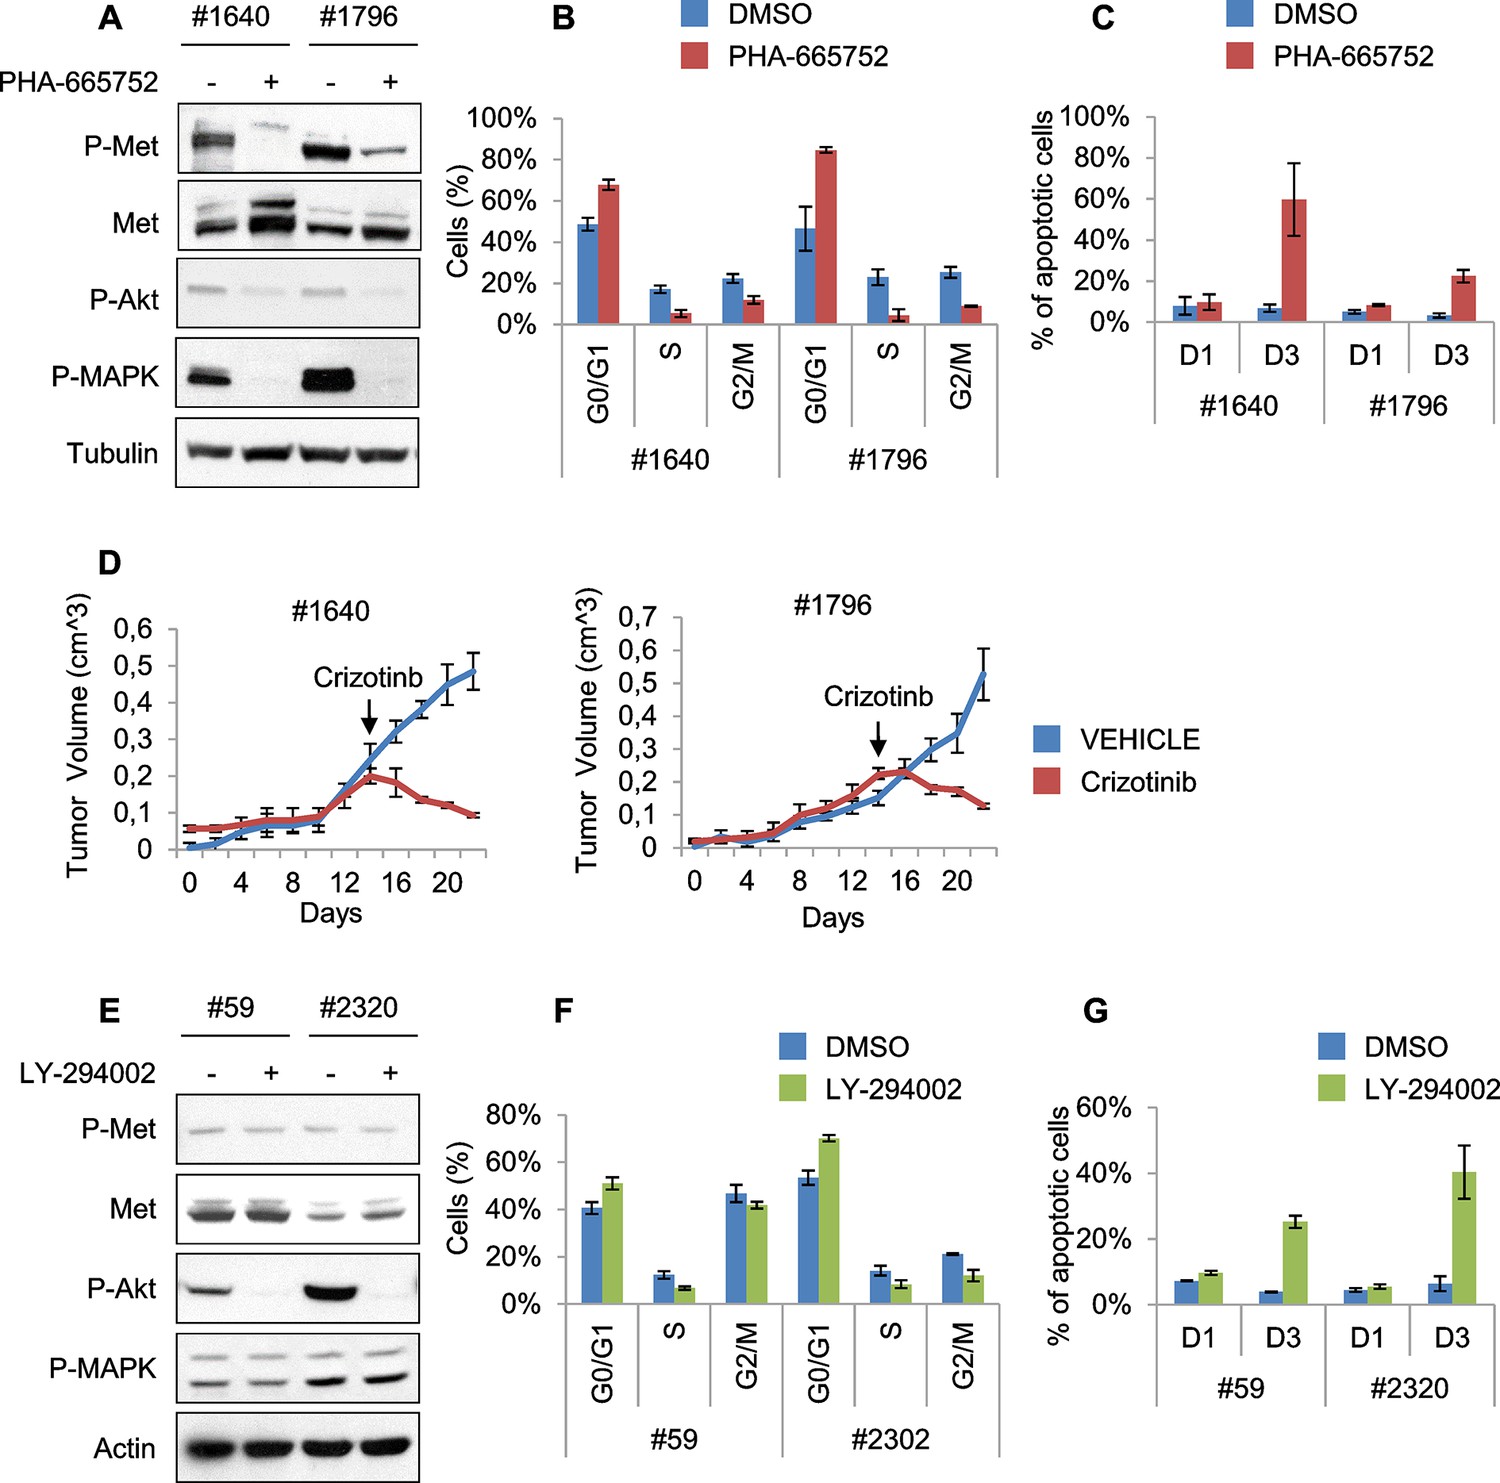
(A) Western blot analysis of #1640 and #1796 MHI-null ERMS cells, treated with PHA for 2 hr. (B) Cell cycle distribution of cells treated with PHA for 1 day (2 independent experiments, mean ± SEM). (C) Apoptosis assessment in cells treated with PHA for 1 and 3 days (2 independent experiments, mean ± SEM). (D) Tumor growth curve (mean ± SEM) of #1640 and #1796 ERMS cells subcutaneously injected in nude mice. Mice were treated with Crizotinib (100 mg/kg/day) starting on the day indicated by the arrow. (E) Western blot analysis of #59 and #2320 MHI-null ERMS cells, treated with LY for 2 hr. (F) Cell cycle distribution of cells treated with LY for 1 day (2 independent experiments, mean ± SEM). (G) Apoptosis assessment in cells treated with LY for 1 and 3 days (2 independent experiments, mean ± SEM).
Figure 7 with 1 supplement
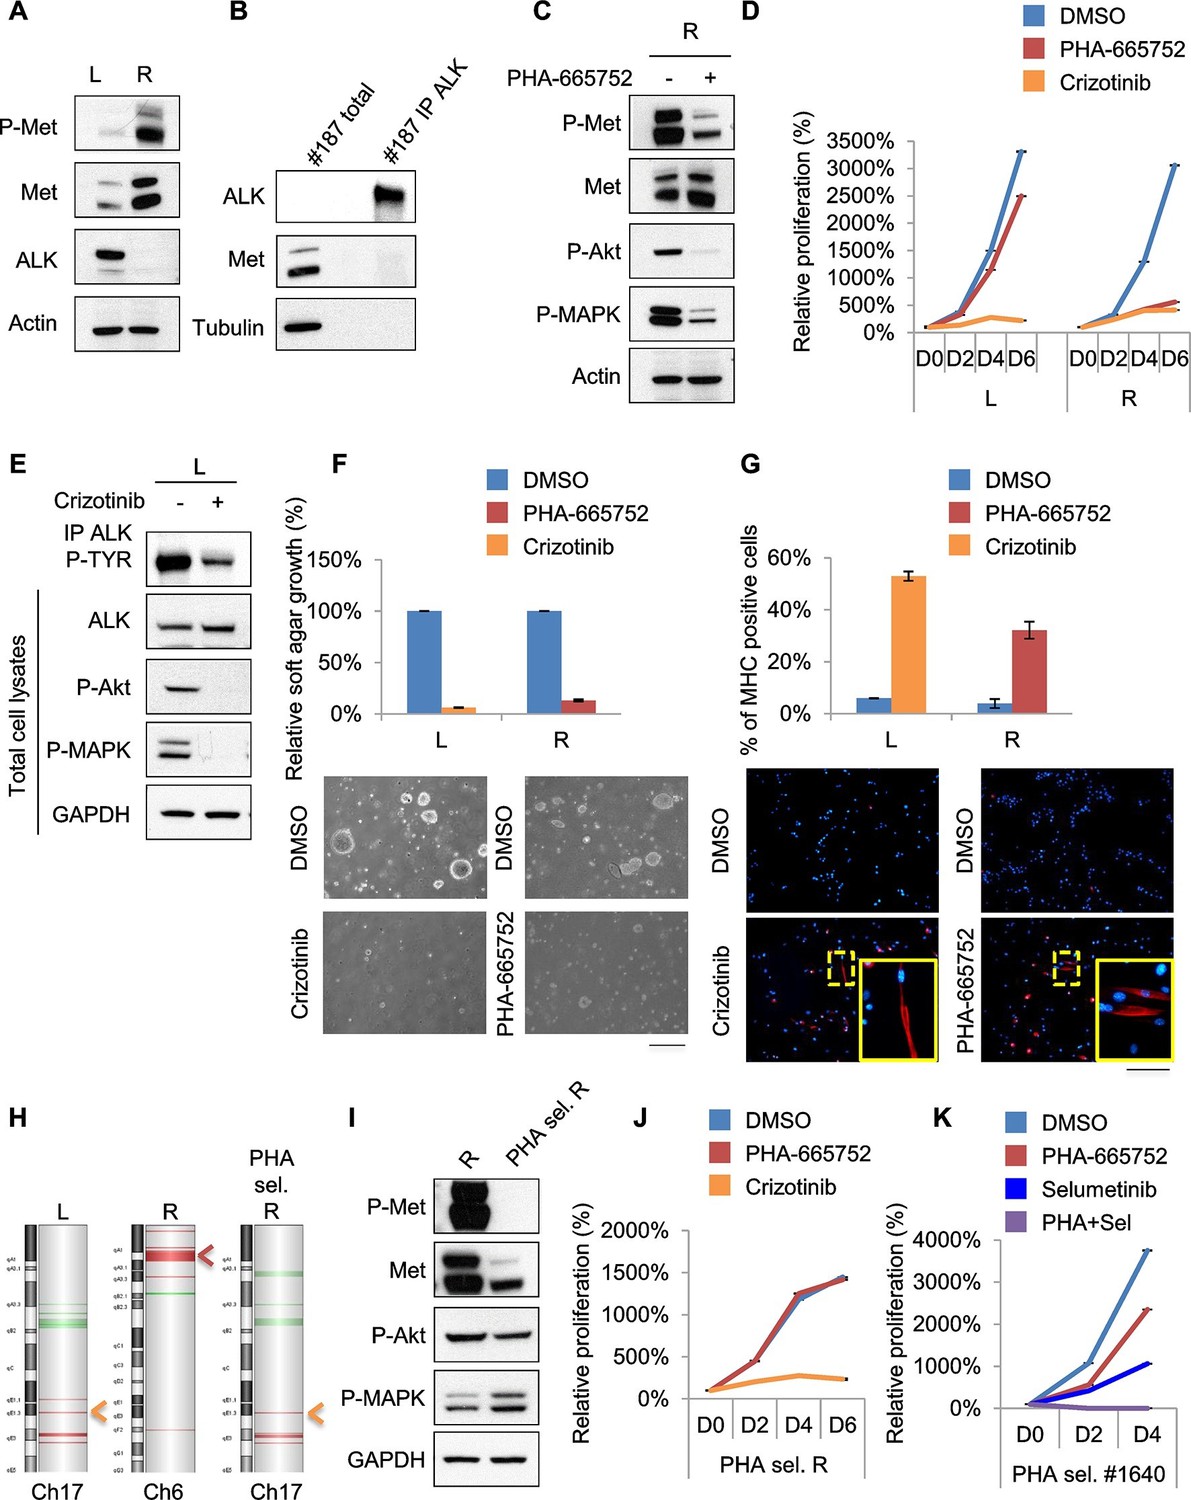
Treatments based on combination therapy can be effective in preventing ERMS recurrence and clonal evolution.
(A) Western blot analysis on the indicated proteins in L and R cells. (B) Western blot on total lysate and ALK-immunoprecipitated fraction of #187 ERMS tumor. (C) Western blot analysis of R cells treated with PHA for 2 hr. (D) Proliferation analysis (mean ± SD) of L and R cells treated with the indicated inhibitors. The number of cells at day 0 was set at 100%, representative assay of at least 2 independent experiments. (E) Western blot analysis on total cell lysate and ALK-immunoprecipitated fraction of L cells, treated with 500 nM Crizotinib for 2 hr. (F) Quantification and representative images of soft agar growth assays of L and R cells treated with the indicated inhibitors. The number of colonies obtained from cells in DMSO control was set at 100% (2 independent experiments, mean ± SEM). (Scale bar = 500 µm). (G) MHC expression analysis and representative MHC immunostaining of L and R cells, treated with the indicated inhibitors for 3 days (2 independent experiments, mean ± SEM). Dashed areas are shown at threefold magnification. (Scale bar = 250 µm). (H) CGH analysis of MHI-null ERMS cell lines. Red indicates copy number gain, green indicates copy number loss. Arrowheads mark Alk (orange) and Met (red) loci. (I) Western blot analysis of R and PHA-selected R cells. (J) Proliferation analysis (mean ± SD) of PHA-selected R cells treated with the indicated inhibitors. The number of cells at day 0 was set at 100%, representative assay of at least 2 independent experiments. (K) Proliferation analysis (mean ± SD) of PHA-selected #1640 cells treated with the indicated inhibitors. The number of cells at day 0 was set at 100%, representative assay of at least 2 independent experiments.
Figure 7—figure supplement 1
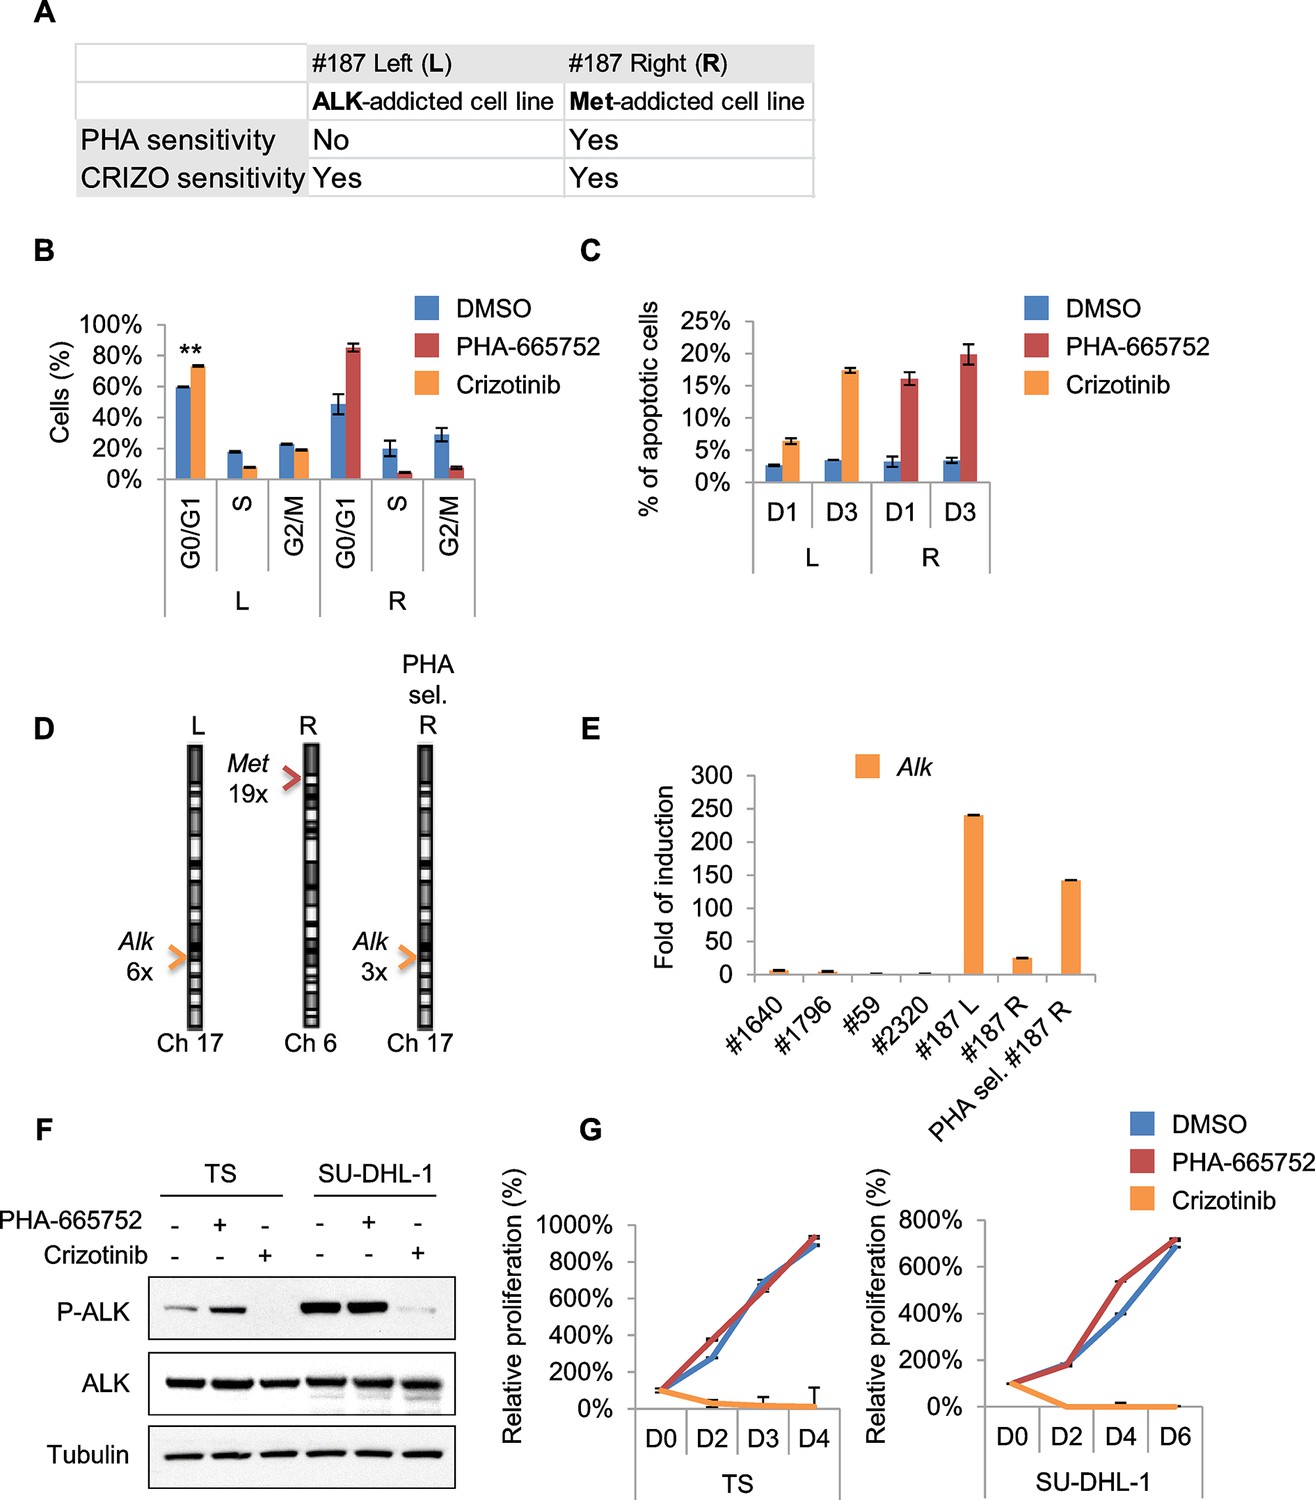
Treatments based on combination therapy can be effective in preventing ERMS recurrence and clonal evolution.
(A) Table of L and R cells showing oncogene addiction and relative pharmacological response. (B) Cell-cycle distribution of L and R cells, treated with the indicated inhibitors for 1 day (2 independent experiments, mean ± SEM). **p<0.01 (t test). (C) Apoptosis assessment in L and R cells treated with the indicated inhibitors for 1 and 3 days (2 independent experiments, mean ± SEM). (D) Real-time PCR analysis of Met and Alk relative copy number variation (CNV) performed in the indicated MHI-null ERMS cell lines. Arrowheads mark Alk (orange) and Met (red) loci. (E) Real-time PCR analysis of Alk expression in a subset of ERMS cell lines. (F) Western blot analysis in TS and SU-DHL-1 cells, treated with the indicated inhibitors for 6 hr. (G) Proliferation analysis (mean ± SD) of cells described in F treated with the indicated inhibitors. The number of cells at day 0 was set at 100%, representative assay of at least 2 independent experiments.
Additional files
-
Supplementary file 1
List of primers used for genotyping, semi-quantitative reverse transcription PCR, real-time PCR primers and CNV analysis.
- https://doi.org/10.7554/eLife.12116.020
Download links
A two-part list of links to download the article, or parts of the article, in various formats.
Downloads (link to download the article as PDF)
Open citations (links to open the citations from this article in various online reference manager services)
Cite this article (links to download the citations from this article in formats compatible with various reference manager tools)
Hepatocyte Growth Factor-mediated satellite cells niche perturbation promotes development of distinct sarcoma subtypes
eLife 5:e12116.
https://doi.org/10.7554/eLife.12116


