A novel synaptic plasticity rule explains homeostasis of neuromuscular transmission
- Centre National de la Recherche Scientifique, FRE 3693, France
Figures
Figure 1 with 3 supplements
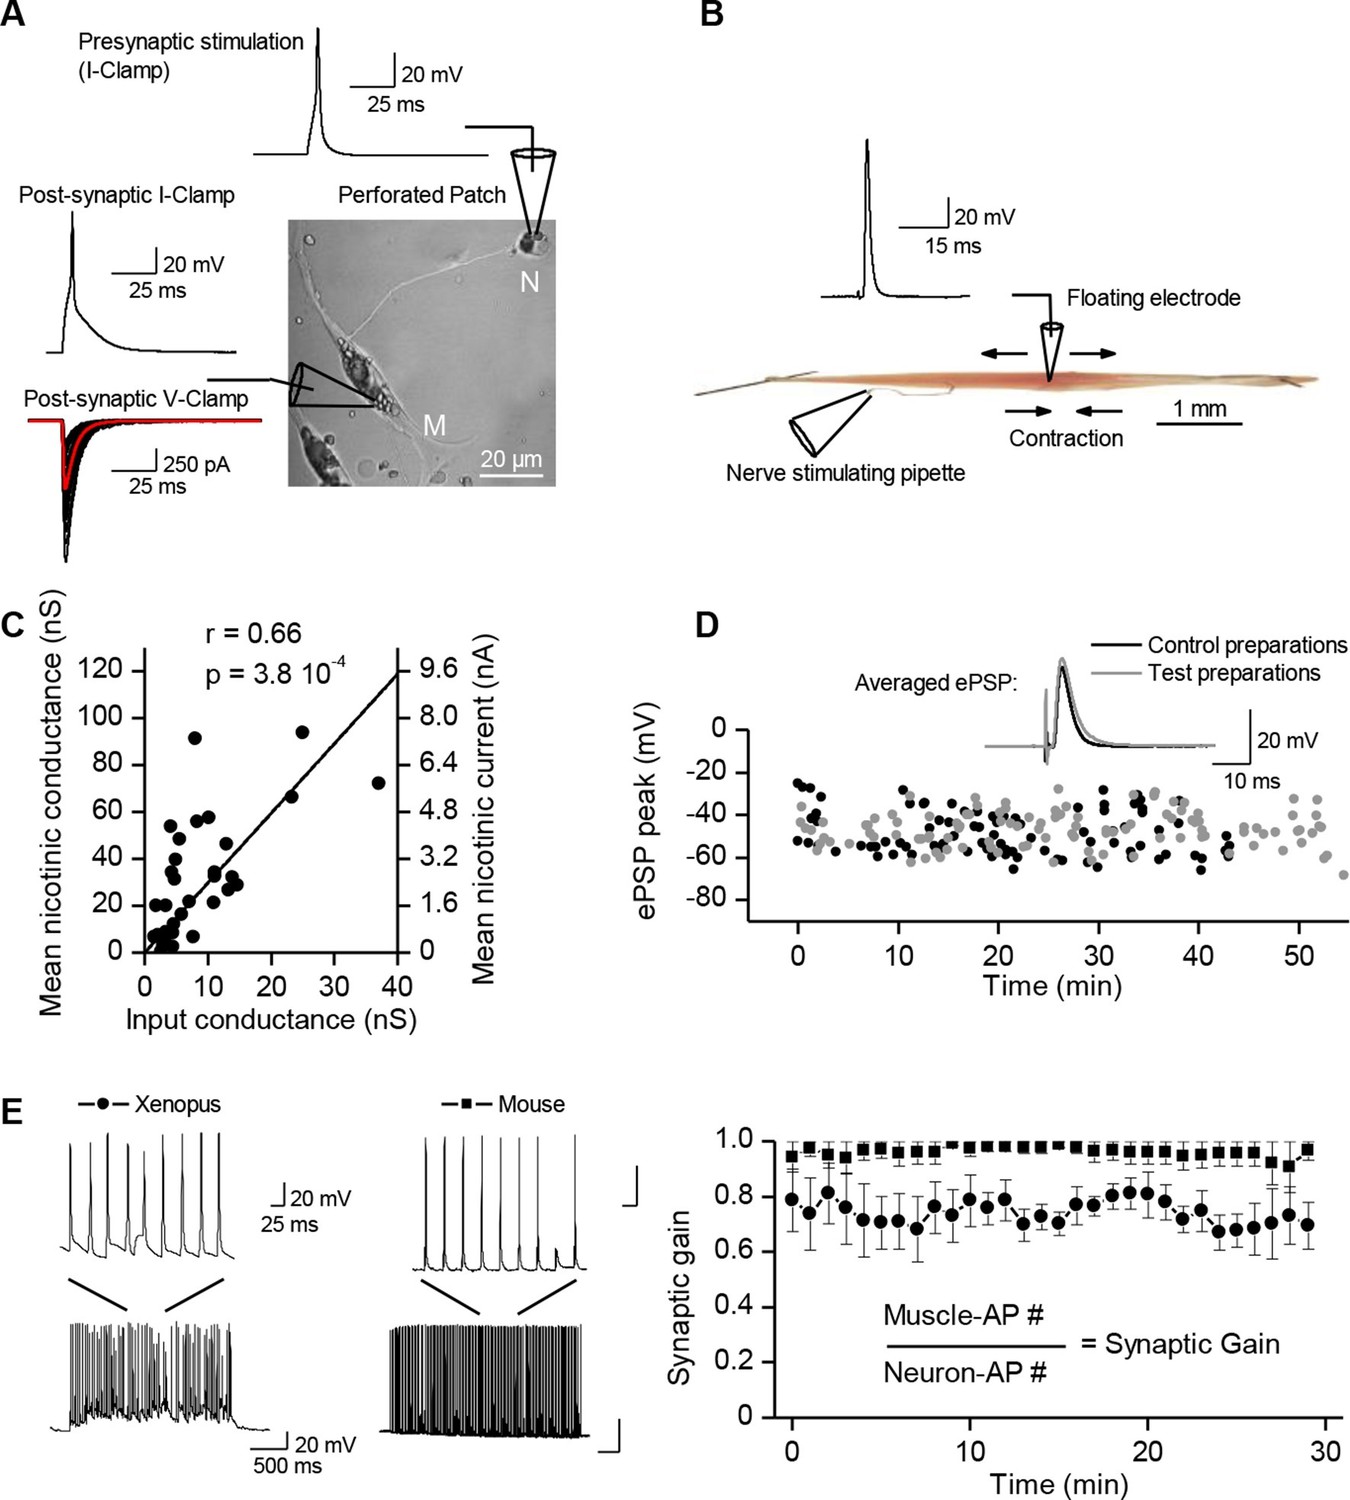
Synaptic transmission is homeostatically regulated.
(A) Perforated patch-clamp on Xenopus neuron (N) and muscle cell (M) in primary culture. Presynaptic APs were triggered with current steps. Postsynaptic APs were recorded under current-clamp and nicotinic synaptic currents under voltage-clamp (-80 mV). (B) Intracellular recording in soleus muscle fibers from an adult mouse using a floating sharp electrode (see Materials and Methods and Figure 1—figure supplement 1). (C) Nicotinic conductance calculated from averaged ePSCs (n = 30 ePSCs for each dot) in different Xenopus muscle cells as a function of their input conductance. The black line shows the linear regression. (D) In mice, membrane potential reached by the ePSP in individual FDB muscle fibers after treatment with µ-conotoxin GIIIB, in absence of burst stimulation of the nerve (black dots, n= 88 fibers, 2 muscles, 2 mice), and in test preparations (grey dots, n = 108 fibers, 2 muscles, 2 mice) for which the nerve was burst stimulated prior to conotoxin treatment (15 bursts in 10 min, each of 120 events at 30 Hz). (E) Mean synaptic gain at Xenopus synapses (dots, n = 5 synaptic connections) and in mouse neuromuscular junctions (squares, n = 4 muscle fibers from different mice) during chronic bursts of presynaptic stimulation (bursts of 80 to 120 pulses, 30 Hz for 30 min).
Figure 1—figure supplement 1
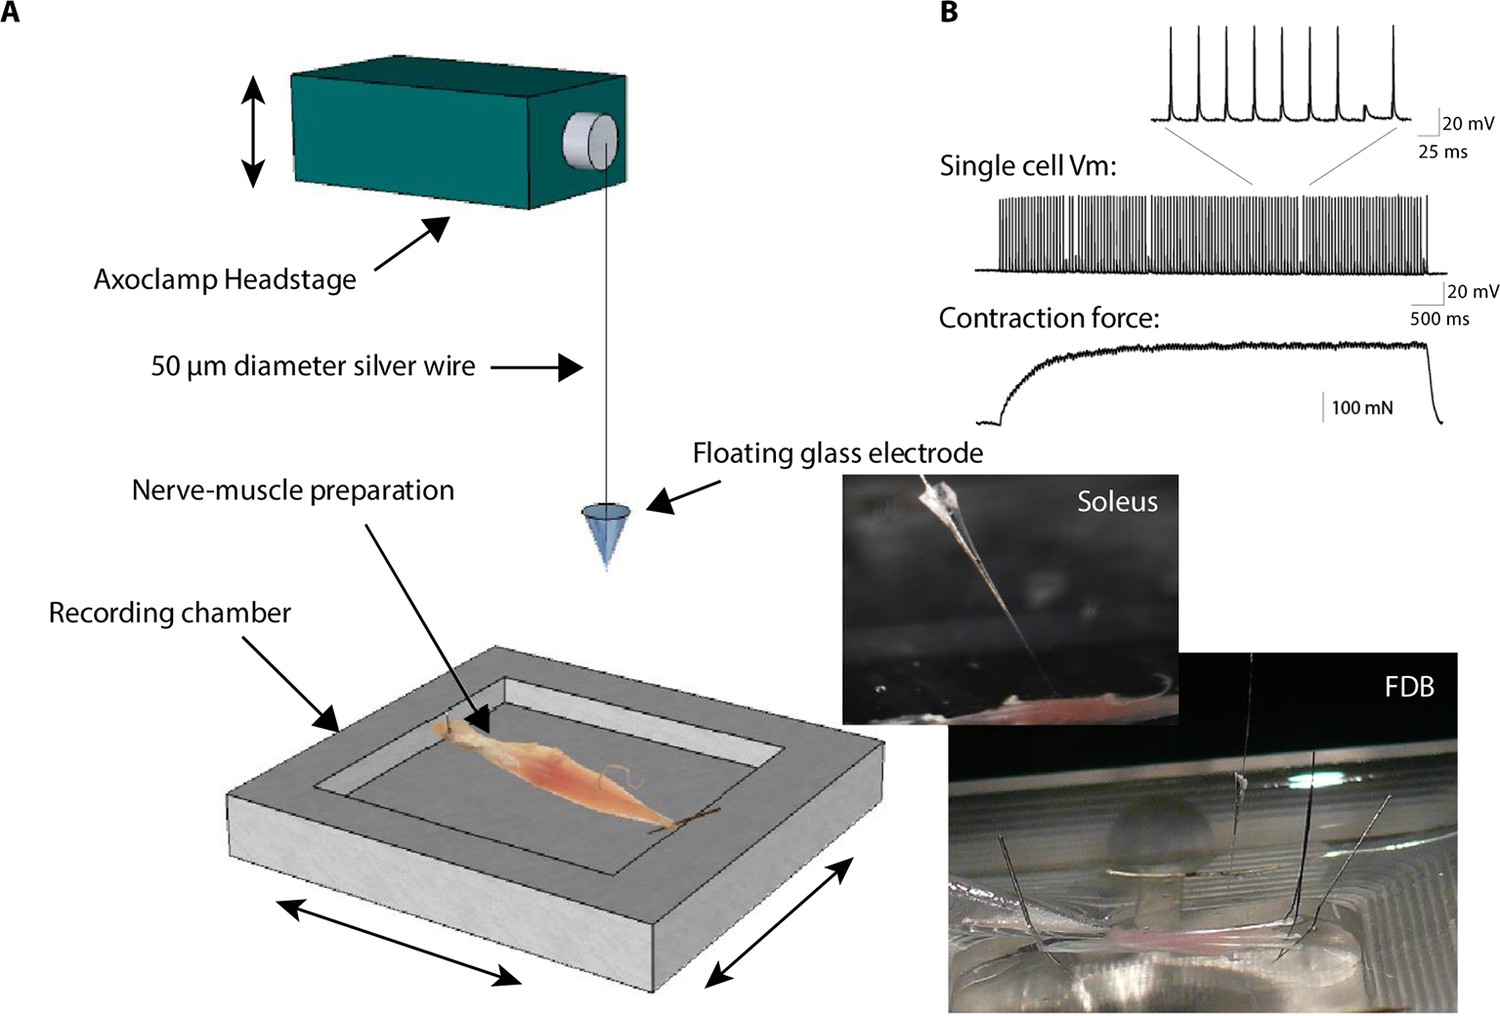
Floating electrode.
In conventional electrophysiology, an intracellular electrode made from pulled glass is rigidly fixed to an amplifier headstage and/or to the micromanipulator by a holder preventing free movements. To allow intracellular recordings in contracting mouse muscle, we cut off the tip of the pipette and used this as an electrode connected to the amplifier headstage by a loose, 5–10 cm length 50 µm diameter silver wire (see Materials and methods). The lower trace shows the force developed by the muscle during a train of nerve stimulations with a frequency close to the tetanus. The contraction force was measured with a FT03 force transducer from Grass Technologies (Astro-Med Inc., West Warwick) and expressed in Newton. The middle trace shows a single muscle cell recording of the membrane potential with the floating electrode technique. The upper trace shows a detail view of the ePSPs and action potentials.
Figure 1—figure supplement 2
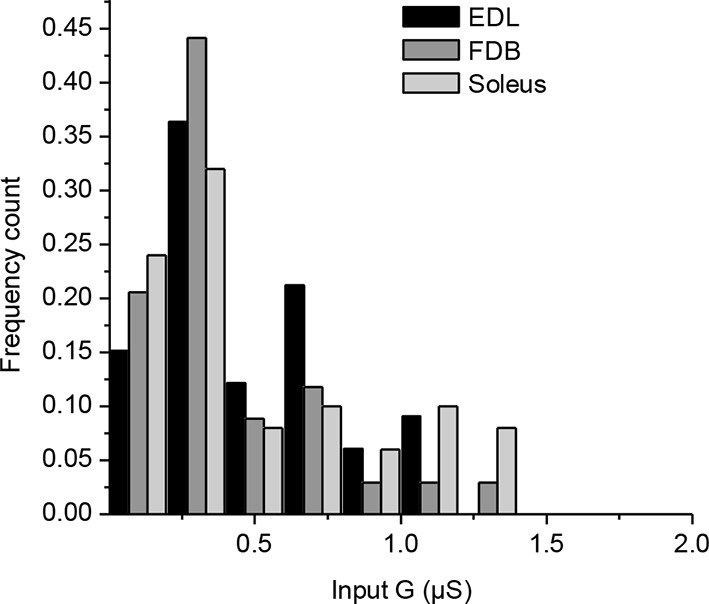
Mouse muscles fibers have a wide range of input conductances.
Input conductances (G) of muscle fibers were calculated from the depolarization induced by injection of a positive current and application of Ohm’s law. The histogram represents the normalized count distribution of the input conductances for 33 fibers in an Extensor Digitorum Longus muscle, for 34 fibers in a Flexor Digitorum Brevis muscle, and for 50 fibers in a Soleus muscle. Data were binned with a step increment of 0.2 µS.
Figure 1—figure supplement 3
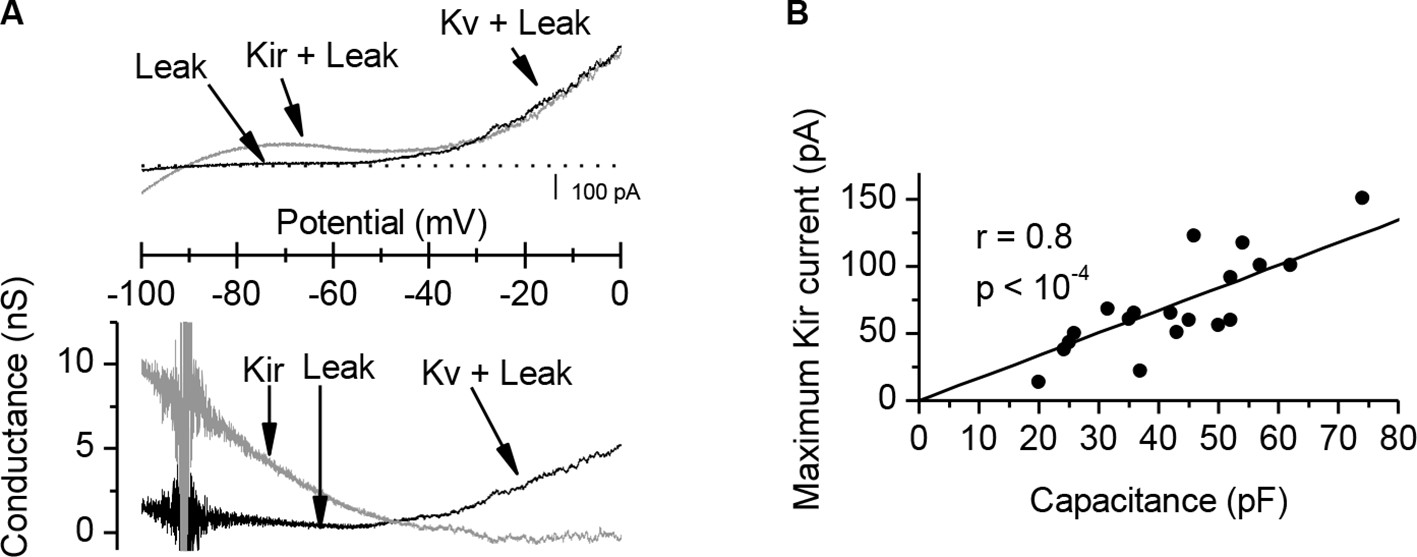
Characterization of the K+ conductances that determine the Xenopus muscle cell input conductance.
(A) A K+ inward rectifying (Kir) conductance dominates the input conductance of Xenopus muscle cells. The upper panel shows membrane currents recorded under voltage-clamp during ramp potentials (125 mV/s), in control conditions (grey trace) and after addition of external Ba2+ 300 µM (black trace). The Kir component, sensitive to external Ba2+, was obtained by the difference between the two traces. The lower panel shows the isolated Kir conductance (gray trace) and the remaining conductances in presence of Ba2+ (black trace), composed of a passive K+ leak conductance and of the voltage-activated K+ (Kv) conductances. The Kir conductance dominates the input conductance around the resting potential, decreases with depolarization and becomes null at the excitability threshold. (B) A linear correlation between the Kir current and the membrane capacitance (an estimation of the surface) of the cells reveals the strong homogeneity of the membrane conductance density in the cells culture, and emphasizes the wide range of input conductances and excitabilities found in muscle cells (i.e. an increase of surface with constant leak density implies an increase in the input conductance, and a decrease in excitability).
Figure 2 with 1 supplement
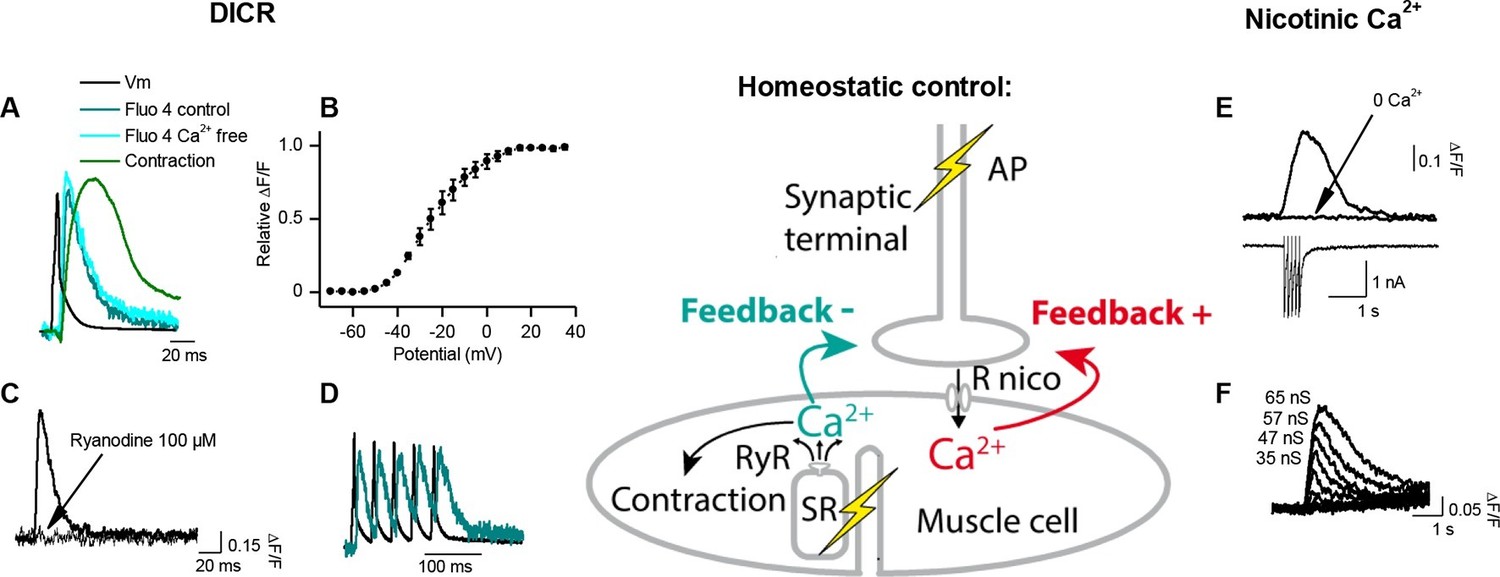
Calcium signaling in Xenopus muscle cell and synaptic homeostasis.
The middle scheme depicts our model of homeostatic control of the synaptic strength. The nicotinic Ca2+ influx elicits a positive retrograde feedback signal (red arrow) on the presynaptic neurotransmitter release. The positive feedback is balanced by a negative retrograde feedback signal (blue arrow) triggered by the muscle AP-induced DICR. (DICR = depolarization-induced calcium release, AP = action potential, RyR = ryanodine receptor, SR = sarcoplasmic reticulum, R nico = nicotinic receptors). (A) Independence of the DICR signal from external Ca2+. AP (black trace, induced with a brief postsynaptic current step), Ca2+ dye (Fluo4) relative fluorescence in standard external medium (dark blue trace) and in Ca2+ free medium (light blue trace), and qualitative measure of the cell contraction (green trace, see Materials and methods). (B) Voltage-dependence of the DICR signal. The Fluo4 fluorescence was measured at the steady-state of the Ca2+ signal during a classical voltage-step protocol from a holding potential of -80 mV and averaged (n = 3 cells). (C) Blockade of the DICR signal by loading the muscle cell with 100 µM ryanodine. (D) Representative example of the DICR signal (blue trace) during repetitive muscle APs (black trace). (E) Ca2+ build-up upon nicotinic receptor activation. Fluo4 signal (upper traces) in control and in Ca2+ free medium, during iontophoretic ACh applications (5 pulses) under postsynaptic voltage-clamp (-80 mV). The lower trace shows the nicotinic currents. (F) Dependence of the nicotinic Ca2+ build-up on the nicotinic conductance with increasing iontophoretic ACh applications at a constant membrane potential (holding potential –80 mV).
Figure 2—figure supplement 1
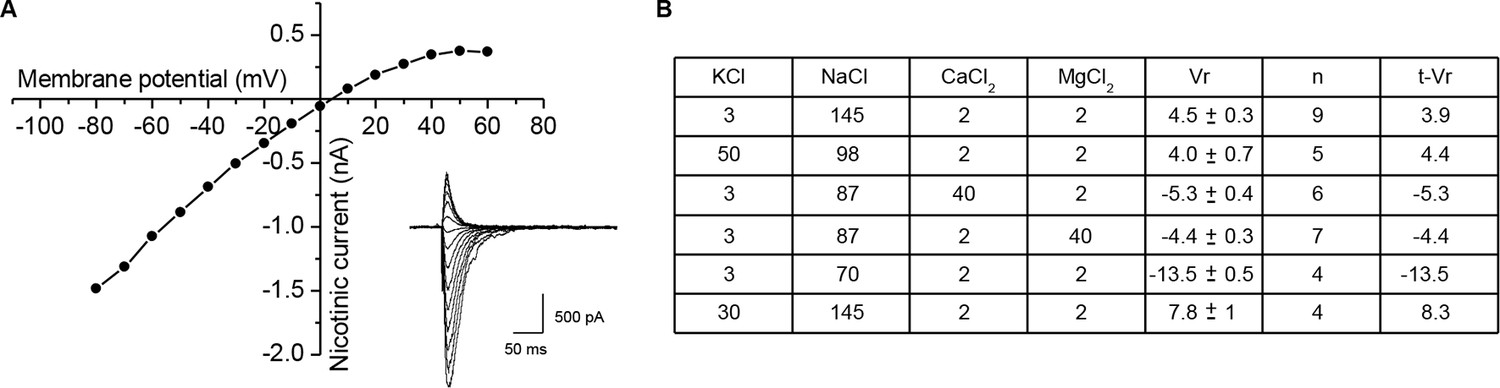
Ionic permeability of the Xenopus nicotinic receptor-channel.
To determine the ionic selectivity of the Xenopus nicotinic receptor in cultured cells, the reversal potential of the nicotinic current induced by ionophoretic acetylcholine application was measured under voltage-clamp in solutions of various ionic compositions, with an intra-pipette medium of the following composition (in mM): 110 KCl, 3 NaCl, 2 MgCl2, 0.5 EGTA and 10 HEPES (pH 7.2). (A) Current-voltage relationship of the nicotinic current induced by ionophoretic application of acetylcholine, in a classical physiological medium. Inset shows the current traces recorded at the different holding potentials. (B) Table summarizing the external media compositions and the corresponding reversal potentials (Vr). Concentrations are expressed in mM, and the mean ± SEM reversal potentials in mV. Fitting the measured reversal potentials to the GHK voltage equation (see Materials and methods) gave: PK/PNa = 1.07, PCa/PNa = 0.23, and PMg/PNa = 0.31, used to calculate the theoretical reversal potentials t-Vr.
Figure 3 with 2 supplements
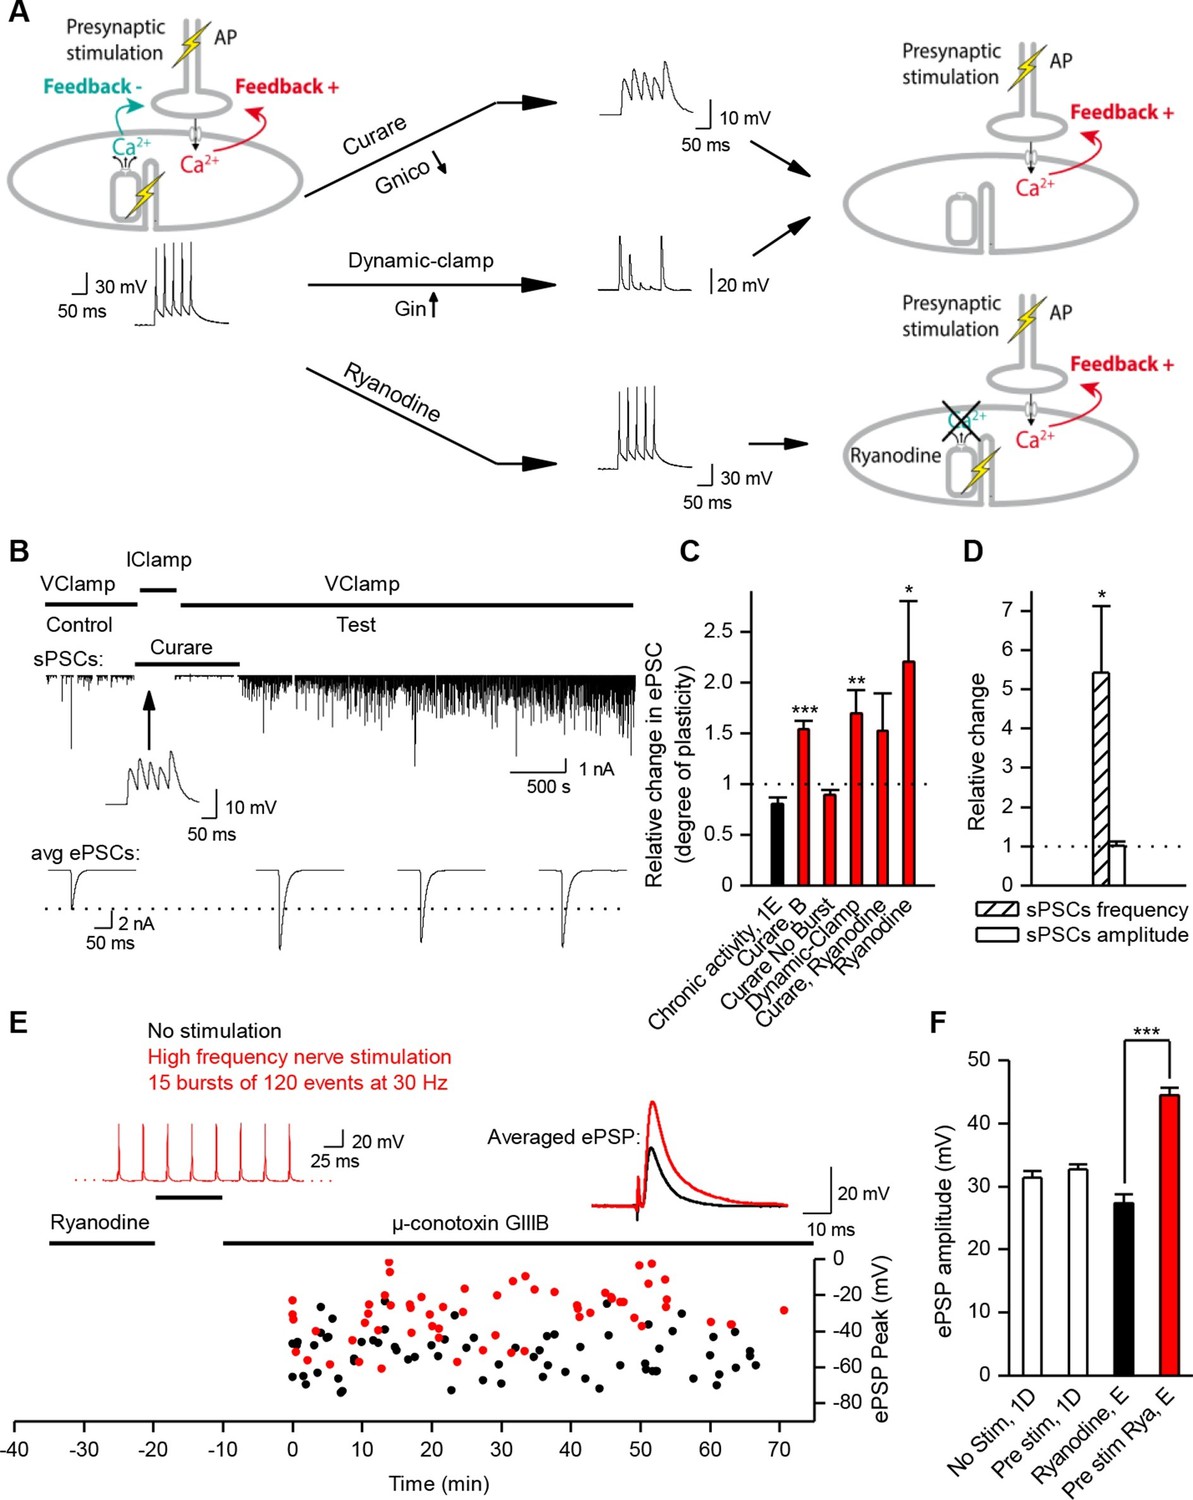
Nicotinic receptor activity induces a positive feedback on ACh release.
(A) In order to obtain the nicotinic calcium signal in absence of DICR in Xenopus, synaptic events were transiently kept subthreshold either with curare (decreased nicotinic conductance, Gnico) or by dynamic-clamp injection of gK+ leaks (increased input conductance, Gin), or left suprathreshold while DICR was blocked by ryanodine. (B) Effect of presynaptic burst stimulation and curare on spontaneous (upper trace, sPSC) and evoked synaptic currents (ePSC). ePSCs recorded under voltage-clamp were evoked at low rate (0.03 Hz) and averaged by 30–40 events (lower traces). During conditioning presynaptic stimulations (3 bursts of 5 events at 30 Hz), the postsynaptic potential was released from clamp and curare transiently applied (middle trace). Upper trace: for clarity, ePSCs were removed from the continuous trace in order to display the sPSCs only. (C), In Xenopus, mean ePSC relative change 30 min after control chronic bursting activity ('chronic activity', n = 5, illustrated in Figure 1E), 45 min after subthreshold synaptic activity ('Curare', n = 9, illustrated in B; 'Dynamic-clamp', n = 5, illustrated in Figure 3—figure supplement 2A), transient curare application in absence of stimulation ('curare No Burst', n = 3), sub- ('curare-ryanodine', n = 3) and suprathreshold synaptic activity ('ryanodine', n = 6, illustrated in Figure 3— figure supplement 3) in muscle cells preloaded with ryanodine. (D), Relative change in amplitude and frequency of sPSCs after potentiation in Xenopus. (E), In FDB mice muscles, voltage reached by ePSPs in ryanodine treated (black dots, n = 60 fibers, 2 mice), and in ryanodine treated and burst stimulated preparations (red dots, n = 70 fibers, 2 mice). (F) Mean ePSP amplitude in control ('no stim') and high frequency nerve stimulation ('Pre stim') shown in Figure 1D, in non-stimulated ('Ryanodine') and in high frequency stimulated ('Pre stim Rya') ryanodine treated preparations shown in E. *, p<0.05; **, p<0.01; ***, p<0.001; t-test.
Figure 3—figure supplement 1
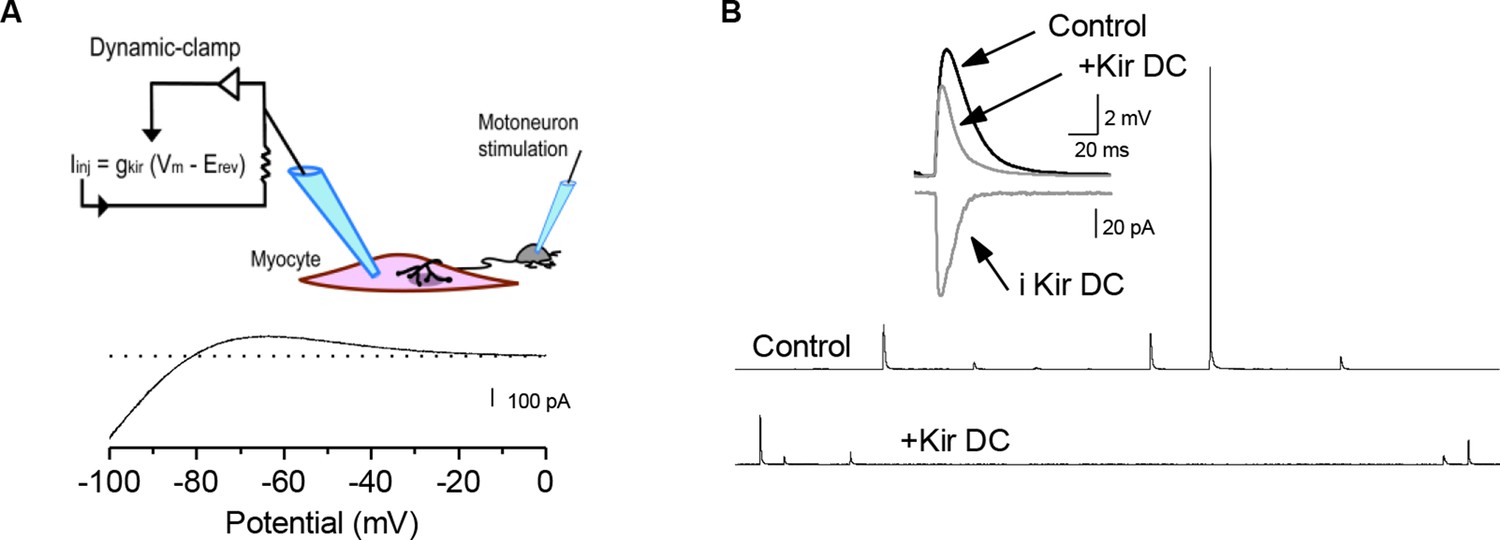
Decreasing muscle cell excitability by injection of artificial conductances.
(A) We used the K+ currents data of Figure 1—figure supplement 3 to establish and inject models of leak conductances into the muscle cell with the dynamic-clamp technique (see Materials and methods). Trace is a negative of the current output of the Kir conductance model when a ramp potential (125 mV/s) was used as input. (B) Time course of sPSPs in the presence of a simulated Kir conductance with dynamic-clamp (Kir DC). Artificial increase of the postsynaptic input conductance decreased the averaged sPSP amplitude.
Figure 3—figure supplement 2
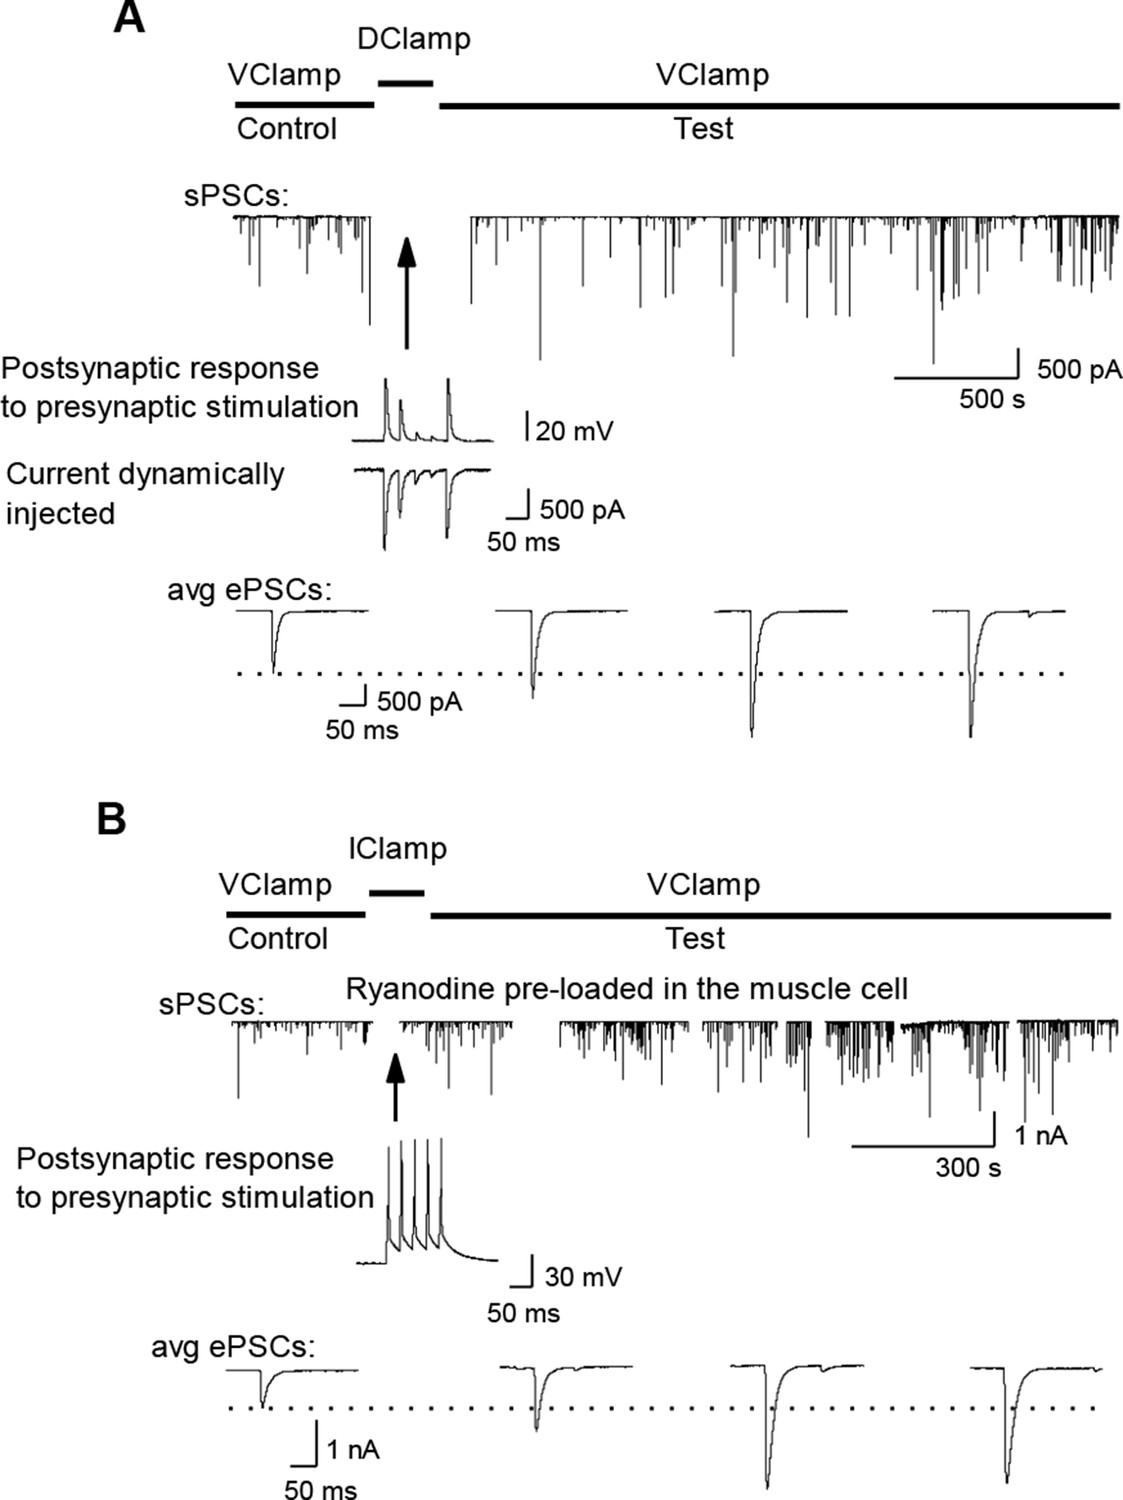
LTP induction with dynamic-clamp or postsynaptic ryanodine.
(A) Potentiating effect of maintaining synaptic efficacy subthreshold by dynamic-clamp injection of gK+ leak (see Materials and methods). Middle trace: subthreshold nicotinic ePSPs in presence of the dynamic-clamp current (trace below). (B). Potentiating effect of intact synaptic activity generating muscle cell AP firing with DICR blocked (100 µM ryanodine). The muscle cell was pre-loaded with ryanodine using the classical whole-cell configuration of the patch-clamp technique. After removing the patch pipette, a perforated patch was performed for electrophysiological recordings.
Figure 4 with 2 supplements
Muscle DICR induces a negative feedback on ACh release.
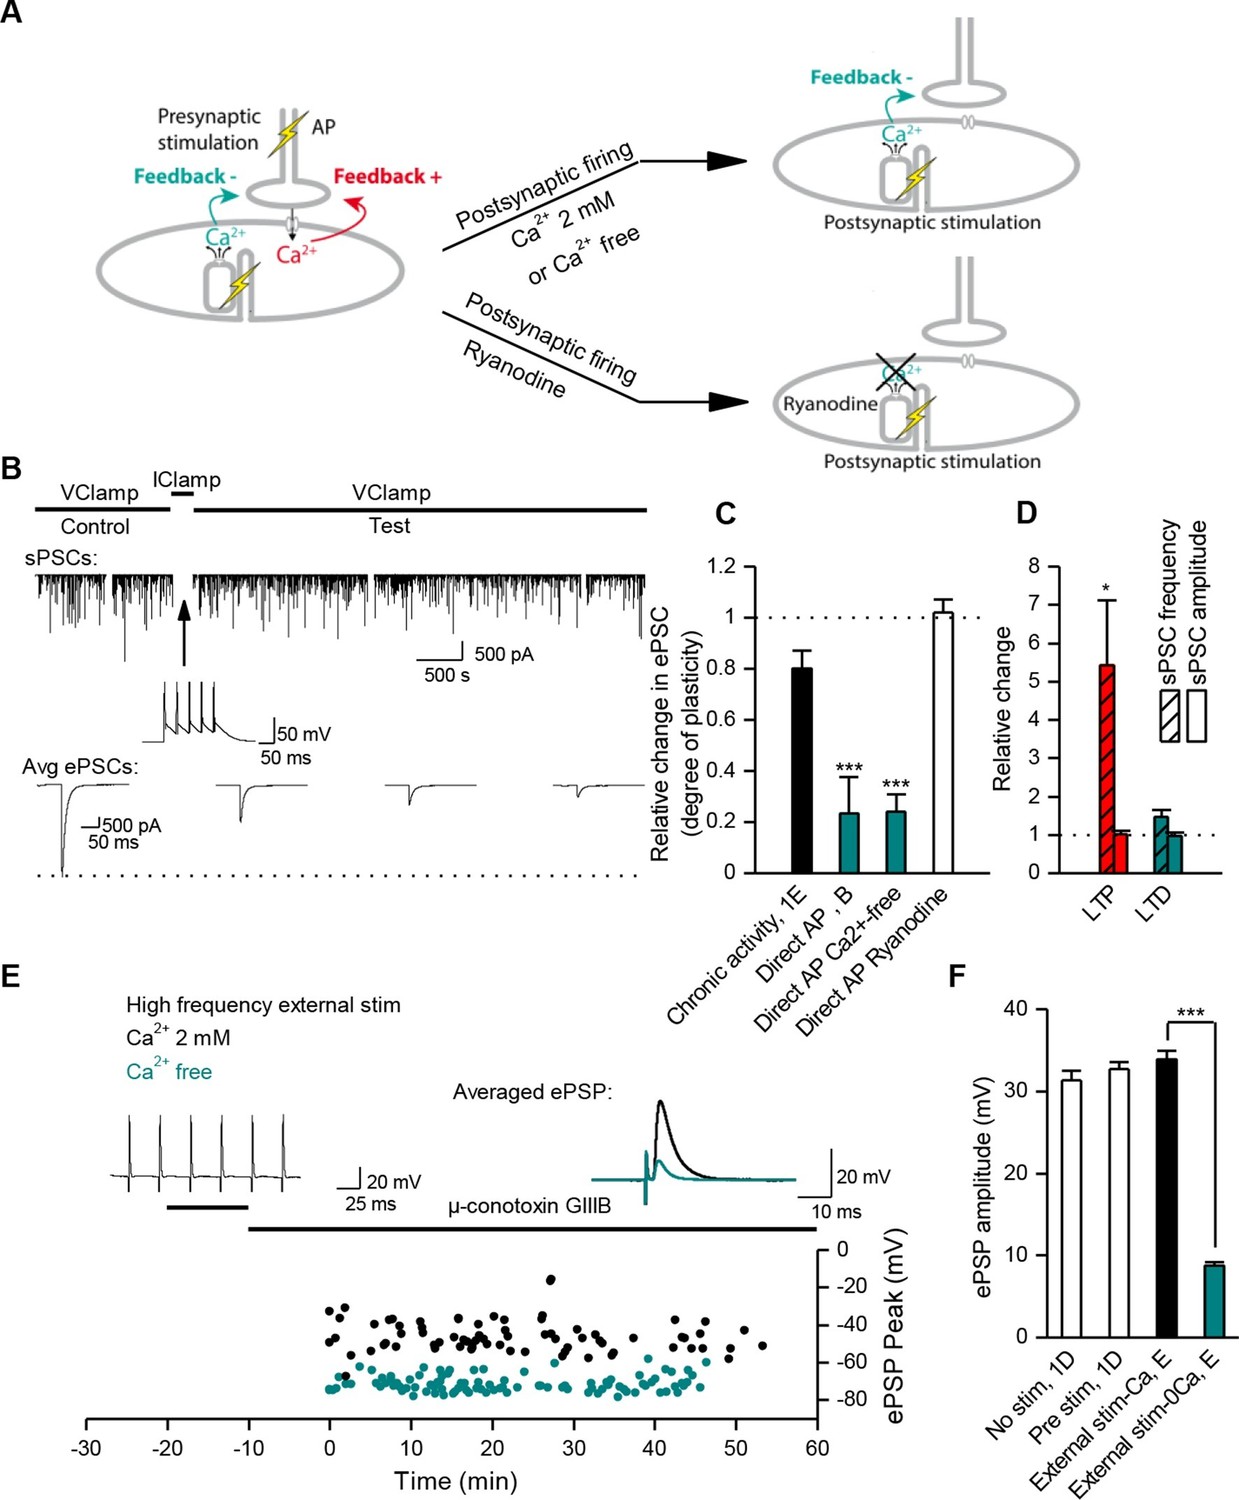
(A) In order to trigger the DICR signal in absence of nicotinic Ca2+ influx in Xenopus, postsynaptic APs were directly induced in the muscle cell with brief current steps, without presynaptic stimulation, in presence or absence of external Ca2+ (upper right scheme) and with ryanodine that blocks the DICR (bottom right scheme). (B) Effect of selective postsynaptic firing on synaptic currents. Same layout as in Figure 3B. The middle trace shows the muscle APs firing in response to positive current steps injection. (C) In Xenopus, mean ePSC relative change 45 min after control chronic bursting synaptic activity ('chronic activity', n = 5, see 1E), direct triggering of the muscle APs shown in B ('Direct AP', n = 5), APs triggered in a Ca2+-free medium ('Direct AP Ca2+-free', n = 6, illustrated in Figure 4—figure supplement 1), APs triggered in muscle cells loaded with ryanodine ('Direct AP Ryanodine', n = 3, illustrated in Figure 4—figure supplement 2). (D), Relative change in sPSCs amplitude and frequency in Xenopus after potentiation (red) or depression (green). (E), In FDB mouse muscles, voltage reached by ePSPs in externally stimulated preparations (15 bursts of 120 events at 30 Hz, 10 min) in presence (black dots, n = 75 fibers, 2 mice) and in absence of external Ca2+ (green dots, n = 120 fibers, 2 mice). (F), Mean ePSP amplitude in control ('no stim') and high frequency nerve stimulation ('Pre stim') shown in Figure 1D, in externally stimulated preparations shown in E in presence ('External stim-Ca2+') and absence of external Ca2+ ('External stim-0Ca2+'). ***, p<0.001.
Figure 4—figure supplement 1
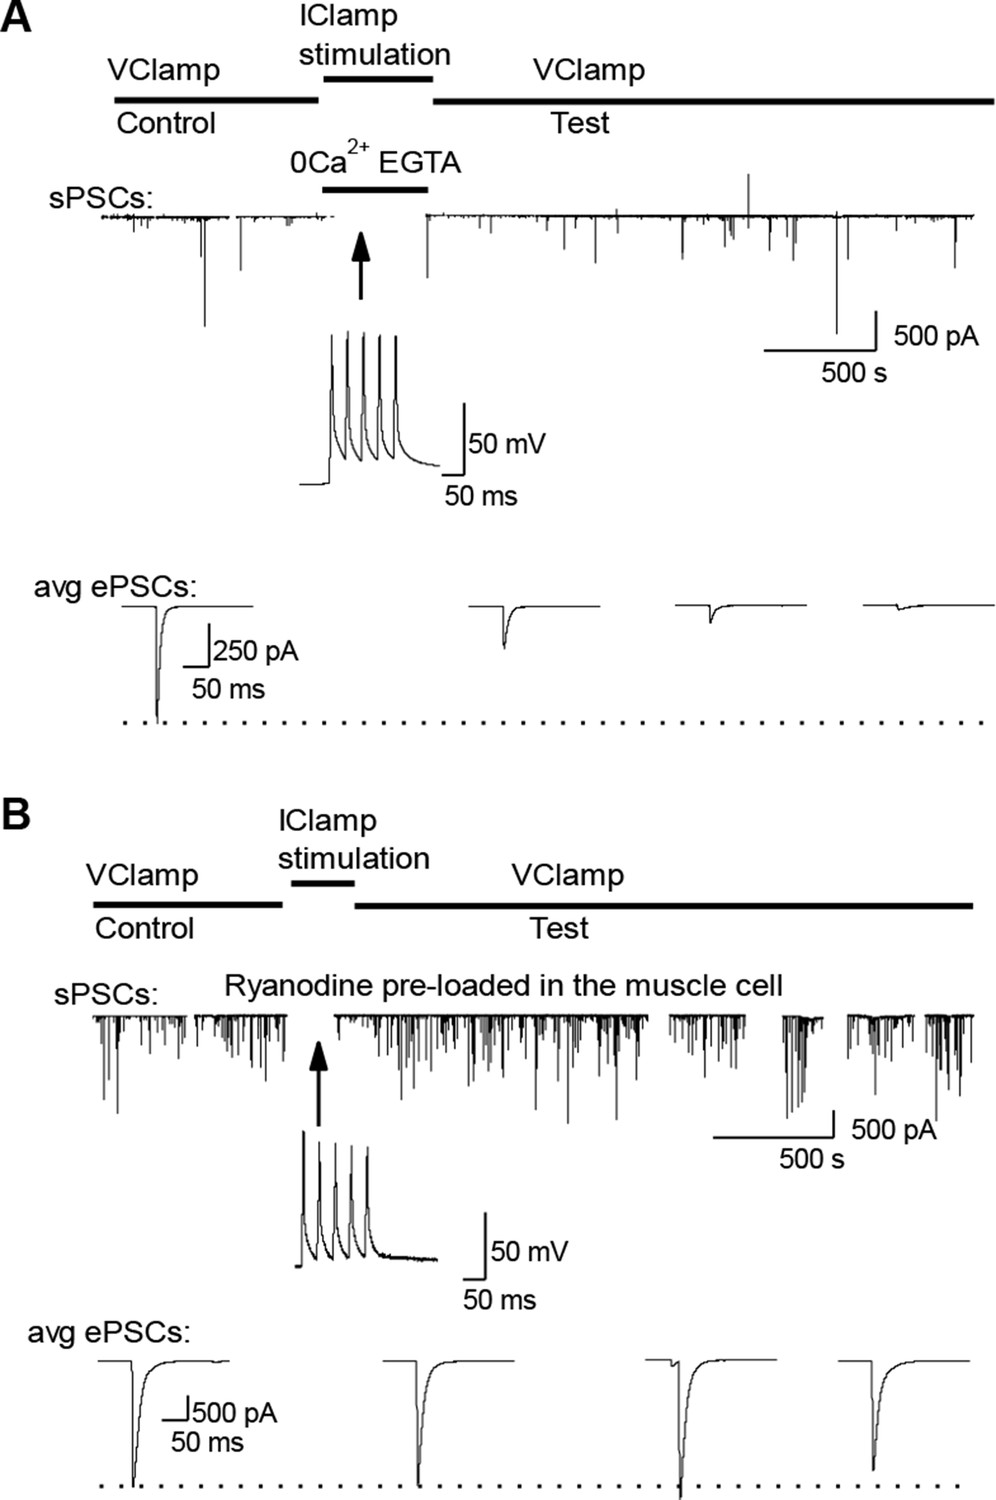
External calcium-independent LTD and blockade by postsynaptic ryanodine.
(A) LTD induction in a Ca2+ free medium. For the conditioning bursts, postsynaptic APs were triggered by postsynaptic injection of positive current steps, without presynaptic stimulation. (B). ePSC depression via muscle firing is prevented when DICR is blocked with 100 µM ryanodine pre-loaded into the muscle cell.
Figure 4—figure supplement 2
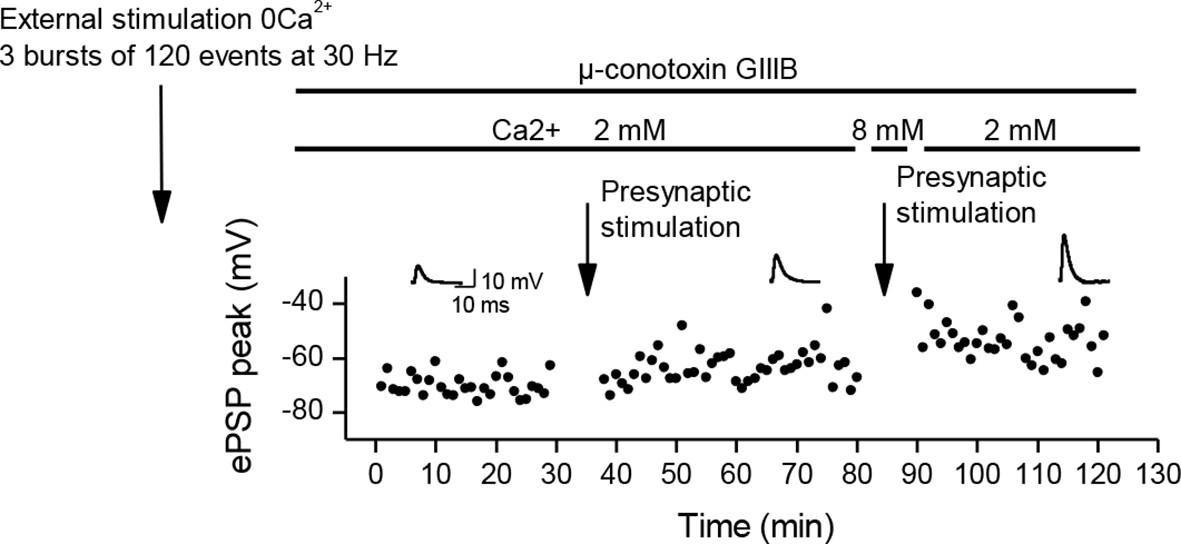
Recovery from LTD.
In adult mice preparations, external stimulation in a Ca2+ free medium is a situation comparable to direct stimulation of the Xenopus muscle cells, and induces a depression of the ePSPs. Here, after a depression induced by 3 bursts of external stimulations in a Ca2+ free medium, subsequent bursts of nerve-stimulations (arrow) induced a partial recovery of the ePSPs amplitude. We transiently increased further the external Ca2+ concentration to 8mM (which increases the nicotinic Ca2+ influx), and this resulted in an increase of the potentiating effect of the bursting nerve stimulations (arrow).
Figure 5
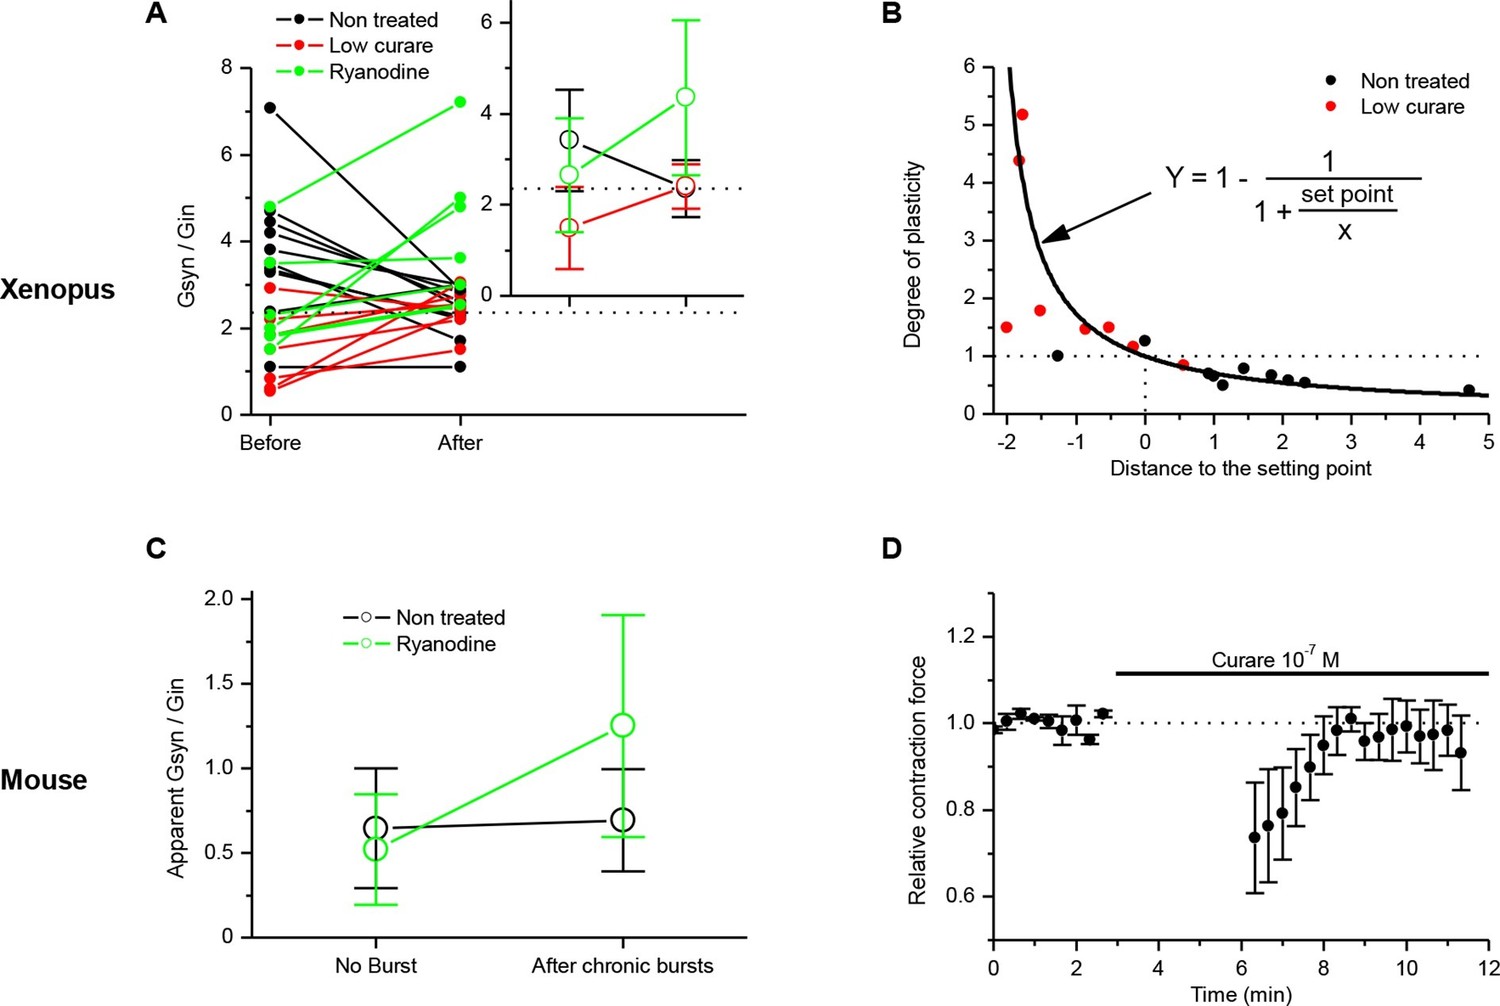
Homeostatic control of the synaptic efficacy.
(A) In Xenopus, ratios between averaged synaptic conductance ('Gsyn', calculated from 30–40 ePSCs) and muscle cell input conductance ('Gin') before and after 20–30 min of chronic burst stimulation of the motor neuron (burst of 20–60 events at a 20–30 Hz frequency, every 30–40 s) under postsynaptic current-clamp in non-treated (black dots) and low curare-treated (red dots) synapses. Green dots represent the Gsyn/Gin ratio before and after 1–3 bursts of 5 presynaptic stimulations at 30 Hz (green dots) in ryanodine loaded muscle cells (same data than in Figure 3C, ryanodine bar). Inset shows the mean ± standard deviation of the Gsyn/Gin ratios in the three conditions. The dotted lines show the averaged Gsyn/Gin ratio after chronic activity in non-treated synapses. (B) Degree of plasticity (relative change in Gsyn/Gin ratio) shown in A expressed as a function of the difference between the initial individual Gsyn/Gin ratio and the averaged ratio after chronic burst activity ('Distance to the set point'), in non-treated (black dots) and curare-treated (red dots) synapses. The solid line shows the theoretical homeostatic relationship between plasticity and the distance to a set point of 2.36, calculated as the mean Gsyn/Gin ratio after chronic activity in non-treated synapses. (C) Apparent averaged Gsyn/Gin ratios calculated in mouse FDB muscles from the data of Figure 3E, in non-stimulated and non-treated synapses (no burst, black dot), in burst-stimulated and non-treated synapses (after chronic bursts, black dot), in non-stimulated and ryanodine-treated synapses (no burst, green dot) and in burst-stimulated and ryanodine-treated synapses (after chronic bursts, green dot). Dots represent the mean ± Standard Deviation. (D) Relative change of contraction force during 2s-30Hz bursts of nerve stimulations in mouse soleus muscles (n=4), before and during exposure to a low dose (0.1 µM) of curare.
Author response image 1
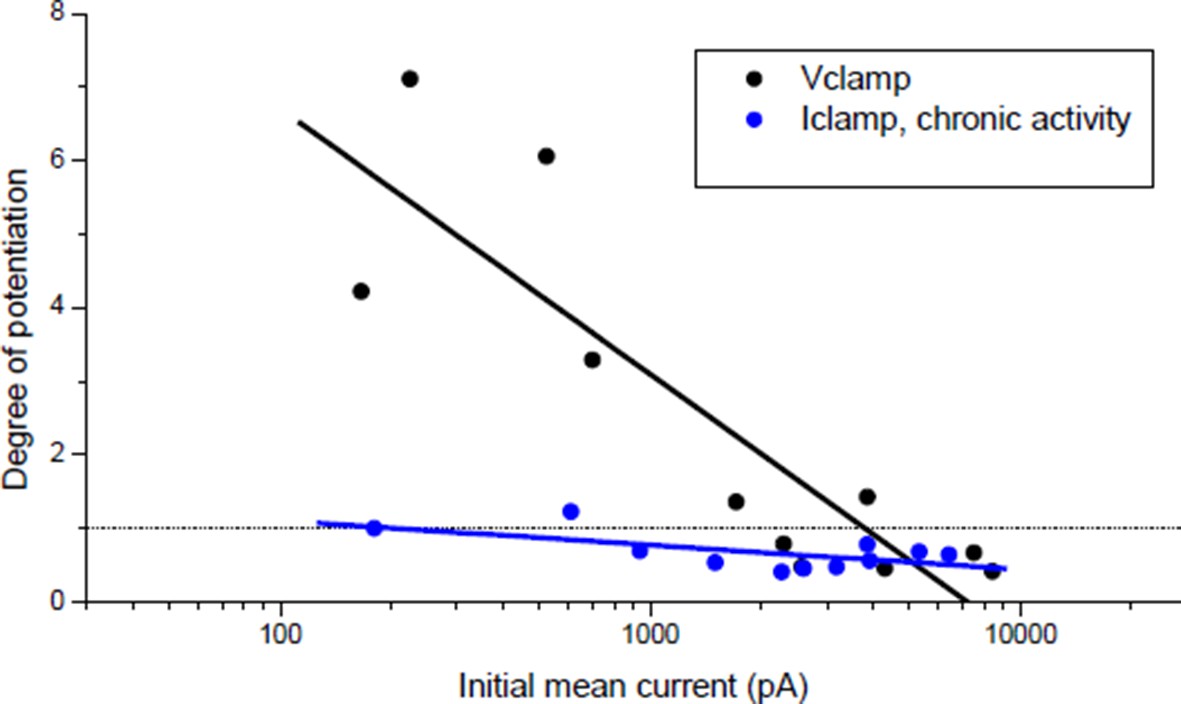
Effect of burst stimulation of the motor neuron under postsynaptic voltage- and current-clamp.
Black dots: same protocol as Wan & Poo 1999 (Figure 1A (ii)). Blue dots: same data as Author response image 4 (black dots), expressed as a function of the initial averaged ePSCs amplitude.
Author response image 2
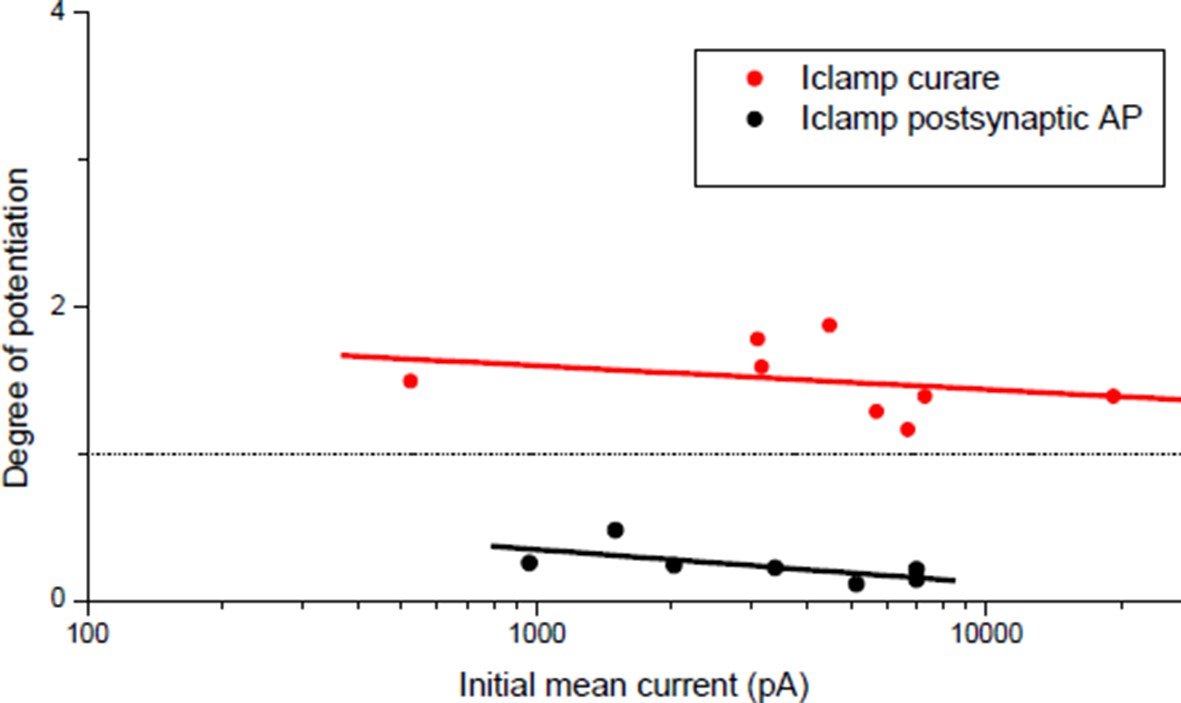
Degree of plasticity (relative change in ePSC amplitude) as a function of the initial ePSC.
Potentiation obtained with a burst of subthreshold ePSPs (red dots) and depression obtained with direct triggering of the muscle APs (black dots). Same data than Figure 3C ('curare' bar) and Figure 4C ('direct AP' bar) expressed as a function of the initial averaged ePSCs amplitude.
Author response image 3
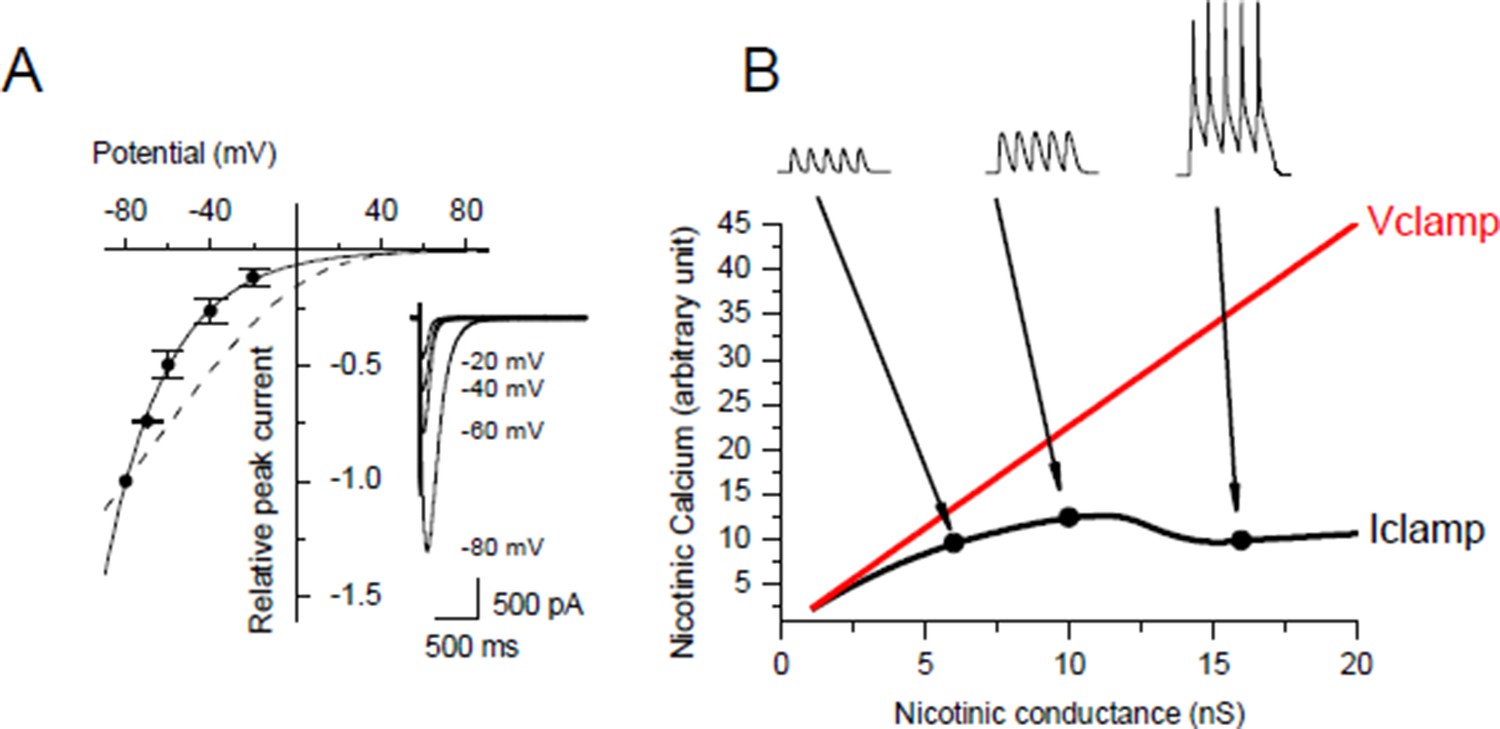
Voltage-dependency of the nicotinic calcium.
(A) Nicotinic I/V relationship with iohophoretic ACh applications in media for which the Ca2+ ion only carries the nicotinic current. Na+ and Mg2+ were removed, K+ was adjusted for each holding potential in order to remain at the equilibrium, and Lysine hydrochloride was inversely adjusted to KCl in order to hold both the osmotic pressure and the ionophoretic ACh application. Dashed line shows the rectification predicted with the GHK free diffusion model. (B) Example for a given cell surface of simulation of the nicotinic calcium in V- and I-clamp. The model comprised a synapse, a linear passive K+ leak, an inward rectifying K+ leak, two voltage-gated K+ conductances and a voltage-gated Na+ conductance.
Author response image 4

Homeostatic control of the synaptic efficacy.
(A) In Xenopus, ratios between averaged synaptic conductance ('Gsyn', calculated from 30–40 ePSCs) and muscle cell input conductance ('Gin') before and after 20-30 min of chronic burst stimulation of the motor neuron (burst of 20–60 events at a 20–30 Hz frequency, every 30–40 s) under postsynaptic current-clamp in non-treated (black dots) and low curare-treated (red dots) synapses. Green dots represent the Gsyn/Gin ratio before and after 1–3 bursts of 5 presynaptic stimulations at 30 Hz in ryanodine loaded muscle cells (same data than in Figure 3C, ryanodine bar). Inset show the mean ± standard deviation of the Gsyn/Gin ratios in the three conditions. The dotted lines show the mean Gsyn/Gin ratio after chronic activity in non-treated synapses. (B) Degree of plasticity shown in A expressed as a function of the difference between the initial individual Gsyn/Gin ratio and the mean ratio after chronic burst activity ('Distance to the set point'), in non-treated (black dots) and curare-treated (red dots) synapses. The solid line shows the theoretical relationship between plasticity and the distance to a set point of 2.36, calculated as the mean Gsyn/Gin ratio after chronic activity in non-treated synapses.
Author response image 5

Plasticity in mouse.
(A) Apparent averaged Gsyn/Gin ratios calculated in mouse FDB muscles from the data of Figure 3E with equation X, in non-stimulated and non-treated synapses (no burst, black dot), in burst-stimulated and non-treated synapses (after chronic bursts, black dot), in non-stimulated and ryanodine-treated synapses (no burst, green dot) and in burst-stimulated and ryanodine-treated synapses (after chronic bursts, green dot). Dots represent the mean ± Standard Deviation. (B) Relative change of contraction force during 2s-30Hz bursts of nerve stimulations in mouse soleus muscles (n=4), before and during exposure of a low dose (0.1 µM) of curare.
Author response image 6
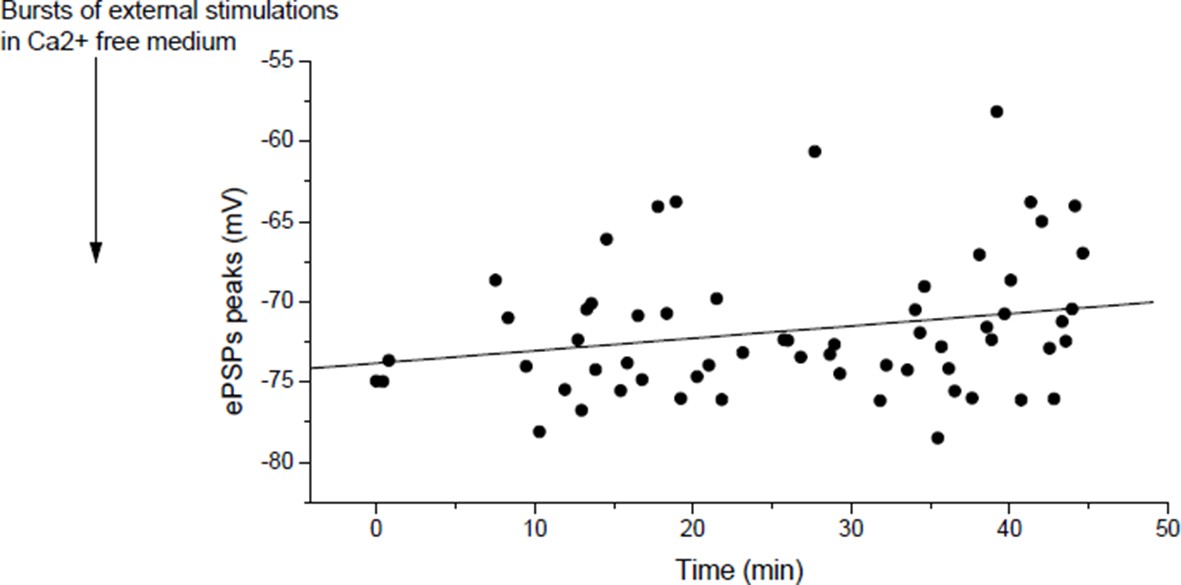
In mouse, slow potentiation after depression.
ePSPs peak in individual FDB cells after depression induced by bursts of external stimulations in a Ca2+ free medium.
Author response image 7
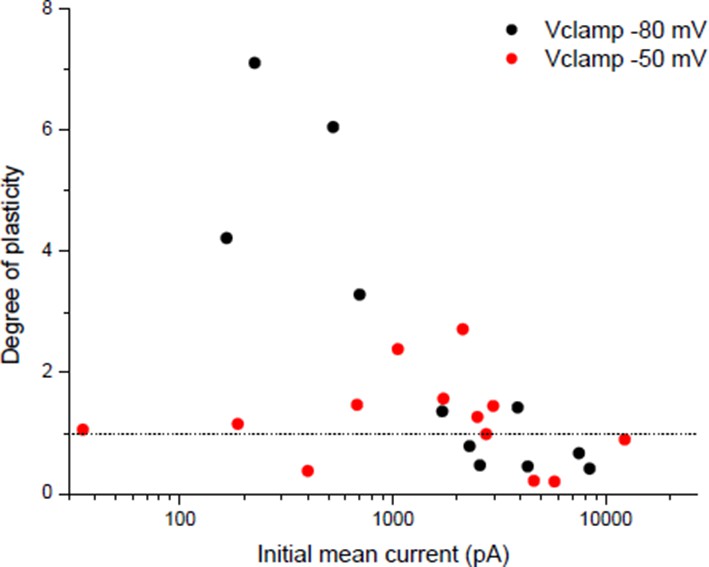
Dependency of plasticity under postsynaptic Vclamp on the holding value during the conditioning burst.
Same protocol than Wan & Poo 1999 (Figure 1A (ii)) with different holding potentials during the conditioning burst.
Download links
A two-part list of links to download the article, or parts of the article, in various formats.
Downloads (link to download the article as PDF)
Open citations (links to open the citations from this article in various online reference manager services)
Cite this article (links to download the citations from this article in formats compatible with various reference manager tools)
A novel synaptic plasticity rule explains homeostasis of neuromuscular transmission
eLife 5:e12190.
https://doi.org/10.7554/eLife.12190


