Targeted, homology-driven gene insertion in stem cells by ZFN-loaded ‘all-in-one’ lentiviral vectors
- Aarhus University, Denmark
- Technical University of Denmark, Denmark
- Beijing Genomics Institute, China
Figures
Figure 1 with 1 supplement
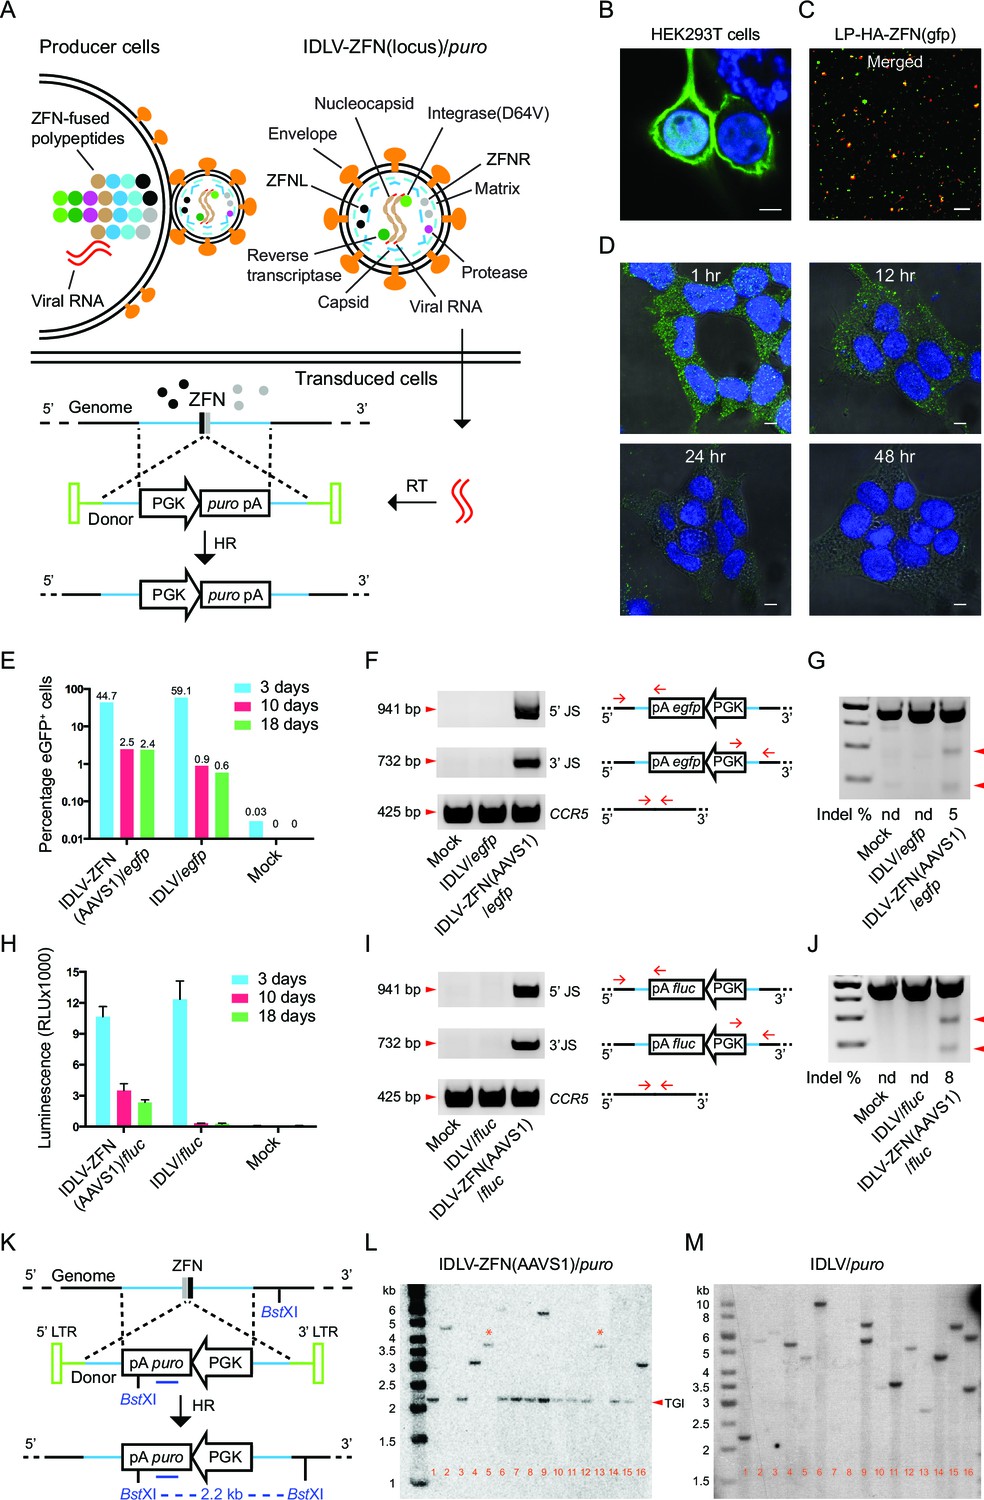
Proof-of-efficacy studies and characterization of ZFN-loaded IDLVs carrying a transgene flanked by homology arms facilitating insertion by homologous recombination.
(A) Schematic illustration of the production, transduction and integration of IDLVs carrying ZFNs and transgene. Enrichment of ZFN-fused viral polypeptides and donor-carried viral RNAs at the cell membrane leads to assembly of ZFN-containing virions. During virus maturation, the polypeptides are cleaved into enzymatic and structural proteins by HIV protease. In the transduced cells, the viral RNAs are reverse transcribed to DNA that serves as donor for repair of ZFN-induced DSB by HR, leading to site-specific insertion of a gene expression cassette (here containing the puro gene). RT, reverse transcription; HR, homologous recombination. (B–D) Immunostaining and confocal microscopy of producer cells, virions, and transduced cells. Green, HA-tagged ZFN-GagPol or ZFN; blue, nuclei; red, p24; scale bar indicates 5 μm. (B) HEK293T cells co-transfected by pMD.2G, pHA-ZFNL(gfp)-PH-gagpol-D64V and pHA-ZFNR(gfp)-PH-gagpol-D64V. (C) Incorporation of ZFNs into lentiviral particles was confirmed by co-localization of HA-ZFNs and p24 (see also Figure 1—figure supplement 1B). (D) Recording of the ZFN lifespan in HEK293 cells treated with LP-HA-ZFN(gfp) by immunostaining at different time points after treatment. (E–G) TGI by IDLV-ZFN(AAVS1)/egfp in HEK293T cells. (E) IDLV-ZFN(AAVS1)/egfp transduction resulted in higher percentage of eGFP+ cells relative to the IDLV/egfp counterpart after 10 and 18 days. (F) PCR analyses of TGI at the AAVS1 locus. Illustration shows primer designs with one primer matching inside the insert and one in the flanking region allowing amplification of 5’ and 3’ junction sites (5’ and 3’ JS). Amplification of the CCR5 locus included as a control. (G) Rate of imprecise gene repair by NHEJ in target cells. (H-J) TGI by IDLV-ZFN(AAVS1)/fluc in HEK293T cells. (H) Higher levels of Fluc expression in IDLV-ZFN(AAVS1)/fluc-treated HEK293T cells relative to IDLV/fluc-treated cells 10 and 18 days after transduction. (I) PCR analyses of TGI at the AAVS1 locus by IDLV-ZFN(AAVS1)/fluc. (J) Rates of imprecise NHEJ in target cells induced by IDLV-ZFN(AAVS1)/fluc. (K) Schematic representation of Southern blot for analysis of TGI at AAVS1 locus using IDLV-ZFN(AAVS1)/puro. The probe used is indicated by the dark blue line; cleavage site for the used restriction enzyme (BstXI) is also indicated. (L–M) Southern blot analyses of puromycin-resistant HEK293T clones resulting from treatment with IDLV-ZFN(AAVS1)/puro (L) and IDLV/puro (M). Fragments indicated with * are results of NHEJ leading to imprecise transgene insertion in the AAVS1 locus.
Figure 1—figure supplement 1
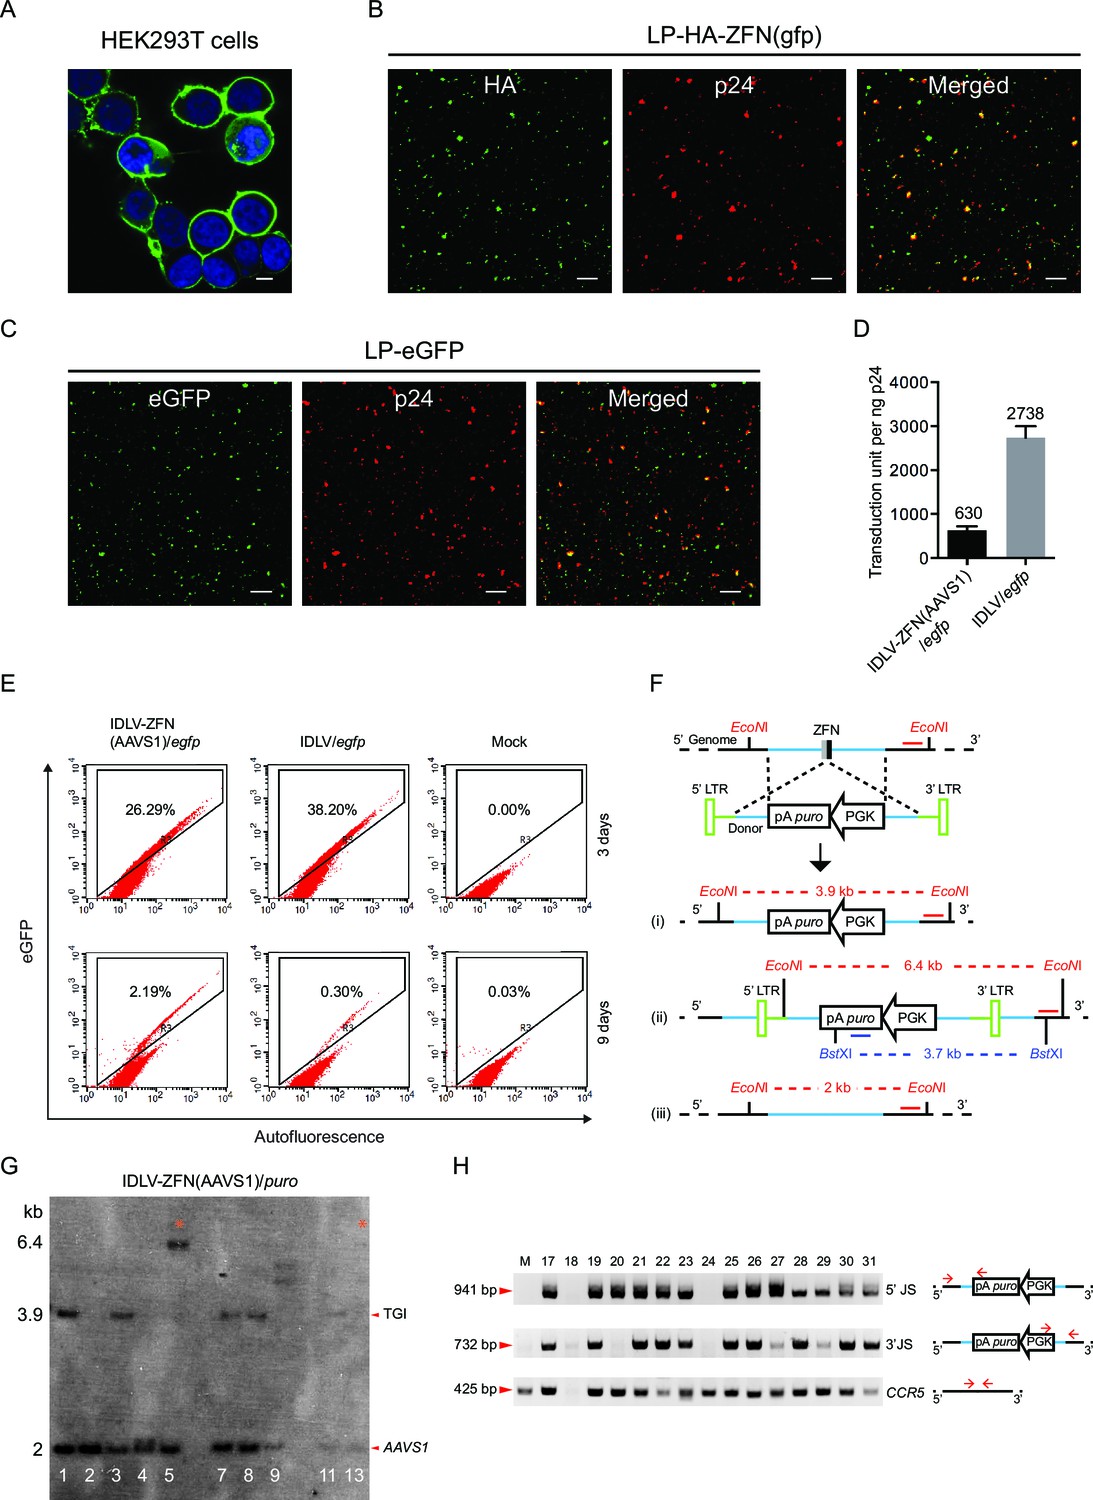
Characterization of protein delivery by ZFN-loaded IDLVs.
(A– C) Immunostaining and confocal microscopy of producer cells and virions. Green, eGFP or HA-tagged ZFN; blue, nuclei; red, p24; scale bar represents 5 μm. (A) HEK293T cells co-transfected with pMD.2G and pGFP-PH-gagpol-D64V. (B–C) Incorporation of ZFNs (B) and eGFP (C) into lentiviral particles was confirmed by co-localization of HA-ZFNs (or eGFP) and p24. (D) Transduction unit per ng p24 for IDLV-ZFN(AAVS1)/egfp and IDLV/egfp. Experiments were performed in triplicates. The mean of transduction unit per ng p24 is shown on top of each bar. (E) IDLV-ZFN(AAVS1)/egfp transduction in HEK293T cells results in higher percentage of eGFP+ cells than IDLV/egfp counterpart 9 days after transduction. HEK293T cells were transduced with 20 μl of concentrated IDLV-ZFN(AAVS1)/egfp or IDLV/egfp corresponding to 32 and 70 ng p24, respectively. (F) Schematic representation of Southern blot analysis of integration events at the AAVS1 locus by IDLV-ZFN(AAVS1)/puro. i, HR; ii, NHEJ; iii, no insertion. The red EcoNI and red line indicate the cleavage site of the enzyme and the probe, respectively. BstXI marked in dark blue font and the dark blue line indicate the enzyme and the probe, respectively, used in Figure 1L and Figure 1M. (G) Southern blot analysis of puromycin-resistant clones resulting from IDLV-ZFN(AAVS1)/puro transduction. Clones were chosen from Figure 1L using the same clone ID. Fragments marked with * are indicative of an NHEJ event during TGI at the AAVS1 locus. (H) PCR analyses of additional 15 puromycin-resistant clones generated after transduction with IDLV-ZFN(AAVS1)/puro. The primer sets used were the same as in Figure 1F and Figure 1I.
Figure 2 with 1 supplement
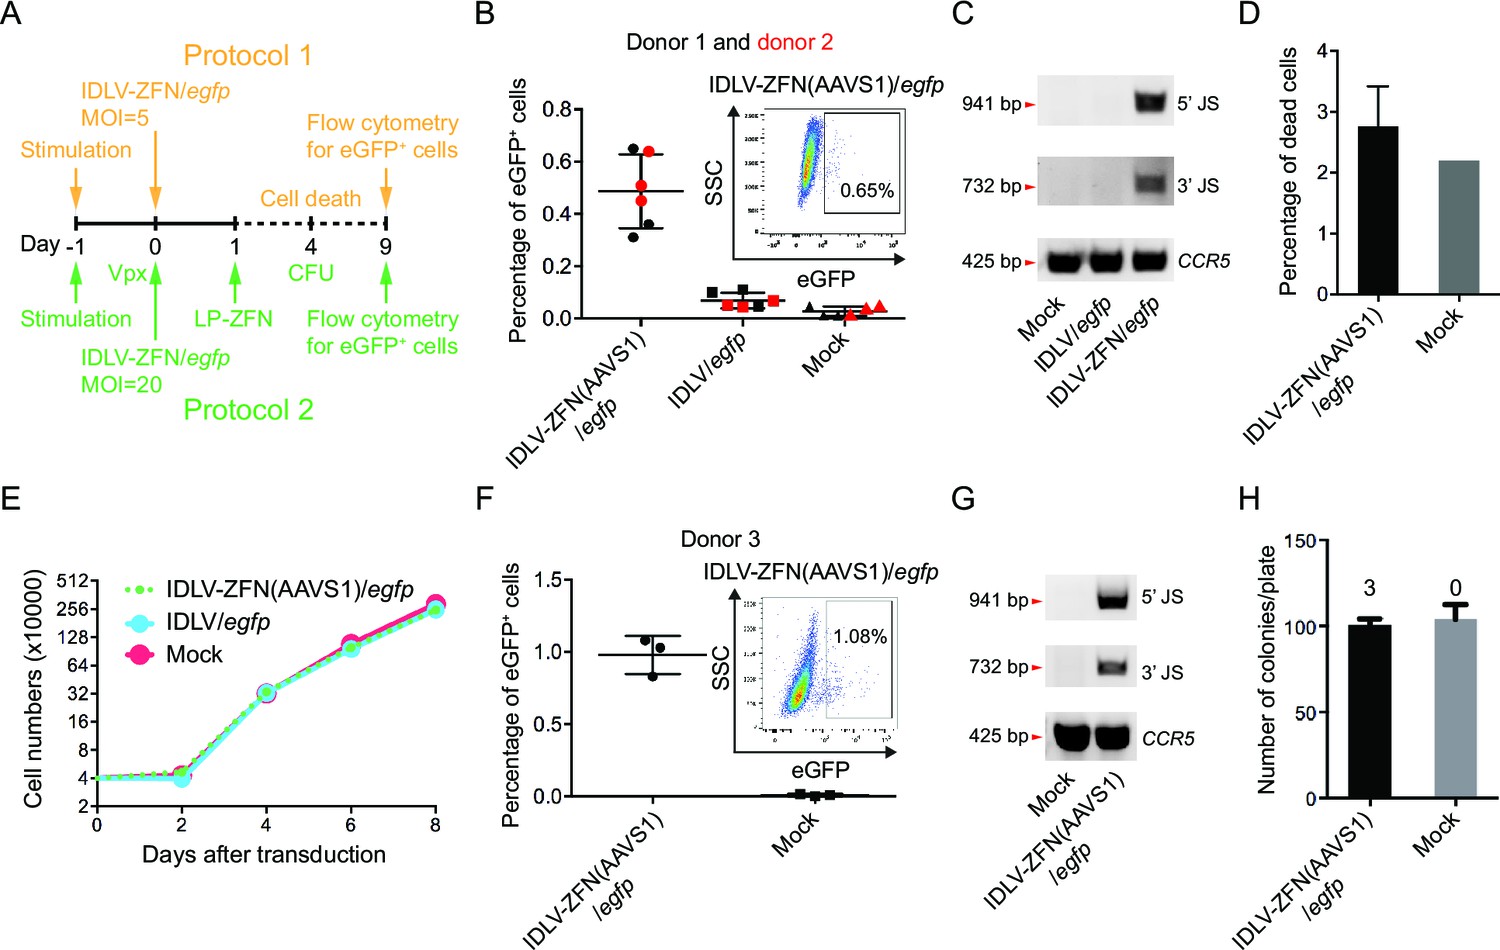
Targeted gene integration mediated by IDLV-ZFN(AAVS1)/egfp in CD34+ cells.
(A) Schematic illustration of protocols used for IDLV-ZFN(AAVS1)/egfp transduction in CD34+ cells. (B) Flow cytometry analysis showing the percentage of eGFP+ cells after transduction using protocol 1 (Figure 2A, orange labeling). Experiments were performed in triplicates using CD34+ cells from two different donors (donor 1 and donor 2 marked by black and red color, respectively). Representative dot plot is shown on the top right. (C) PCR analyses of targeted gene integration. The primer sets used were same as in Figure 1F. (D) Cell death was measured 4 days after transduction. IDLV-ZFN(AAVS1)/egfp treatment was performed in triplicates. (E) Growth curve of transduced cells and non-transduced cells. (F) Flow cytometry analysis showing the percentage of eGFP+ cells after transduction using protocol 2 (Figure 2A, green labeling). Experiments were performed in triplicates using CD34+ cells from donor 3. Representative dot plot is shown on the top right. (G) PCR analyses of targeted gene integration. The primer sets used were the same as in Figure 1F. (H) The number of colonies formed from IDLV-ZFN(AAVS1)/egfp-transduced and non-transduced CD34+ cells. The experiments were performed in triplicates, and the numbers of eGFP+ colonies are provided above each bar.
Figure 2—figure supplement 1
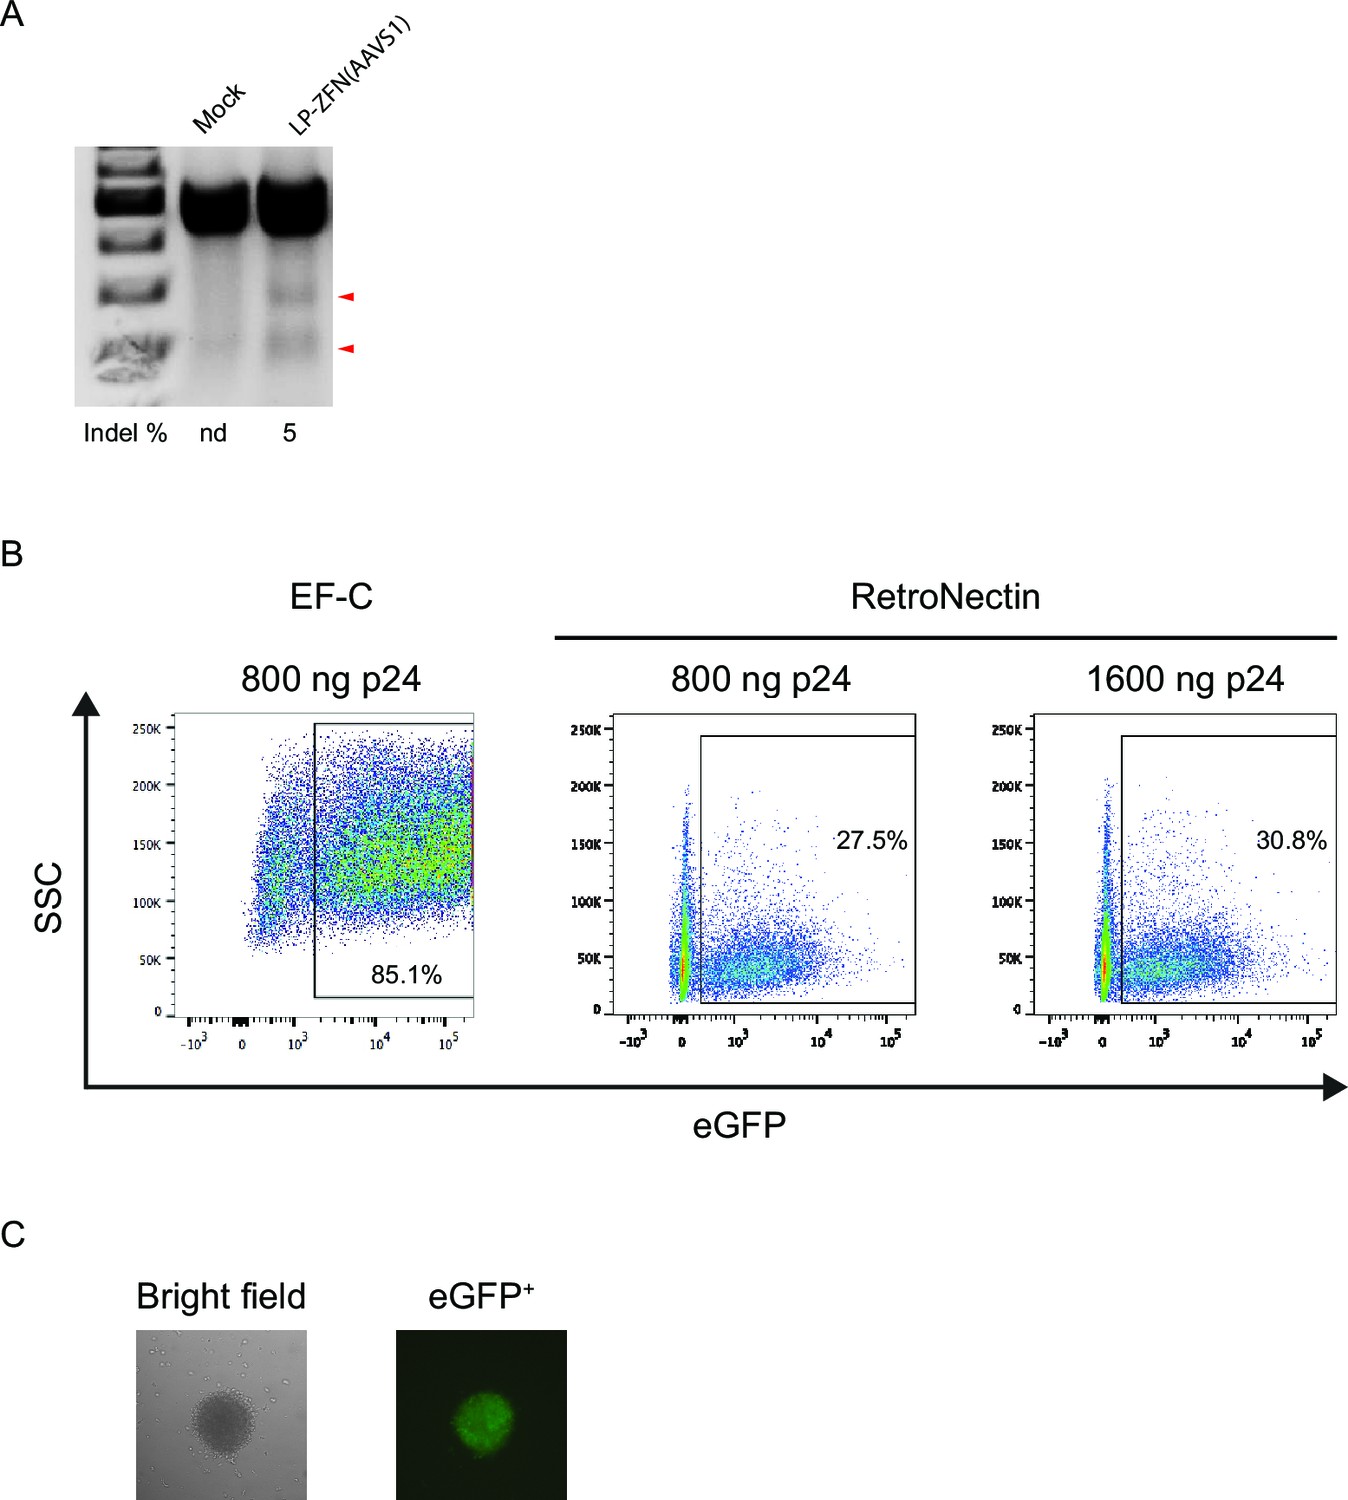
Allelic disruption and gene insertion after lentiviral ZFN delivery in human CD34+ cells.
(A) Allelic disruption at the AAVS1 locus in CD34+ cells by LP-ZFN(AAVS1) transduction at a dose of 500 ng p24 per 105 cells.LP entry was facilitated by RetroNectin. (B) Flow cytometry analysis of eGFP+ CD34+ cells 9 days after transduction with standard eGFP-encoding lentiviral vectors (LV-eGFP) in the presence of EF-C peptides or RetroNectin. (C) A representative eGFP+ colony derived from IDLV-ZFN(AAVS1)/egfp-transduced CD34+ cells.
Figure 3 with 1 supplement
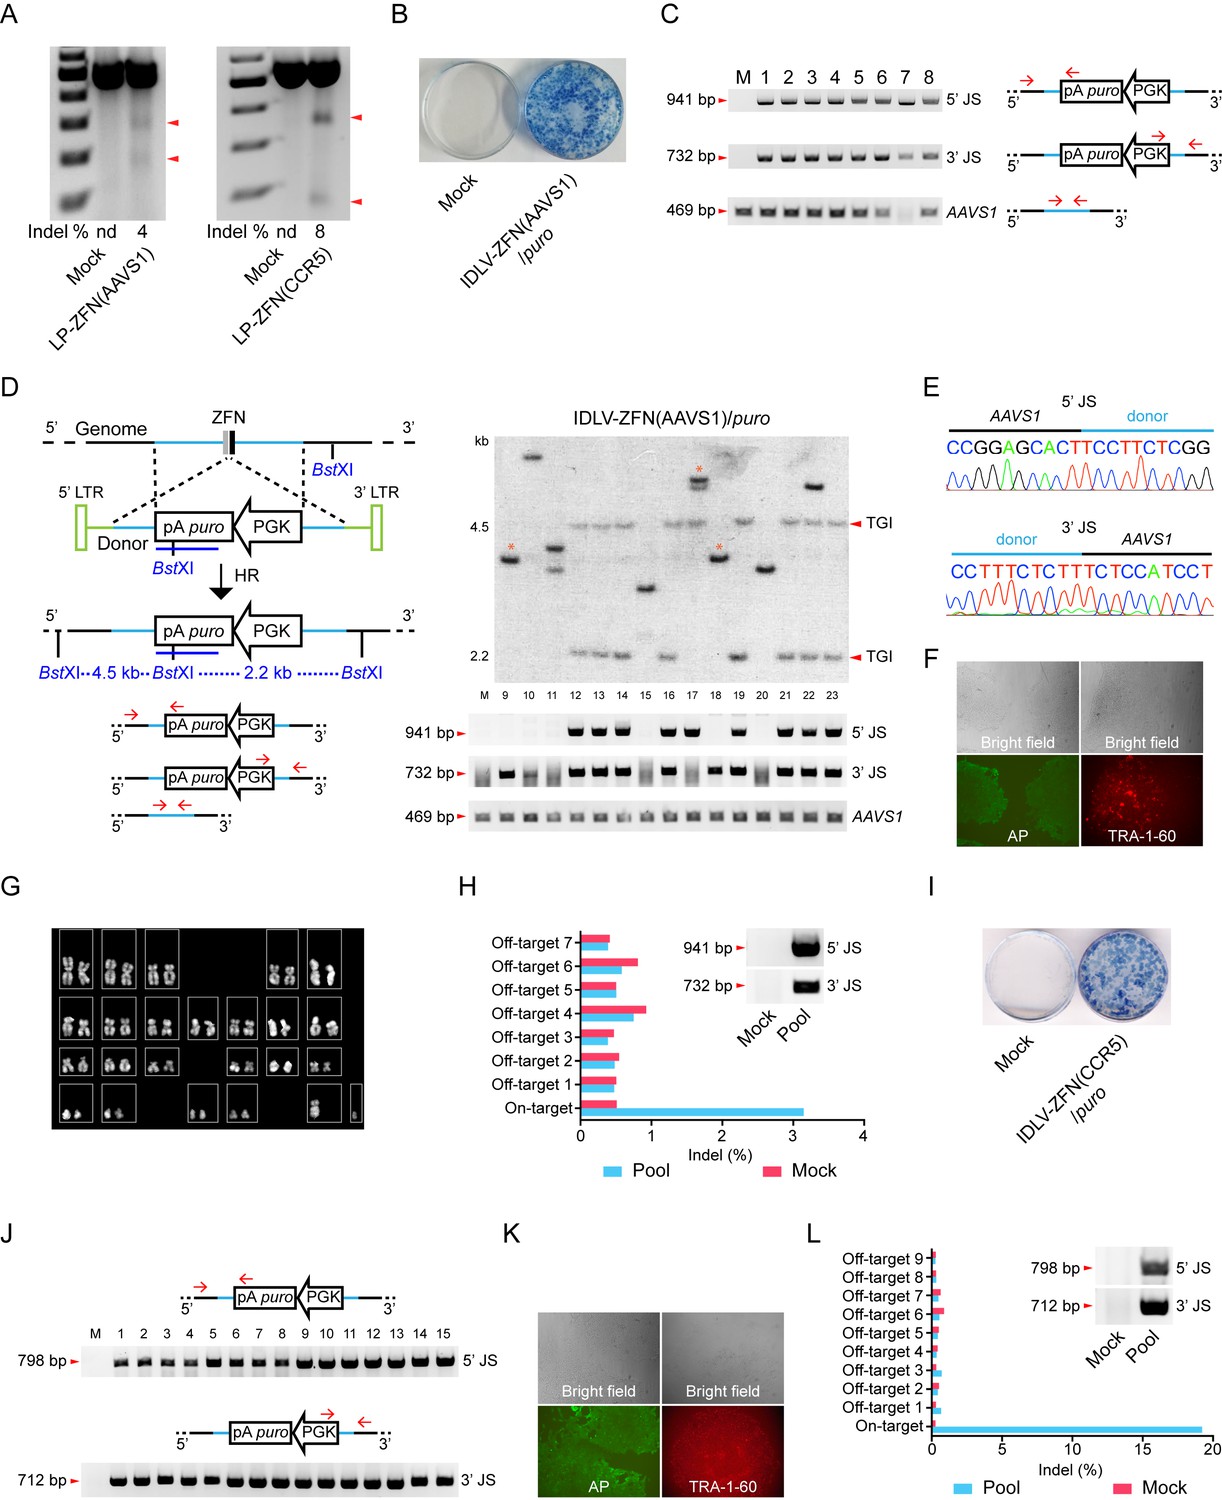
Targeted gene integration in iPSCs by IDLV-ZFN(AAVS1)/puro and IDLV-ZFN(CCR5)/puro.
(A) Gene disruption mediated by transduction of LP-ZFN(AAVS1) and LP-ZFN(CCR5) in iPSCs. (B) Puromycin-resistant iPSC clones appearing after transduction with IDLV-ZFN(AAVS1)/puro. Clones were stained with methylene blue. (C) PCR analyses of targeted gene integration by IDLV-ZFN(AAVS1)/puro in clones 1–8. Primer sets used for amplification of 5’ and 3’ junction sites were the same as in Figure 1F, except that amplification of the AAVS1 locus without the insertion was included as a control. (D) Southern blot (top) and PCR analyses (bottom) of targeted gene integration in clones 9–23 resulting from transduction with IDLV-ZFN(AAVS1)/puro. Schematic illustration of Southern blot mimics that in Figure 1K, except that a longer puro probe was used. Fragments indicated with * are indicative of imprecise TGI involving NHEJ at either the 5’ or 3’ junction site. (E) Representative sequence chromatograms of amplified 5’ and 3’ junctions (see also Supplementary file 1A). (F) Alkaline phosphatase (left) and TRA-1-60 (right) staining of a representative iPSC clone derived from IDLV-ZFN(AAVS1)/puro treatment. (G) Karyotyping analysis of a representative iPSC clone generated after transduction with IDLV-ZFN(AAVS1)/puro. (H) Indel frequencies obtained by deep sequencing of on- and top-ranked off-target sites in pools of iPSC clones generated by transduction with IDLV-ZFN(AAVS1)/puro. Inserted PCR analysis confirms the presence of TGI in a pool of iPSCs consisting of approximately 110 iPSC clones. (I) Puromycin-resistant iPSC clones appearing after transduction with IDLV-ZFN(CCR5)/puro. Clones were stained with methylene blue. (J) PCR analyses of targeted gene integration in iPSCs (clones 1–15) obtained by transduction with IDLV-ZFN(CCR5)/puro. (J) Alkaline phosphatase (left) and TRA-1-60 (right) staining of a representative iPSC clone derived from IDLV-ZFN(CCR5)/puro treatment. (L) Indel frequencies obtained by deep sequencing of on- and top-ranked off-target sites in pools of iPSC clones generated by transduction with IDLV-ZFN(CCR5)/puro. Inserted PCR analysis confirms the presence of TGI in a pool of iPSCs consisting of approximately 105 iPSC clones.
Figure 3—figure supplement 1
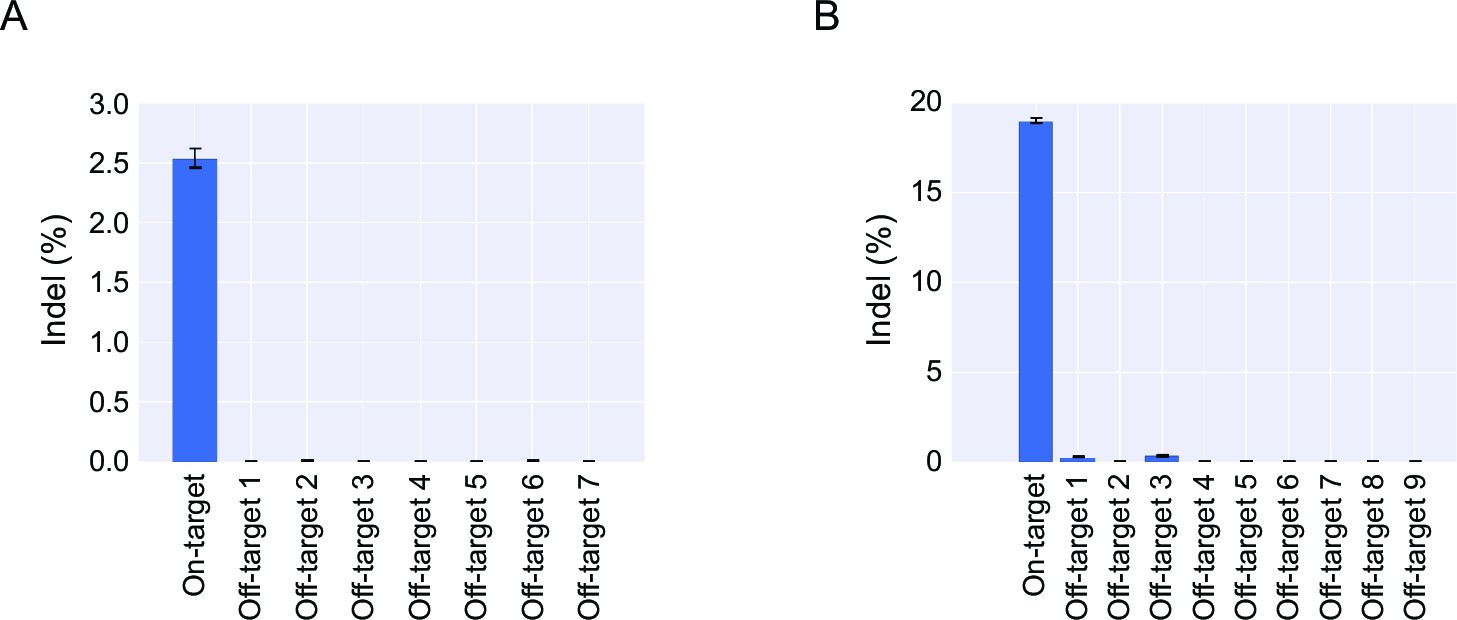
Deep sequencing analysis of cleavage frequencies at the on-target and top ranking off-target loci of AAVS1 (A) and CCR5 (B) in pools of iPSC clones.
Error bars indicate 95% Wilson score intervals. For this analysis, HiSeq reads were trimmed with Sickle, merged with FLASH, and mapped to the amplicons using bowtie2 (described in Material and methods). Reads with an average Phred score below 23 were discarded, and the reads were then aligned using EMBOSS water and analyzed for indels.
Additional files
-
Supplementary file 1
(A) Sanger sequencing of donor-genome junctions and the AAVS1 locus. The PCR products of 5’ junction and 3’ junction sites as well as the AAVS1 locus from 8 analyzed iPSC clones were Sanger sequenced. The black letters represent genomic DNA at the AAVS1 locus, whereas blue letters represent donor-derived sequences. WT indicates wild-type sequence; indel (+1bp) indicates 1-bp insertion; N.A., not available. (B) Sanger sequencing of PROGNOS-predicted off-target site 1, 2 and 3. The blue sequence indicates the predicted binding site of the right ZFN; the green sequence indicates predicted binding site of the left ZFN; letters highlighted in red indicate mismatches.
- https://doi.org/10.7554/eLife.12213.008
-
Supplementary file 2
(A) Primers used for molecular cloning and PCR amplification of junction sites. (B) Primers used to amplify PROGNOS-predicted off-target sites.
- https://doi.org/10.7554/eLife.12213.009
-
Supplementary file 3
Donor sequences.
Homology arms and transgene expression cassettes in pLV/AAVS1-donor-egfp-PGK, pLV/AAVS1-donor-fluc-PGK, pLV/AAVS1-donor-puro-PGK and pLV/CCR5-donor-puro-PGK are provided. For each transgene expression cassette, sequences are annotated as listed below the sequence and indicated with different colors.
- https://doi.org/10.7554/eLife.12213.010
Download links
A two-part list of links to download the article, or parts of the article, in various formats.
Downloads (link to download the article as PDF)
Open citations (links to open the citations from this article in various online reference manager services)
Cite this article (links to download the citations from this article in formats compatible with various reference manager tools)
Targeted, homology-driven gene insertion in stem cells by ZFN-loaded ‘all-in-one’ lentiviral vectors
eLife 5:e12213.
https://doi.org/10.7554/eLife.12213


