The global antigenic diversity of swine influenza A viruses
- University of Cambridge, United Kingdom
- Wellcome Trust Sanger Institute, United Kingdom
- USDA-ARS, United States
- Rega Institute for Medical Research, Belgium
- University of Edinburgh, United Kingdom
- Erasmus Medical Center, Netherlands
- National Centre for Veterinary Diagnostics, Vietnam
- National Institute of Animal Health, Thailand
- The University of Hong Kong, China
- National Institute of Animal Health, Japan
- Anses, Ploufragan-Plouzané Laboratory, France
- St Jude Children's Research Hospital, United States
- Ghent University, Belgium
- Animal Health and Plant Agency, United Kingdom
- Technical University of Denmark, Denmark
Figures
Figure 1 with 7 supplements

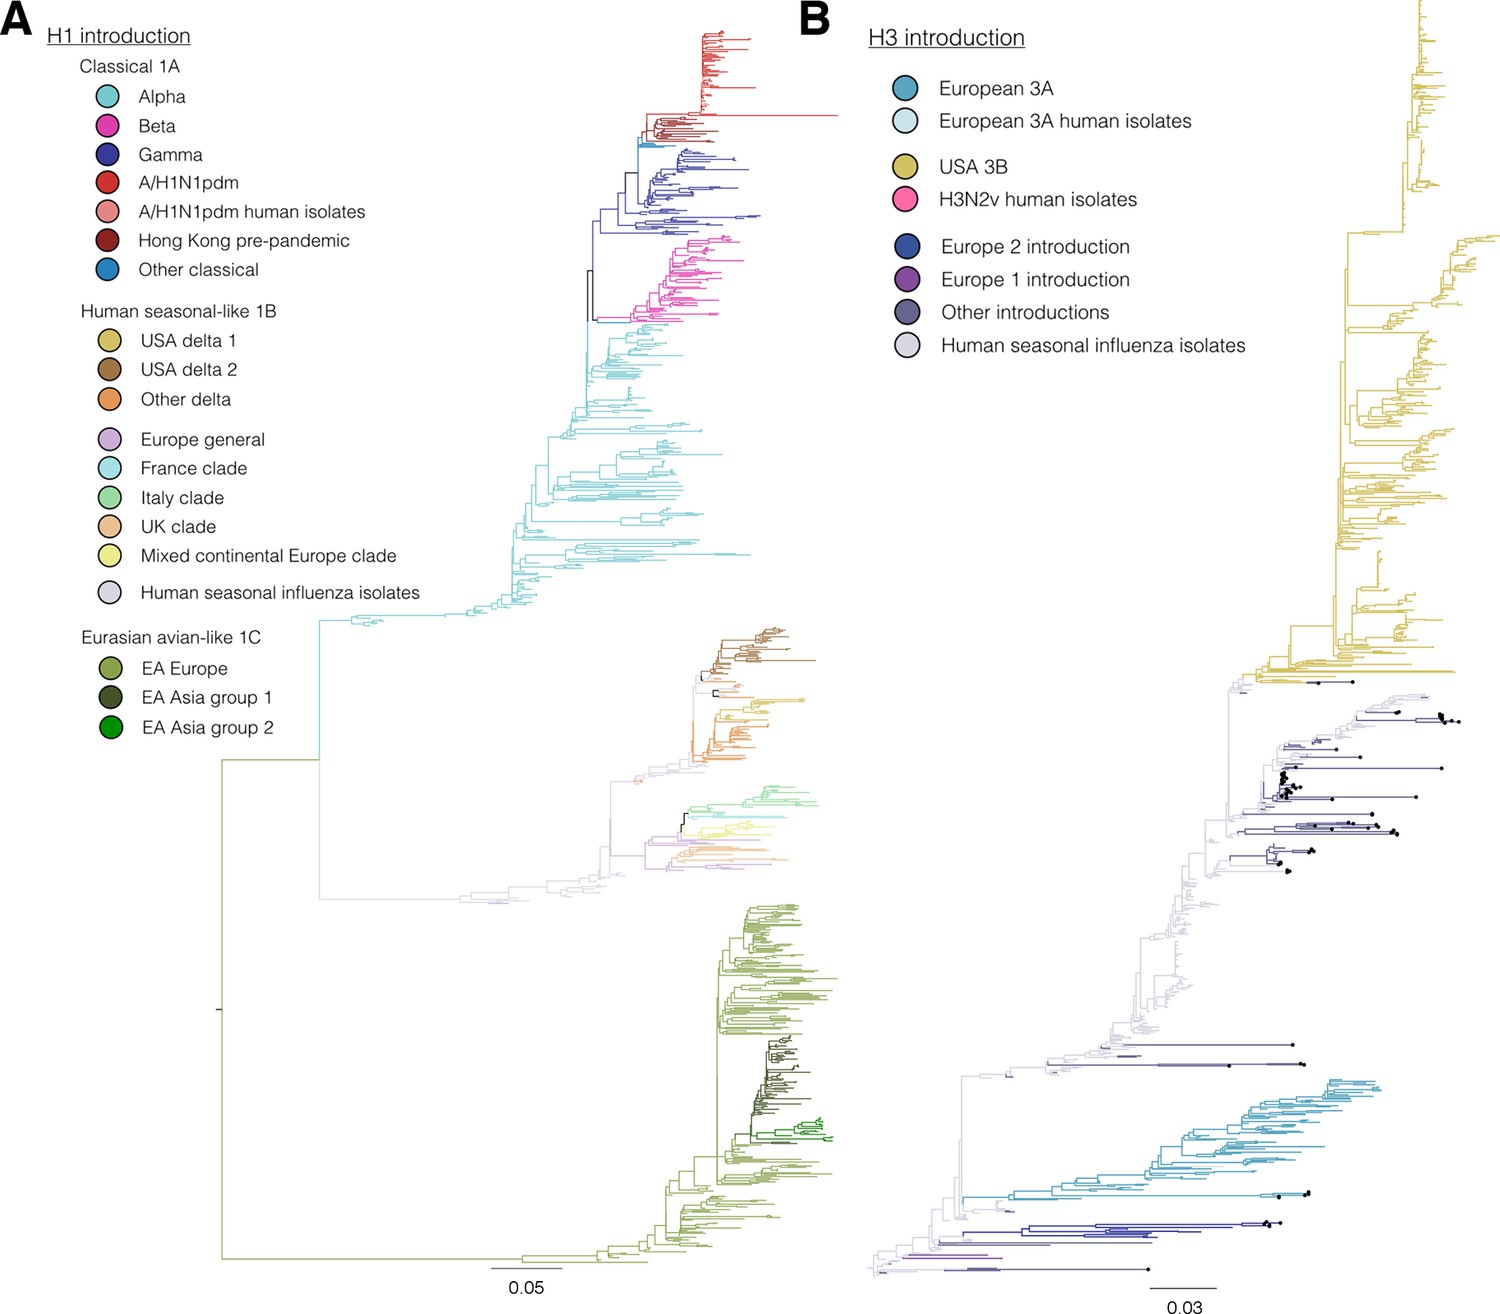
Evolutionary relationships of H1 (A, B) and H3 (C, D) influenza viruses circulating in swine and humans inferred by Bayesian Multi-dimensional scaling (BMDS).
Each colored ball represents a single virus. Viruses are colored by lineage (A,C) and by geography (B,D). Lines connecting each virus represent inferred phylogenetic relationships. Distances for antigenic dimensions are measured in antigenic units (AU) and each unit is equivalent to a two-fold dilution in HI assay data. Antigenic distance can be interpreted as a measure of antigenic similarity – viruses close to one another are more antigenically similar than viruses further apart. Interactive visualizations are available at https://phylogeography.github.io/influenzaH1/ and https://phylogeography.github.io/influenzaH3/. Source data and GIF files for rotational views of 3D antigenic maps in Figure 1 have been deposited in Dryad (Lewis et al., 2016).
Figure 1—figure supplement 1
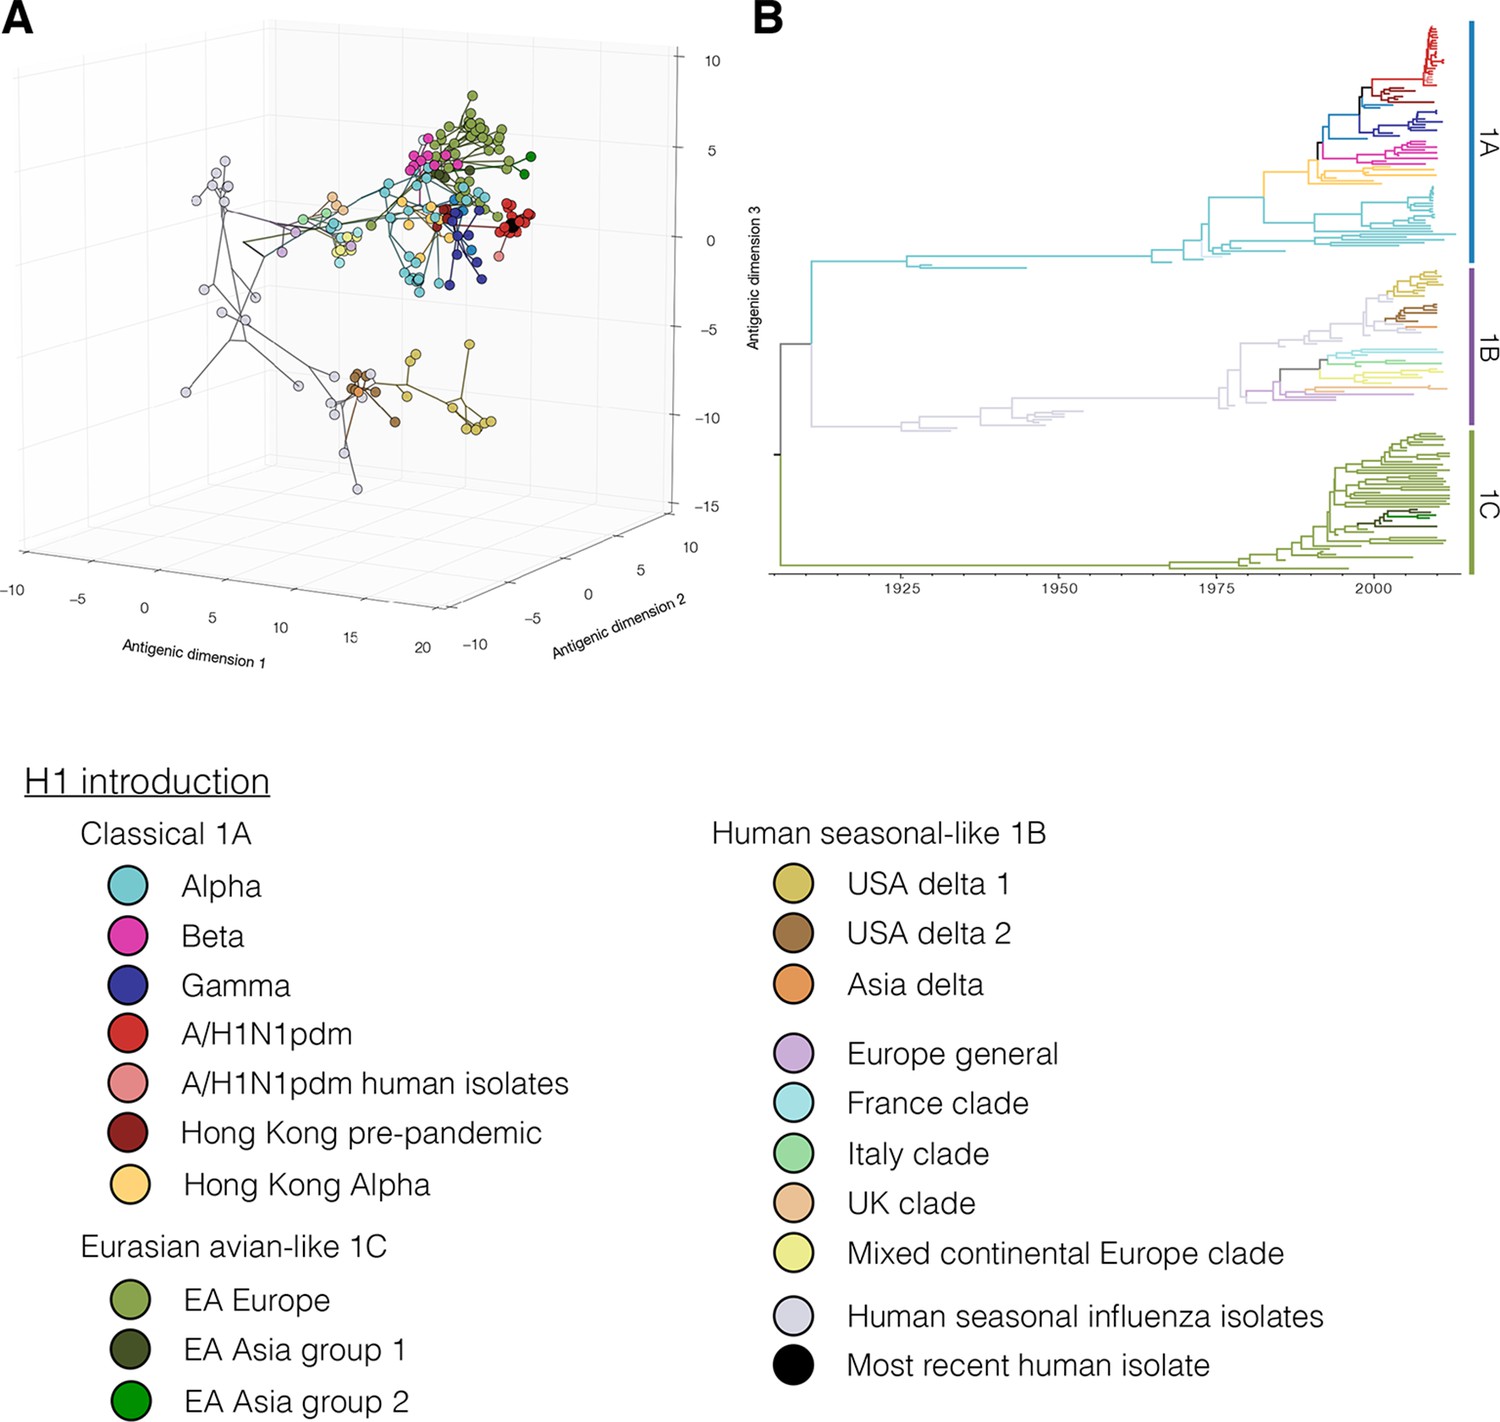
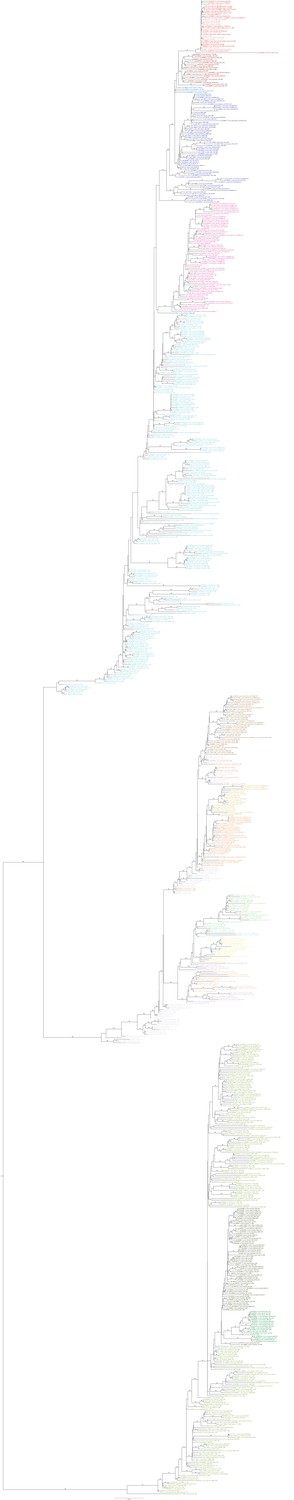
Figure 1A,B colored by H1 genetic sub lineages in the Bayesian MCC tree.
https://doi.org/10.7554/eLife.12217.004
Figure 1—figure supplement 2
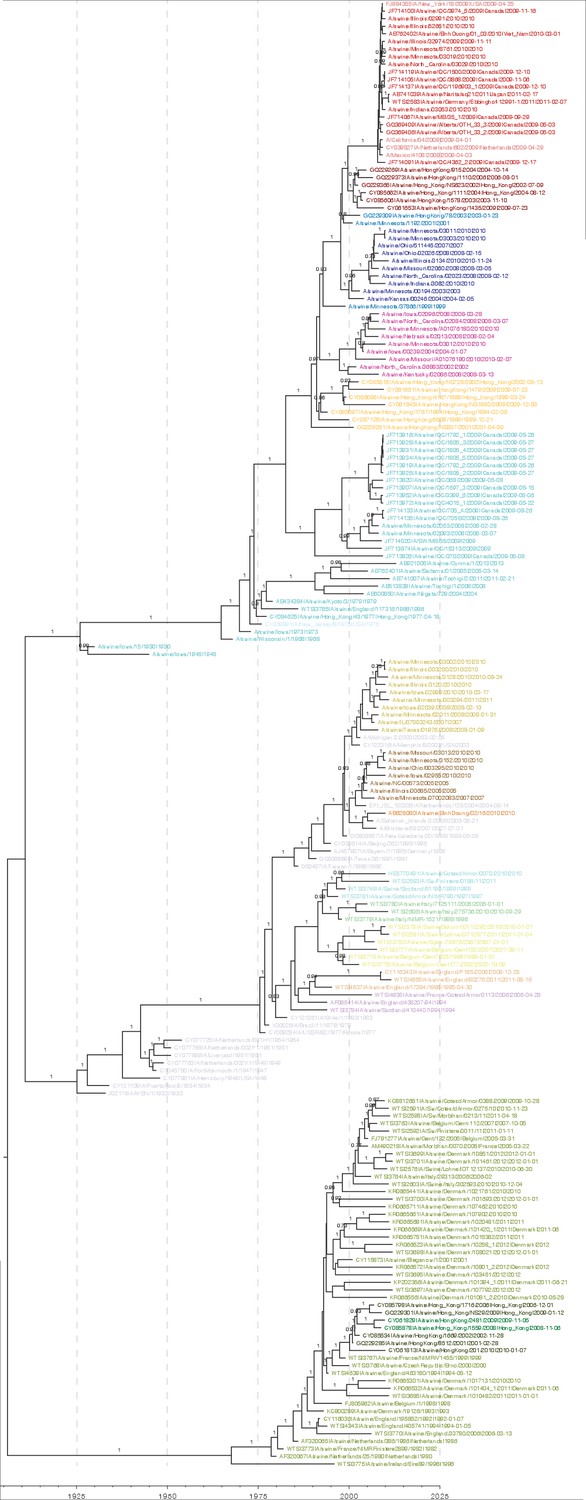
Bayesian H1 MCC tree with taxa labels and posterior support values
https://doi.org/10.7554/eLife.12217.005
Figure 1—figure supplement 3
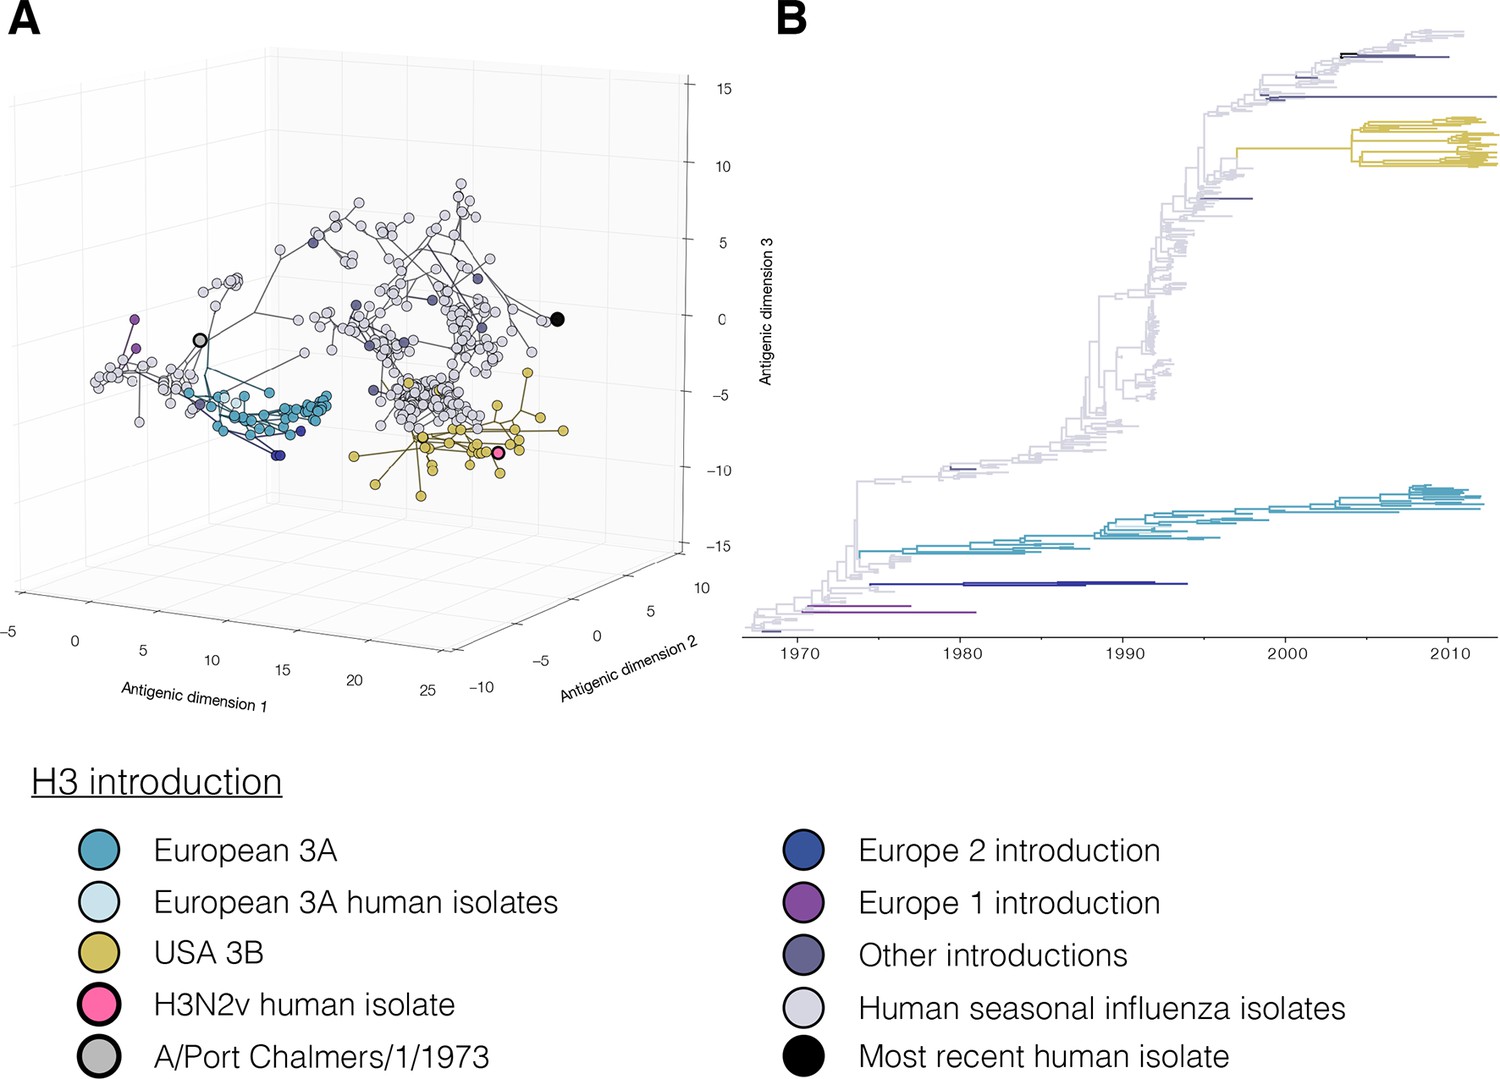
Figure 1C,D colored by H3 genetic sub lineages in the Bayesian MCC tree.
https://doi.org/10.7554/eLife.12217.006
Figure 1—figure supplement 4
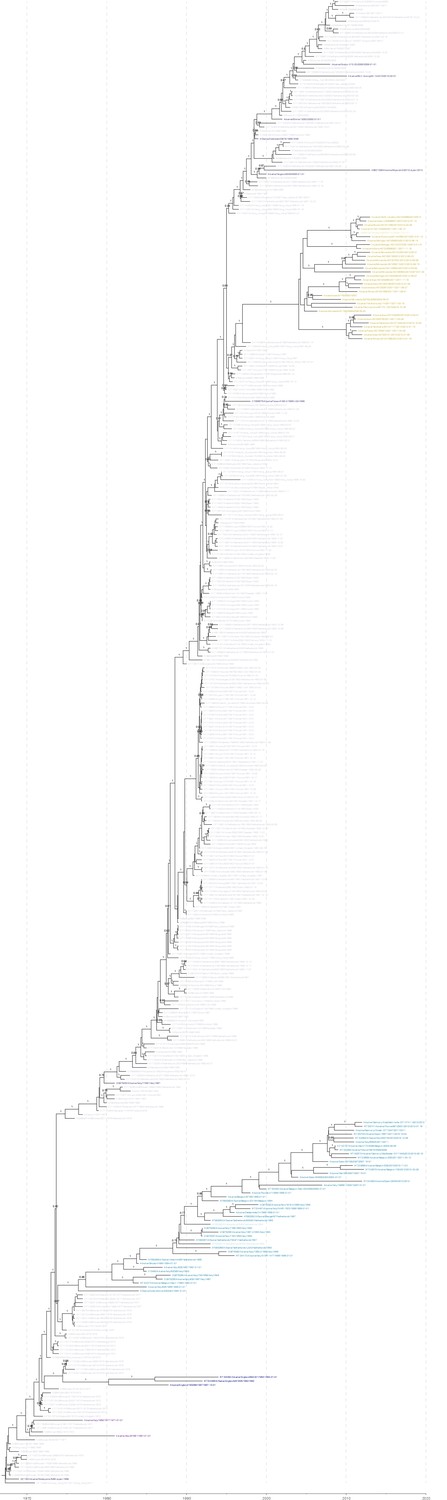
Bayesian H3 MCC tree with taxa labels and posterior support values
https://doi.org/10.7554/eLife.12217.007
Figure 1—figure supplement 5
Maximum likelihood phylogenetic trees colored by lineage.
https://doi.org/10.7554/eLife.12217.008
Figure 1—figure supplement 6
Maximum likelihood H1 phylogenetic tree with taxa labels and bootstrap support values
https://doi.org/10.7554/eLife.12217.009
Figure 1—figure supplement 7
Maximum likelihood H3 phylogenetic tree with taxa labels and bootstrap support values.
https://doi.org/10.7554/eLife.12217.010
Figure 2
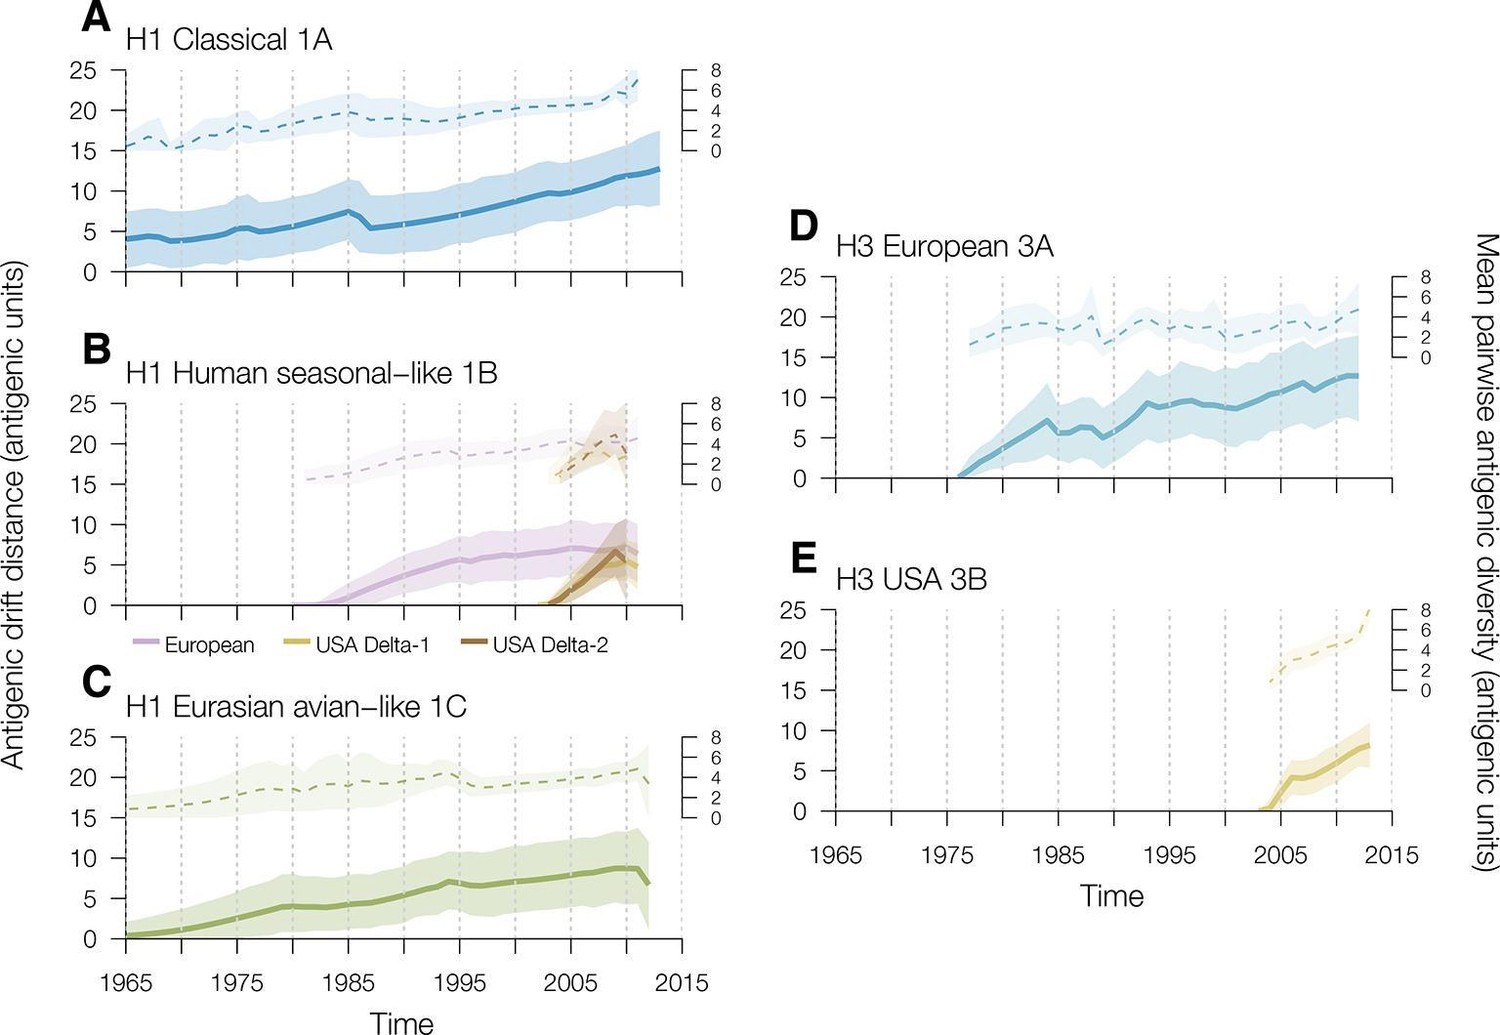
Time series of year-to-year rates of antigenic drift distance and antigenic diversity of H1 and H3 viruses in swine by genetic lineage.
Solid colored lines represent year-to-year antigenic drift distance, where drift for year i is measured as the mean of Euclidean distances among strains in a phylogenetic lineage in year i compared to the mean of Euclidean distances among strains of that phylogenetic lineage from the previous year (i–1). The dotted line represents antigenic diversity among H1 and H3 strains by lineage through time. For the solid and dotted lines, the shaded region represents the range of the highest posterior density estimates. Multiple introductions which circulate for >5 years of the human seasonal-like swine H1 lineage in European (purple) and USA (gold) swine were calculated separately. Source data for Figure 2 has been deposited in Dryad (Lewis et al., 2016).
Additional files
-
Supplementary file 1
Dimension testing results for antigenic maps characterising the evolution of H1 and H3 influenza viruses.
- https://doi.org/10.7554/eLife.12217.012
-
Supplementary file 2
Mean pairwise distances between swine influenza lineage groups/strains and between human currently circulating strains (AU) and associated 95% credible interval.
- https://doi.org/10.7554/eLife.12217.013
-
Supplementary file 3
Overall drift rate in antigenic units per year for H1 and H3 swine influenza virus lineages and 95% credible interval (HPD).
- https://doi.org/10.7554/eLife.12217.014
-
Supplementary file 4
Summary of previously reported rates of antigenic drift of influenza A viruses.
- https://doi.org/10.7554/eLife.12217.015
Download links
A two-part list of links to download the article, or parts of the article, in various formats.
Downloads (link to download the article as PDF)
Open citations (links to open the citations from this article in various online reference manager services)
Cite this article (links to download the citations from this article in formats compatible with various reference manager tools)
The global antigenic diversity of swine influenza A viruses
eLife 5:e12217.
https://doi.org/10.7554/eLife.12217


