Human Holliday junction resolvase GEN1 uses a chromodomain for efficient DNA recognition and cleavage
- Max Planck Institute of Biochemistry, Germany
Figures
Figure 1 with 1 supplement
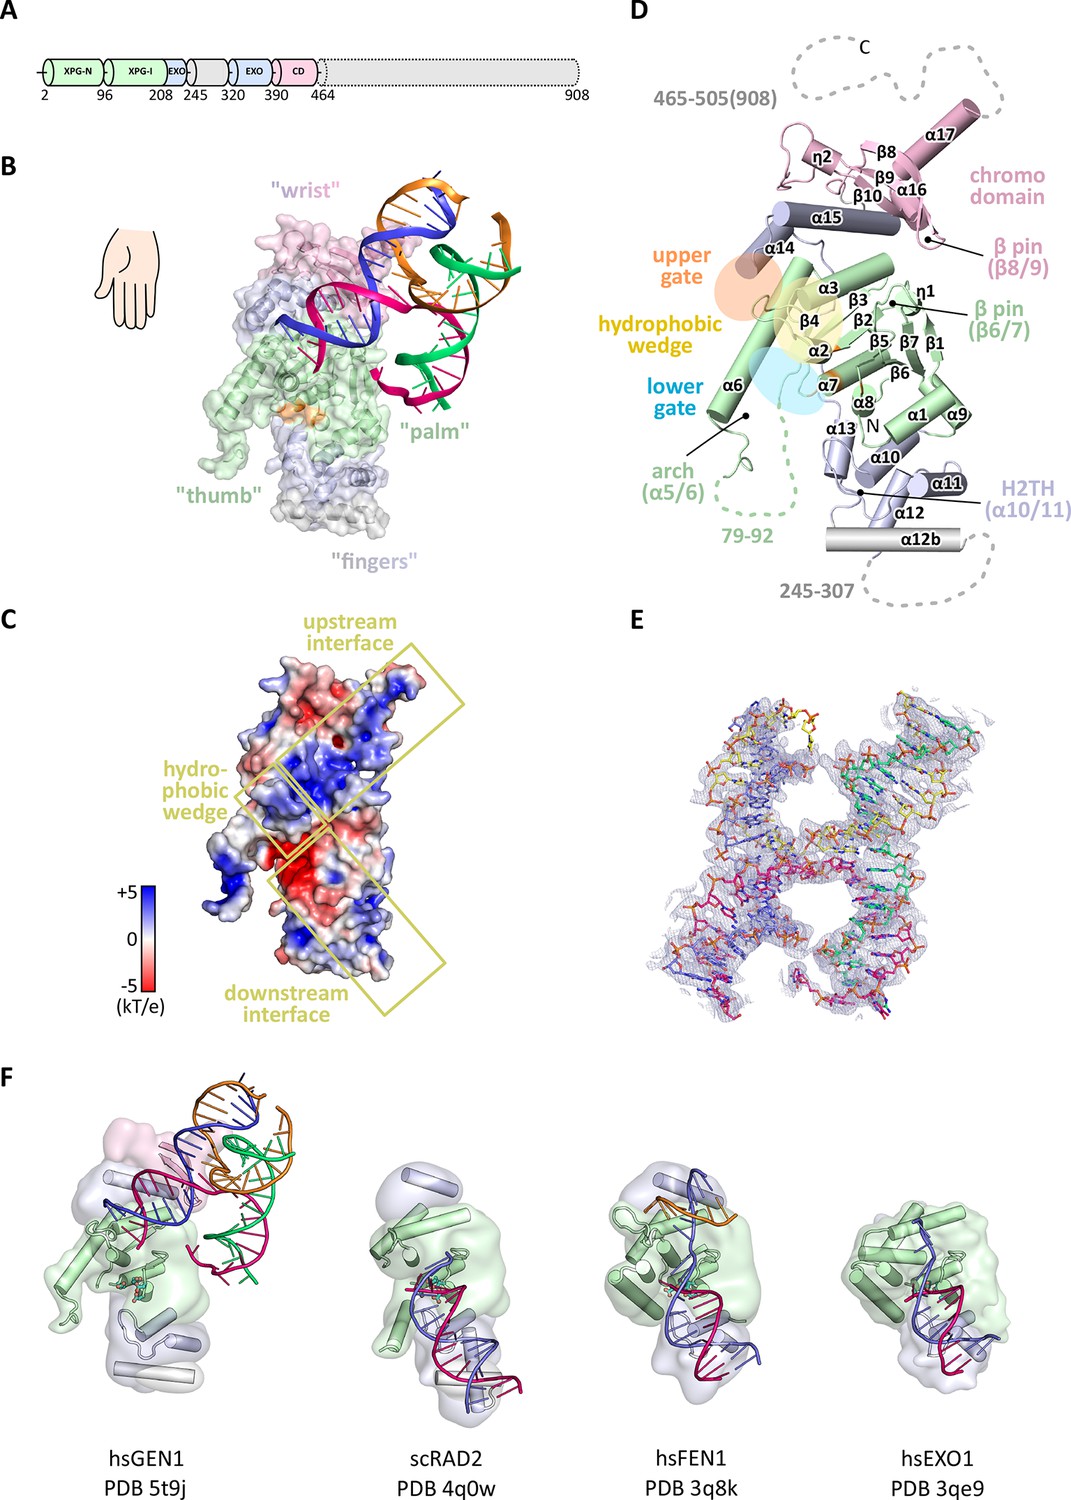
Architecture of human GEN1.
(A) Domain architecture of human GEN1. The structurally unknown regulatory domain (residues 465–908) is shown with dotted lines. (B) Overview of the catalytic core of GEN1 in complex with HJ DNA. The protein resembles the shape of a downwards-pointing right hand with helix α6 as the thumb. The protein is depicted in half transparent surface representation with secondary structure elements underneath. The DNA is shown in ladder representation with individual strands in different colors. The coloring of GEN1 follows domain boundaries: intertwining XPG-N and XPG-I in green, 5’->3’ exonuclease C-terminal domain (EXO) in blue, chromodomain in pink, unassigned regions in gray. Active site residues (E134, E136, D155, D157) are highlighted in orange. (C) Electrostatic surface potential of GEN1. The coloring follows the potential from -5 (red) to +5 kT/e (blue). The DNA-binding interfaces and the position of the hydrophobic wedge are marked in yellow. (D) Secondary structure elements of the catalytic core of GEN1 in cartoon representation with the same colors as before. Dotted lines represent parts that are not resolved in the crystal structure. The numbering follows a unified scheme for the Rad2/XPG family (compare Figure 2) for α-helices, β-sheets and 310-helices (η). (E) Experimental electron density map (autoSHARP, solvent flattened, contoured at 1σ) drawn around the HJ in the GEN1 complex. The DNA model is shown in ball-stick representation with carbon atoms of individual strands in different colors (yellow, light blue, magenta, green) and oxygen atoms in red, phosphor atoms in orange, nitrogen atoms in dark blue. (F) Structural comparison of Rad2/XPG family nucleases. Proteins are shown in a simplified surface representation with important structural elements in cartoon representation and DNA in ladder representation. The color scheme is the same as in B. Figure 1—figure supplement 1 shows the content of the asymmetric unit.
Figure 1—figure supplement 1
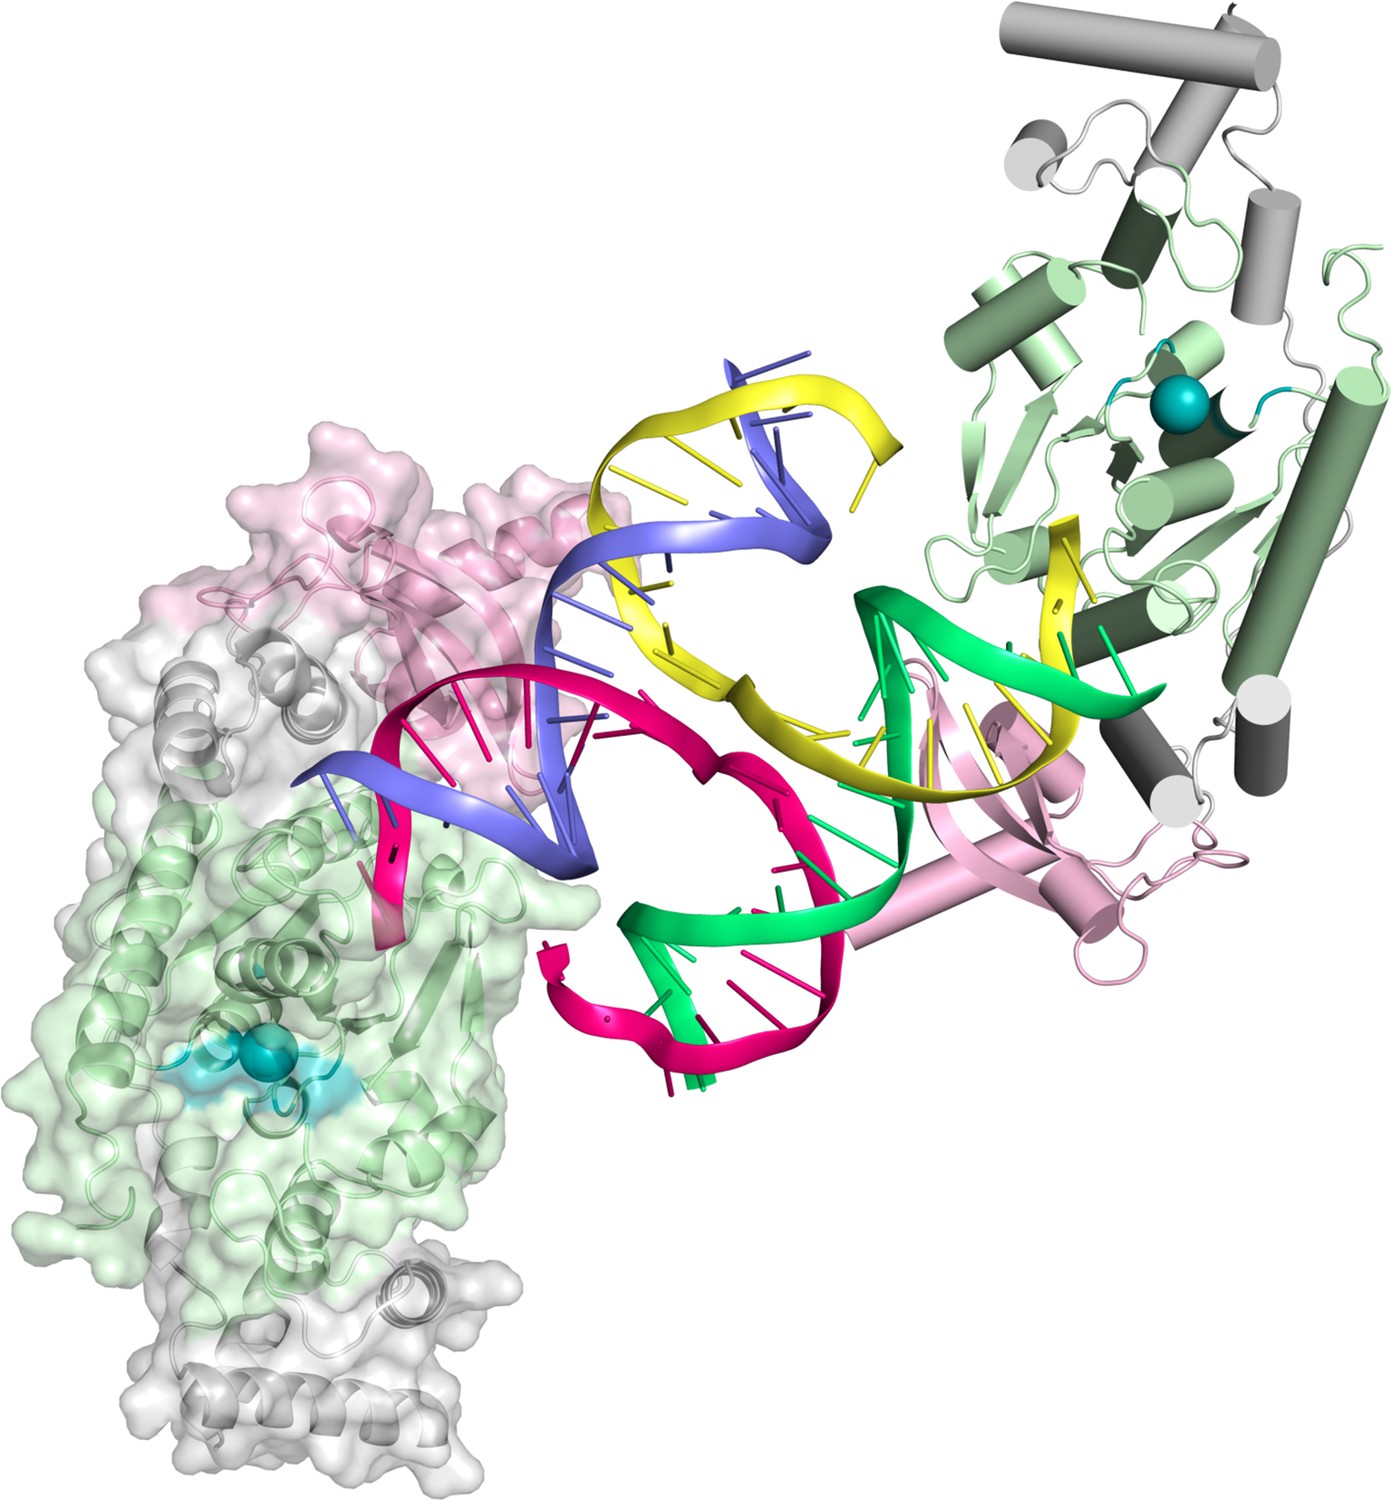
Content of the asymmetric unit of the GEN1-HJ crystal.
One protein monomer is shown in surface representation with secondary structure cartoons underneath, the other one only in cartoon representation with α-helices as cylinders and β-strands as arrows. The HJ DNA bridges between two protein monomers in the asymmetric unit. The active sites are labeled with a turquoise ball each.
Figure 2
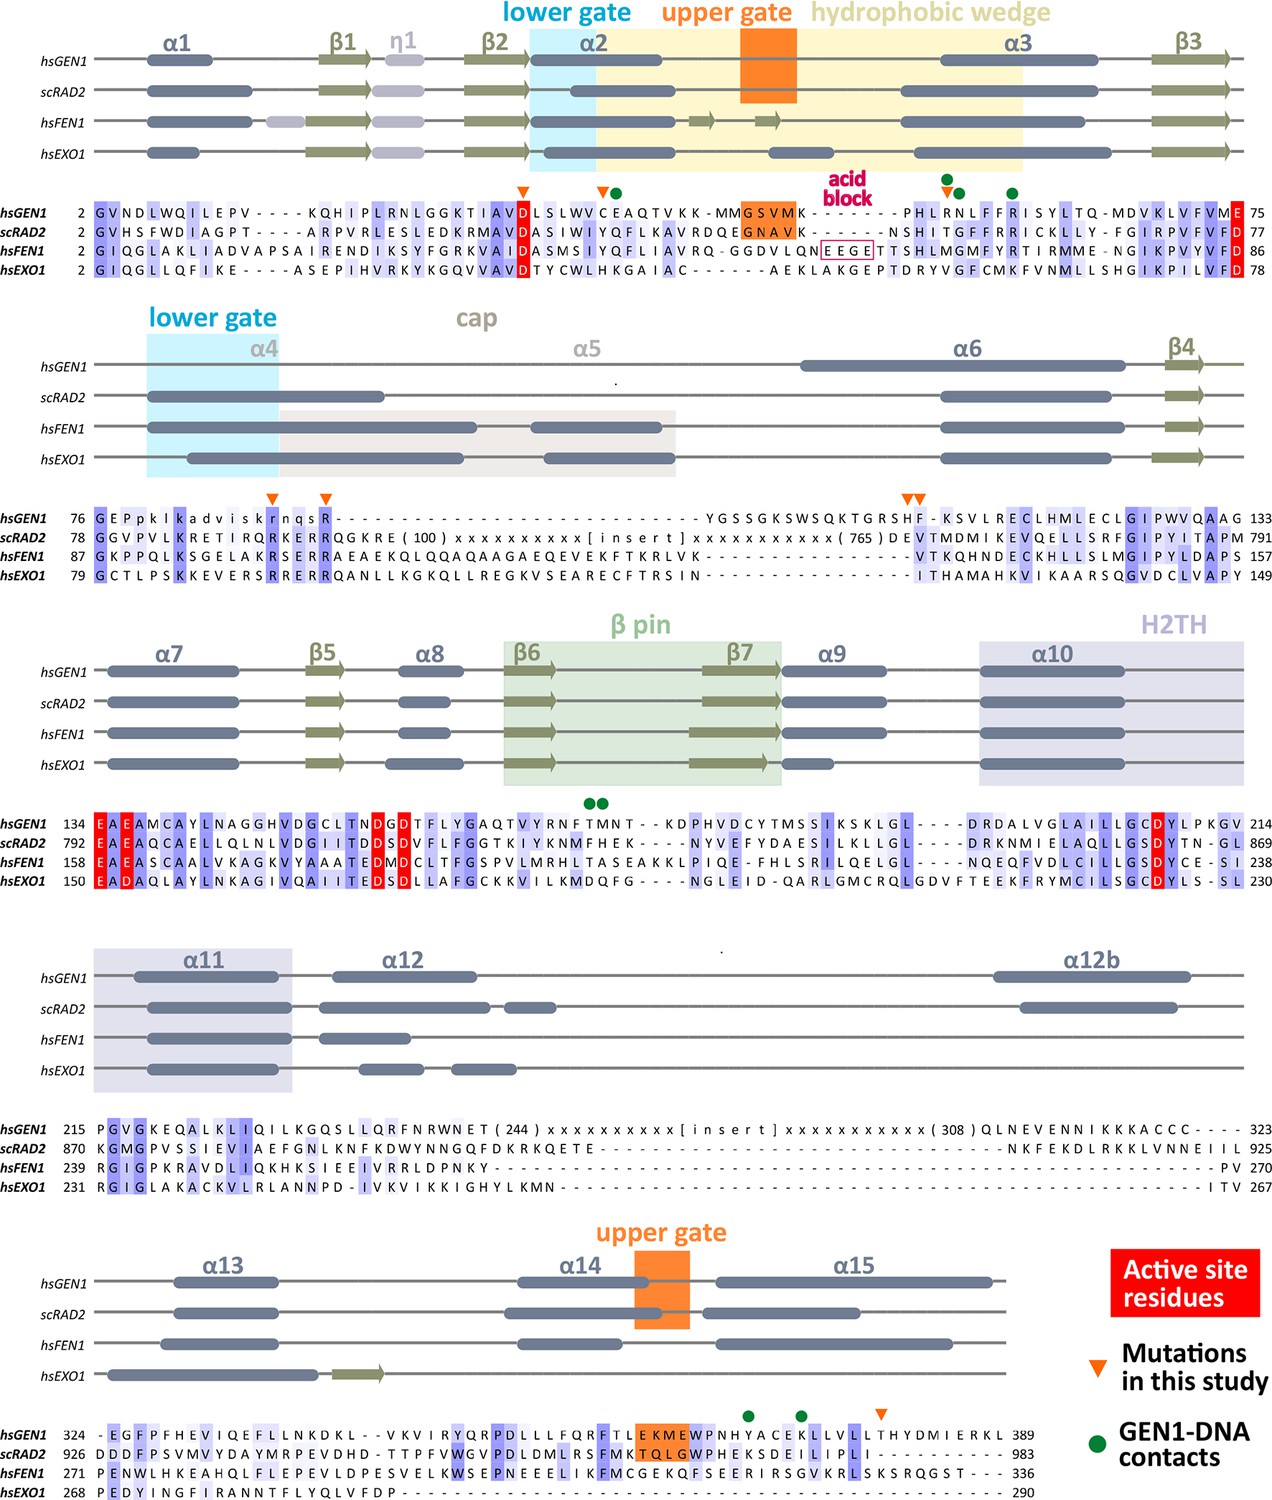
Alignment of the nuclease cores of Rad2/XPG-family proteins.
The alignment is based on known crystal structures: human GEN1 (PDB 5t9j, this study), yeast Rad2 (PDB 4q0w), human FEN1 (PDB 3q8k), human EXO1 (3qe9). Secondary structure elements are depicted on top of the sequence with dark blue bars for α-helices, light blue bars for 310-helices and green arrows for β-sheets. The numbering follows a unified scheme for the superfamily. Functional elements are labeled and described in the main text. Sequences are colored by similarity (BLOSUM62 score) and active site residues are marked in red. Mutations analyzed in this study are marked with an orange triangle and DNA contacts found in the human GEN1–HJ structure have a dark green dot. Disordered or missing parts in the structures are labeled in small letters or with x.
Figure 3 with 2 supplements
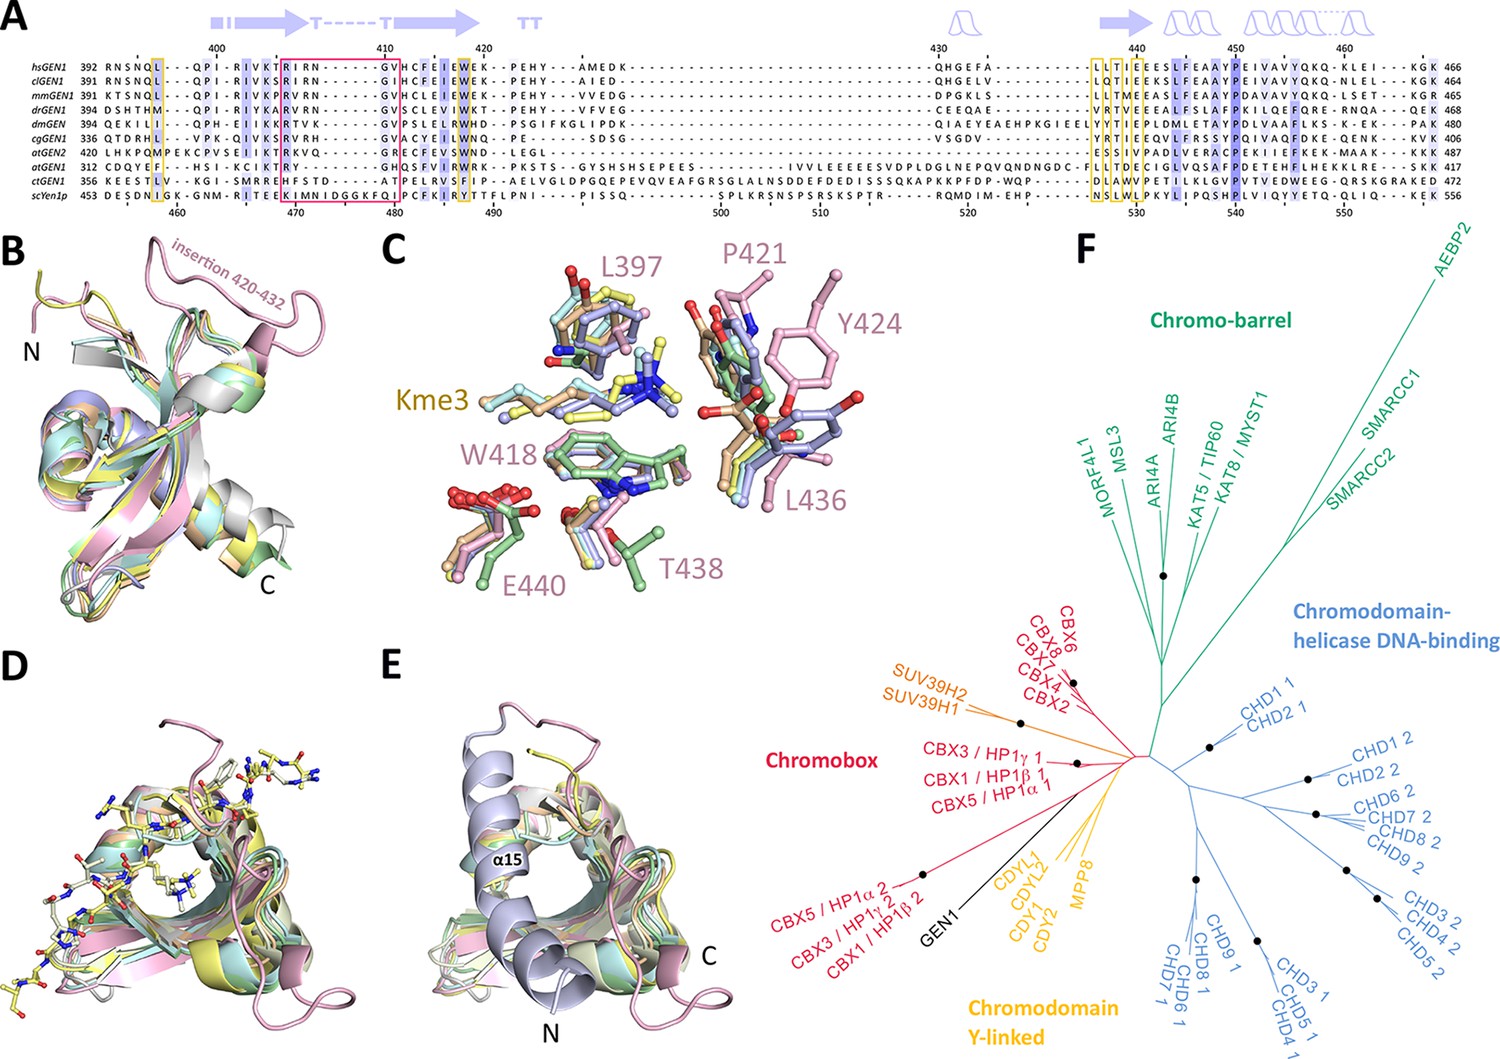
Chromodomain comparison.
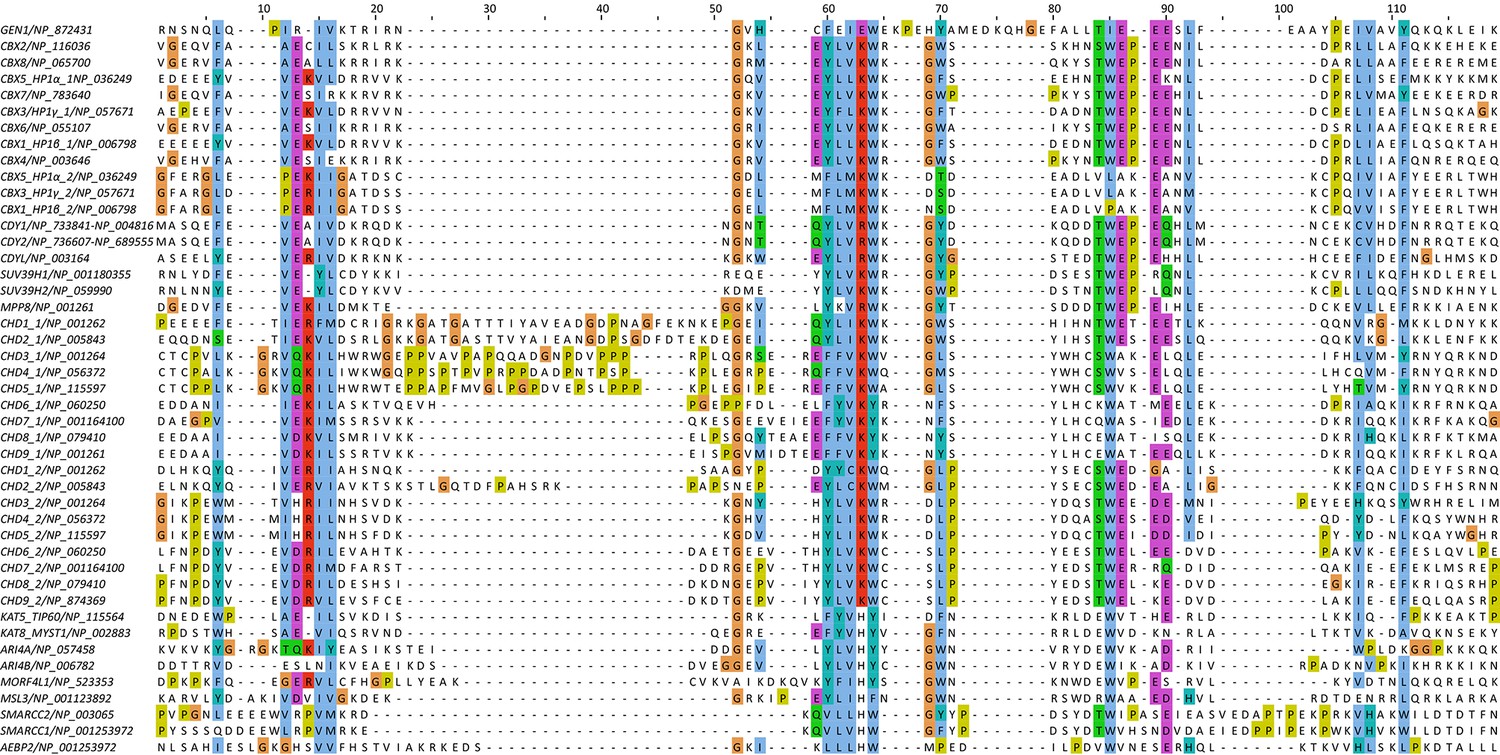
(A) Sequence alignment of GEN1 chromodomains from different organisms: hsGEN1 (Homo sapiens), clGEN1 (Canis lupus), mmGEN1 (Mus musculus), drGEN1 (Danio rerio), atGEN1/2 (Arabidopsis thaliana), cgGEN1 (Crassostrea gigas), scYEN1 (Saccharomyces cerevisiae). The presence of a chromodomain is conserved from yeast to human with Caenorhabditis elegans as an exception. Secondary structure elements of the GEN1 chromodomain are shown on top. The sequence coloring is based on a similarity matrix (BLOSUM62). The corresponding positions of the DNA-interaction site in human GEN1 is marked with a red box and residues of the aromatic cage are highlighted with a yellow box. (B) GEN1 has a canonical chromodomain fold of three antiparallel beta-sheets packed against an α-helix. (C) The arrangement of the aromatic cage in GEN1 is comparable to other chromodomains but less aromatic and slightly larger. (D) The superposition of different chromodomains places cognate binding peptides of hsMPP8 and mmCBX7 (and others) into the aromatic cage. (E) The aromatic cage of GEN1 is closed by helix α15. Panels B–D show the chromodomains of hsGEN1 (pink, PDB 5t9j), hsCBX3 (gray, PDB 3kup) hsSUV39H1 (green, PDB 3mts), hsMPP8 (yellow, PDB 3lwe), dmHP1a (orange, chromo shadow PDB 3p7j), dmRHINO (cyan, PDB 4quc/3r93), mmCBX7 (light blue, PDB 4x3s; compare Figure 3—source data 1). (F) Phylogenetic tree of all known human chromodomains. GEN1 is distantly related to the CBX chromo-shadow domains and CDY chromodomains. The corresponding alignment for calculating the phylogenetic tree is shown in Figure 3—figure supplement 1. GEN1 is colored in black, chromobox (CBX) proteins are colored in red, interspersed by SUV39H histone acetylases (orange) and chromodomain Y-linked (CDY) proteins (yellow). Chromo-barrel domain proteins are colored in green and chromodomain-helicase DNA-binding (CHD) proteins are in blue. Chromodomains and chromo-shadow domains from the same protein are labeled with 1 and 2, respectively. Stable branches with boostrap values equal or higher than 0.8 are marked with a black dot. The binding of the GEN1 chromodomain to a set of histone peptides was tested but no interaction was detected (Figure 3—source data 2 and Figure 3—figure supplement 2).
-
Figure 3—source data 1
Proteins found in a DALI search.
Top hits found in a DALI search for protein structure comparison with the human GEN1 chromodomain (residues 390–464) against the Protein Data Bank. The most similar unique chromodomains are listed.
- https://doi.org/10.7554/eLife.12256.008
-
Figure 3—source data 2
N-terminally fluorescein-labeled peptides used for chromodomain binding assays.
- https://doi.org/10.7554/eLife.12256.009
Figure 3—figure supplement 1
Sequence alignment of all known human chromodomains.
The alignment was used to calculate the phylogenetic tree in Figure 3F. Colors follow the CLUSTAL X coloring scheme.
Figure 3—figure supplement 2

Histone peptide pull-down assay.
Nickel resin-immobilized GEN1 chromodomain was incubated with the mixtures of fluorescein-labeled histone peptides, washed, bound peptides eluted and separated by 20% SDS-PAGE. Mix 1 and 2 did not show any binding, and non-specific binding to the resin was found with Mix 3. The smearing of the bands is due to the small size of the peptides (~1.5 kDa). I, C and E represent input, resin control and elution, respectively. Mix 1: H3K9, H3K9me1, H3K9me2, and H3K9me3. Mix 2: H3K27, H3K27me1, H3K27me2, and H3K27me3. Mix 3: H3K36me1, H3K36me2, H3K36me3, and H3K36Ac.
Figure 4
DNA interactions in the GEN1-DNA complex.
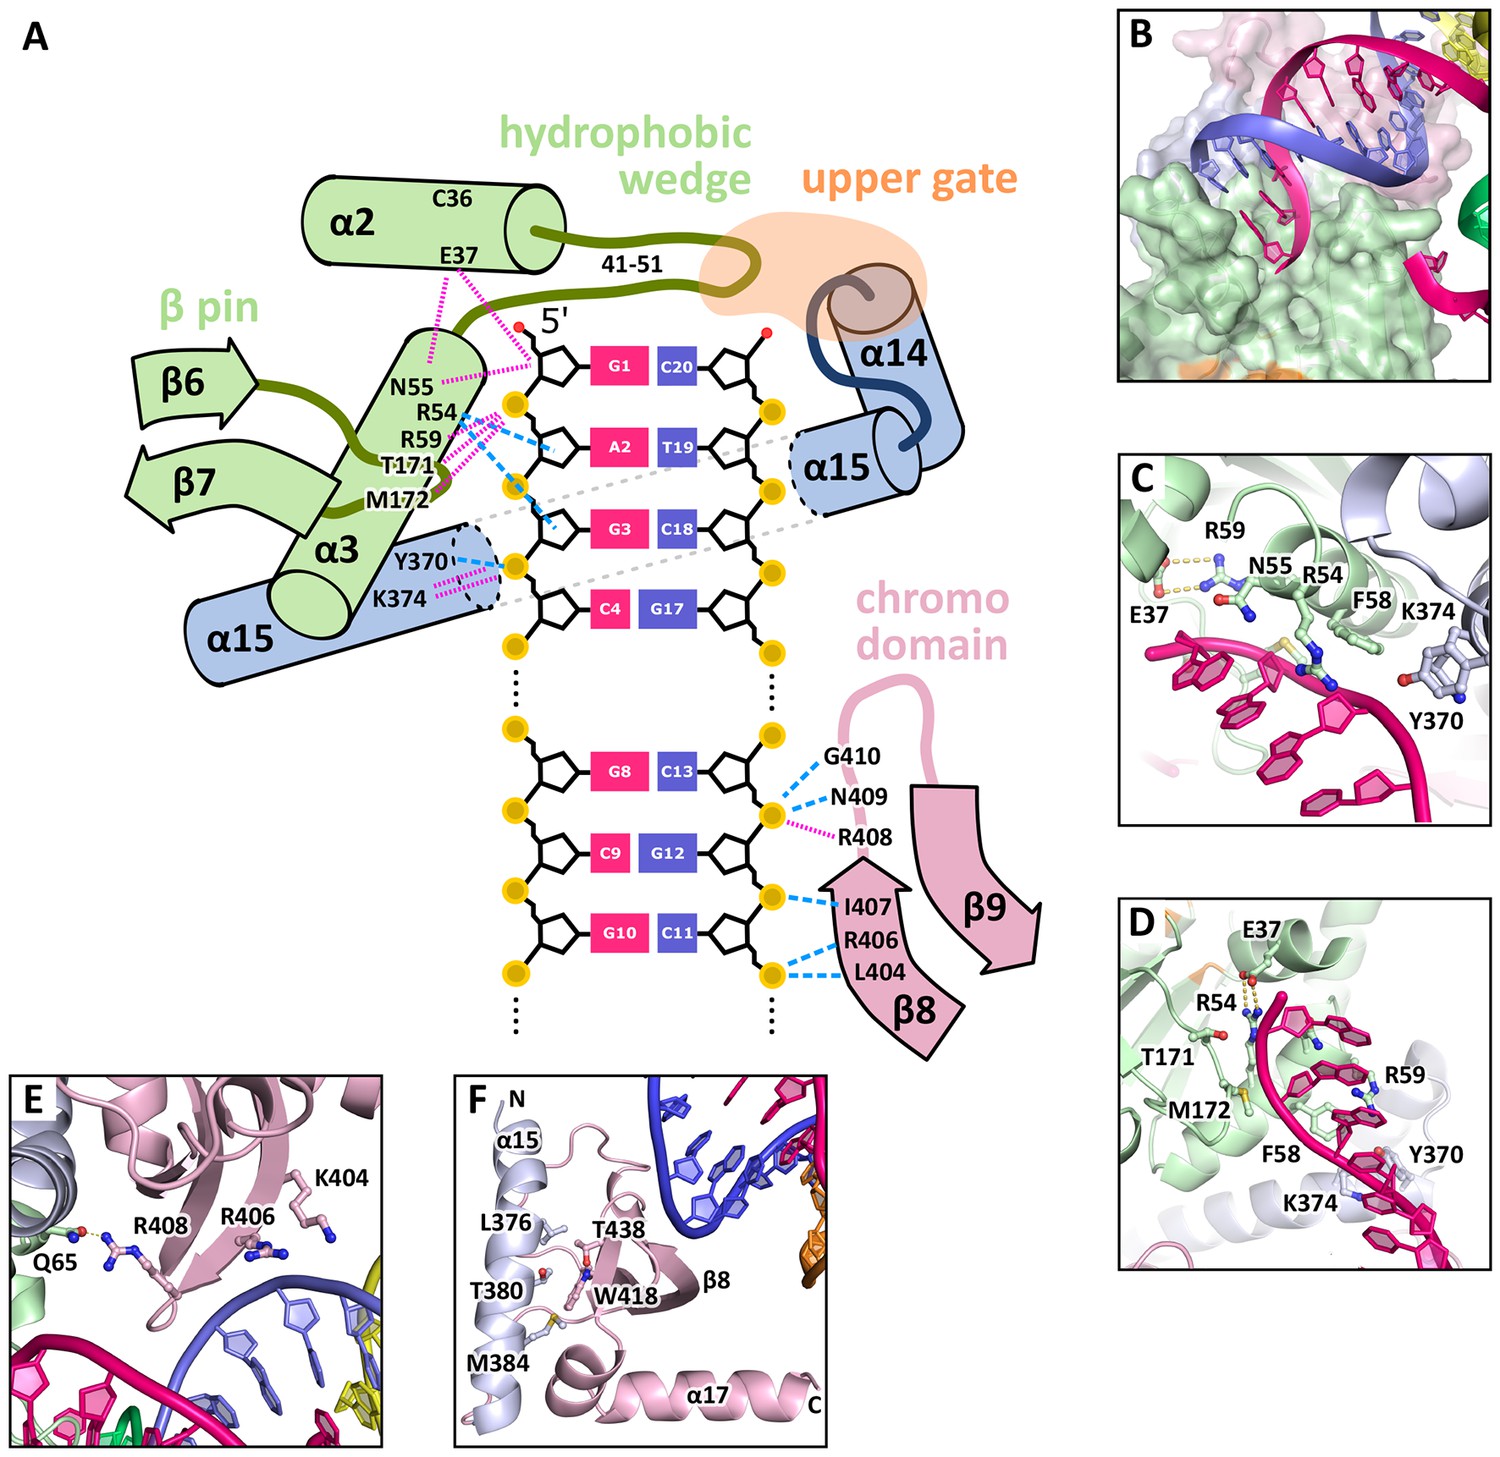
(A) Schematic of the GEN1-DNA interactions at the upstream interface. The coloring is the same as in Figure 1. The nuclease core (green and blue) interacts with the uncleaved strand and the chromodomain (pink) contacts the complementary strand. Hydrogen bonds are shown with blue dashed lines and van-der-Waals contacts are in red dotted lines. (B) Interactions at the hydrophobic wedge. The end of the DNA double helix docks onto the hydrophobic wedge formed by helices α2 and α3. (C/D) Interactions with the uncleaved strand in two views. All key residues form sequence-independent contacts to the DNA backbone. R54 reaches into the minor groove of the DNA. The complementary DNA strand has been removed for clarity (E/F) Interactions of the chromodomain with the complementary strand in two views. The backbone of residues 406–410 (β-hairpin β8-β9) abuts the DNA backbone. R406 has a supporting role in the interaction and R408 forms a polar interaction with Q65, which establishes a connection between the chromodomain and the nuclease core. Helix α15 makes hydrophobic interactions with the aromatic cage and thus blocks it.
Figure 5 with 3 supplements
Functional analysis of GEN1.
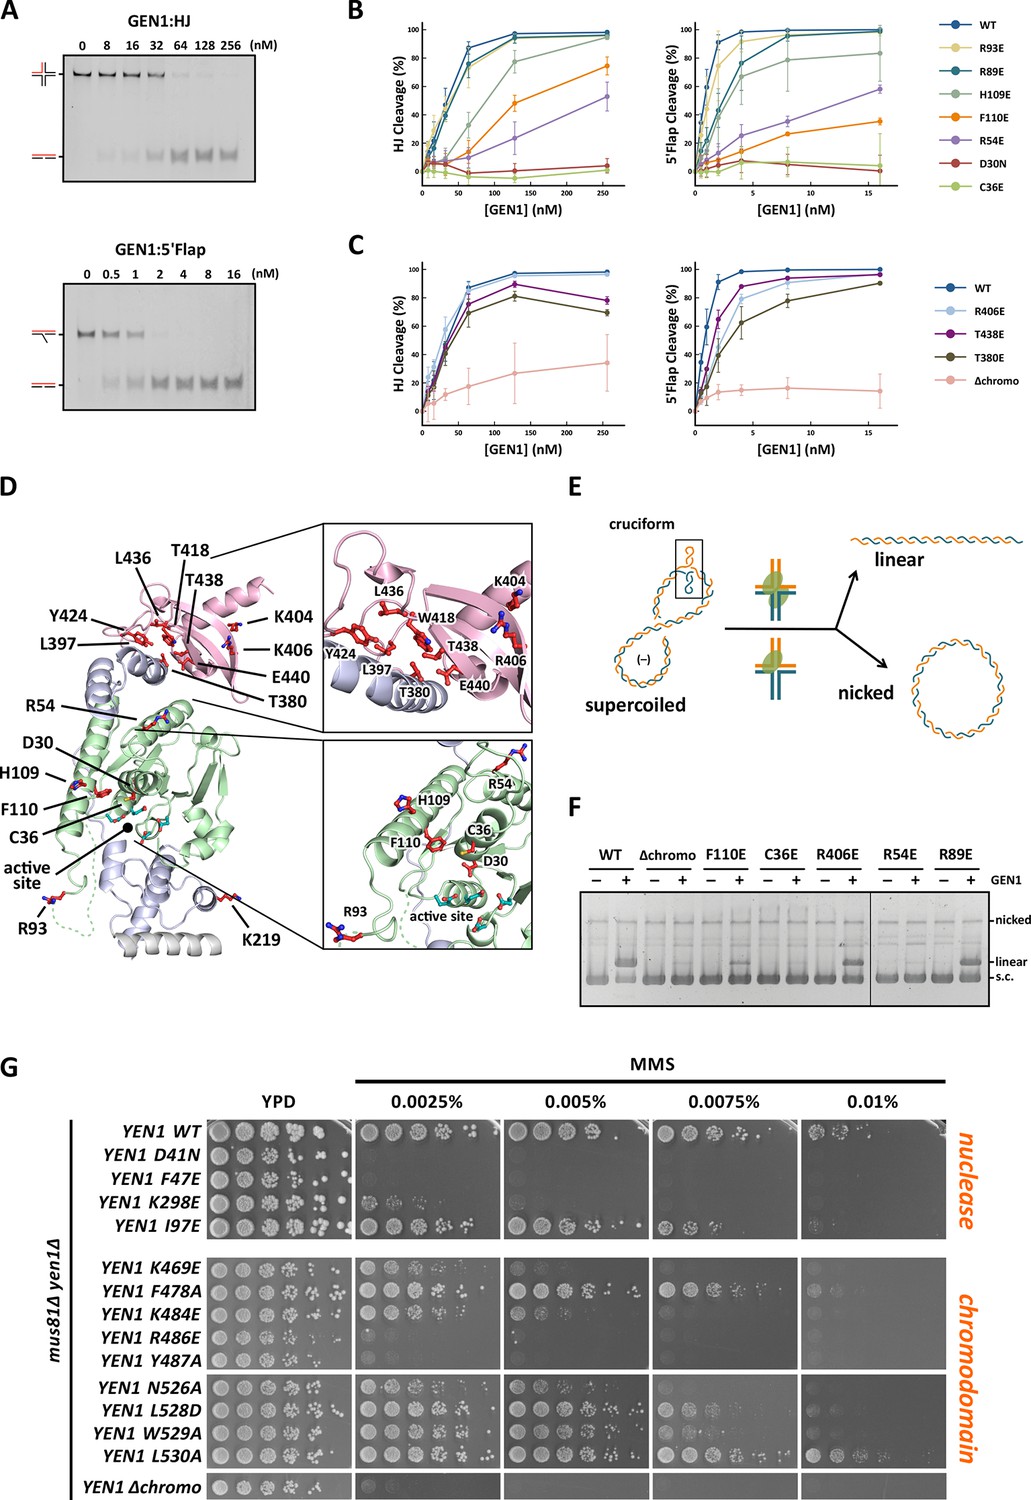
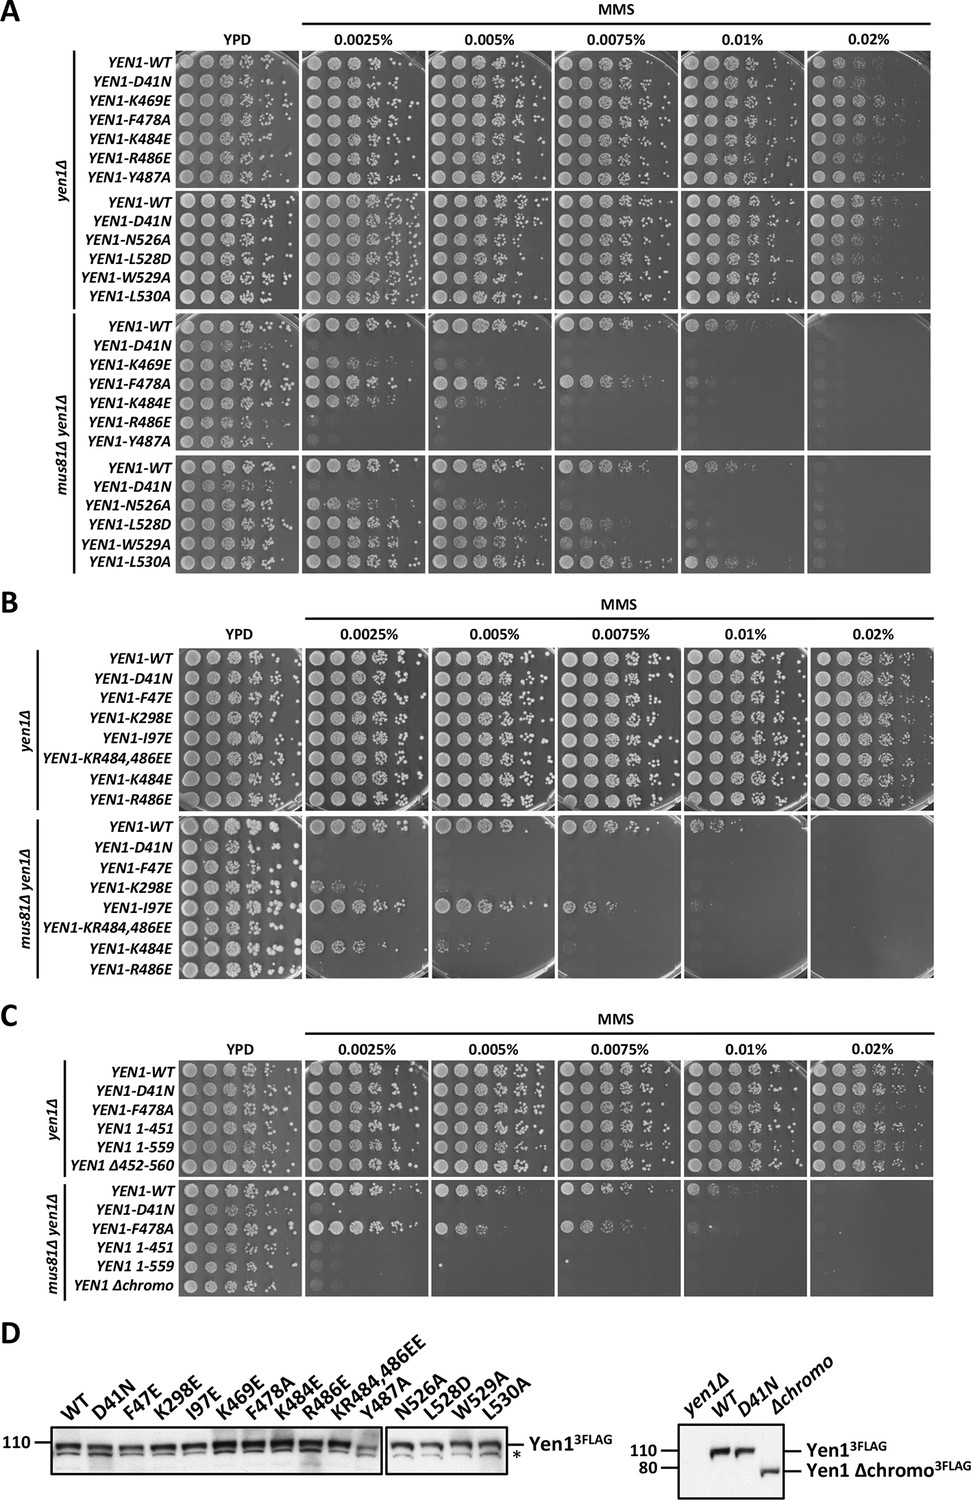
(A) Nuclease activity of GEN1 with HJ and 5’flap DNA. 40 nM 5’ 6FAM-labeled substrates were mixed with indicated amounts of GEN1. Reactions were carried out at 37°C for 15 min, products were separated by native PAGE and analyzed with a phosphoimager. Figure 5—source data 1 gives the sequences of DNA oligos used in biochemical assays and Figure 5—source data 3 shows activity measurements. (B) Quantification of nuclease assays of wild type GEN1 and variants with mutated residues located at the protein-DNA interfaces. Percentage of cleavage was plotted against the enzyme concentration. Error bars depict the standard deviation calculated from at least three independent experiments. Figure 5—figure supplement 1 shows representative gels from the PAGE analysis. (C) Quantification of nuclease assays of wild type GEN1 and variants with mutated residues located at the chromodomain. Error bars depict the standard deviation calculated from at least three independent experiments. Figure 5—figure supplement 2 shows representative gels from the PAGE analysis. (D) GEN1 mutations used in this study. Locations of human GEN1 mutations used in biochemical assays and corresponding residues in yeast MMS survival assays are highlighted in red. Active site residues E134, E136, D155, D157 are marked in turquoise. (E) Schematic of the cruciform plasmid cleavage assay. A cruciform structure can be formed in plasmid pIRbke8mut, which harbors an inverted-repeat sequence and is stabilized by negative supercoiling. Introducing two cuts across the junction point within the lifetime of the resolvase-junction complex yields linear products whereas sequential cleavage generates nicked products and the relaxed plasmid cannot be a substrate for the next cleavage. (F) Cruciform plasmid cleavage assay with different GEN1 variants. Plasmid pIRbke8mut was treated with 256 nM GEN1 each and reactions were carried out at 37°C for 15 min. Supercoiled, linear and nicked plasmids were separated by native agarose gel electrophoresis and visualized with SYBR safe under UV light. (G) MMS survival assays with yeast yen1 variants. The survival of yen1 mutants was tested under a yen1Δ mus81Δ background with indicated amounts of MMS. The top part shows mutations at GEN1-DNA interfaces and the bottom part mutations at the chromodomain (compare Figure 5—figure supplement 3 for all controls and expression tests). Figure 5—source data 2 gives a list of all yeast strains.
-
Figure 5—source data 1
Oligonucleotides used in biochemical assays.
Four-way junctions were prepared by annealing CB209, CB210, CB211, CB212. 5’ flaps were prepared by annealing CB209, CB212, and CB218. The annealing protocol is described in Material and methods.
- https://doi.org/10.7554/eLife.12256.014
-
Figure 5—source data 2
Yeast strains used for MMS survival assays.
- https://doi.org/10.7554/eLife.12256.015
-
Figure 5—source data 3
In vitro activity measurements of different GEN12-505 variants.
- https://doi.org/10.7554/eLife.12256.016
Figure 5—figure supplement 1

DNA cleavage assays of different GEN1 mutations.
All GEN12-505 mutations were generated by site-directed mutagenesis and purified with the same procedure. Experiments were repeated three times and a representative gel picture is shown for each protein variant in Figure 5.
Figure 5—figure supplement 2
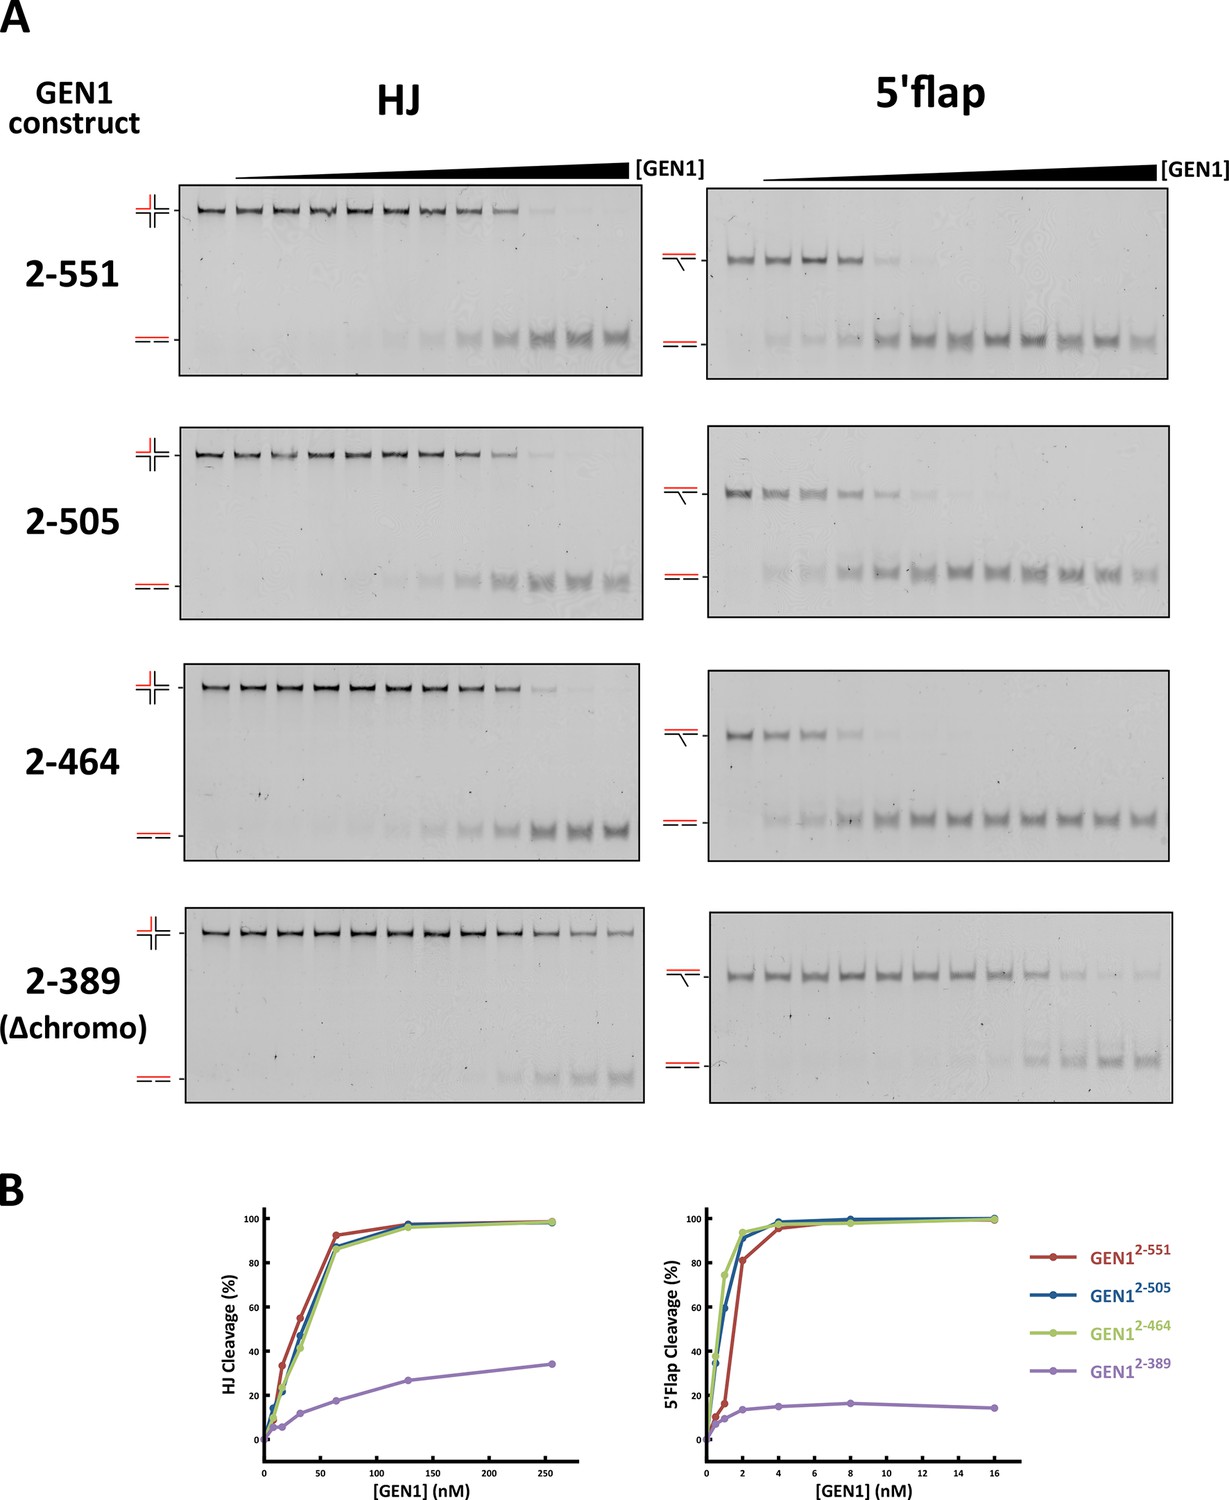
DNA cleavage assays of different GEN1 fragments.
(A) 5’ 6FAM labeled four-way junction or 5’flap DNA (40 nM) were mixed with varying concentrations of GEN1 truncations (0.25, 0.5, 1, 2, 4, 8, 16, 32, 64, 128, 256 nM, respectively). (B) Quantification of activity assays.
Figure 5—figure supplement 3
MMS survival assays with yeast yen1 mutants.
The survival of yen1 mutants was tested in a yen1Δ or yen1Δ mus81Δ background with indicated amounts of MMS (compare Figure 5 and Figure 5—source data 2). Mus81 overlaps with Yen1 functionally, therefore yen1Δ knock-out strains are fully viable even in the presence of MMS, and hypersensitivity is only seen in the double knock-out. (A) Mutations in the chromodomain. (B) Mutations at protein-DNA interfaces. (C) Yen1 truncations and chromodomain deletion. (D) Protein expression test (Western Blot analysis) of 3FLAG tagged Yen1 variants. Asterisk denotes a cross-reactive band.
Figure 6
Substrate recognition features of GEN1.
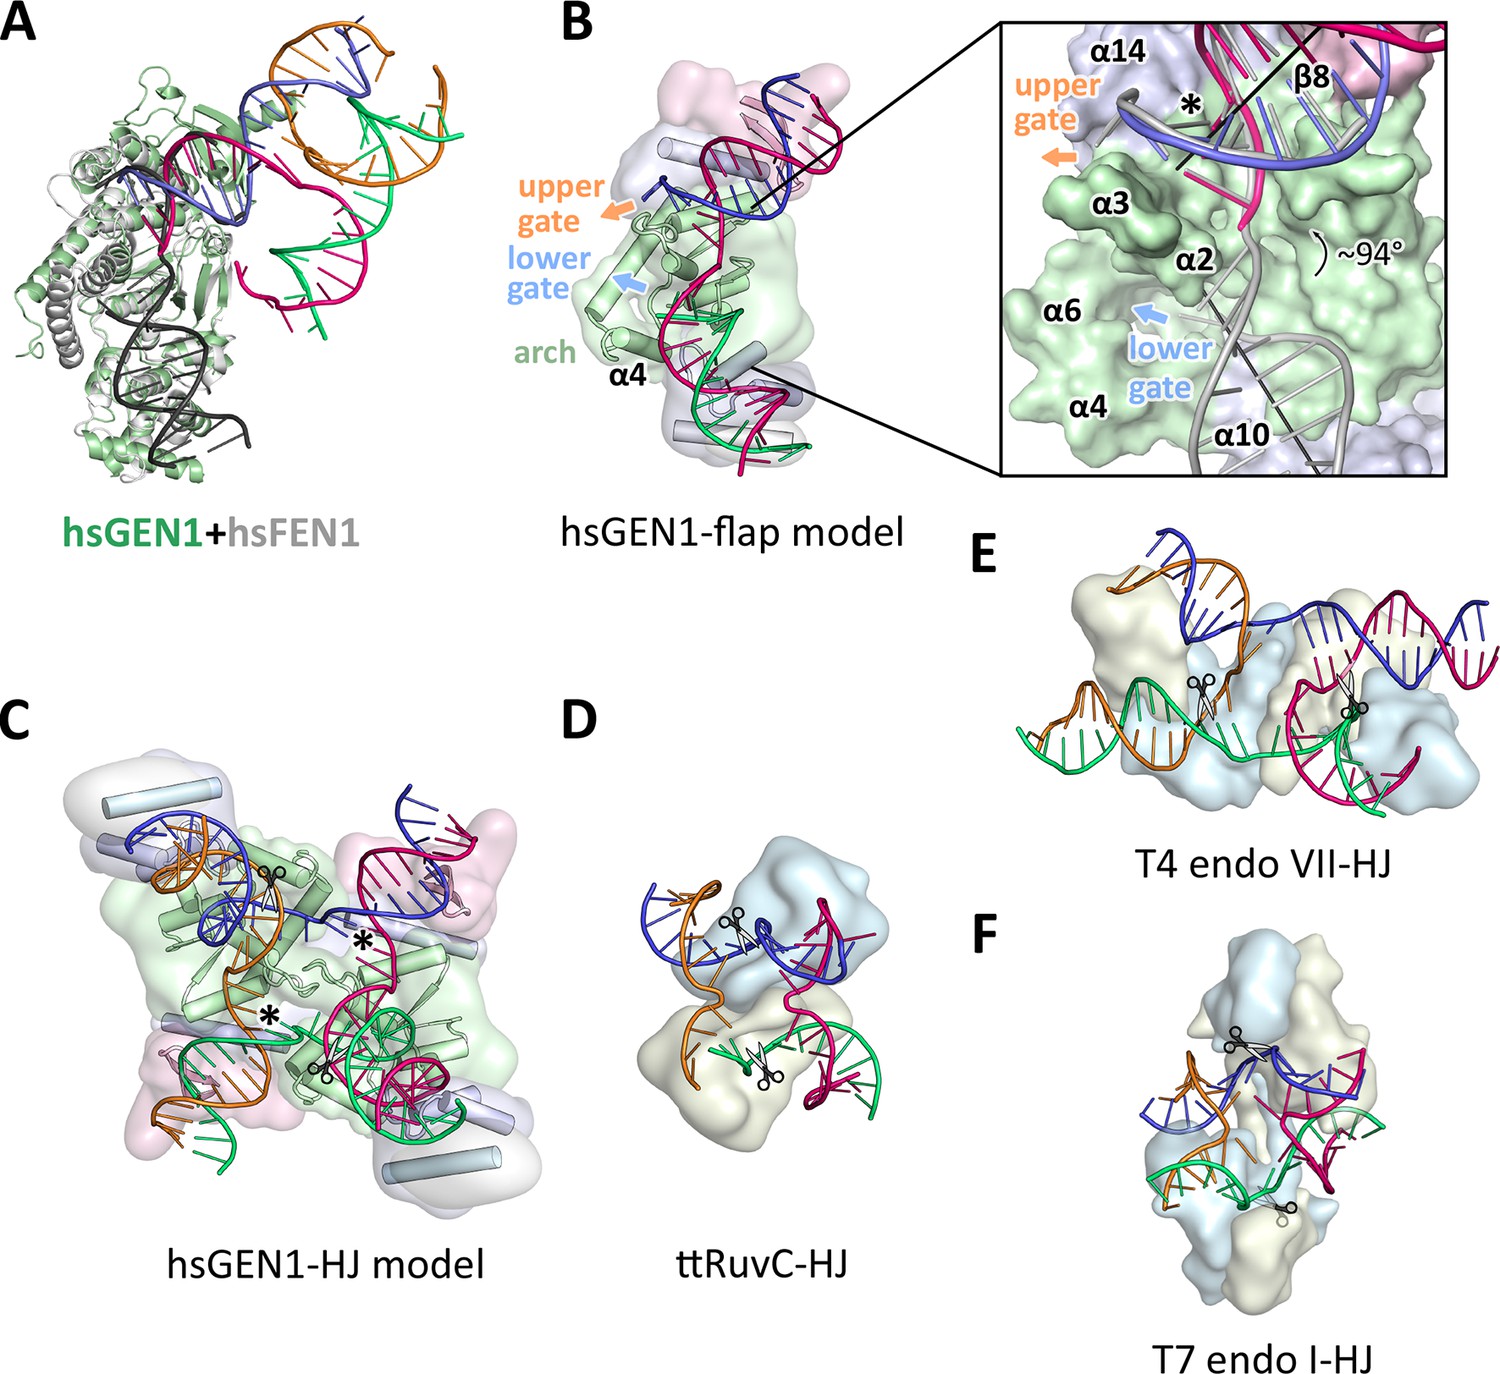
(A) Superposition of the protein part of the FEN1-DNA complex (PDB 3q8k, protein in gray, DNA in black) onto the GEN1-HJ complex (protein in green and the DNA strands in different colors). The FEN1-DNA aligns with the same register as the GEN1-DNA at the upstream interface. (B) Model for the recognition of a 5’ flap substrate by GEN1. The DNA was extended using the superimposition from A. Homology modeling suggests an additional helix α4 (disordered residues 79–92) forming an arch with helix α6. The protein is shown in a simplified surface representation with the same colors as in Figure 1 and structural elements are highlighted. The insert shows a zoomed in view of the hydrophobic wedge with the modeled FEN1-DNA in gray. (C) Model for the dimerization of GEN1 upon binding to a HJ substrate based on the 5’ flap model in B. The monomers interlock via both arches (α4-α6) and the hydrophobic wedges (α2-α3) contact each other. (D) Structure of the Thermus thermophilus RuvC-HJ complex (PDB 4ld0). (E) Structure of the T4 endonuclease VII-HJ complex (PDB 2qnc). (F) Structure of the T7 endonuclease I-HJ complex (PDB 2pfj). Individual monomers are in surface representation, colored in light blue and beige, respectively. DNA strands are shown as ladders in different colors.
Tables
Table 1
Data collection and refinement statistics.
| Data Set | G505-4w006native | G505-4w006Ta peak | G505-4w006SeMet peak |
|---|---|---|---|
| Diffraction Data Statistics | |||
| Synchrotron Beamline | SLS PXII | SLS PXII | SLS PXII |
| Wavelength | 0.99995 | 1.25473 | 0.97894 |
| Resolution (Å) | 75-3.0 | 75.4-3.8 | 43.6-4.4 |
| Space Group | P 32 | P 32 | P 32 |
| Cell dimensions |
|
|
|
| a (Å) | 86.94 | 87.06 | 87.11 |
| b (Å) | 86.94 | 87.06 | 87.11 |
| c (Å) | 200.72 | 201.30 | 199.69 |
| α (°) | 90 | 90 | 90 |
| β (°) | 90 | 90 | 90 |
| γ (°) | 120 | 120 | 120 |
| I/σI* | 18.4 (1.9) | 27.49 (5.83) | 16.58 (3.82) |
| Completeness (%)* | 99.8 (98.8) | 99.6 (97.3) | 97.3 (83.3) |
| Redundancy* | 6.3 | 10.2 | 5.1 |
| Rsym (%)* | 6.2 (90.7) | 7.7 (42.2) | 6.9 (43.4) |
| Refinement Statistics | |||
| Resolution (Å) | 75-3.0 |
|
|
| Number of Reflections | 33933 |
|
|
| Rwork/Rfree | 0.199/0.241 |
|
|
| Number of Atoms |
|
|
|
| Protein | 6298 |
|
|
| DNA | 1589 |
|
|
| Water/Solutes | 27 |
|
|
| B-factors |
|
|
|
| Protein | 123.4 |
|
|
| DNA | 150.2 |
|
|
| Water/Solutes | 92.6 |
|
|
| R.M.S Deviations |
|
|
|
| Bond lengths (Å) | 0.010 |
|
|
| Bond Angles (°) | 0.623 |
|
|
| Ramachandran Plot |
|
|
|
| Preferred | 753 (97.9 %) |
|
|
| Allowed | 16 (2.1%) |
|
|
-
*Values for the highest resolution shell are shown in parenthesis
Download links
A two-part list of links to download the article, or parts of the article, in various formats.
Downloads (link to download the article as PDF)
Open citations (links to open the citations from this article in various online reference manager services)
Cite this article (links to download the citations from this article in formats compatible with various reference manager tools)
Human Holliday junction resolvase GEN1 uses a chromodomain for efficient DNA recognition and cleavage
eLife 4:e12256.
https://doi.org/10.7554/eLife.12256


