Behavioral training promotes multiple adaptive processes following acute hearing loss
- University of Oxford, United Kingdom
Figures
Figure 1 with 2 supplements

Effect of training on localization of broadband noise stimuli in the horizontal plane by monaurally deprived human listeners.
(A) When one of these sounds is presented on one side of the head, it will be louder and arrive earlier at the ipsilateral ear (blue), producing interaural time and level differences, which are respectively the primary cues to sound location at low and high frequencies. (B) Because of acoustic filtering by the head and ears, the spectrum of a sound at the tympanic membrane (post-filtering, color) differs from that of the original sound (pre-filtering, black) and varies with location (amplitude in dB is plotted as a function of frequency; color indicates different locations). These spectral cues make it possible to localize sounds using a single ear, but only for sounds that have relatively flat spectra (solid lines) and are sufficiently broadband (shape of spectra in narrow frequency bands varies little with location – see shaded gray region). When spectral features are artificially added to the pre-filtered sound source (dotted lines), these added features can be misattributed to the filtering effects of the head and ears. This produces sound localization errors (e.g. dotted green spectrum is more easily confused with solid turquoise spectrum because of additional peak at high frequencies). The extent of these errors allows us to infer subjects’ reliance on spectral cues. (C, D) Joint distribution of stimulus and response obtained from the first (C) and last (D) training session for an individual subject with an earplug in the right ear. Grayscale indicates the number of trials corresponding to each stimulus-response combination. Data are shown for trials on which flat-spectrum stimuli were used (i.e. all spatial cues were available). (E) Sound localization performance (% correct) as a function of training session for the same subject. Scores for each session (dots) were fitted using linear regression (lines) to calculate slope values, which quantified the rate of adaptation. Relative to flat-spectrum stimuli (blue), much less adaptation occurred with random-spectrum stimuli (pink), which limit the usefulness of spectral cues to sound location (Figure 1—figure supplement 1). (F) Adaptation rate is shown for flat- and random-spectrum stimuli for each subject (gray lines; n = 11). Positive values indicate improvements in localization performance with training. Mean adaptation rates across subjects (± bootstrapped 95% confidence intervals) are shown in blue and pink. Similar results are observed if front-back errors are excluded and changes in error magnitude are calculated (Figure 1—figure supplement 2). Dotted black lines indicate adaptation rates observed previously in humans (Kumpik et al., 2010; total adaptation reported divided by number of sessions, n = 8).
Figure 1—figure supplement 1
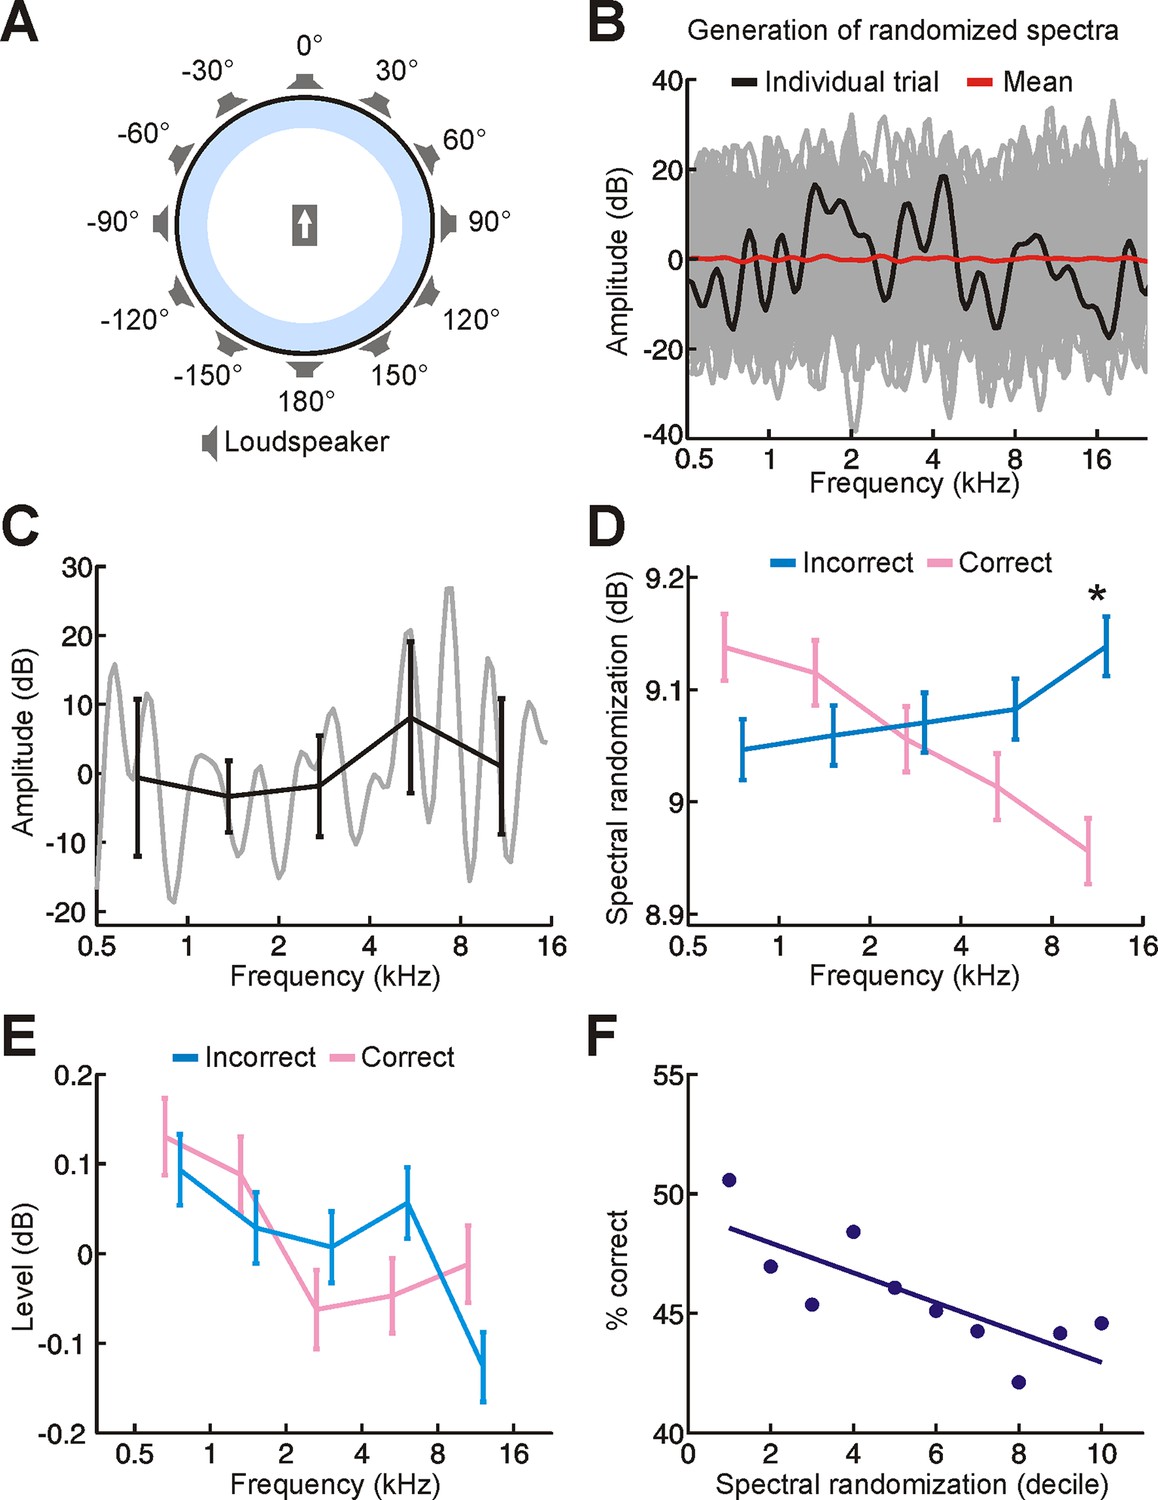
Experimental setup and stimuli.
(A) Schematic illustrating the circular loudspeaker array used for sound localization training. Subjects sat at the centre of this array, facing in the direction indicated by the arrow. (B) Spectral profile for a random-spectrum stimulus (black). Spectra were filtered to eliminate abrupt spectral transitions to which the auditory system is insensitive (see Materials and methods). The overall amount of spectral randomization was also fixed on each trial (SD = 10 dB). Although the spectrum varied considerably across trials (many different examples are shown in gray), the mean spectrum was relatively flat (red). (C) Our randomization procedure allowed us to set the amount of randomization and overall level of each stimulus, but these parameters could still vary within individual frequency bands. We can measure this for a single stimulus by dividing its spectrum (gray) into one-octave bands and calculating the mean ± SD amplitude values for each band (black). This indicates that the level (mean) and amount of randomization (SD) of each frequency band fluctuates on each trial. (D,E) To determine whether these differences have an impact on sound localization, we compared the random-spectrum stimuli presented on correct (pink) and incorrect (blue) trials. Relative to mislocalized stimuli, we found that the amount of spectral randomization was smaller for correctly localized stimuli, but only at higher frequencies (D, indicated by asterisk; significant interaction between frequency and correctness of response, P < 0.001, ANOVA; P < 0.05, post hoc test). In other words, the spectra of correctly-localized sounds tended to be relatively flat at high frequencies. No differences in sound level were observed between stimuli on correct and incorrect trials (E). Data show mean ± SEM. (F) To understand the implications of this for sound localization, we subdivided trials into groups (deciles) based on the amount of spectral randomization at high frequencies (1st decile represents 10% of trials with the smallest amount of spectral randomization) and quantified sound localization accuracy (% correct) for each group. This indicates that some of our random-spectrum stimuli were more difficult to localize than others, with performance declining as spectral randomization increased at high frequencies. It also supports the view that increasing amounts of spectral randomization progressively degrade the usefulness of spectral cues, which are most prominent at high frequencies.
Figure 1—figure supplement 2

Effect of training on localization by human listeners of broadband stimuli using same analysis method as for narrowband stimuli in Figure 2.
(A–D) Joint distributions of stimulus and response obtained from the first (A,C) and last (B,D) training sessions for flat- (A,B) and random-spectrum (C,D) stimuli. Data are shown for an individual subject wearing an earplug in the left ear, with grayscale indicating the number of trials corresponding to each stimulus-response combination. Stimulus- and response-locations in the front and rear hemifields have been collapsed to provide a measure of sound localization that is insensitive to front-back errors. (E) Mean error magnitude plotted as a function of training session for the same subject shown in A-D. Data are plotted separately for flat- (turquoise) and random-spectrum (red) stimuli. Scores for each session (dots) were fitted using linear regression (lines) to calculate slope values, which quantified the change in error magnitude (Δ error) with training. Improved performance was associated with a reduction in error magnitude, producing negative values for Δ error. (F) Δ error for flat- and random-spectrum stimuli plotted for each subject (gray lines; n = 11). Mean values for Δ error across subjects ( ± bootstrapped 95% confidence intervals) are shown in color. Adaptation occurs for both flat- and random-spectrum stimuli (Δ error values are significantly <0; p<0.01, bootstrap test), but the extent of adaptation is greater for flat-spectrum stimuli (p<0.01, bootstrap test on the within-subject differences in Δ error). (G) Bias in sound localization responses plotted as a function of training session for the subject in E. Positive values indicate that responses were biased toward the side of the open ear. Data are plotted separately for flat- (turquoise) and random-spectrum (red) stimuli. Scores for each session (dots) were fitted using linear regression (lines) to calculate slope values, which quantified the change in response bias (Δ bias) with training. Negative values of Δ bias indicate an adaptive shift in response bias toward the side of the plugged ear. (H) Δ bias for flat- and random-spectrum stimuli plotted for each subject (gray lines; n = 11). Mean values for Δ bias across subjects ( ± bootstrapped 95% confidence intervals) are shown in color. No changes in bias were observed for either stimulus type (Δ bias values do not deviate significantly from 0;p>0.05, bootstrap test).
Figure 2
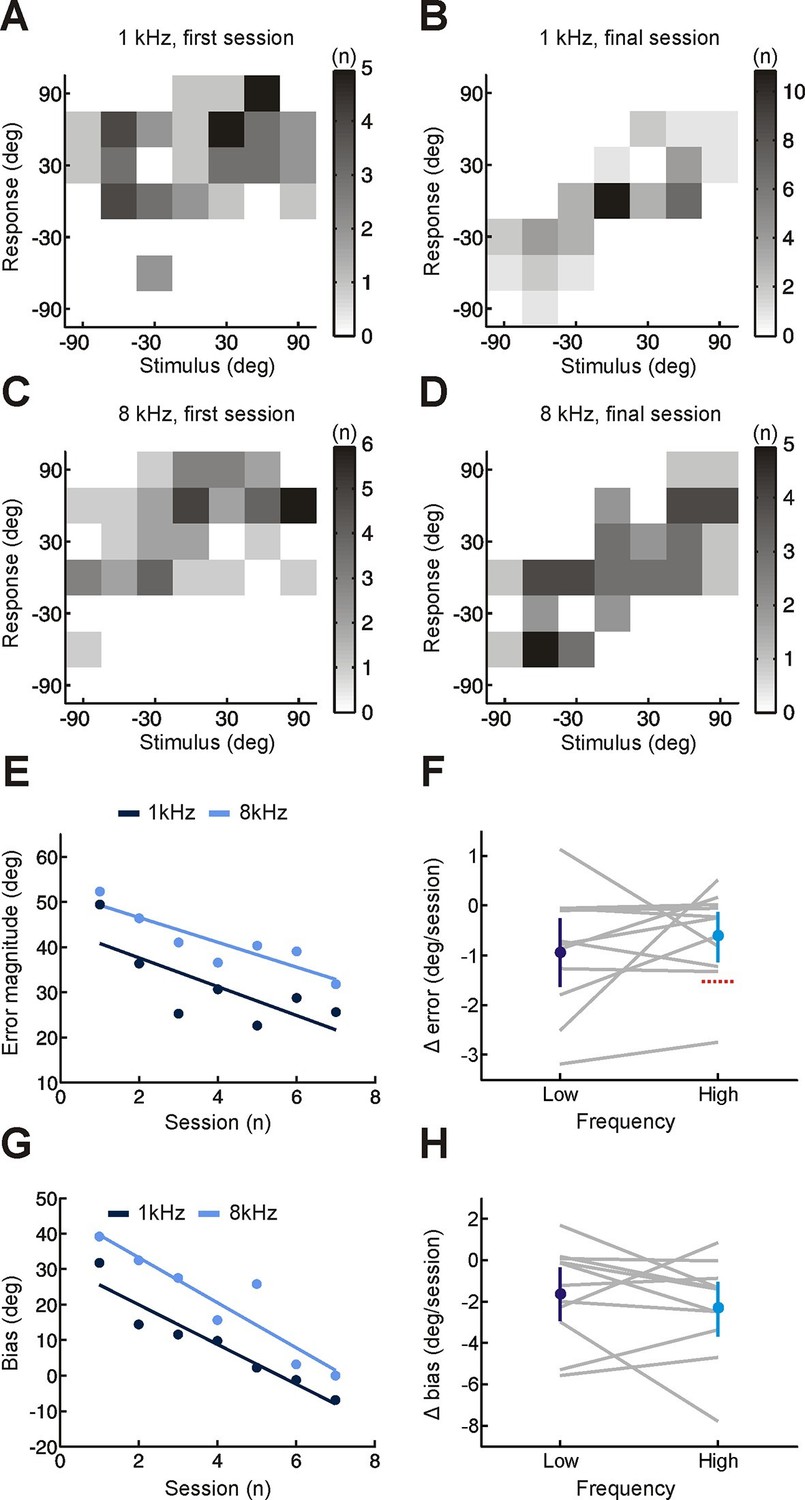
Effect of training on localization of pure tone stimuli in the horizontal plane by monaurally deprived human listeners.
(A–D) Joint distributions of stimulus and response obtained from the first (A,C) and last (B,D) training sessions for low- (A,B) and high-frequency (C,D) tones. Data are shown for an individual subject wearing an earplug in the left ear, with grayscale indicating the number of trials corresponding to each stimulus-response combination. Because pure tones can be accurately localized only by using binaural spatial cues, which are susceptible to front-back errors, data from the front and rear hemifields have been collapsed. (E) Mean error magnitude plotted as a function of training session for the same subject shown in A–D. Data are plotted separately for low- (1 kHz, dark blue) and high-frequency (8 kHz, light blue) tones. Scores for each session (dots) were fitted using linear regression (lines) to calculate slope values, which quantified the change in error magnitude (Δ error) with training. Improved performance was associated with a reduction in error magnitude, producing negative values for Δ error. (F) Δ error for low- and high-frequency tones plotted for each subject (gray lines; n = 11). Mean values for Δ error across subjects (± bootstrapped 95% confidence intervals) are shown in blue. Although there are pronounced individual differences for the adaptation observed at the two tone frequencies, almost all values are <0, indicating that error magnitude declined over the training sessions. Dotted red line shows Δ error values that would have been observed if subjects had adapted as well as ferrets reared with a unilateral earplug (Keating et al. 2015; total Δ error reported for ferrets was divided by the number of training sessions used in the present study, n = 7; normalization used in previous work has been removed to facilitate comparison). (G) Bias in sound localization responses plotted as a function of training session for the subject in E. Positive values indicate that responses were biased toward the side of the open ear. Data are plotted separately for low- (1 kHz, dark blue) and high-frequency (8 kHz, light blue) tones. Scores for each session (dots) were fitted using linear regression (lines) to calculate slope values, which quantified the change in response bias (Δ bias) with training. Negative values of Δ bias indicate a shift in response bias toward the side of the plugged ear. (H) Δ bias for low- and high-frequency tones plotted for each subject (gray lines; n = 11). Mean values for Δ bias across subjects (± bootstrapped 95% confidence intervals) are shown in blue.
Figure 3 with 2 supplements
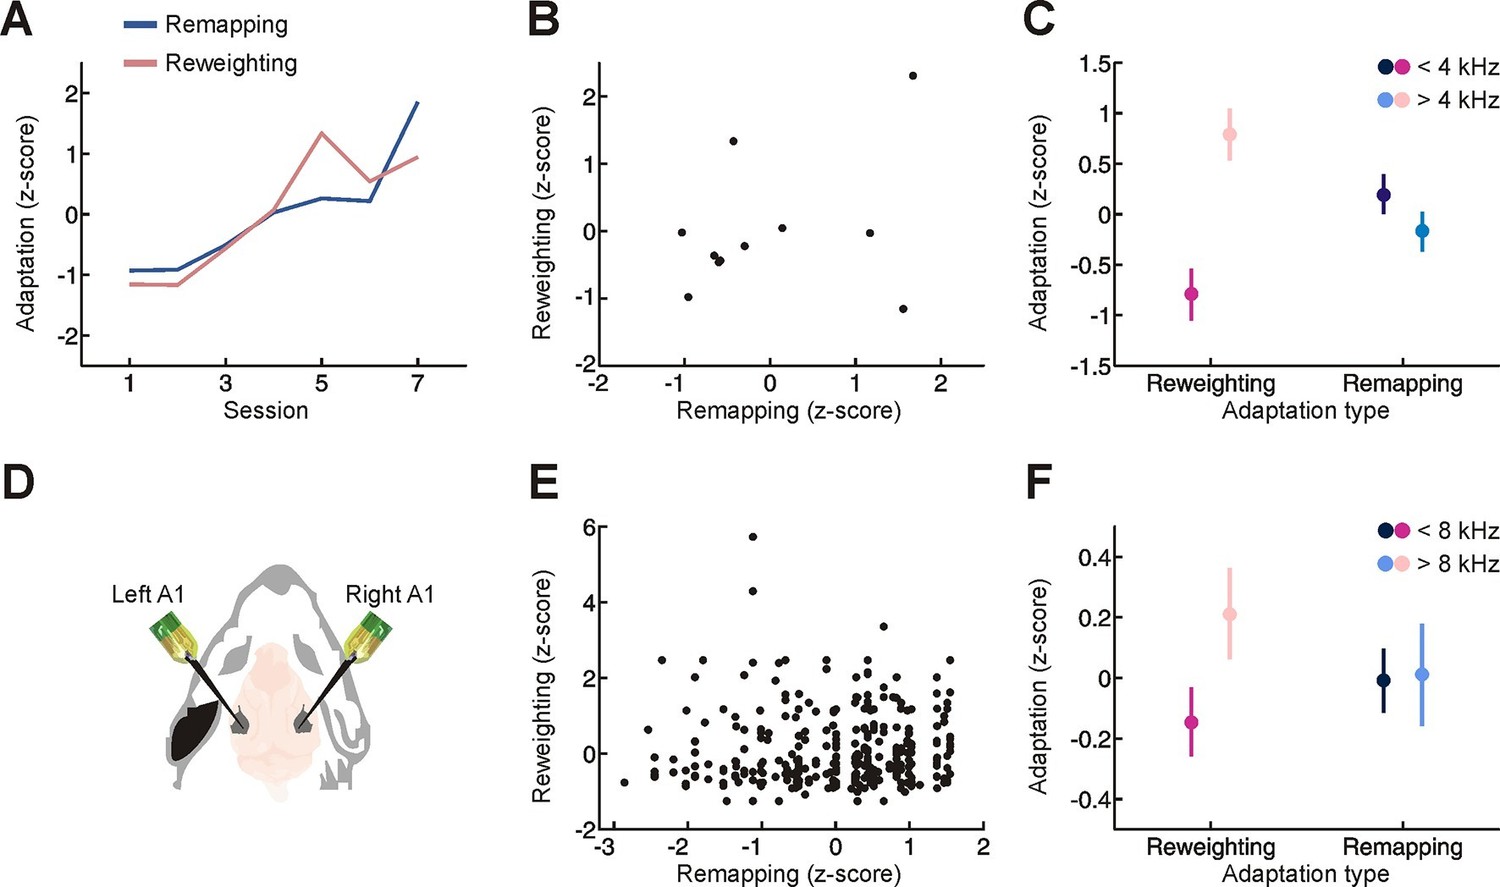
Relationship between different adaptive processes.
(A) Time-course of behavioral adaptation for adult humans, measured by the amount of cue reweighting (pink) and remapping (blue). Data are normalized (z scores) to facilitate comparison between different adaptation measures. All data have been averaged across subjects. (B) Comparison between the amount of behavioral cue reweighting and remapping for individual human subjects (black dots; n = 11). Variation in the degree of adaptation across subjects was not attributable to differences in earplug effectiveness (Figure 3—figure supplement 1). (C) Amount of cue remapping (blue) and cue reweighting (pink) observed at frequencies above (lighter shades) and below (darker shades) 4 kHz. Greater reweighting of spectral cues (more positive values) is observed >4 kHz, which is where spectral cues are most prominent in humans. Frequency-specific measures of cue reweighting were determined using reverse correlation (see Materials and methods, Figure 3—figure supplement 2). (D) Bilateral extracellular recordings were performed in the primary auditory cortex of ferrets reared with an earplug in one ear. These data were then compared with controls to obtain measures of cue reweighting and cue remapping (see Materials and methods). (E) Cue reweighting versus cue remapping, with each dot representing either a single neuron or small multi-unit cluster (n = 505). (F) Amount of cue remapping (blue) and cue reweighting (pink) observed for neurons tuned to frequencies above (lighter shades) or below (darker shades) 8 kHz. To facilitate comparison between measures of cue reweighting and remapping at different frequencies, these values were normalized separately so that they each had an overall mean of 0 and a variance of 1. Greater reweighting of spectral cues (more positive values) is observed > 8 kHz, which is where spectral cues are most prominent in ferrets. Relative to humans, spectral cues in ferrets are shifted toward higher frequencies because of differences in head and external ear morphology.
Figure 3—figure supplement 1
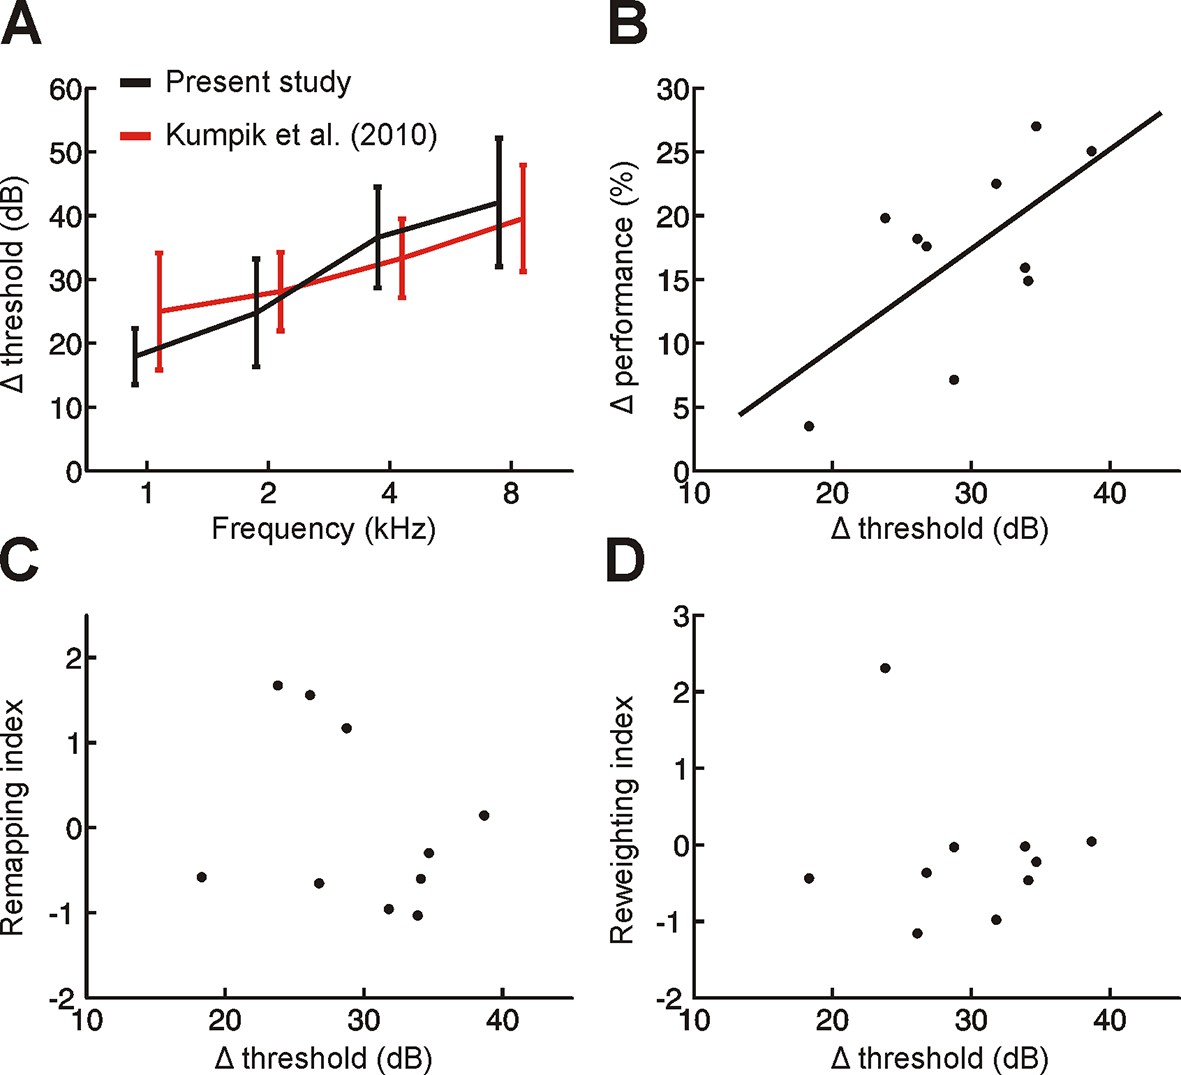
Variation across subjects in the degree of adaptation to acute asymmetric hearing loss is not related to differences in earplug effectiveness.
(A) Effect of earplug on mean hearing threshold (Δ threshold ± SD) is plotted as a function of frequency. Positive values indicate thresholds were higher when an earplug was worn. Data from Kumpik et al. (2010) are replotted (red) alongside those from the present study (black). For visualization purposes, symmetric displacements along the x-axis have been introduced to each dataset. (B) A significant correlation (p<0.05) was observed between Δ threshold and the initial drop in sound localization performance when an earplug was worn during the first training session (Δ performance; change in% correct relative to normal hearing conditions averaged across all stimulus types). In other words, initial sound localization deficits were more extensive when the earplug produced greater attenuation. Each dot represents an individual subject. (C,D) No obvious relationship was observed between Δ threshold and the degree of remapping (C) or reweighting (D) observed in individual subjects (dots).
Figure 3—figure supplement 2
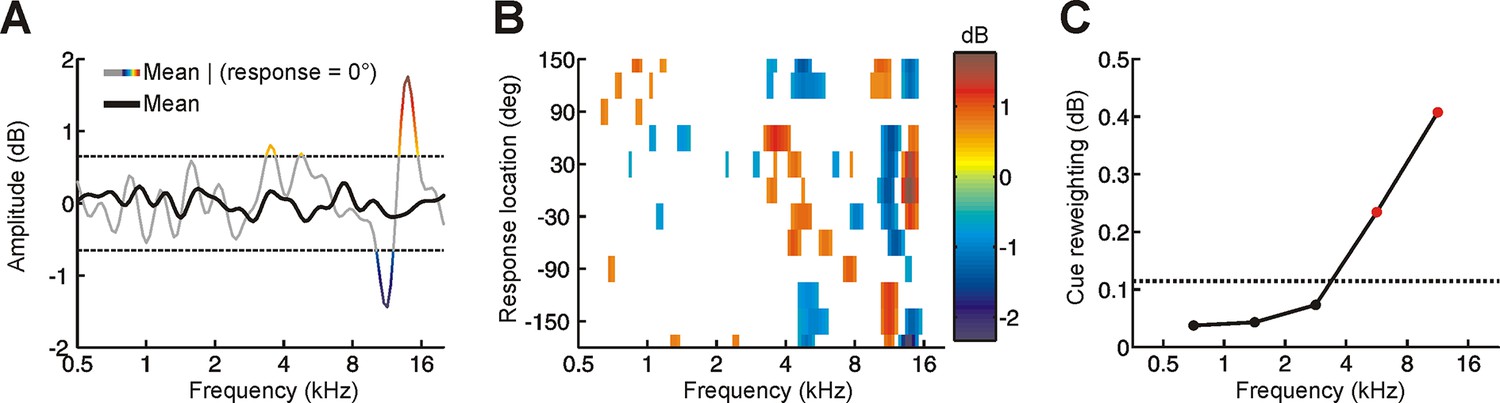
Determining the behavioral importance of spectral features at different frequencies using reverse correlation.
(A) Although the mean spectrum of random-spectrum stimuli was close to zero when averaged across all trials (black), distinct spectral features emerged when averaging was restricted to trials on which subjects responded to a particular location (gray/color). This provides insight into which spectral features influence sound localization behavior. To reduce the noise in this estimate, a threshold was applied (mean ± 1.5 SD, dashed lines) and this process was repeated for each response location to construct a reverse correlation map. (B) Reverse correlation map showing the mean stimulus spectrum associated with each response location. Color is proportional to spectral amplitude, as illustrated in A. In order to quantify the behavioral importance of spectral features in different frequency bands, we calculated the ‘feature strength’ by averaging the unsigned magnitude of these spectral features across locations. (C) Cue reweighting plotted as a function of frequency. Cue reweighting was estimated by calculating training-induced changes in feature strength (i.e. feature strength values obtained in the first session were subtracted from those obtained in subsequent sessions; these differences in feature strength were then averaged). Positive cue reweighting values indicate an increase in feature strength, which reflects increased behavioral importance of spectral cues. Dotted line shows the upper 95% confidence interval for cue reweighting values that would be expected under the null hypothesis that cue reweighting did not occur. Values above this line (red symbols) indicate cue reweighting values that are significantly greater than chance.
Download links
A two-part list of links to download the article, or parts of the article, in various formats.
Downloads (link to download the article as PDF)
Open citations (links to open the citations from this article in various online reference manager services)
Cite this article (links to download the citations from this article in formats compatible with various reference manager tools)
Behavioral training promotes multiple adaptive processes following acute hearing loss
eLife 5:e12264.
https://doi.org/10.7554/eLife.12264


