NuMA-microtubule interactions are critical for spindle orientation and the morphogenesis of diverse epidermal structures
- Duke University Medical Center, United States
Figures
Figure 1 with 2 supplements
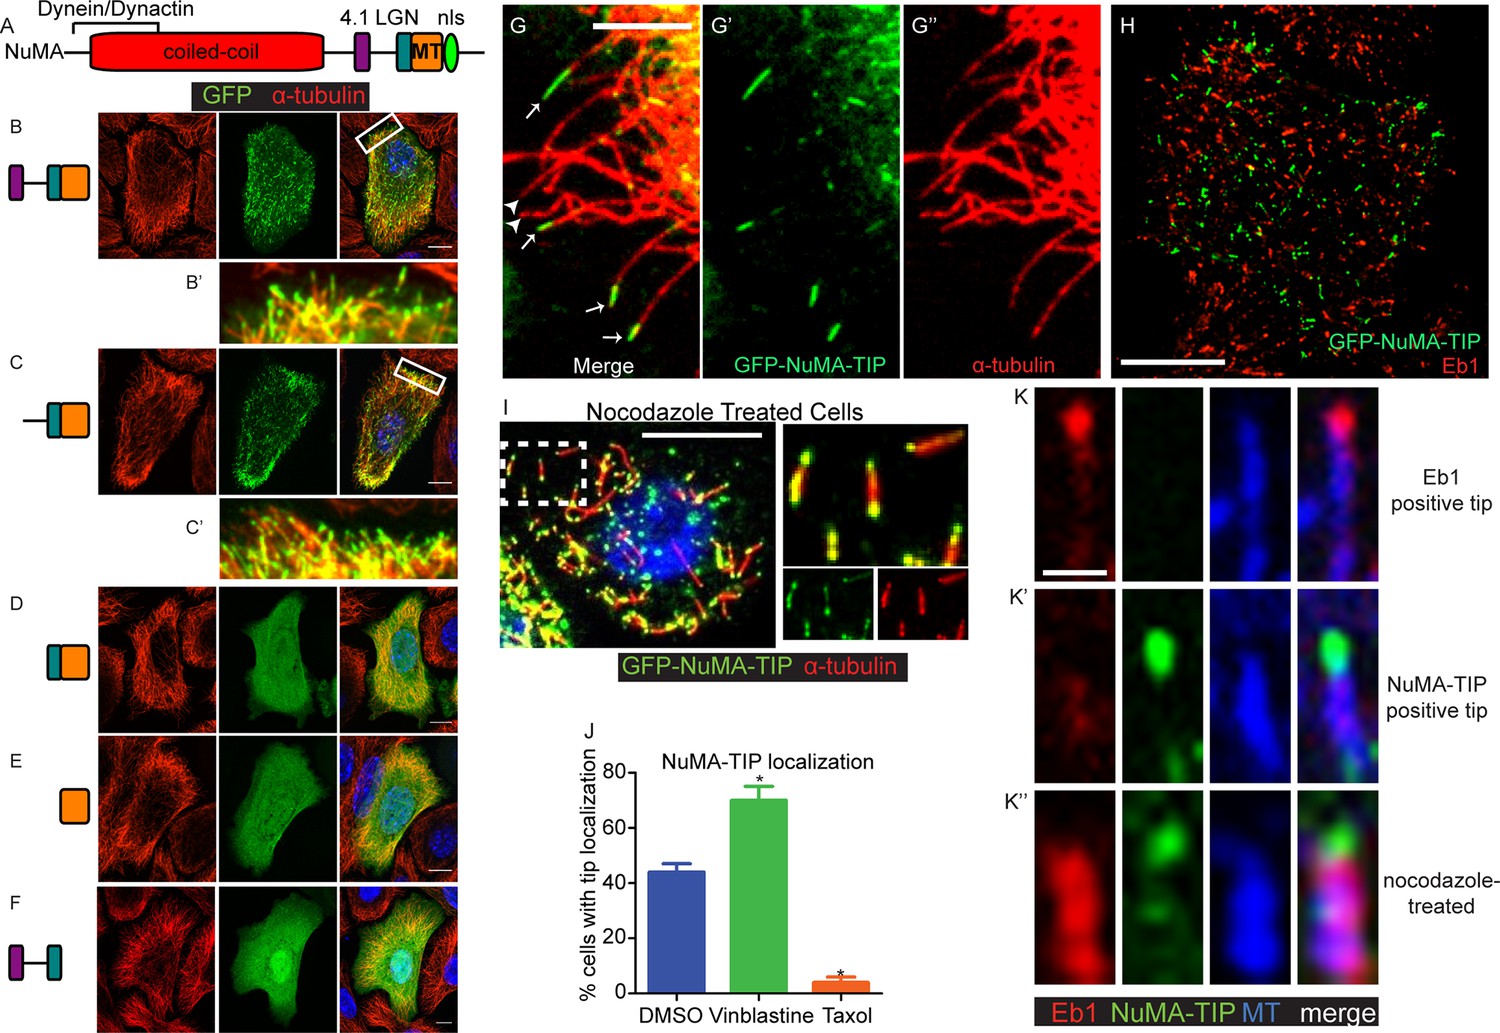
NuMA localizes to microtubule tips.
(A) Diagram of NuMA showing interaction domains for dynein/dynactin, 4.1 family proteins, LGN, and MTs as well as the nuclear localization sequence (NLS). (B–F) Visualization of GFP-tagged NuMA constructs (as diagrammed) and α-tubulin (red) in cultured mouse keratinocytes. All cells displayed expressed GFP constructs at low levels. (B’ and C’) are zoomed-in views displaying the punctate localization of these constructs along MTs and MT tips. (G–G’’) Co-localization of GFP-NuMA-TIP with MT ends (arrows) at the periphery of a cultured keratinocyte. Arrowheads indicate MT tips that lack NuMA-TIP label (scale bar, 5 μm). (H) Keratinocytes were transfected with GFP-NuMA-TIP and then fixed and stained for Eb1 (red). Note the lack of co-localization between NuMA-TIP and Eb1 puncta. (I) Keratinocytes were treated with 10 μM nocodazole for 15 min and then fixed before visualizing GFP-NuMA-TIP and MTs (red). Images on right show a higher magnification view of NuMA-TIP localizing to both ends of shortened MTs. (J) Quantitation of the percent of cells showing GFP-NuMA-TIP localization to MT tips following drug treatments (only low-expressing cells were analyzed). Keratinocytes were treated with either DMSO, 2 nM vinblastine, or 10 μM taxol (n>100 cells each, p<0.05 for each treatment relative to control). (K–K’’) Three-color staining for Eb1 (red), GFP-NuMA-TIP (green) and MTs (blue) in either untreated keratinocytes (top 2 panel rows) or nocodazole treated keratinocytes (bottom panels). Scale bar is 0.5 μm. Unless noted, all scale bars are 10 μm. MT, microtubule.
Figure 1—figure supplement 1
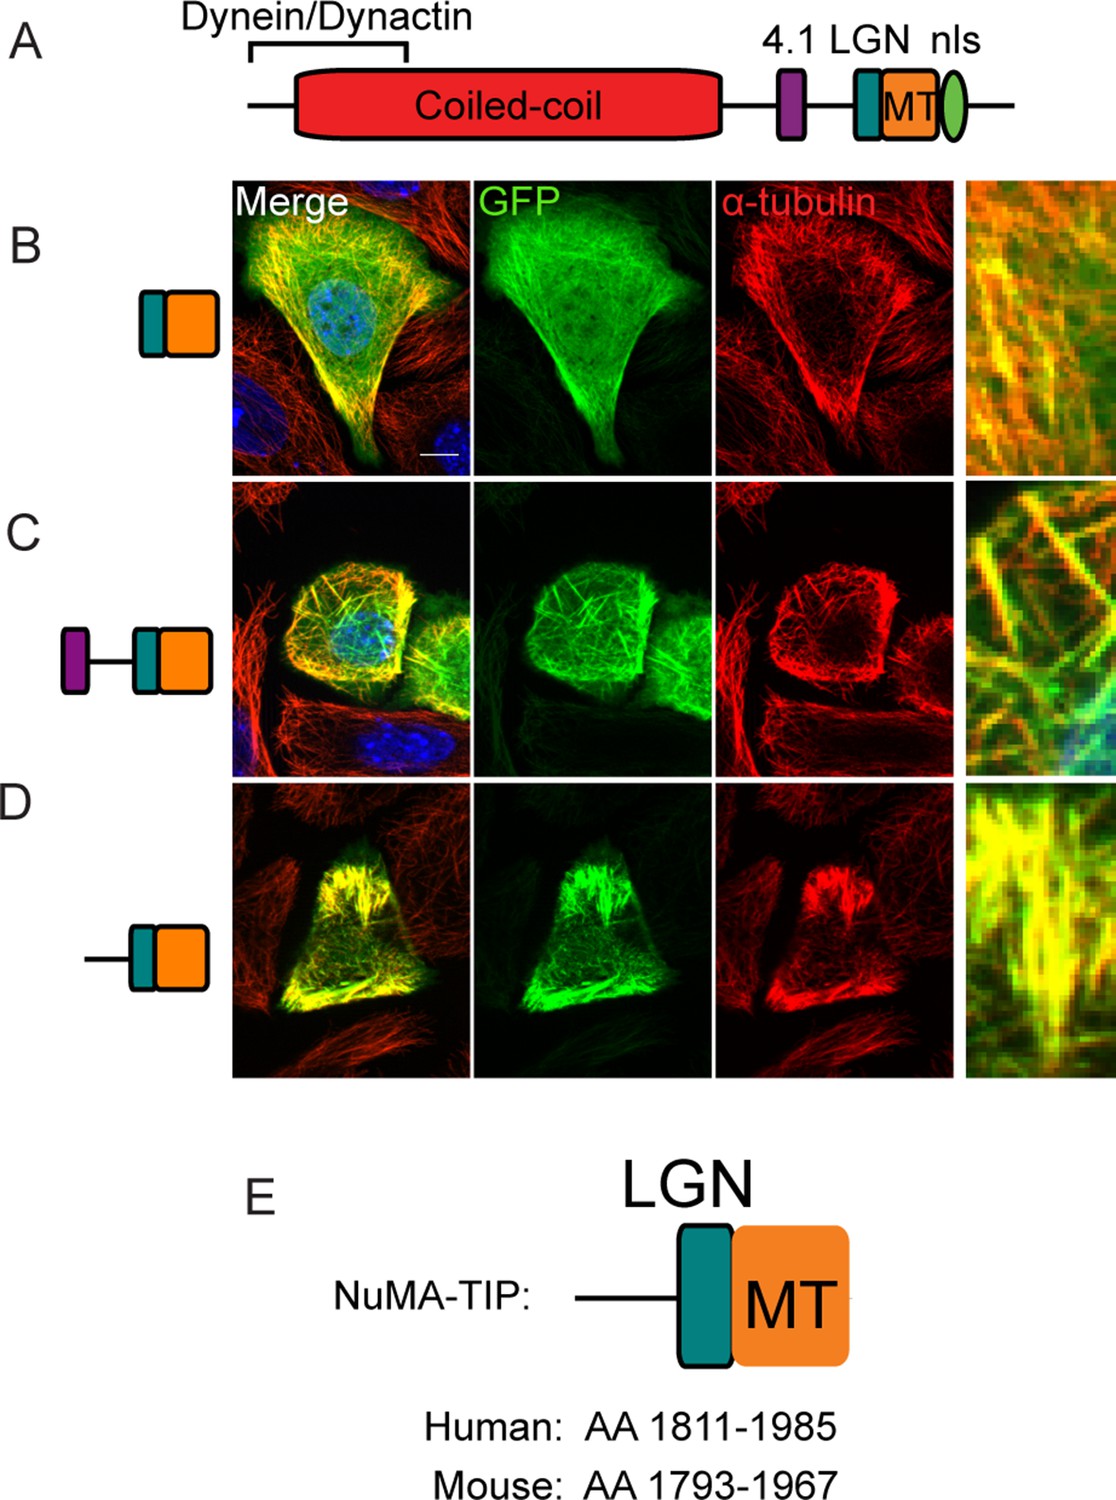
Localization of NuMA fragments when highly expressed.
(A) Diagram of NuMA indicating protein-protein interaction domains. (B–D) GFP-tagged NuMA fragments, as diagrammed, were expressed in cultured mouse keratinocytes. Cells were fixed and stained with anti-α-tubulin antibodies (red). All these images are representative for cells showing high levels of expression of the transgene (scale bars, 10 μm). (E) Diagram of NuMA-TIP as well as the amino acids that this region spans in both human and mouse NuMA.
Figure 1—figure supplement 2
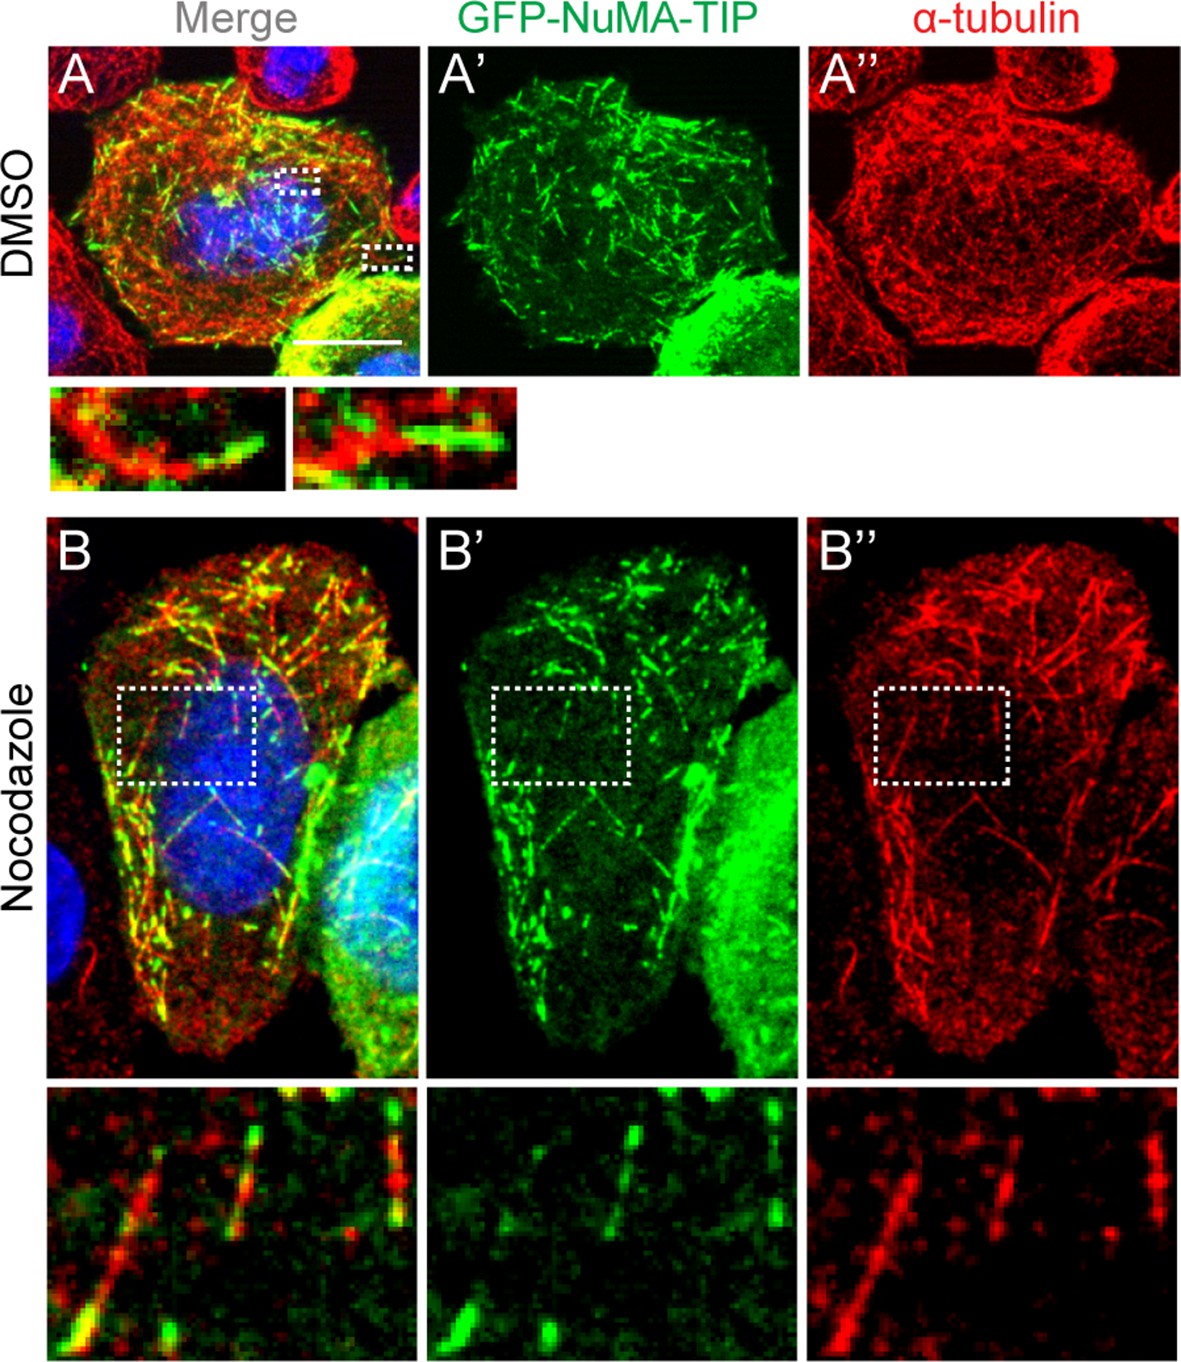
HeLa cells transfected with GFP-NuMA-TIP were then treated with either DMSO (A) or 10 μM nocodazole (B), fixed and stained with anti-α-tubulin antibodies (red).
Insets present zoomed-in views of NuMA-TIP at MT tips. Scale bars are 10 μm.
Figure 2 with 1 supplement
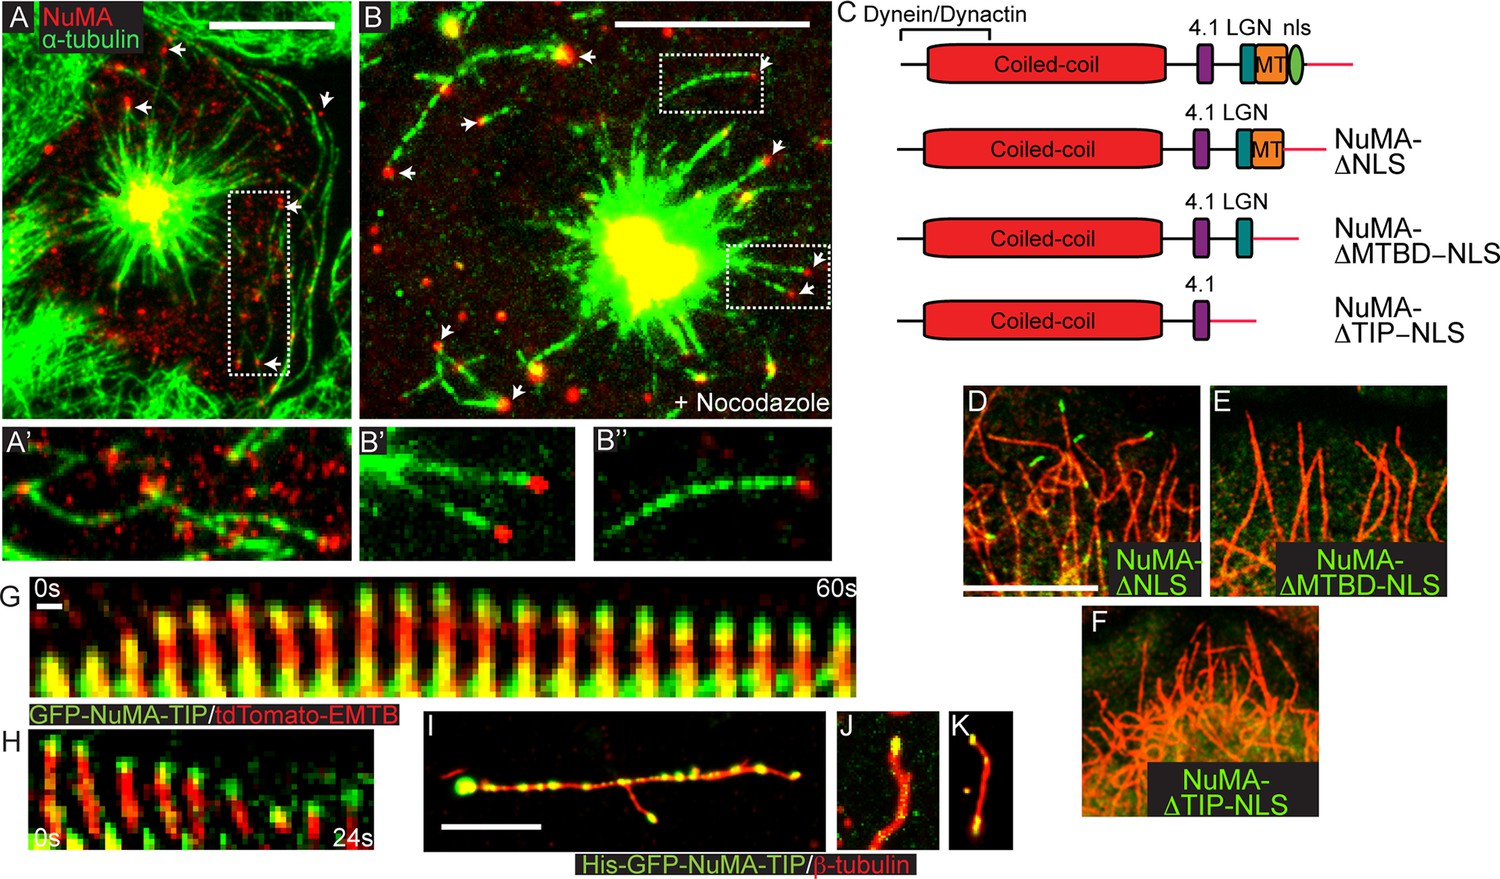
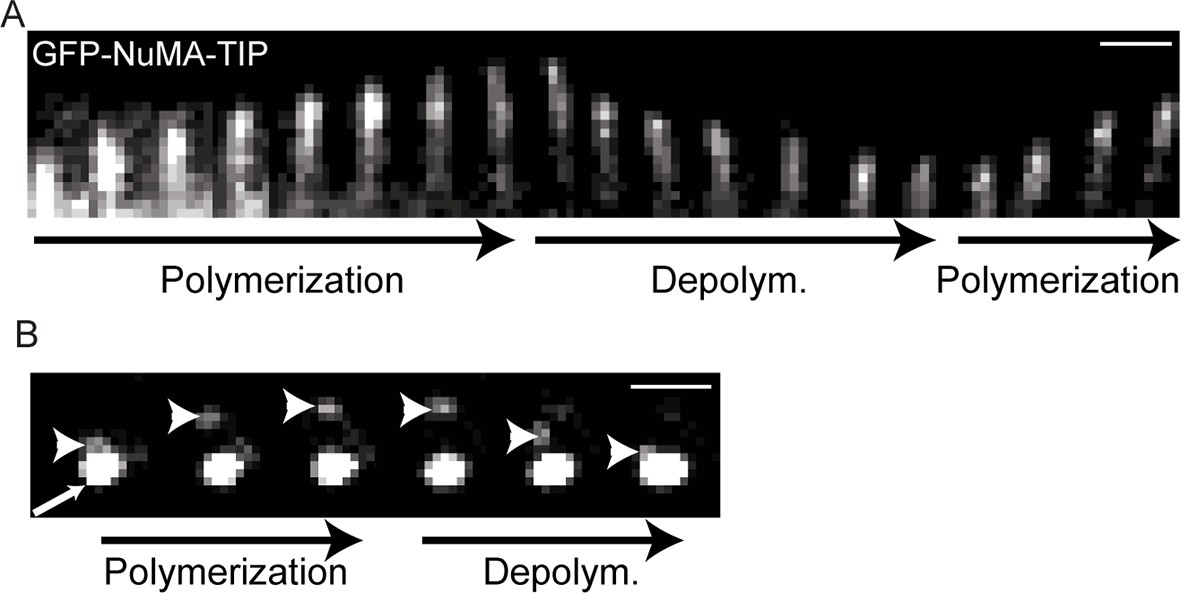
NuMA-TIP is necessary and sufficient for microtubule tip localization.
(A) Localization of endogenous NuMA (red) at MT tips (green) in a keratinocyte in early prometaphase. (B) Keratinocytes were treated with 500 nM nocodazole for 5 min before fixation and analysis of NuMA (red) and MT (green) localization. Insets in A and B show high magnification images of NuMA on MT tips. Scale bars are 10 μm. (C) Diagrams of NuMA structure and the NuMA mutants generated. (D–F). Localization analysis of GFP-tagged NuMA mutants with MTs (red) as indicated. Scale bars are 10 μm. (G,H) Kymographs of time-lapse movies of GFP-NuMA-TIP and tdTomato-EMTB expressing keratinocytes, taken at the periphery of the cell (scale bar, 1 μm). (I–K) 6XHis-GFP-NuMA-TIP was purified from bacteria, mixed with polymerized MTs and pelleted onto coverslips. (I) Punctate labeling of MTs (red) by 6X-GFP-NuMA-TIP, (approximately 300 nM). (J,K) Tip binding of GFP-NuMA-TIP at lower concentrations of the protein (approximately 30 nM). Scale bars are 5 μm.
Figure 2—figure supplement 1
Kymographs showing GFP-NuMA-TIP dynamics at the cell periphery (A) and at the centrosome (B).
Small arrow indicates the centrosomes; the large arrowhead indicates MT tip-localized GFP-NuMA-TIP (I).
Figure 3 with 5 supplements
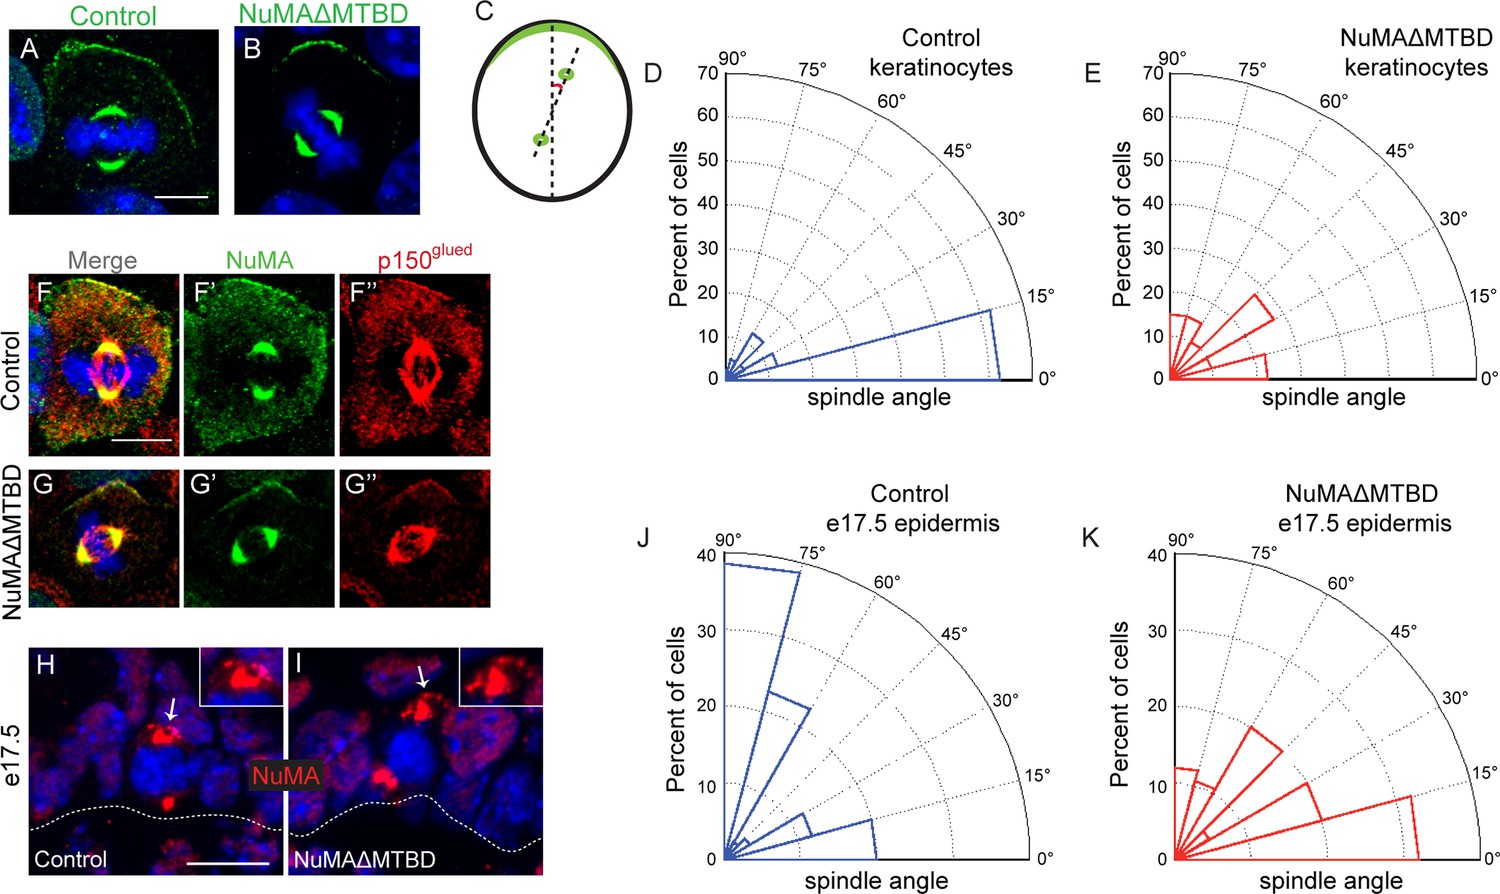
NuMA’s MTBD is required for spindle orientation in cultured keratinocytes and intact skin.
Localization of endogenous full-length NuMA (A) and NuMAΔMTBD (B) in mitotic keratinocytes. (C) Diagram illustrating how spindle angles wre measured with respect to the polarized cortical NuMA crescent in cultured keratinocytes. (D,E) Radial histograms representing the distribution of spindle orientation angles in control (D) and NuMAΔMTBD (E) keratinocytes (p<0.0001). (F,G) Co-localization of both endogenous NuMA (F) and NuMAΔMTBD (G) (green) with the p150glued subunit of dynactin (red) in mitotic keratinocytes. (H,I) Localization of NuMA (H) and NuMAΔMTBD (I) (red) in mitotic basal cells from e17.5 mouse backskin cryosections. Arrows and insets indicate the apical cortical accumulation of NuMA. Dashed lines indicate the basement membrane. Scale bars, 20 μm. (J,K) Radial histograms showing the distribution of spindle angles relative to the underlying basement membrane in e17.5 control epidermis (J) and NuMAΔMTBD epidermis (K) (n = 75 cells, p<0.0001). Unless noted, scale bars are 10 μm.
Figure 3—figure supplement 1

Binding sites and exon structure of NuMA.
(A) Diagram of the exon-intron structure of NuMA relative to its C-terminal protein-binding domains.The MTBD deletion mice were generated from a mouse line harboring a floxed exon 22. (B) Diagram of mouse NuMA exons 19–22 and their corresponding protein-binding domains. (C) Amino acid numbers of the protein-binding domains in human NuMA (2115 amino acid isoform).
Figure 3—figure supplement 2
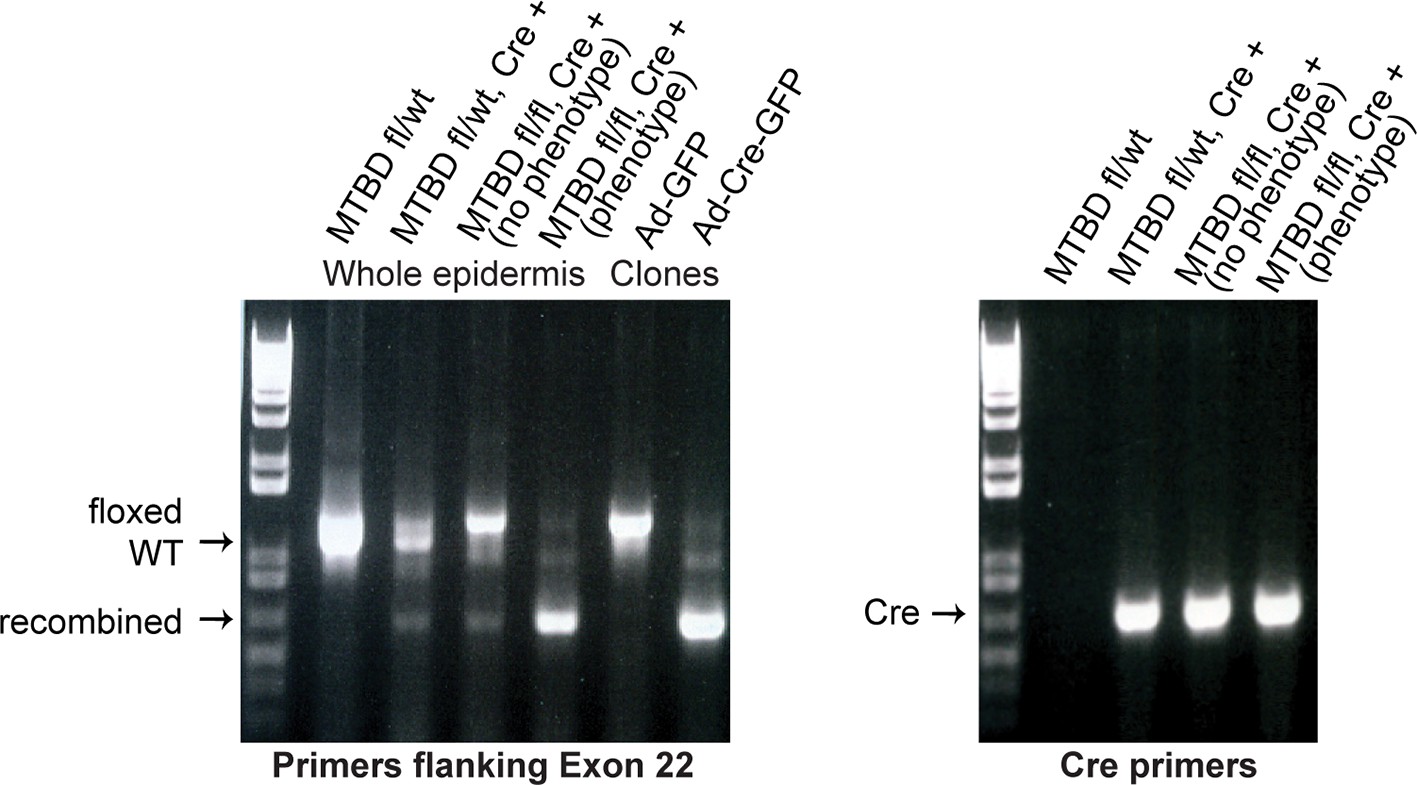
PCR genotyping analysis of NuMAΔMTBD mice and clonal cell lines.
Note that a fraction of Krt14-Cre;NuMA-MTBDfl/fl mice did not show an overt phenotype. PCR analysis of keratinocytes isolated from their backskin revealed poor recombination when compared with mice that exhibited an overt phenotype. This penetrance variability is thus due to mosaic recombination and is not biologically mediated.
Figure 3—figure supplement 3
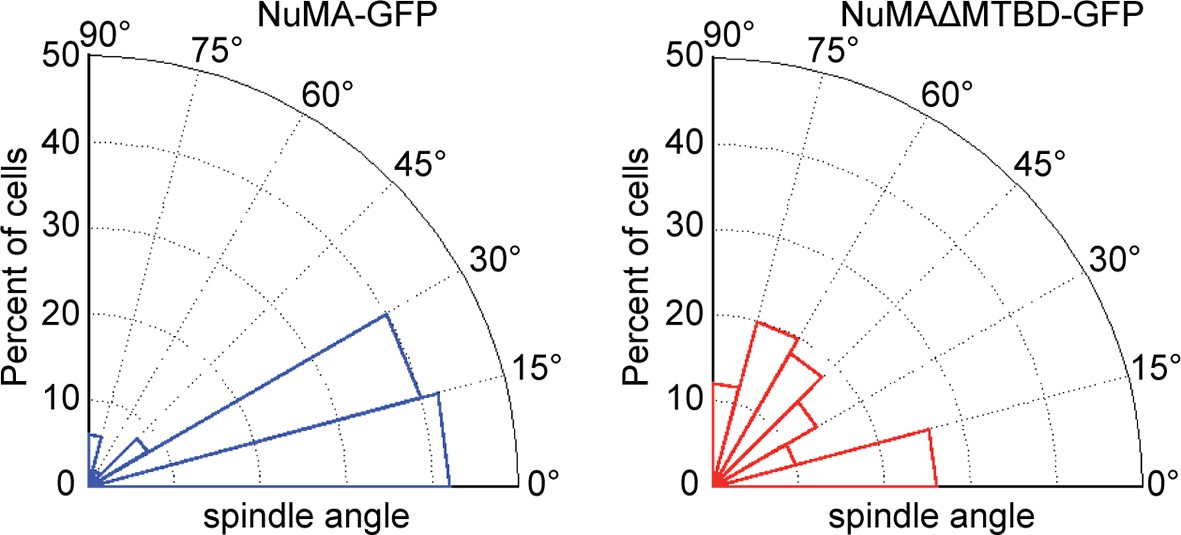
Radial histograms of spindle orientation in cultured mouse keratinocytes expressing either full-length NuMA-GFP or NuMAΔMTBD-GFP.
n = 50 and p<0.0001.
Figure 3—figure supplement 4
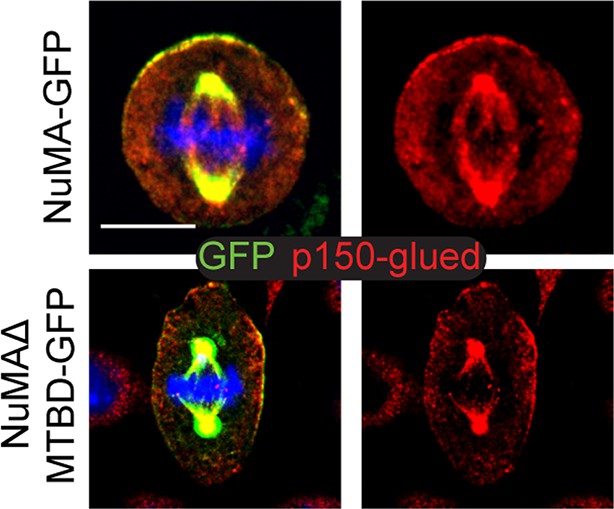
Co-localization of p150glued (a dynactin subunit) (red) with both NuMA-GFP and NuMAΔMTBD-GFP.
Scale bar is 10 μm.
Figure 3—figure supplement 5
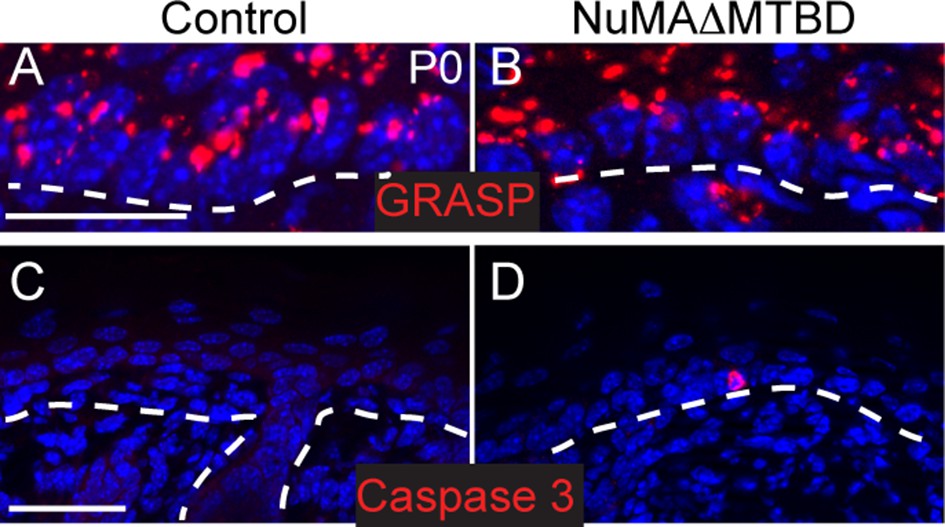
Polarity and apoptosis markers in control and NuMA(delta symbol)MTBD epidermis.
(A,B). Immunofluorescence images of the Golgi protein GRASP65 (red) in control (A) and NuMAΔMTBD (B) backskin (scale bar, 10 μm). Dashed lines indicate the basement membrane. (C,D). Immunofluorescence images of activated caspase-3 in control (C) and NuMAΔMTBD (D) backskin (scale bar, 50 μm).
Figure 4
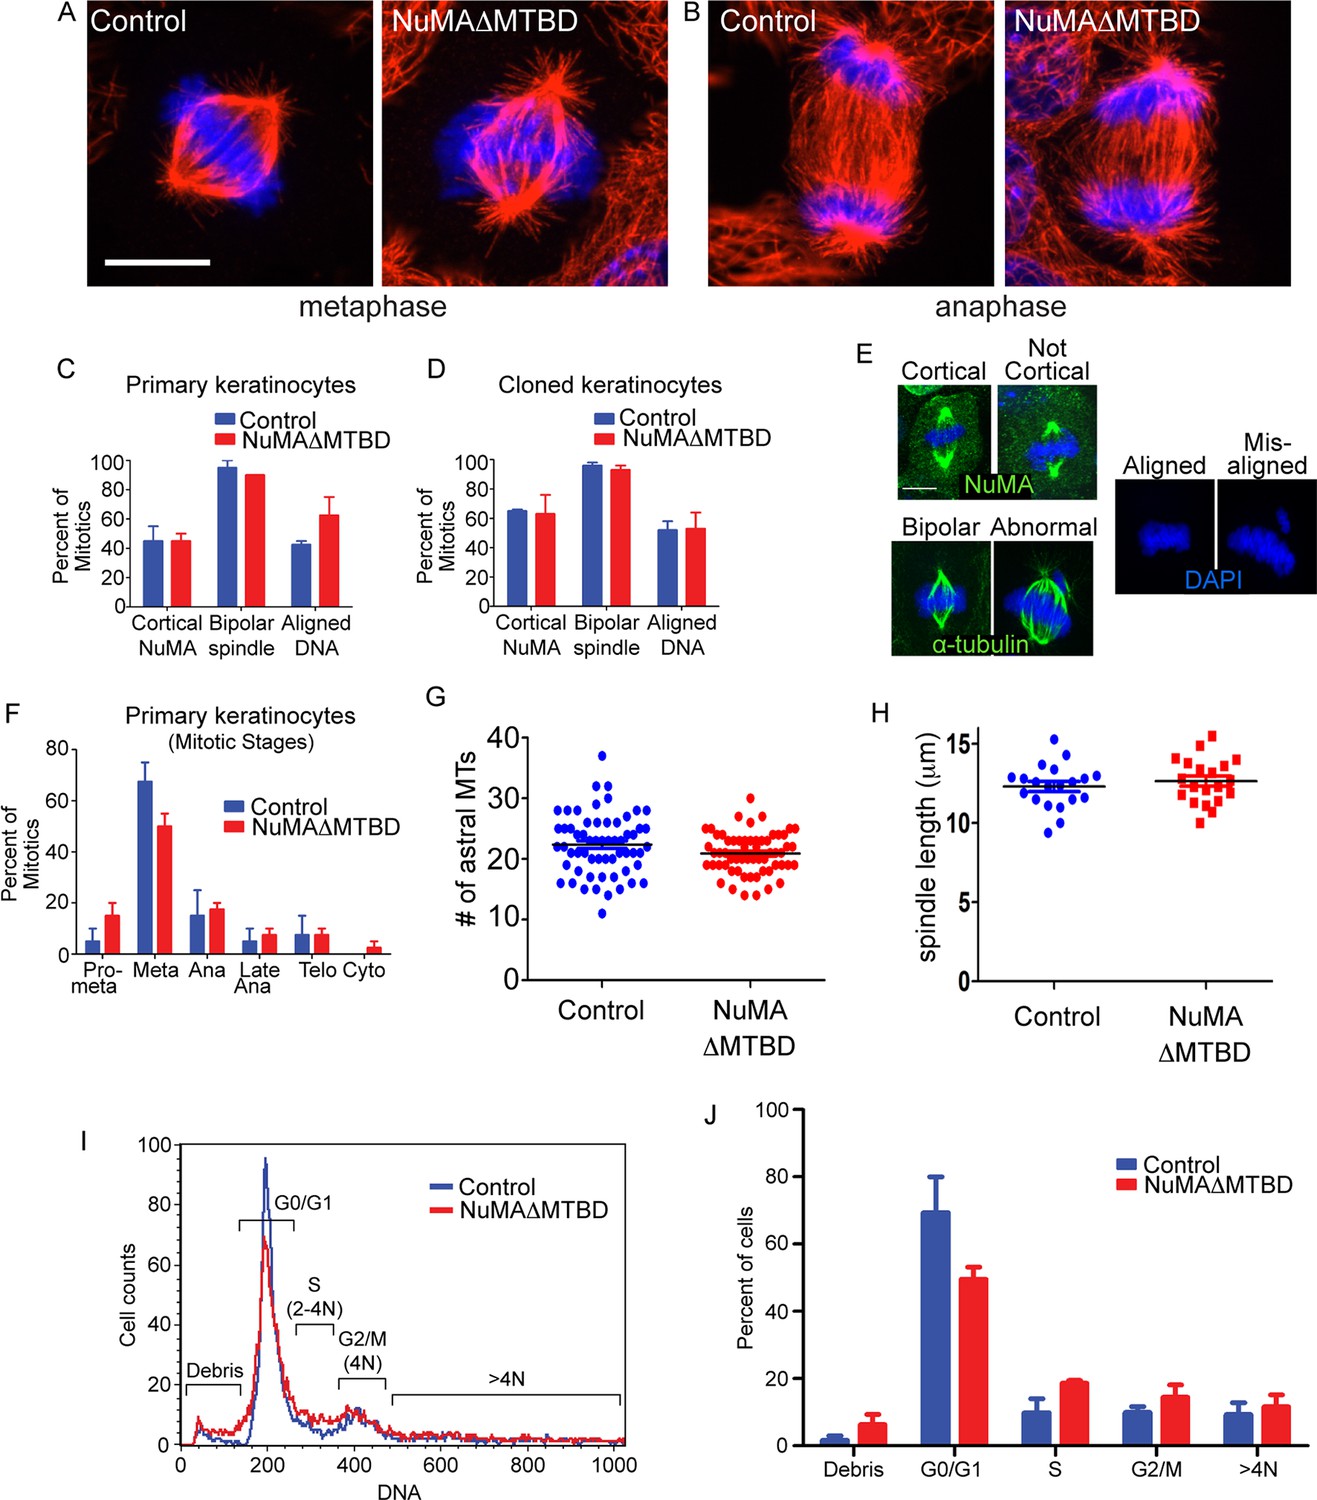
Keratinocytes show no signs of mitotic spindle assembly defects upon loss of NuMA’s MTBD.
(A,B) Immunofluorescence images of metaphase and anaphase mitotic figures from control and NuMAΔMTBD keratinocytes. MTs (red), DNA (blue). (C) Primary keratinocytes were isolated from control and NuMAΔMTBD mice and analyzed for cortical localization of NuMA, formation of bipolar spindles and the presence of aligned chromosomes in metaphase. n = 40, p>0.05. (D) Analysis as described in (C) was performed on control and NuMAΔMTBD clonal cell lines. n = 100, p>0.05. (E) Representative images of the phenotypes scored in (C) and (D). (F) Analysis of mitotic stages in primary cells isolated from control and NuMAΔMTBD epidermis. n = 40, p>0.05 for all. (G) Quantitation of the number of astral MTs/spindle pole in control and NuMAΔMTBD keratinocytes. n = 60 spindle poles, p>0.05. (H) Quantitation of metaphase spindle length in control and NuMAΔMTBD keratinocytes. n = 20 spindles, p>0.05. (I) Keratinocytes were isolated from the backskin of control and NuMAΔMTBD mice, stained with propidium iodide and their DNA content analyzed by flow cytometry. n = 2. (J) Bar graph of data from (J) representing the percentage of cells in each cell cycle stage. n = 2 mice/genotype, p>0.05 for all. All scale bars are 10 μm.
Figure 5 with 2 supplements
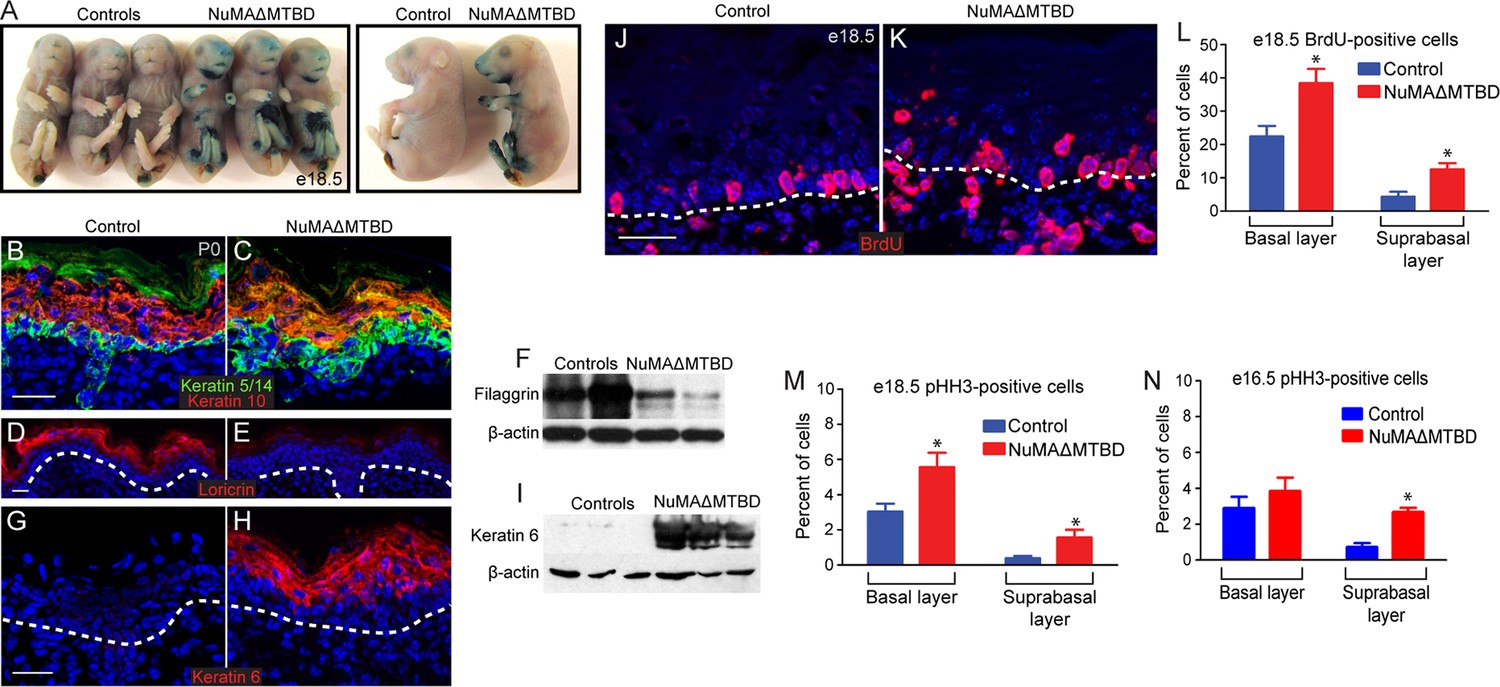
Loss of NuMA’s MTBD in the embryonic epidermis results in differentiation defects and neonatal lethality.
(A) X-gal penetration assay of e18.5 NuMAΔMTBD and littermate control mice shows a mild barrier defect in the mutant. (B,C) Immunofluorescence analysis of the basal cell marker keratin 5/14 (green) and the differentiated cell marker keratin 10 (red) in control (B) and NuMAΔMTBD (C) P0 backskin. (D,E) Expression of the granular cell marker loricrin (red) in control (D) and NuMAΔMTBD (E) epidermis. (F) Western blot of filaggrin levels in protein lysates prepared from control and NuMAΔMTBD epidermis. (G,H) Expression of the stress marker keratin 6 (red) in control (G) and NuMAΔMTBD (H) epidermis. (I) Western blot of keratin 6 levels in lysates prepared from control and NuMAΔMTBD epidermis. (J,K) Dams with e18.5 embryos were given a pulse of BrdU one hour before sacrifice. Control (J) and NuMAΔMTBD (K) embryonic backskin cryosections were stained with anti-BrdU antibodies (red) to assess proliferation rates. (L) Quantitation of BrdU incorporation in basal and suprabasal cells of the control and mutant epidermis (n = 3 mice/genotype, >500 cells analyzed. basal, p = 0.04; suprabasal, p = 0.03). (M,N) Quantitation of the percentage of phospho-histone H3 positive keratinocytes in basal and suprabasal cells layers at e18.5 (M) and e16.5 (n = 3 mice/genotype, >500 cells analyzed. basal, p = 0.05; suprabasal, p = 0.07). * denotes p values ≤0.05. All scale bars are 50 μm.
Figure 5—figure supplement 1
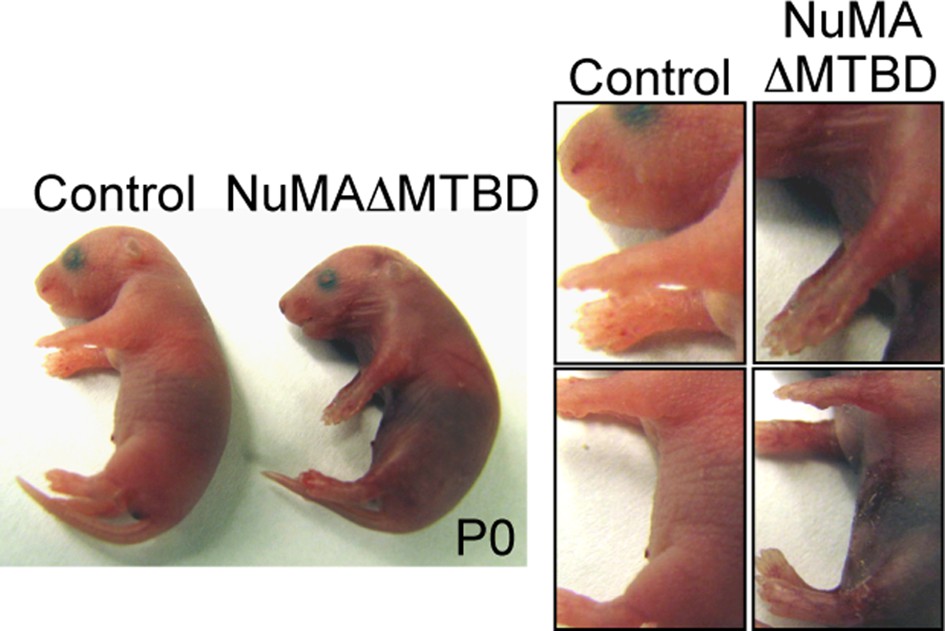
Photographs of neonatal control and NuMAΔMTBD mice.
https://doi.org/10.7554/eLife.12504.016
Figure 5—figure supplement 2

Analysis of differentiation in e16.5 control and NuMAΔMTBD embryos.
Keratin 5 (red) and keratin 10 (green) were costained in tissues as indicated. Asterisks indicate suprabasal cells that are either co-labeled for K5 an K10 (middle panel) or that are undergoing mitosis (bottom panel). Scale bar is 10 μm.
Figure 6 with 4 supplements
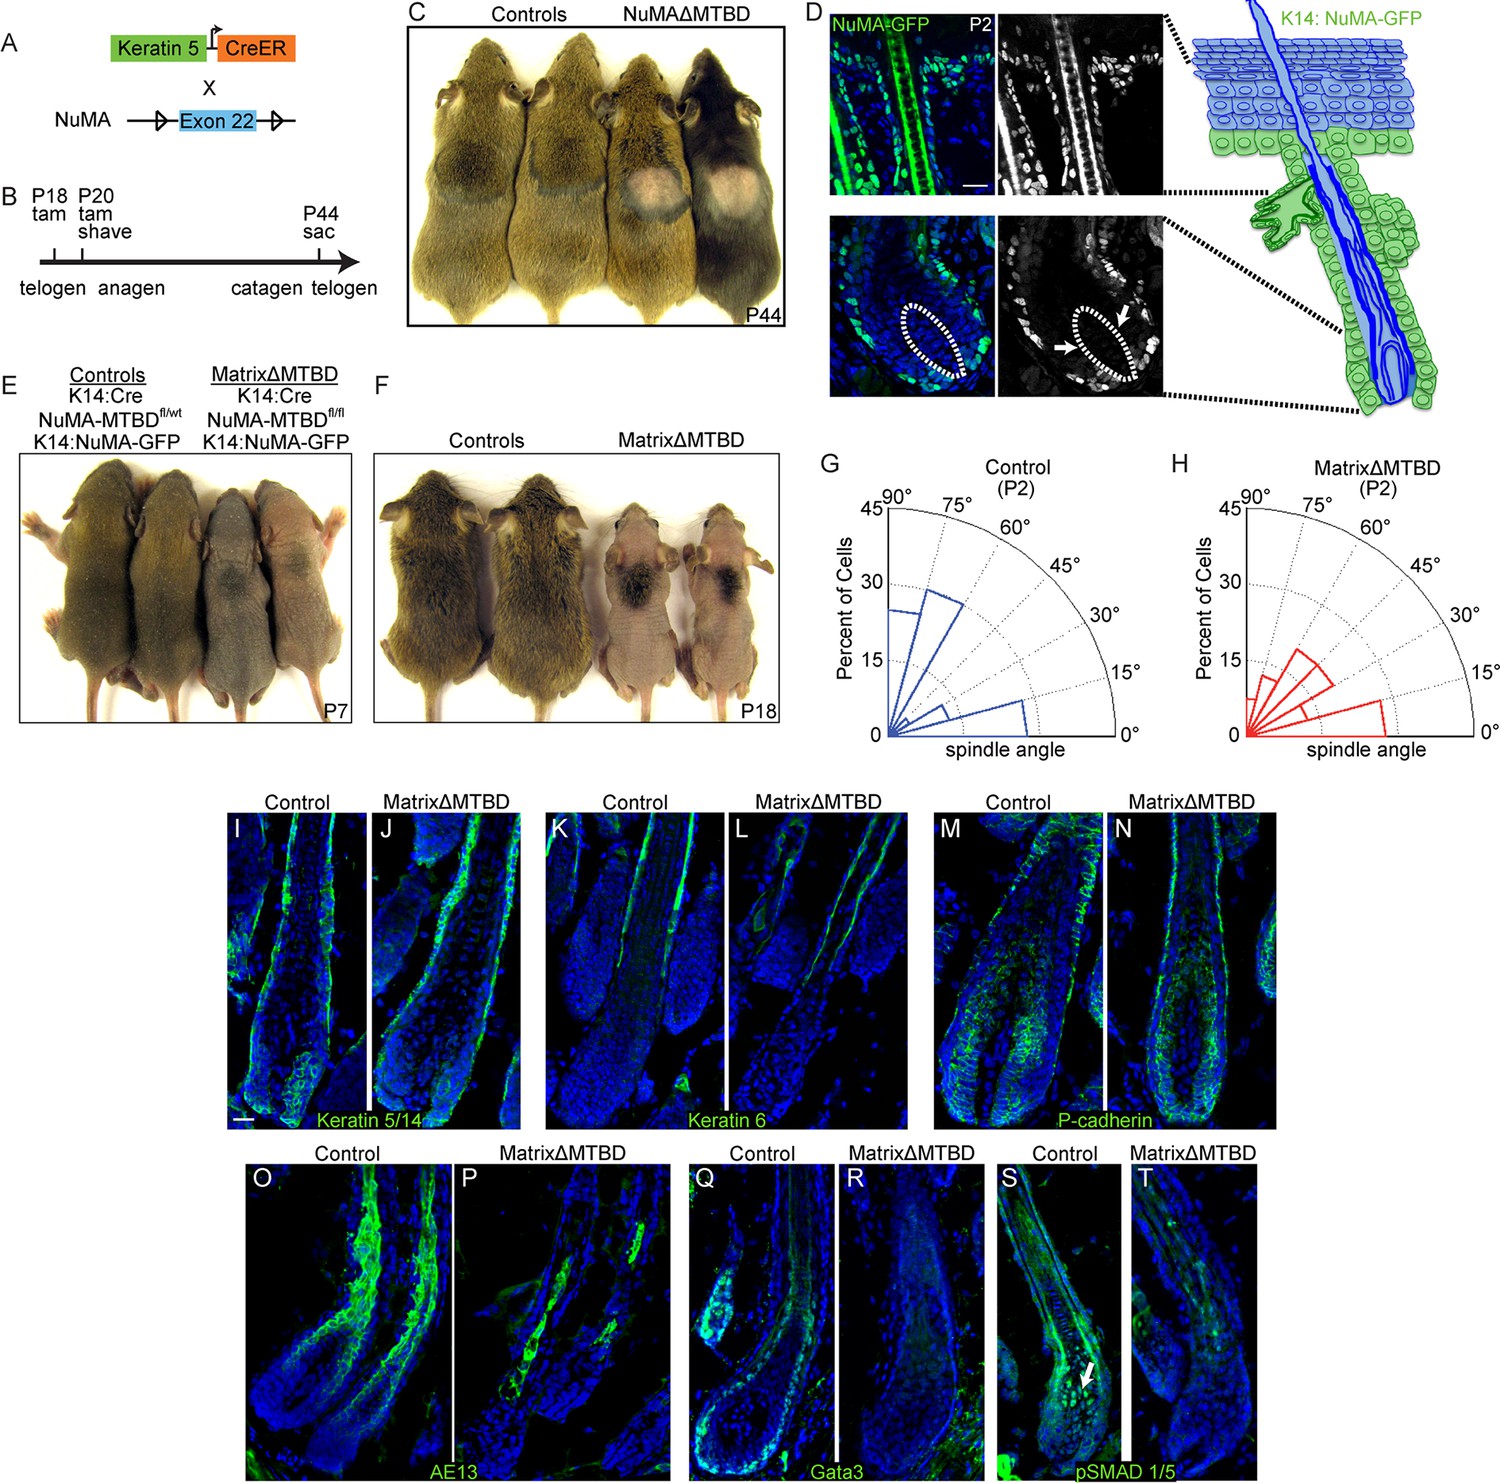
NuMA’s MTBD is required in hair follicle matrix cells for proper spindle orientation, differentiation, and hair generation.
(A) Diagram illustrating the mouse mating used to generate conditional inducible deletion of NuMA’s MTBD in the adult interfollicular epidermis and hair follicles. (B) Diagram illustrating the experimental time course. Mice were injected twice with tamoxifen in telogen of the hair cycle, shaved and then examined for subsequent hair growth in the following anagen. (C) Images of control and NuMAΔMTBD mice treated as described in (B) and photographed at postnatal day 44. (D) Expression of keratin 14 promoter-driven NuMA-GFP in both the interfollicular epidermis and outer root sheath (ORS) of a P2 hair follicle. The hair shaft signal in the top images is due to autofluorescence. The dashed line indicates the basement membrane that separates the dermal papilla and the matrix cells. Note the lack of NuMA-GFP expression in the matrix cells (arrows). (E,F) Photographs of control and matrixΔMTBD mice (K14-Cre; NuMA MTBDfl/fl;K14-NuMA-GFP) at postnatal day 7 (E) and 18 (F). Note that the small patch of dorsal hair is likely due to incomplete recombination and is lost in subsequent hair cycles (Figure 6—figure supplement 4). (G,H) Radial histograms of spindle angles in the matrix cells of control (G) and matrixΔMTBD (H) mice at P2 (n = 40 cells. p = 0.005). (I–T) Immunofluorescence analysis of the indicated hair differentiation markers (green) in control and matrixΔMTBD backskin at P4. Keratin 5/14 labels the ORS, keratin 6 labels the companion layer, P-cadherin labels matrix cells, AE13 labels the cuticle and cortex of the hair shaft, and GATA3 labels the inner root sheath. All scale bars are 20 μm.
Figure 6—figure supplement 1
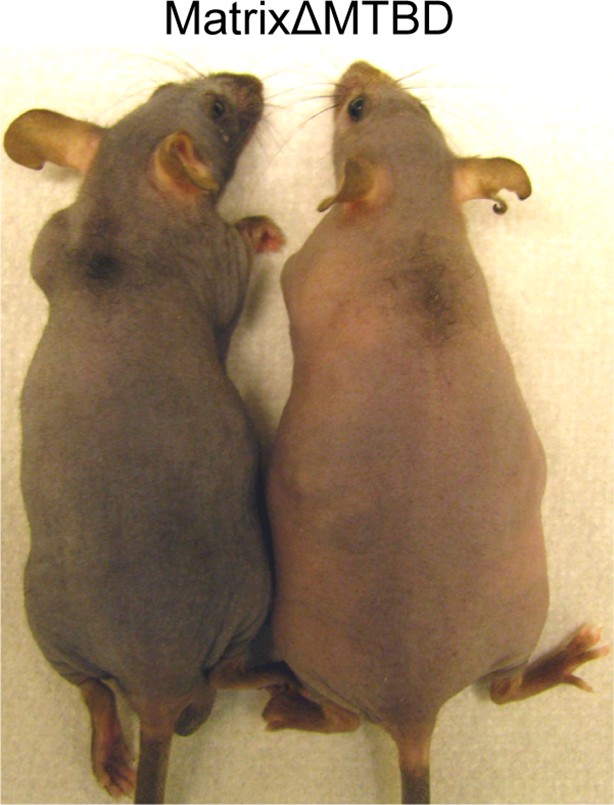
MatrixΔMTBD mice (4 months old) showing loss of all hair as the animals age.
https://doi.org/10.7554/eLife.12504.019
Figure 6—figure supplement 2
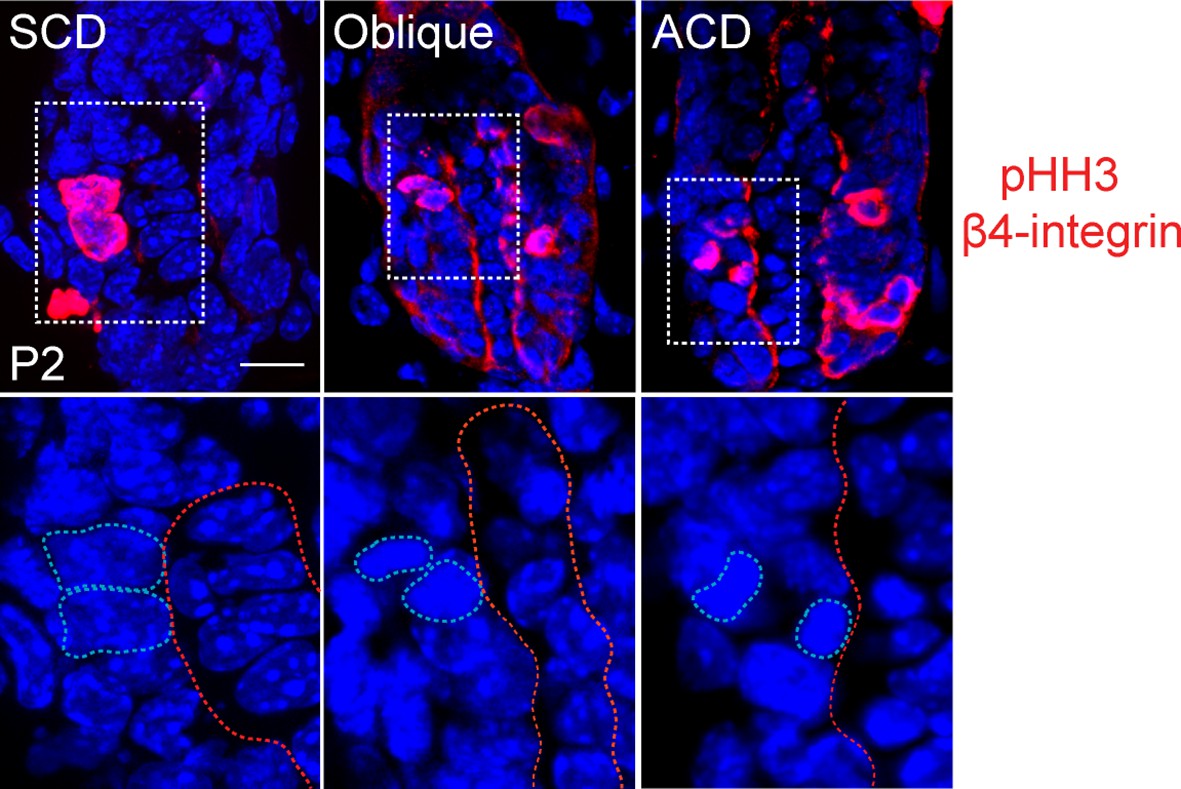
Representative images of anaphase spindles in the matrix of the hair follicle.
Examples of symmetric (SCD), oblique, and asymmetric (ACD) divisions are shown. Bottom panels show dividing cell chromatin at higher magnification. Phospho-histone H3 and β4 integrin are in red, DNA is blue.
Figure 6—figure supplement 3
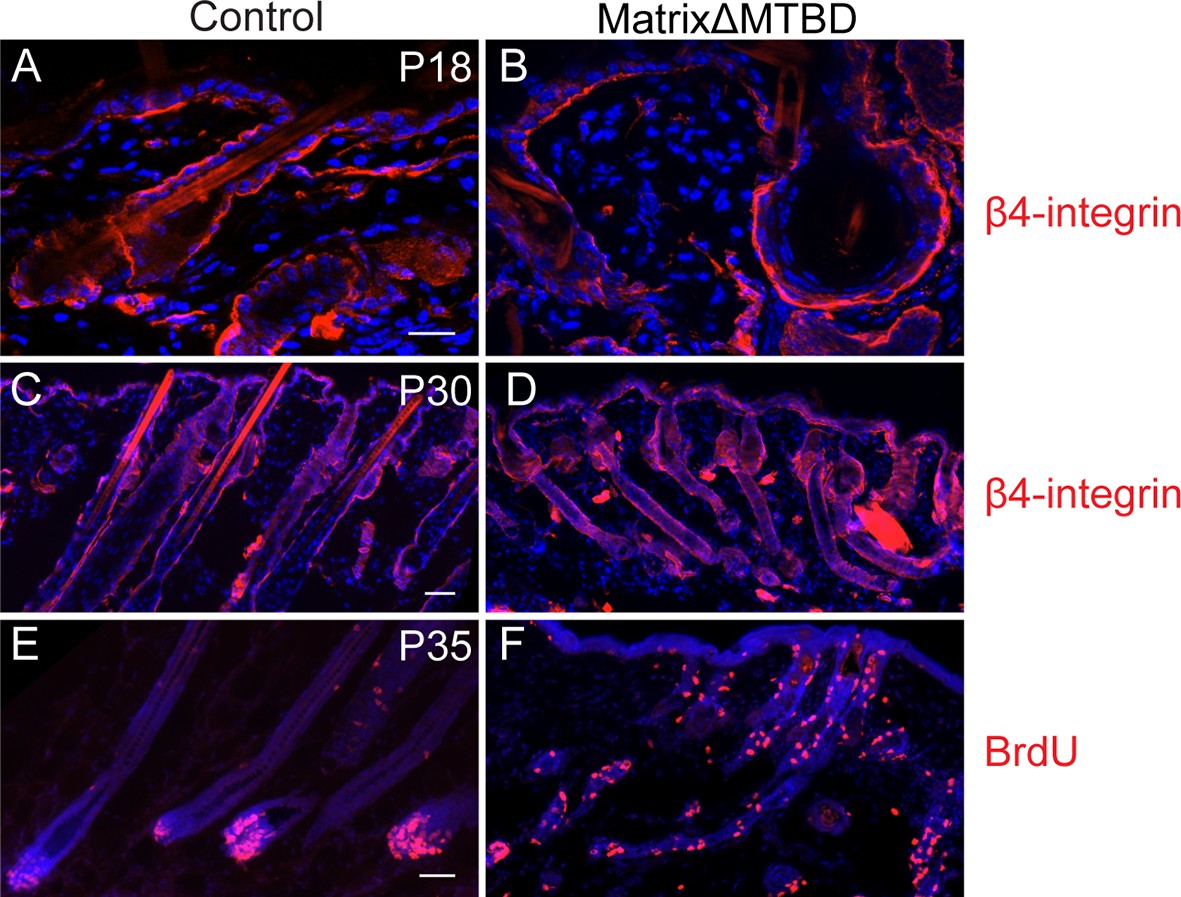
Hair follicle histology at P18 (A,B) and P30 (C,D) in control and MatrixΔMTBD mice.
Note the abnormal structures that are present in the first telogen (P18) of mutant follicles and the resumption of anaphase at P30. (E,F) Analysis of proliferation by short-term BrdU uptake in P35 control (E) and MatrixΔMTBD (F) mice. Note the aberrant localization of S phase cells in matrixΔMTBD follicles.
Figure 6—figure supplement 4
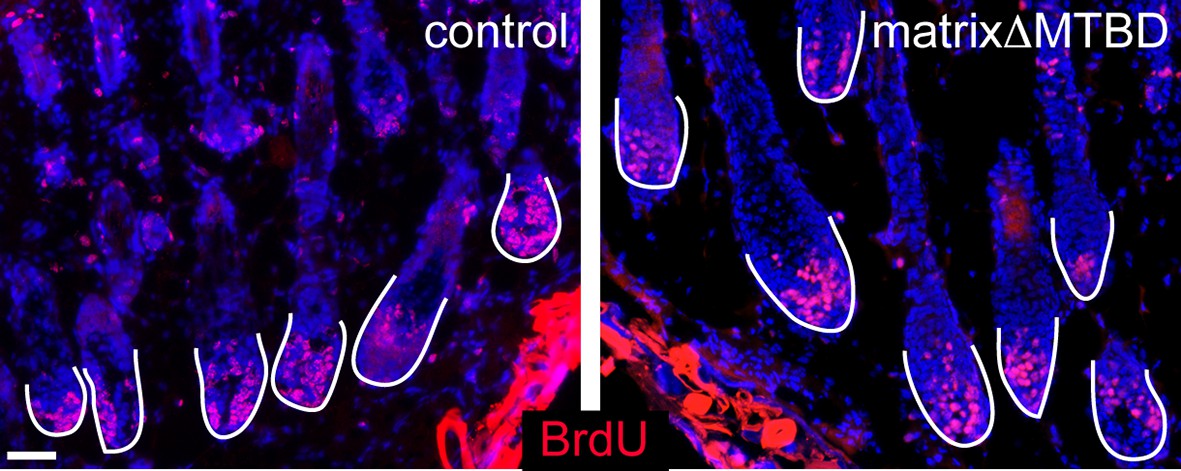
Analysis of BrdU positive cells in control and matrixΔMTBD mice at postnatal day 2.
Cells incorporating BrdU are labeled in red.
Figure 7
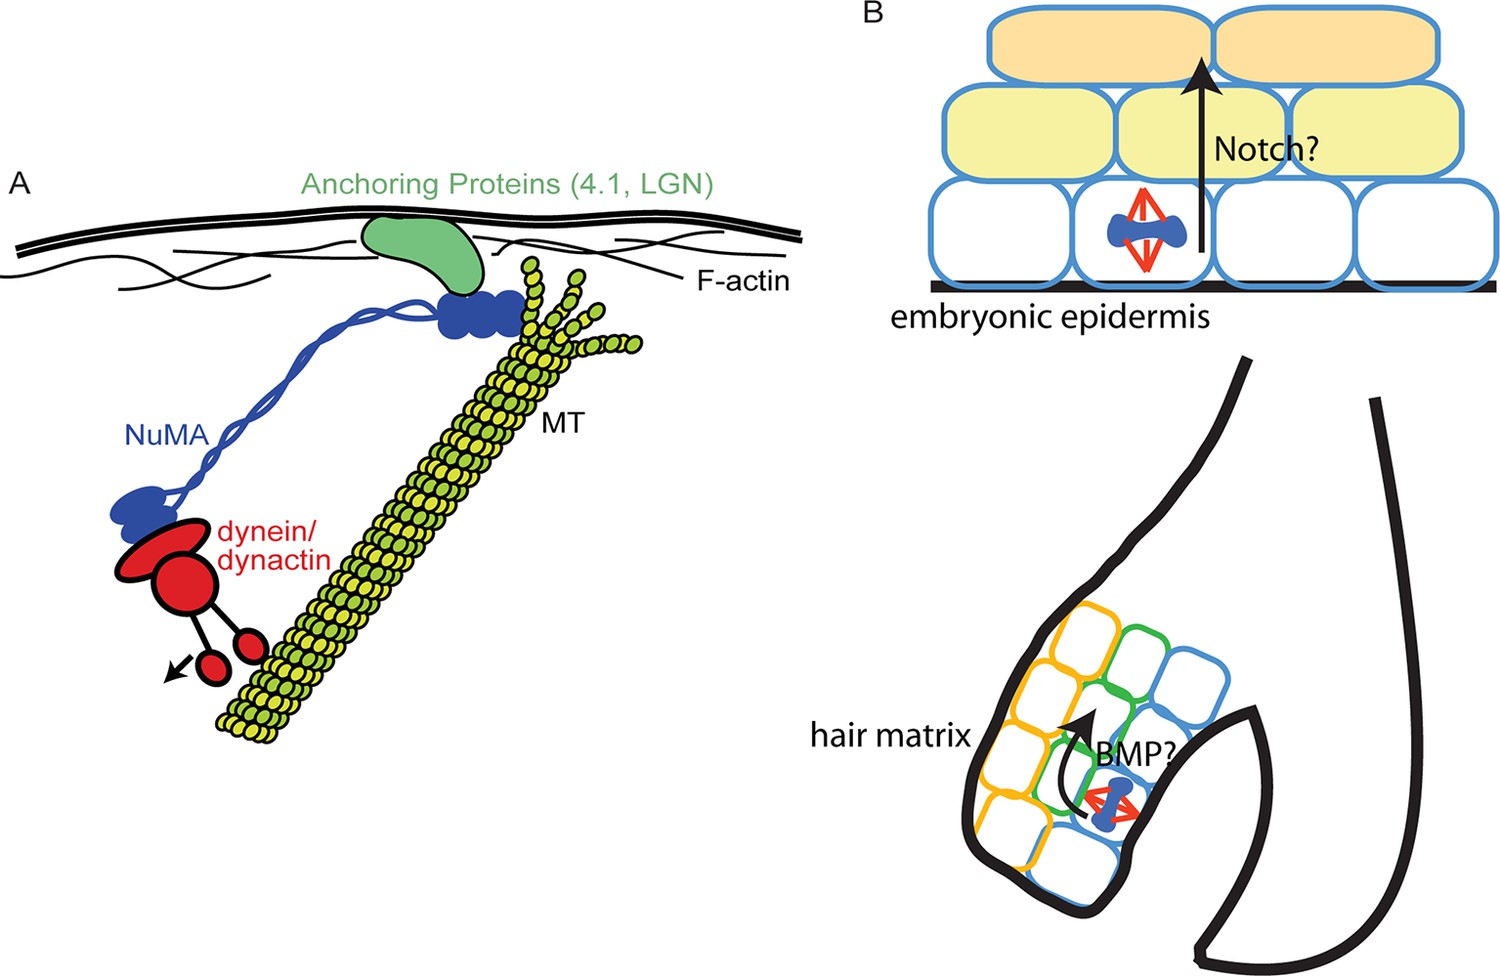
Models for NuMA and ACD functions.
(A) Diagram of interactions required for spindle orientation. NuMA interacts with MTs via a carboxy-terminal domain, as well as with dynein/dynactin in its amino terminus. Both these interactions are likely required for robust spindle orientation. Only a single NuMA dimer is illustrated for simplicity, although it is also thought to multimerize. NuMA may act to stabilize the MT end or, alternatively, may couple its depolymerization to force generation for spindle positioning. (B) Comparison of the repetitive uses of spindle orientation in the embryonic epidermis and adult hair follicle. In both cases, spindles align perpendicular to the underlying basement membrane in a significant portion of cells in a NuMA-dependent manner. Whereas cell fate decisions in embryonic epidermis are Notch-dependent, cell fate choices in the hair follicle are BMP-dependent. In neither case do we understand the molecular connection between spindle orientation and the activation of these pathways.
Download links
A two-part list of links to download the article, or parts of the article, in various formats.
Downloads (link to download the article as PDF)
Open citations (links to open the citations from this article in various online reference manager services)
Cite this article (links to download the citations from this article in formats compatible with various reference manager tools)
NuMA-microtubule interactions are critical for spindle orientation and the morphogenesis of diverse epidermal structures
eLife 5:e12504.
https://doi.org/10.7554/eLife.12504


