Nucleocapsid assembly in pneumoviruses is regulated by conformational switching of the N protein
- University of Oxford, United Kingdom
- Diamond Light Source, United Kingdom
Figures
Figure 1 with 1 supplement
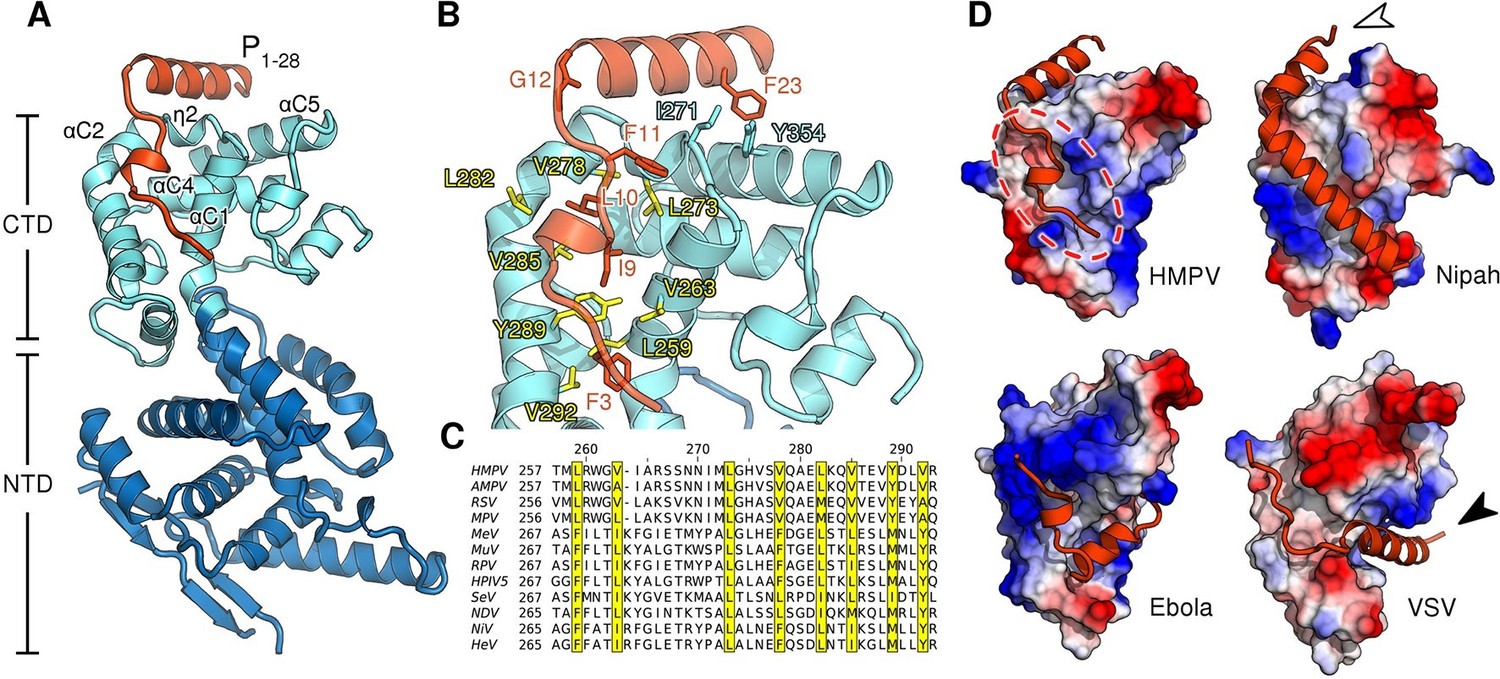
Structure of the HMPV N0-P complex.
(A) Crystal structure of RNA-free HMPV N0 bound to P1-28. The C-terminal domain (CTD) of N is colored in light blue and the N-terminal domain (NTD) in dark blue. Secondary structure elements involved in the interaction with P are indicated. The P peptide is colored in orange. (B) Residues that are important in facilitating the interaction between P and N are shown in stick representation. Conserved hydrophobic residues of the P binding site are colored in yellow. (C) Multiple sequence alignment of N proteins from Paramyxoviridae members. Conserved residues of the P-binding site are highlighted in yellow and correspond to those in B. Virus name abbreviations are given in Methods. (D) N0-P complexes throughout Mononegavirales. Surface representations of N-CTDs of HMPV, Nipah virus (PDB ID:4CO6), Ebola virus (PDB ID:4YPI) and Vesicular stomatitis virus (PDB ID:3PMK), colored by electrostatics. CTDs are shown in the same orientation. Bound P proteins (VP35, in the case of Ebola virus) are colored in orange. The red dotted circle indicates a P-binding sub-region which is shared in all structures. Arrows are explained in the accompanying text.
Figure 1—figure supplement 1

Construct design and purification of the HMPV N0-P hybrid.
(A) Schematic of the N0-P hybrid construct. The N-terminal (NTD) and C-terminal (CTD) domains of N are coloured in dark and light blue, respectively. The N-terminal and C-terminal arms are indicated. The first 40 residues of the HMPV P protein (shown in orange) were cloned at the C-terminus of N, immediately following the CTD-arm. (B) size exclusion chromatogram (Superdex 75) and (C) accompanying SDS-PAGE analysis of the last purification step of N0-P. Protein elution was monitored by the absorbance at 280 nm.
Figure 2 with 4 supplements
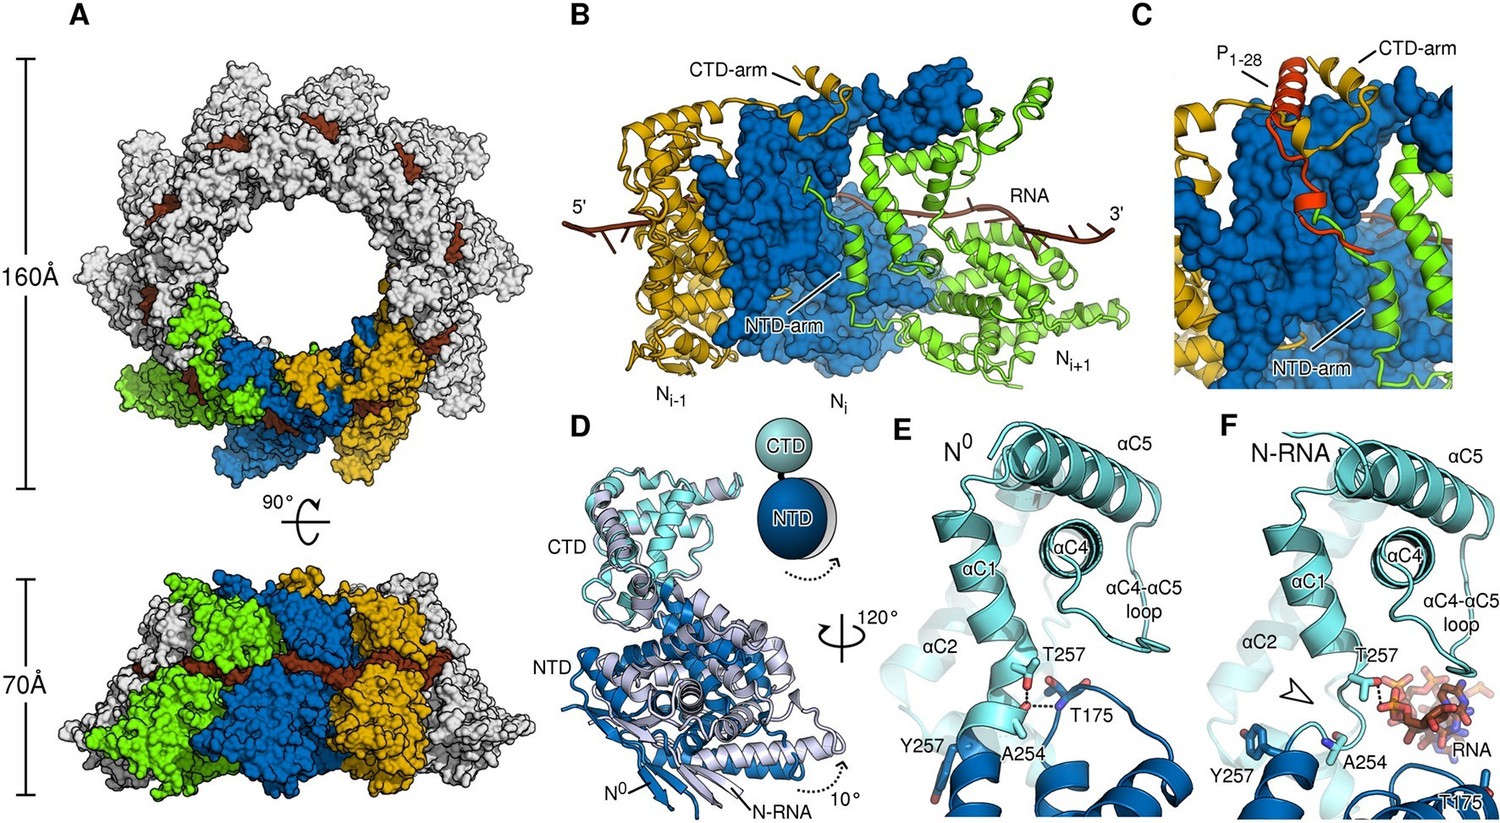
Comparison of N in assembled RNA-bound and monomeric RNA-free states.
(A) top- and side-views of RNA-bound HMPV subnucleocapsid rings. N protomers and RNA are shown as surfaces with RNA rendered in brown. The diameter and height of the ring are indicated. (B) Three adjacent protomers of assembled RNA-bound N are shown viewed looking outwards from the centre of the ring, with the middle subunit rendered as surface. The exchange subdomains (NTD- and CTD-arm) that facilitate assembly of N are indicated. (C) The overlay with P1-28 (orange) bound to the middle protomer shows that the P-binding site overlaps with that of the NTD- and CTD-arms and that binding is mutually exclusive. (D) Hinge-motion of NTD and CTD of N. Monomeric N0 is superposed onto a single protomer of assembled, RNA-bound N (N-RNA, shown in grey). The NTD pivots by 10 degrees relative to the CTD (indicated). For clarity, only the NTD and CTD of the two states are shown. (E) showing N0, and (F) showing N-RNA, close-up of the pivot point facilitating the hinge-motion of N. The white arrow in F indicates where the hinge region uncoils, allowing pivoting. For clarity, the P-peptide and the CTD-arm are omitted in E and F.
Figure 2—figure supplement 1

Purification of HMPV N-RNA and characterisation of oligomeric state.
(A) Size exclusion chromatogram (Superose 6) of N-RNA after purification from E. coli. The fractions containing N-RNA are indicated by a red bar. The broad peak centred around 10 mL (indicated with white arrow) constitutes nucleic acid co-purified from the expression host as indicated by the ratio of absorption at 260 and 280 nm. (B) SDS-PAGE analysis of the fractions marked with red bar in a. (c) Purified N-RNA was analysed by transmission electron cryomicroscopy, showing oligomeric rings. (D) 2D-class averages of N-RNA rings reveal three oligomeric states: 9-mers, 10-mers and 11-mers (as indicated with white labels). The population distribution of the different oligomeric states is indicated in the accompanying pie chart.
Figure 2—figure supplement 2
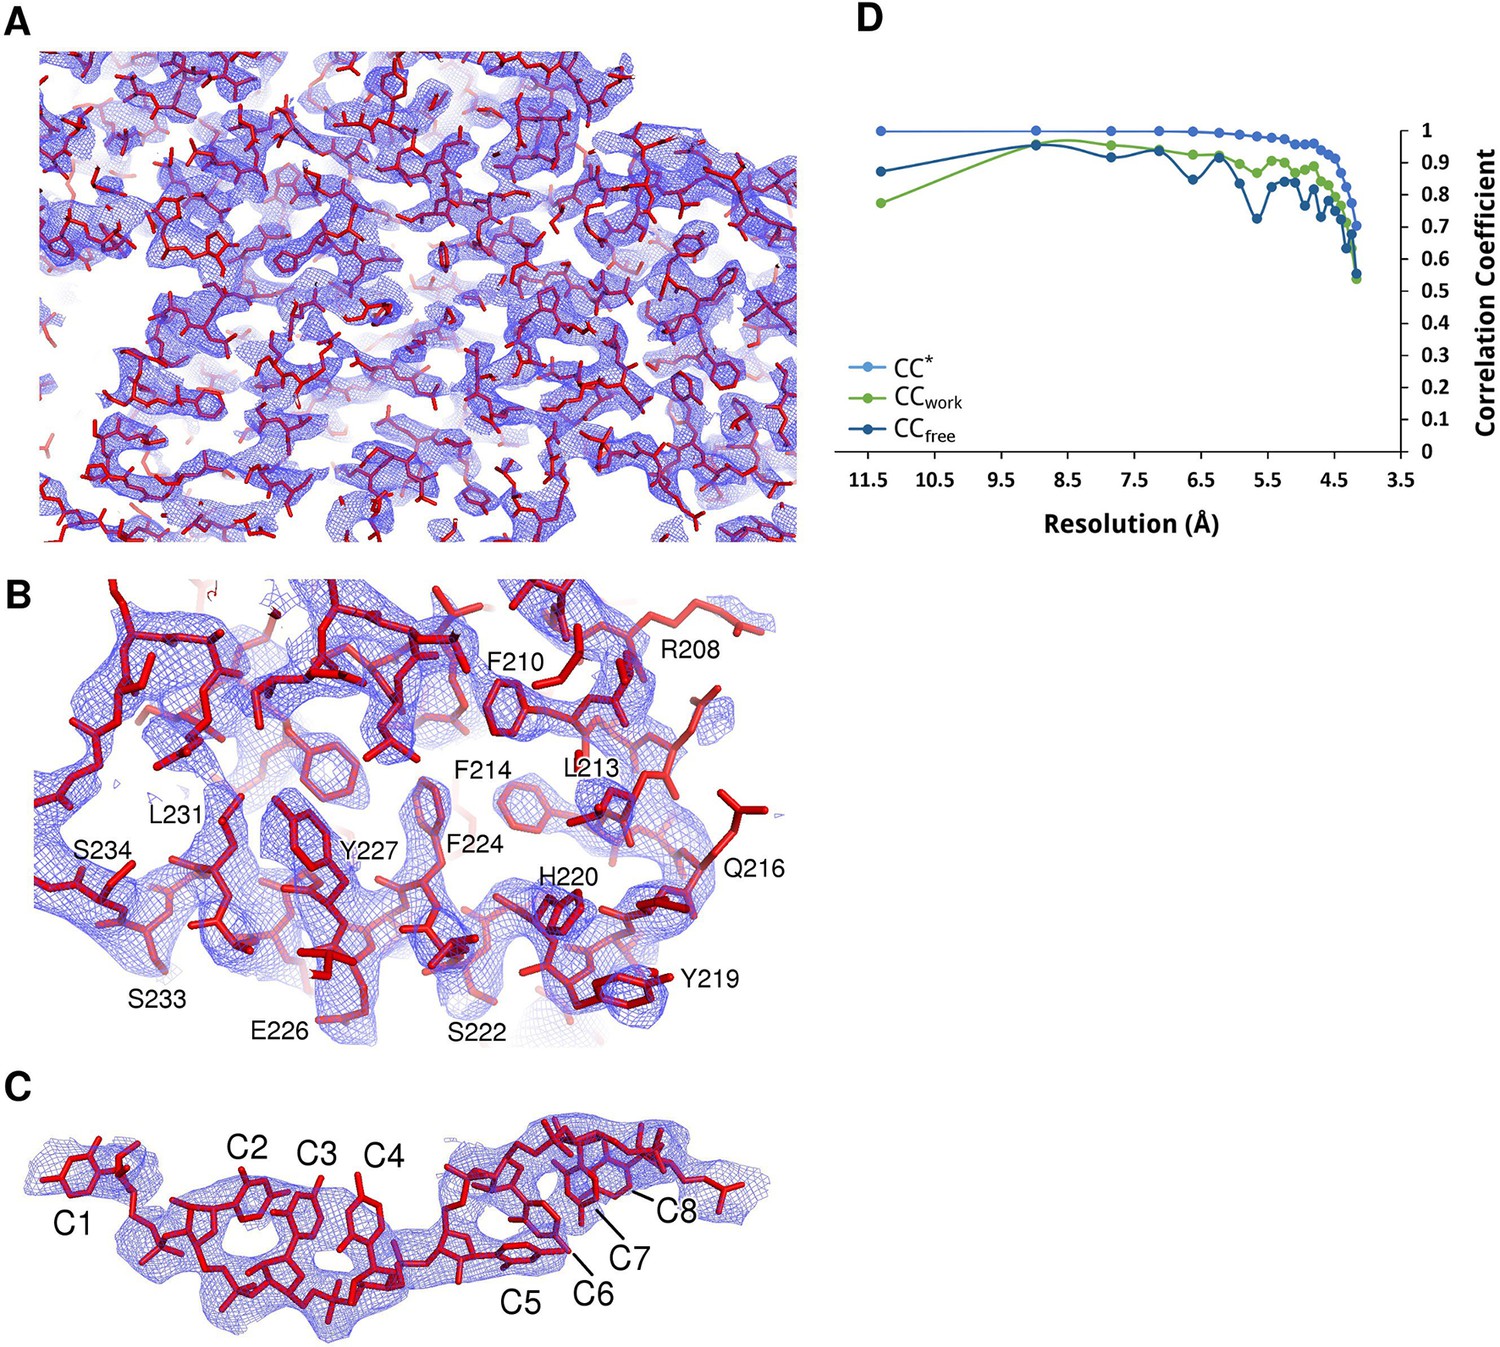
Electron density maps of N-RNA.
(A–C) Samples of electron density of the N-RNA crystal at 4.2 Å. A 2Fo-Fc map contoured at 1.0 σ after density modification with Parrot and B-factor map sharpening is shown. (A) zoomed-out overview of the density, (B) close-up view of two consecutive helices and (C) density for the bound RNA. (D) Data and model quality. Comparison of the correlation of the true signal CC* with CCfree and CCwork. The CC* plot shows that there is useful information up to a resolution of 4.2 Å. CCwork and CCfree values below CC* show that the model is not overfitting the data.
Figure 2—figure supplement 3
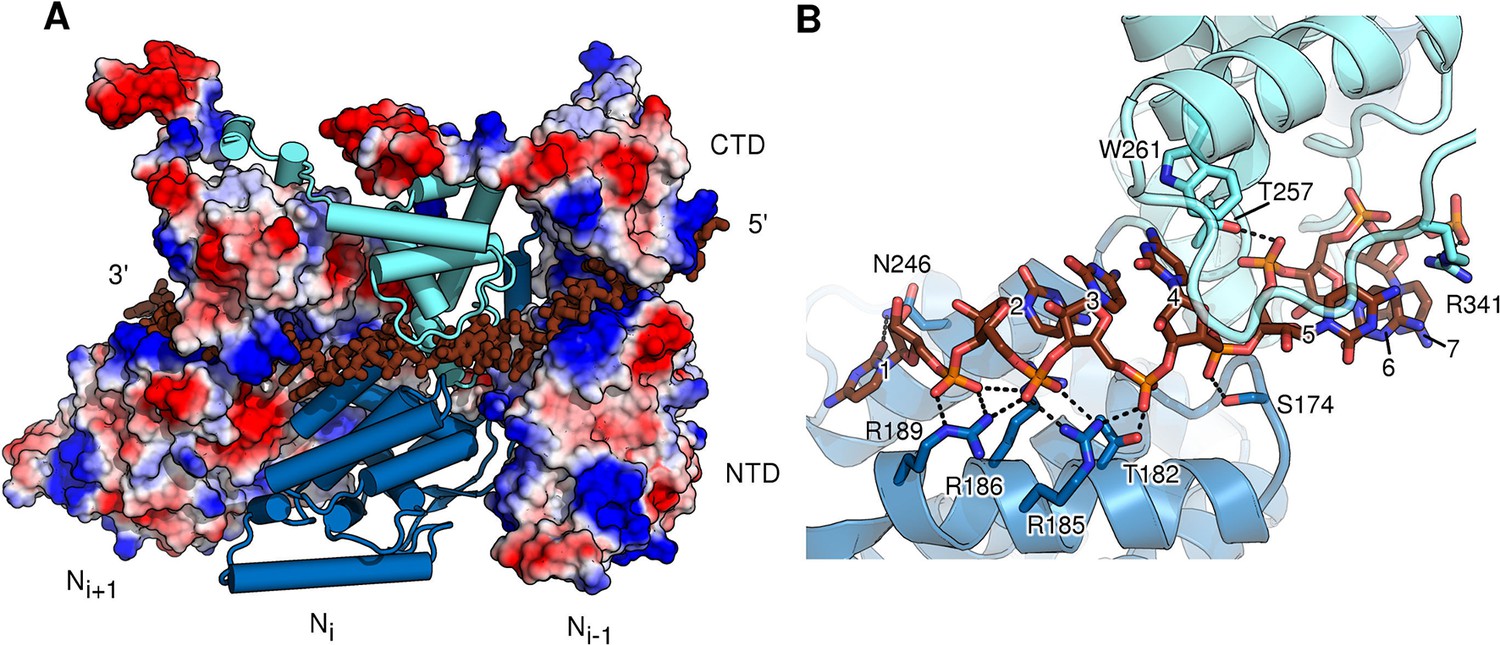
RNA-binding cleft of HMPV N.
(A) External side view showing RNA inserted into three neighbouring protomers of assembled N. The two outer protomers are shown as surface representation coloured by electrostatics, highlighting the basic nature of the RNA-binding cavity. The central N subunit is shown in cartoon representation with the NTD coloured in dark blue and the CTD in light blue. RNA is shown in stick representation and coloured in brown. (B) close-up of the RNA-binding site of one N protomer. NTD and CTD are coloured as in A. The seven bound nucleotides are numbered, counting from 3’-end to 5’-end. Important residues interacting with RNA are shown in stick representation.
Figure 2—figure supplement 4
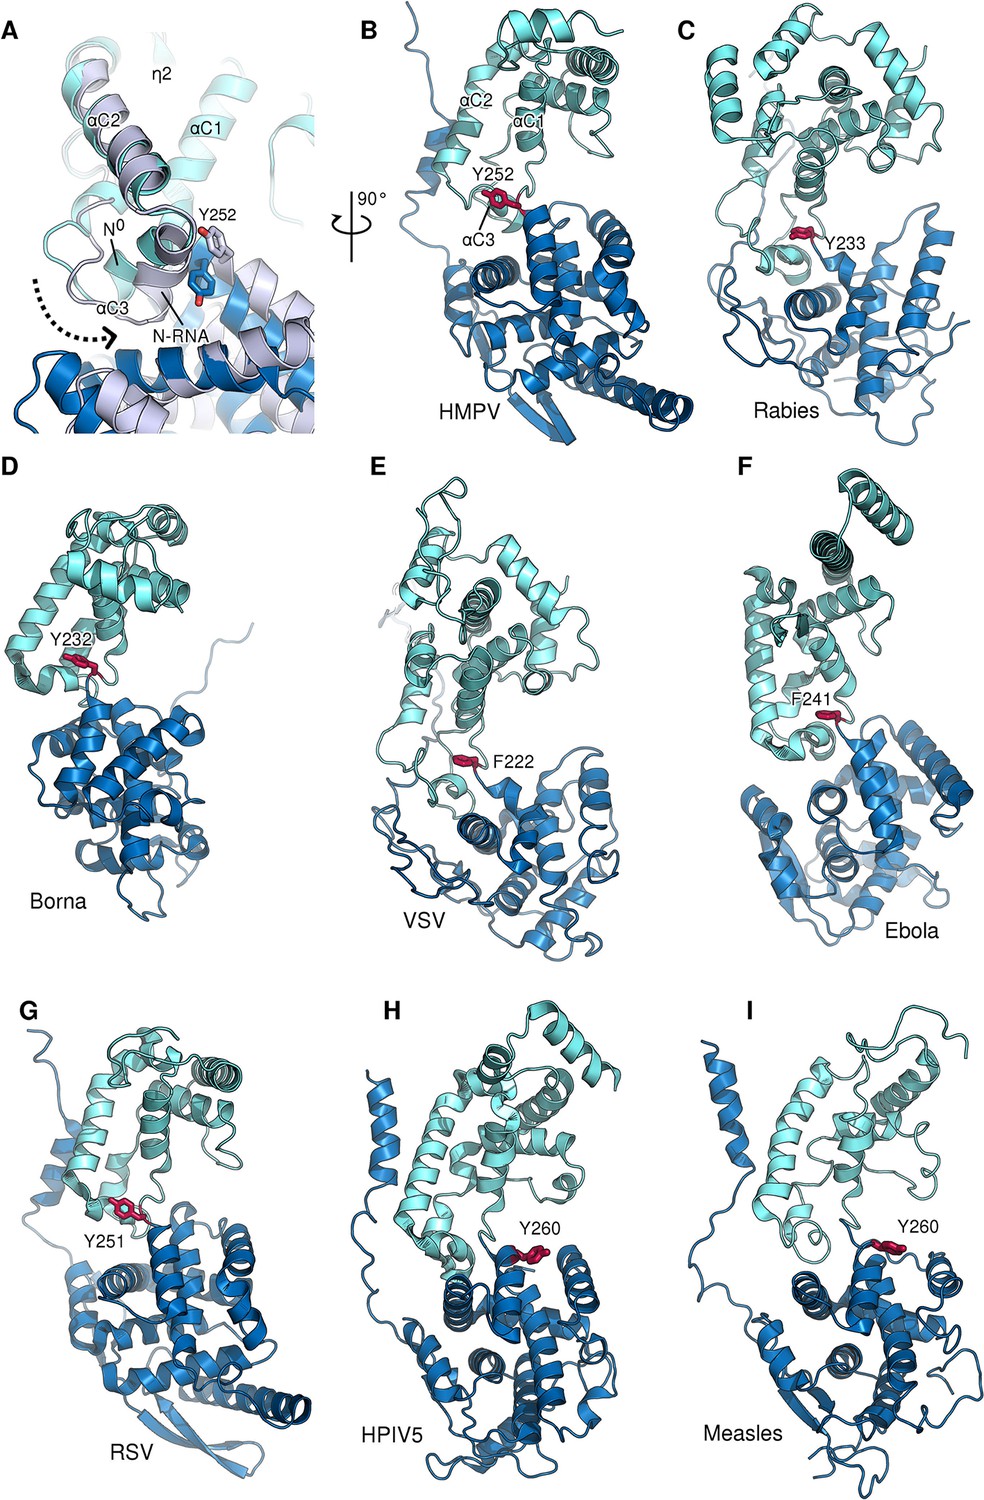
Role of a conserved aromatic residue in N hinge motion.
(A) Monomeric N0 (blue) is superposed onto RNA-bound N (grey). The dotted arrow indicates the tilting of α-helix αC3 during the transition from N0 to N-RNA. Tyr252 is thereby pushed upwards, facilitating the hinge motion. (B–G) panel of N proteins throughout Mononegavirales for which an aromatic residue (shown in red) can be observed at the same position and orientation, indicating a conserved function despite low overall sequence identity. (H and I) in Paramyxovirinae the aromatic residue located before the hinge region is flipped in the opposite direction in respect to other mononegaviruses.
Figure 3 with 1 supplement
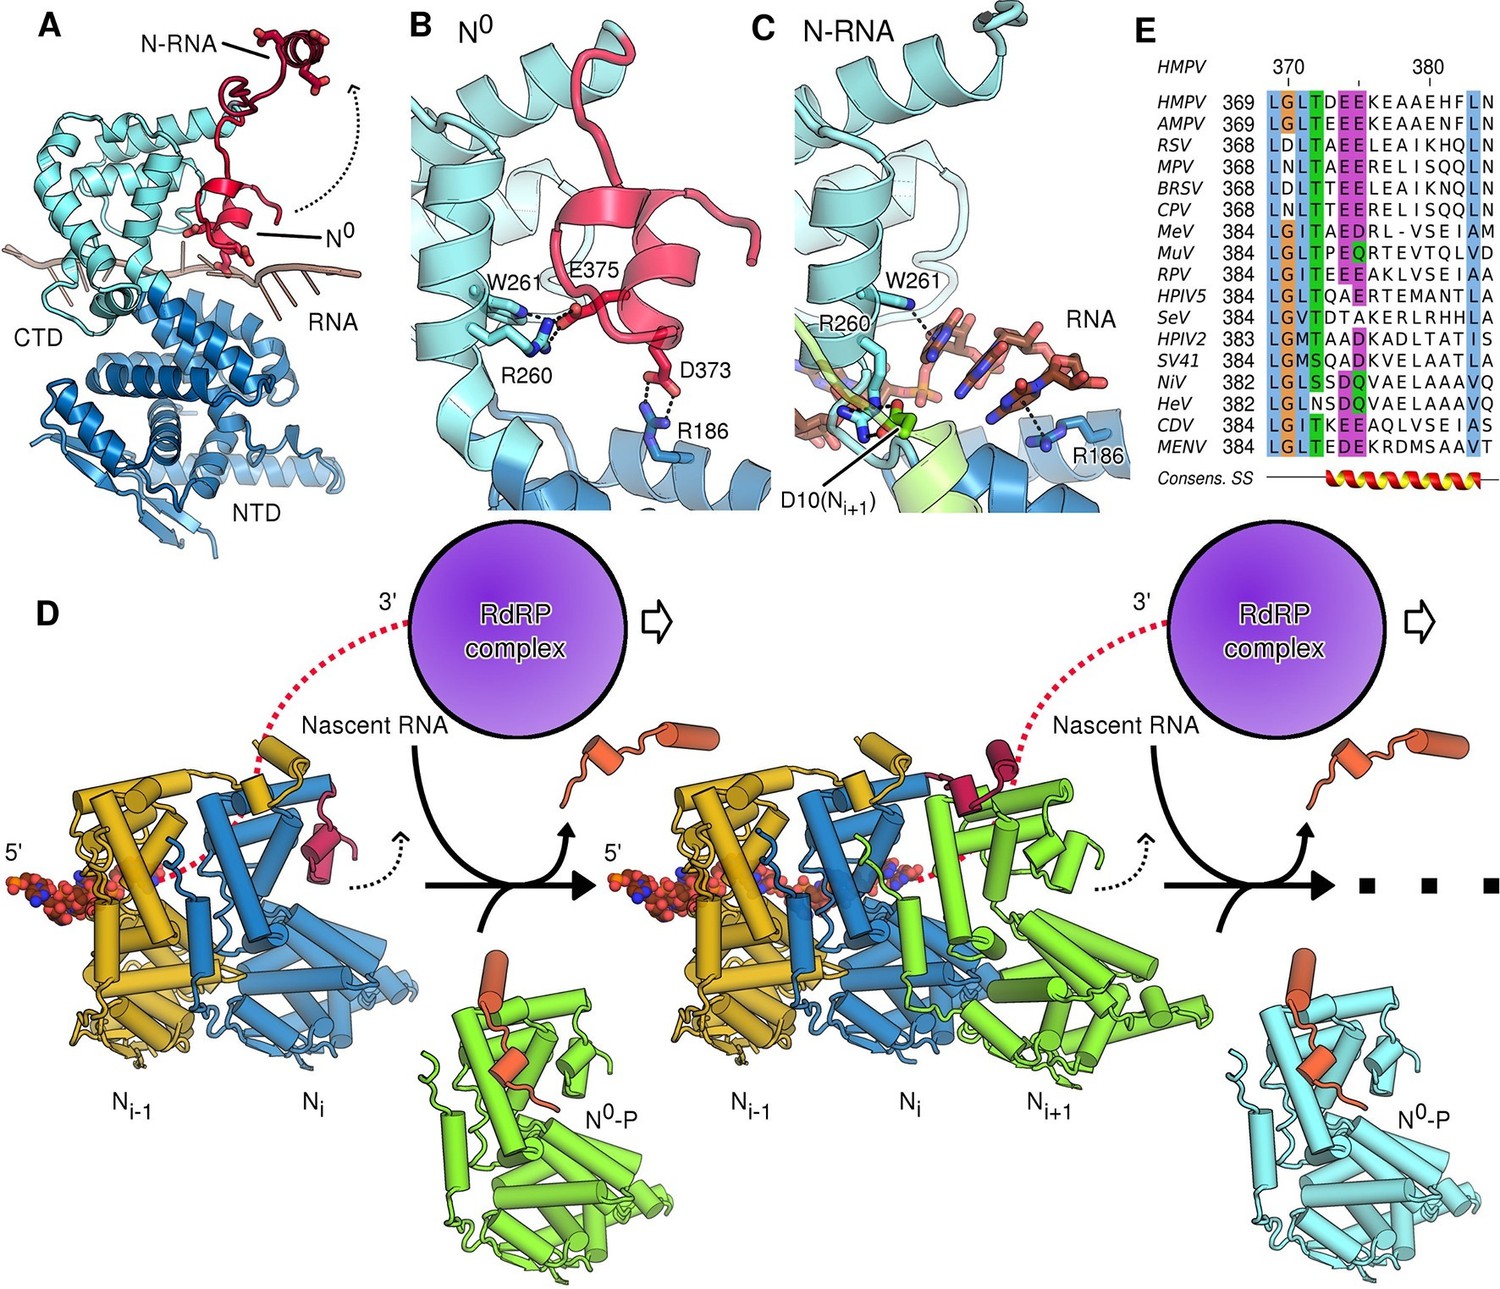
Role of the CTD-arm in inhibiting premature RNA uptake.
(A) Conformational switch of the CTD-arm. The CTD-arm (red) is shown in a upward conformation assumed in the N-RNA state and downward conformation of the N0 state (indicated). (B) Polar interactions fastening the CTD-arm (red) in the downward conformation. Involved residues are shown as sticks. (C) in the assembled state, the CTD-arm is displaced by RNA (shown in brown). The NTD-arm of the neighboring Ni+1 protomer is colored in green. (D) Schematic model of nucleocapsid filament growth. Nascent RNA and the active RdRP complex are indicated. Binding of emerging RNA to Ni primes the displacement of P (colored in orange) and attachment of incoming Ni+1 by liberating the CTD-arm (colored in red). The dotted arrows indicate that CTD-arms switch to the upward conformation and latch onto incoming N during attachment of the next N protomer. (E) Multiple sequence alignment of CTD-arms from Paramyxoviridae family members. Residues are colored using the ClustalX color scheme. The consensus secondary structure is indicated below the alignment. Virus name abbreviations are given in Materials and methods.
Figure 3—figure supplement 1

CTD-arms in other Mononegavirales family members.
(A) Conformational change of the CTD-arm in HMPV as in Figure 3A. (B and C) negative charges within the CTD-arm are topologically conserved in Borna virus (Bornaviridae) Rudolph et al., 2003 and Ebola virus (Filoviridae). Downwards motion of the CTD-arms could position them into the RNA-binding cleft (indicated by dotted arrows), analogous to what is observed in HMPV.
Tables
Table 1
Data collection and refinement statistics.
| N0-P | N-RNA | |
|---|---|---|
| Data collection | ||
| Space group | P 1 | C 2 2 21 |
| Cell dimensions | ||
| a, b, c (Å) | 40.9, 62.8, 86.7 | 202.0, 233.2, 203.6 |
| α, β, γ (°) | 91.0, 96.4, 109.0 | 90, 90, 90 |
| Wavelength (Å) | 0.979 | 0.917 |
| Resolution (Å) | 28.42-1.86 (1.91-1.86) | 101.19-4.17 (4.28-4.17) |
| CC (1/2) | 1.00 (0.47) | 1.00 (0.38) |
| Rmerge | 0.055 (0.590) | 0.220 (2.924) |
| I / σI | 9.2 (1.1) | 9.2 (1.0) |
| Completeness (%) | 94.8 (75.0) | 99.9 (100) |
| Redundancy | 1.7 (1.6) | 13.5 (13.8) |
| Refinement | ||
| Resolution (Å) | 28.42-1.86 | 101.19-4.17 |
| No. reflections | 64451 (3743) | 36125 (2617) |
| Rwork / Rfree | 17.1/20.53 | 19.1/23.0 |
| No. atoms | ||
| Protein | 5707 | 27957 |
| Non-protein | 588 | 1400 |
| B-factors | ||
| Protein | 34.54 | 216.06 |
| Non-protein | 42.56 | 215.08 |
| R.m.s. deviations | ||
| Bond lengths (Å) | 0.007 | 0.010 |
| Bond angles (°) | 1.000 | 1.120 |
| Ramachandran plot quality | ||
| Favoured (%) | 99.72 | 95.01 |
| Allowed (%) | 0.28 | 4.96 |
| Outliers (%) | 0.00 | 0.03 |
-
Numbers in parentheses refer to the highest resolution shell.
-
Rfree was calculated as per Rwork for a 5% subset of reflections that was not used in the crystallographic refinement.
-
Molprobity scores are included in the Methods section.
Download links
A two-part list of links to download the article, or parts of the article, in various formats.
Downloads (link to download the article as PDF)
Open citations (links to open the citations from this article in various online reference manager services)
Cite this article (links to download the citations from this article in formats compatible with various reference manager tools)
Nucleocapsid assembly in pneumoviruses is regulated by conformational switching of the N protein
eLife 5:e12627.
https://doi.org/10.7554/eLife.12627


