Multi-functional roles for the polypeptide transport associated domains of Toc75 in chloroplast protein import
- Michigan State University, United States
- University of California, United States
Figures
Figure 1 with 1 supplement
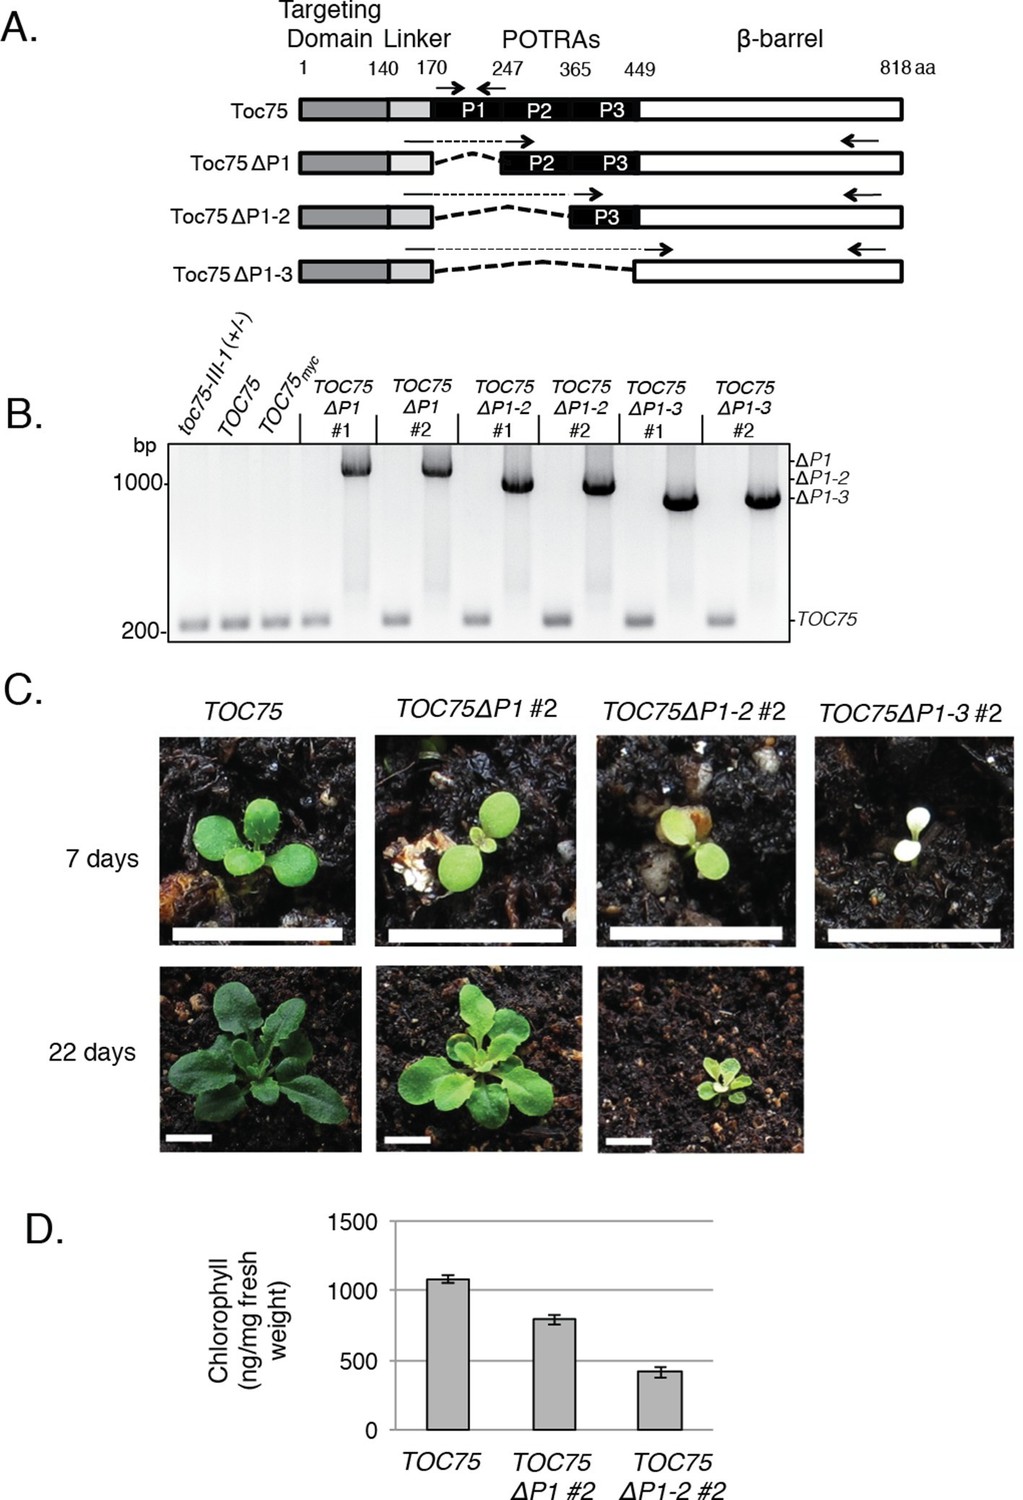
Phenotypes of TOC75ΔP1, TOC75ΔP1-2 or TOC75ΔP1-3 in toc75-III-1 plants.
(A) Schematic diagram of Toc75 and Toc75ΔP1, Toc75ΔP1-2 or Toc75ΔP1-3 proteins used in this study. The dashed line represents the deleted POTRA domain region in various constructs. The numbers refer to the amino acid position, with 1 indicating the N-terminal residue of mature Toc75. (B) PCR confirmation of the genotypes of heterozygous toc75-III-1 plants transformed with TOC75 and TOC75ΔP1, TOC75ΔP1-2 or TOC75ΔP1-3 constructs. Primers spanning the genomic regions encoding POTRA-1, -2 or -3 were used to distinguish between TOC75 and TOC75ΔP1, TOC75ΔP1-2 or TOC75ΔP1-3 (Table 2). The approximate positions of the primers are indicated by the forward and reverse arrows. The positions of the PCR products for TOC75 and TOC75ΔP1 (ΔP1), TOC75ΔP1-2 (ΔP1-2) and TOC75ΔP1-3 (ΔP1-3) are indicated to the right of the figure. (C) Visual phenotypes of 7- and 22-day old TOC75, TOC75ΔP1#2, TOC75ΔP1-2#2 and TOC75ΔP1-3#2 (7-day only) plants grown on soil. Bars = 1 cm (D) Chlorophyll content of 22-day old TOC75, TOC75ΔP1#2, TOC75ΔP1-2#2 plants.
Figure 1—figure supplement 1
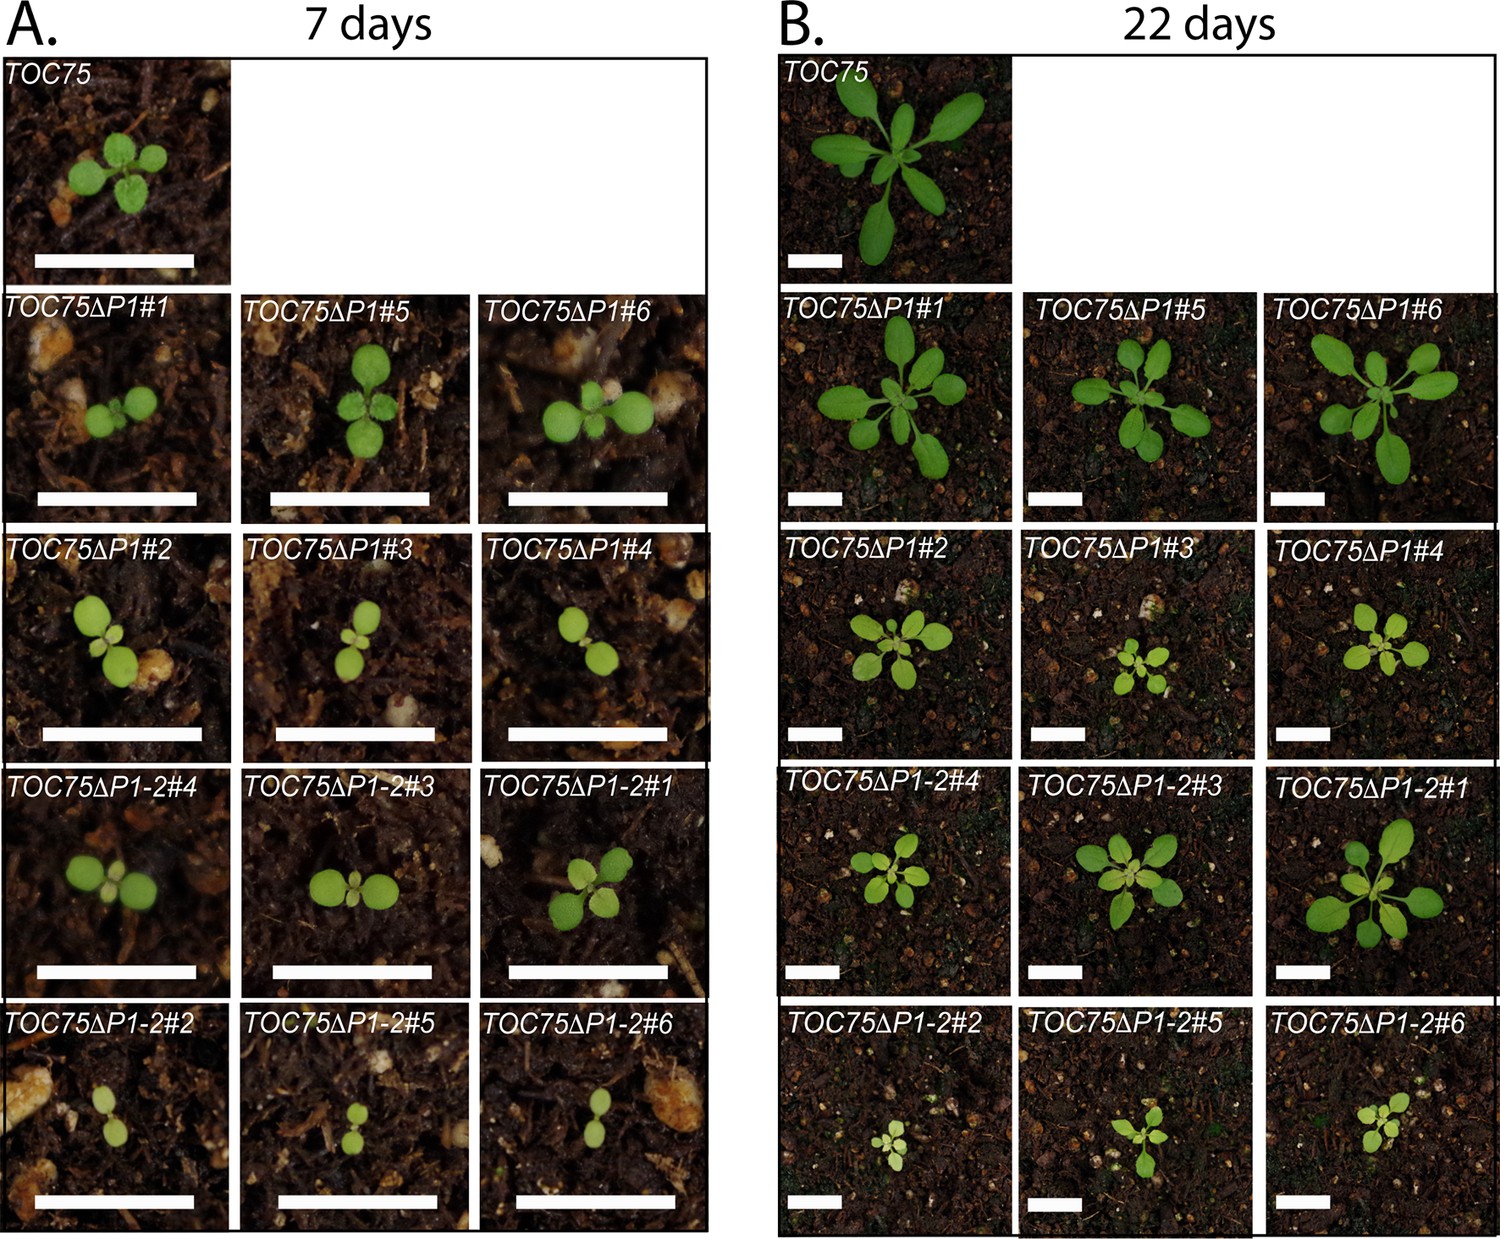
Phenotypes for individual transgenic toc75-III-1 lines expressing TOC75ΔP1 or TOC75ΔP1-2.
Visual phenotypes of 7- and 22-day old TOC75, TOC75ΔP1 and TOC75ΔP1-2 plants grown on soil. Bars = 1 cm
Figure 2 with 1 supplement

Dominant negative phenotypes exhibited by plants expressing Toc75ΔP1 or Toc75ΔP1-2.
(A) Phenotypes of wild type, toc75-III-1 (+/-) and TOC75 plants compared to plants expressing lower (TOC75ΔP1#1 and TOC75ΔP1-2#1) or higher (TOC75ΔP1#2 and TOC75ΔP1-2#2) levels of Toc75ΔP1 and Toc75ΔP1-2, respectively. Plants were grown for 14 days on agar media containing 20 μg/ml hygromycin. (B) Toc75, Toc75ΔP1 or Toc75ΔP1-2 mRNA levels in the transgenic plants indicated at the bottom of the graph as determined by quantitative real-time PCR. The primers used for RT-qPCR are listed in Table 3. Data represent the mean of three replicates. Error bars represent standard deviation. (C) Immunoblots of protein extracts from TOC75, TOC75ΔP1#1, TOC75ΔP1-2#1, TOC75ΔP1#2 and TOC75ΔP1-2#2 plants using anti-atToc75 sera. The positions of Toc75, Toc75ΔP1 (ΔP1) or Toc75ΔP1-2 (ΔP1-2) are indicated to the right of the figure. Immunoblots of actin, a loading control, are shown in the bottom panel.
Figure 2—figure supplement 1
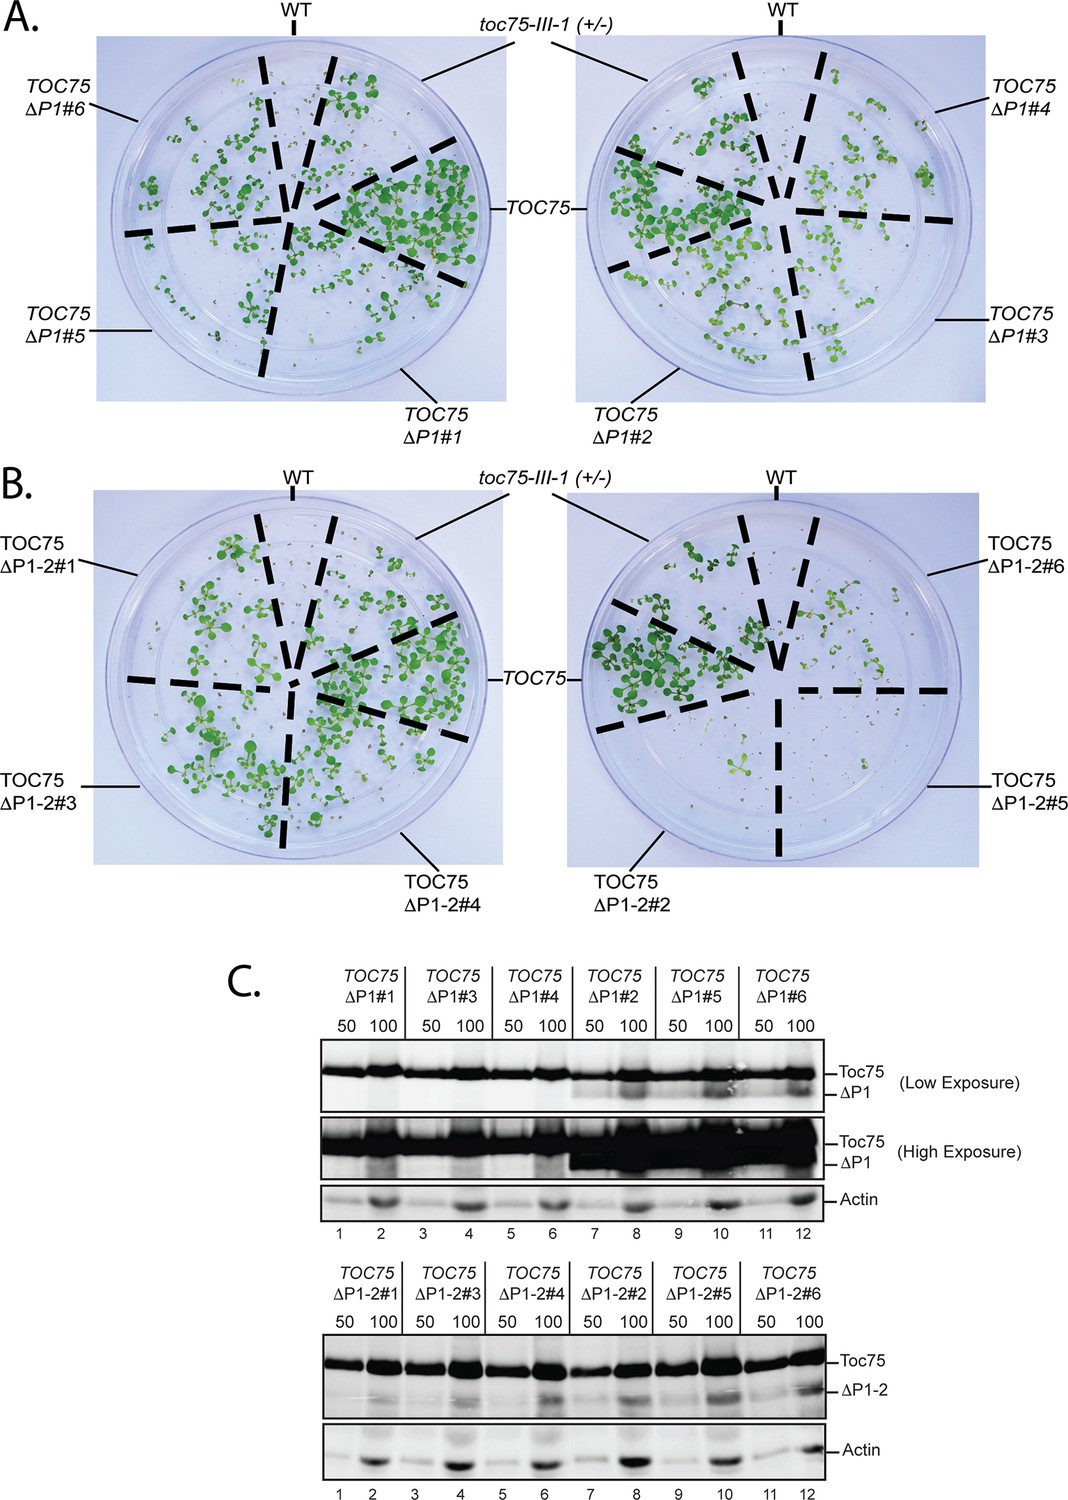
Dominant negative phenotypes exhibited by plants expressing various levels of Toc75ΔP1 or Toc75ΔP1-2.
(A) and (B) Phenotypes of wild type, toc75-III-1 (+/-) and TOC75 plants compared to plants expressing lower (TOC75ΔP1#1, #3 and #4) or higher (TOC75ΔP1#2, #5 and #6) levels of Toc75ΔP1 or lower (TOC75ΔP1-2#1, #3 and #4) or higher (TOC75ΔP1-2#2, #5 and #6) levels of Toc75ΔP1-2. A low and high exposure of the blots for the extracts from the TOC75ΔP1 plants is presented to allow visualization of the bands corresponding to Toc75ΔP1 (ΔP1). All plants were grown for 14 days on agar media containing 20 μg/ml hygromycin. (C) Immunoblots of protein extracts from lines expressing Toc75ΔP1 or Toc75ΔP1-2 shown in (A) and (B). The positions of Toc75, Toc75ΔP1 (ΔP1) or Toc75ΔP1-2 (ΔP1-2) are indicated to the right of the figure. Immunoblots of actin, a loading control, are shown in the bottom panel.
Figure 3
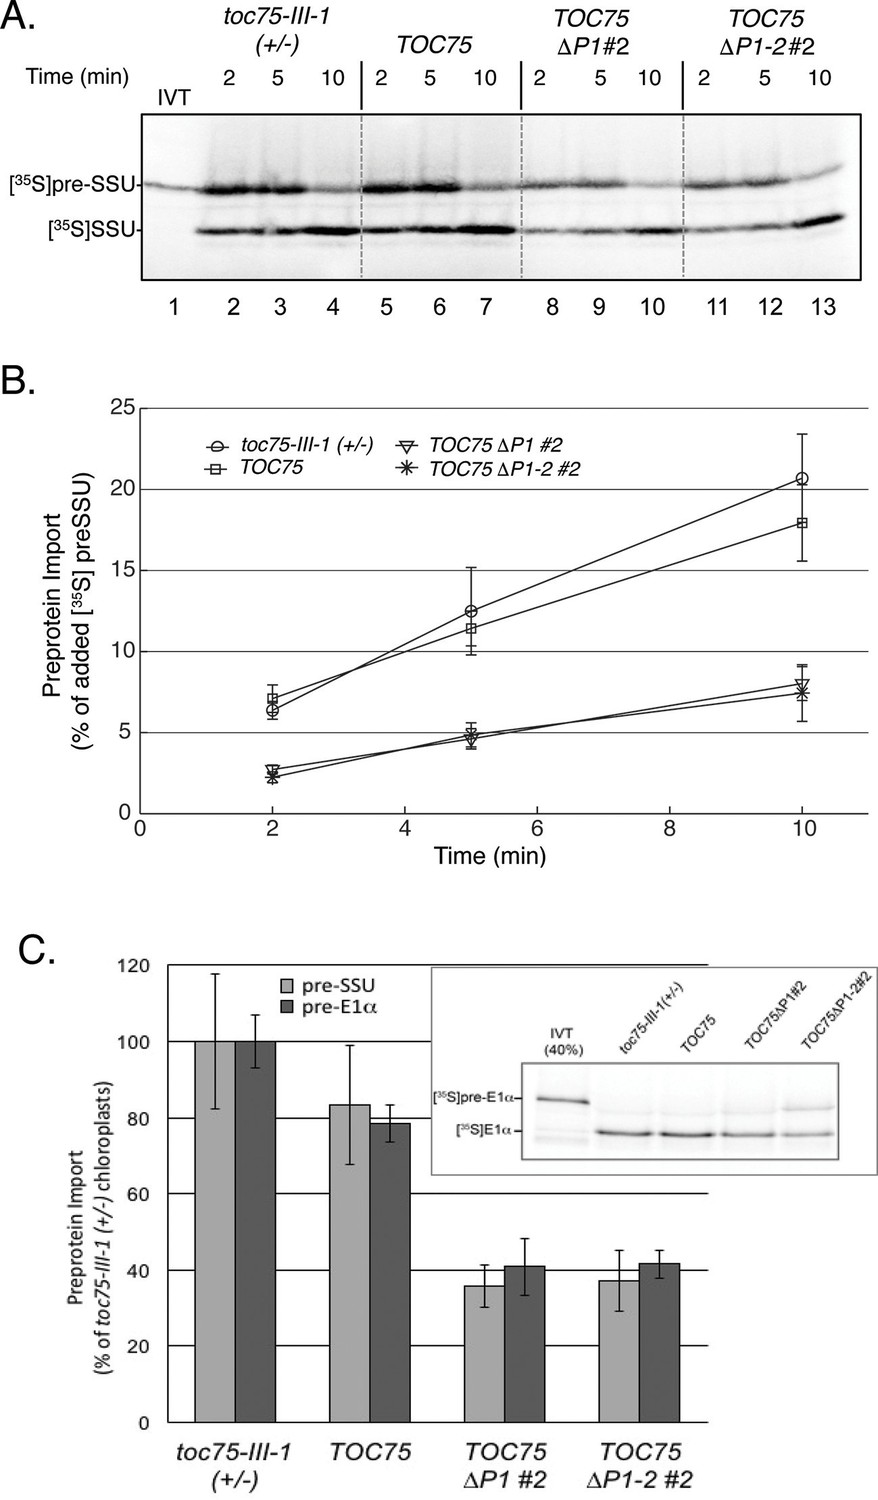
Preprotein import is decreased in chloroplasts isolated from TOC75ΔP1#2 and TOC75ΔP1-2#2 plants compared to toc75-III-1 (+/-) or TOC75 plants.
(A) In vitro import with isolated chloroplasts from TOC75ΔP1#2 and TOC75ΔP1-2#2 plants. In vitro-translated [35S]preSSU was incubated with equivalent numbers of chloroplasts (107 chloroplasts) from toc75-III-1 (+/-), TOC75, TOC75ΔP1#2 and TOC75ΔP1-2#2 plants under import conditions in the presence of 3 mM ATP for the times indicated. Lane 1 contains 10% of the [35S]preSSU added to each reaction (IVT). Dashed lines indicate that the panels in the figure were generated from different regions of the same SDS-PAGE gel using samples from the same experiment. The chloroplasts were analyzed directly by SDS-PAGE and phosphor imaging. (B) Quantitative analysis of the protein import assays in (A). Data represent the mean of triplicate experiments, with bars indicating standard error. (C) Comparison of the import of in vitro-translated [35S]preSSUand [35S]preE1α into isolated chloroplasts from toc75-III-1 (+/-), TOC75, TOC75ΔP1#2 and TOC75ΔP1-2#2 plants. Import is presented as a percentage of the import of each preprotein observed in toc75-III-1 (+/-) chloroplasts. [35S]preSSU import data for the graph were derived from (A). The inset shows a representative gel of the triplicate experiments used to generate the graph for [35S]preE1α. Lane 1 contains 40% of the [35S]pre E1α added to each reaction (IVT).
Figure 4
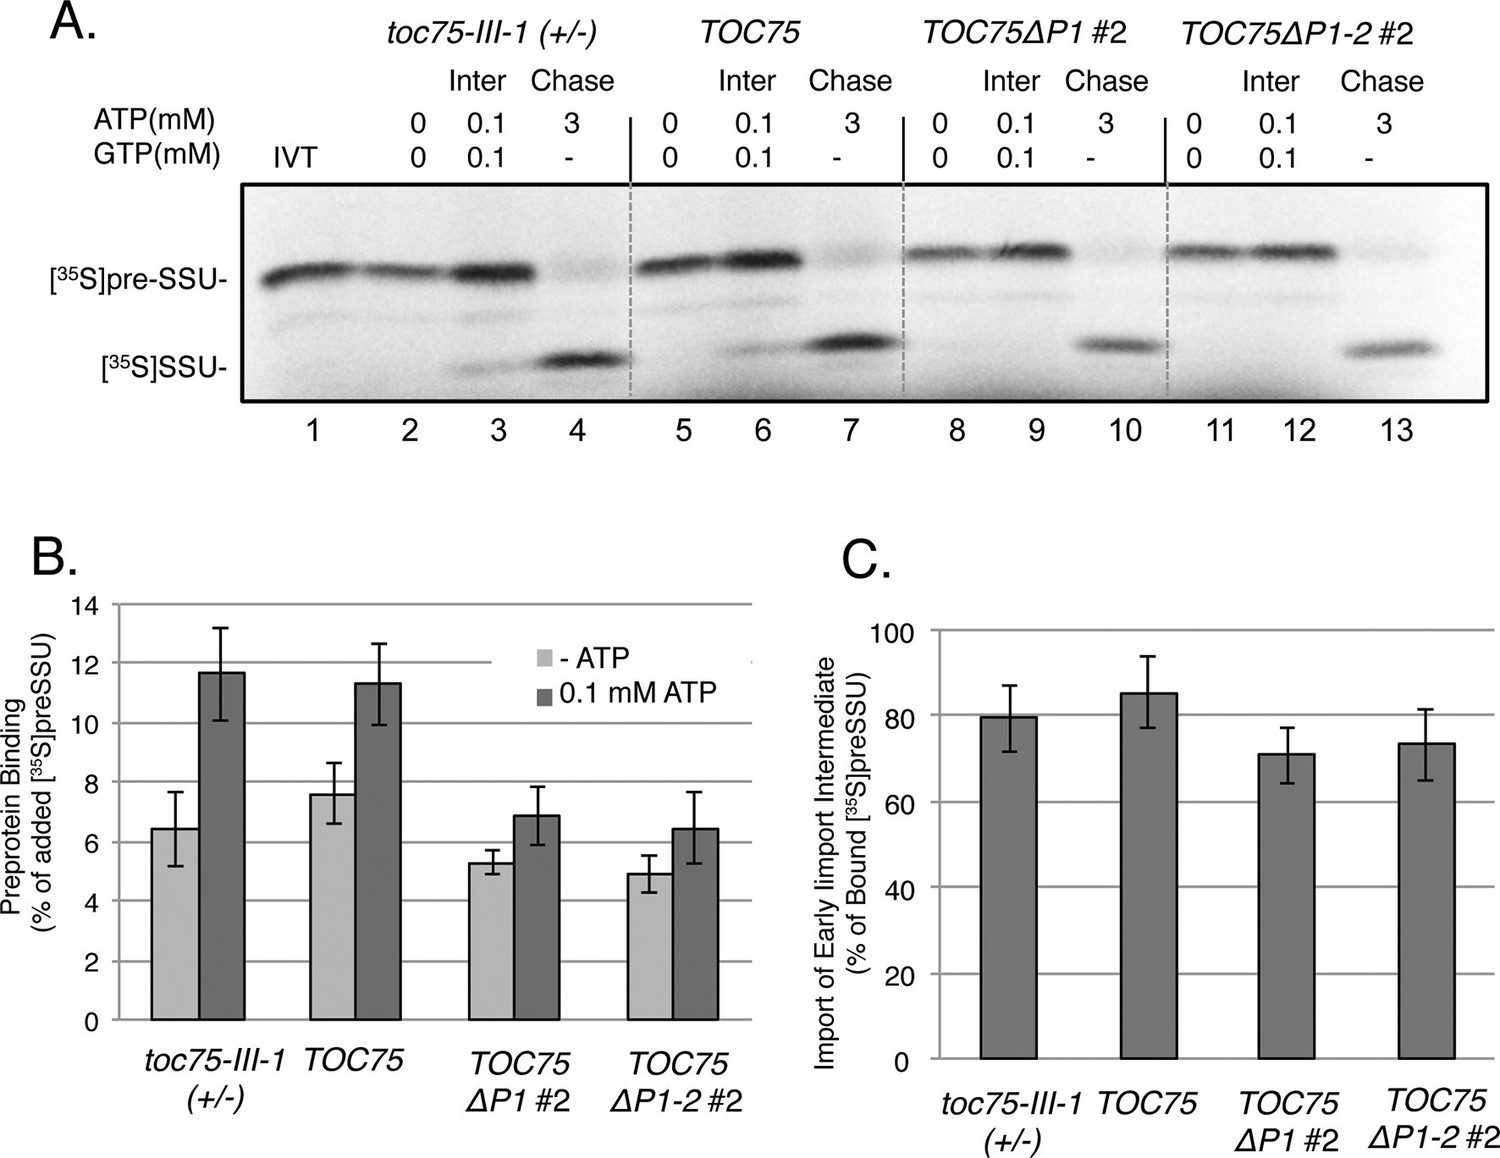
Deletion of POTRA-1 and -2 disrupt preprotein translocation across the outer membrane.
(A) Energy-dependent and independent binding of [35S]preSSU to chloroplasts from TOC75ΔP1#2 and TOC75ΔP1-2#2 plants. In vitro-translated [35S]preSSU was incubated at 26°C for 5 min with chloroplasts (107) from toc75-III-1 (+/-), TOC75, TOC75ΔP1#2 and TOC75ΔP1-2#2 plants in the absence of exogenous energy or in the presence of 0.1 mM ATP and GTP to promote translocation across the outer membrane and form an early import intermediate (Inter). toc75-III-1 (+/-), TOC75, TOC75ΔP1#2 and TOC75ΔP1-2#2 chloroplasts (107) containing bound early import intermediate (Inter) were reisolated and resuspended in the presence of 3 mM ATP to promote full translocation of the bound preprotein into the stroma (Chase). Lane 1 contains 10% of the in vitro translated [35S]preSSU added to each reaction (IVT). Dashed lines indicate that the figure was generated from different regions of the same SDS-PAGE gel using samples from the same experiment. The chloroplasts were analyzed directly by SDS-PAGE and phosphor imaging. (B) Quantitation of the [35S]preSSU early import intermediate from (A). (C) Quantitation of [35S]SSU imported from the chase experiment in (A). Data represent the mean of triplicate experiments, with bars indicating standard error.
Figure 5
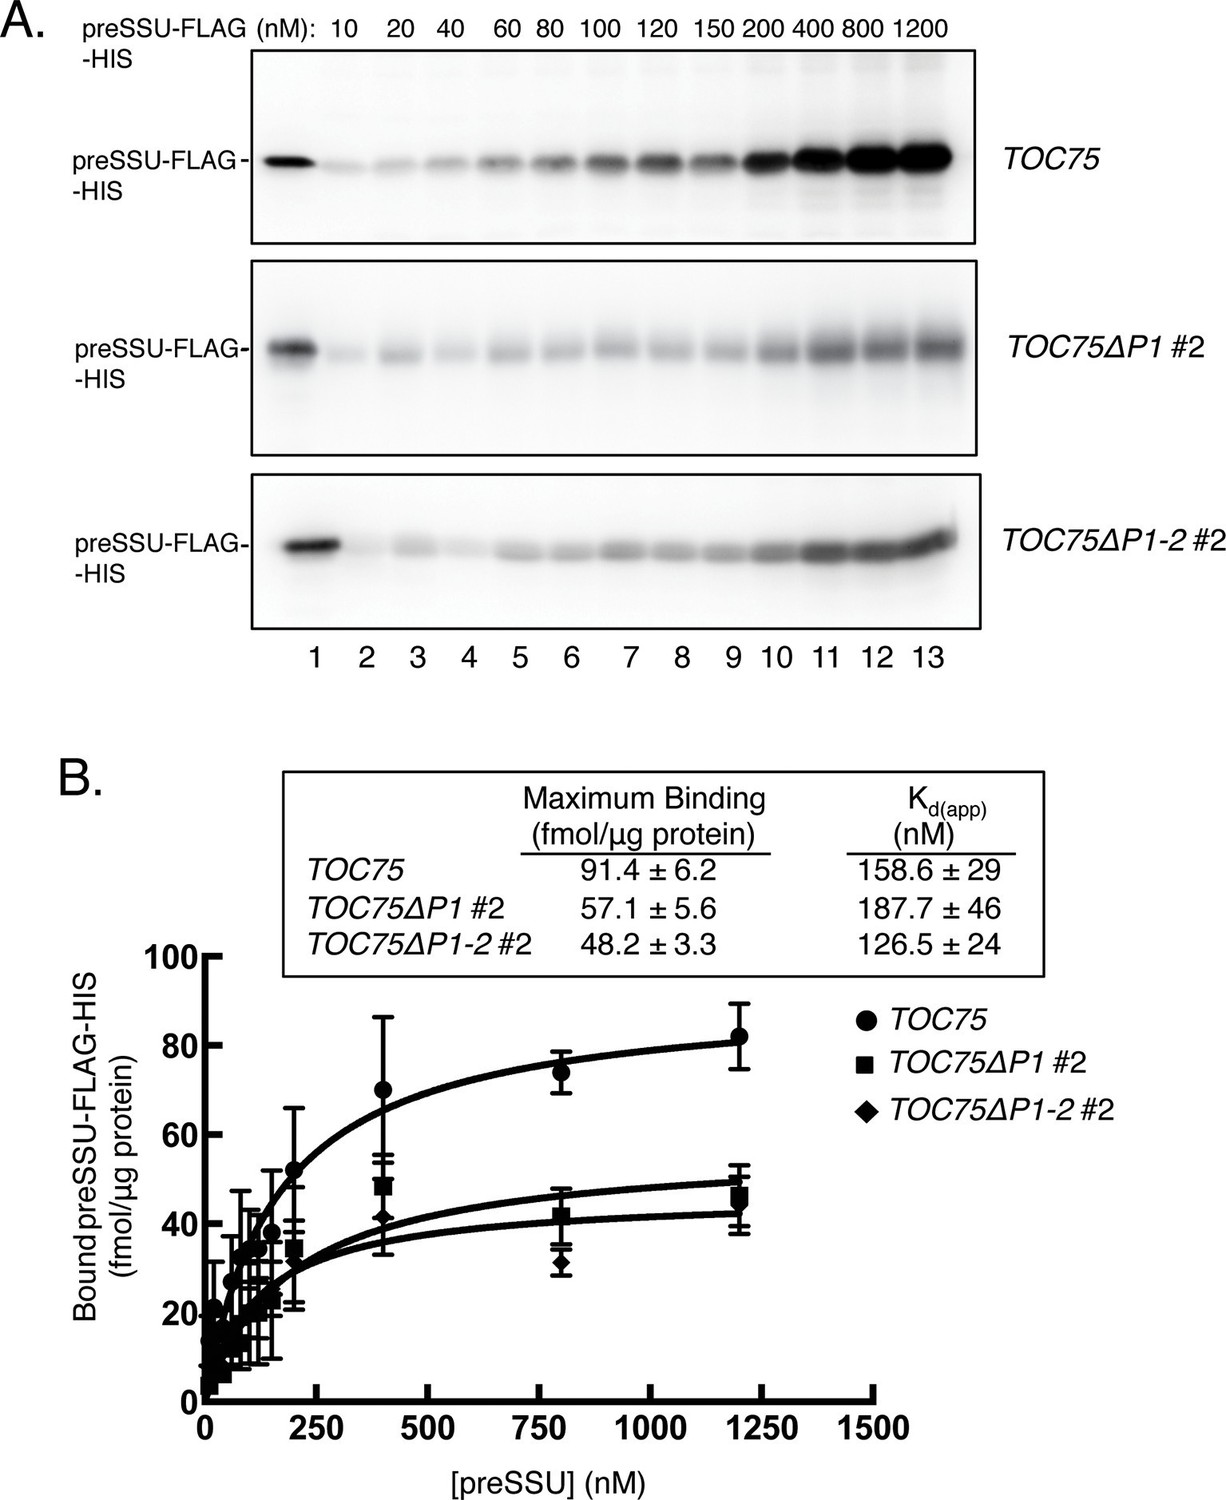
Expression ofToc75ΔP1 and Toc75ΔP1-2reduces the number of import-competent TOC complexes.
(A) Saturation binding of preprotein in chloroplasts from TOC75ΔP1#2 and TOC75ΔP1-2#2 plants. Isolated chloroplasts (107) from TOC75, TOC75ΔP1#2 and TOC75ΔP1-2#2 plants were incubated with increasing amounts of E. coli-expressed, urea-denatured preSSU-FLAG-HIS in the presence of 0.1 mM ATP and GTP at 26°C for 5 min, to promote formation of an early import intermediate. Chloroplasts were reisolated through Percoll silica gel, resolved by SDS-PAGE, and the early import intermediate form of preSSU-FLAG-HIS was detected by immunoblotting with anti-FLAG. Lane 1 contains 0.64 pmol of the preSSU-FLAG-HIS. (B) Quantitation of the data from (A). Saturation binding analysis of the data in (A) is presented in the table inset. The maximum number of binding sites (Maximum Binding) and apparent Kd were calculated by nonlinear fitting of the data in (A). Each data bar represents the mean ± SD (n = 3).
Figure 6
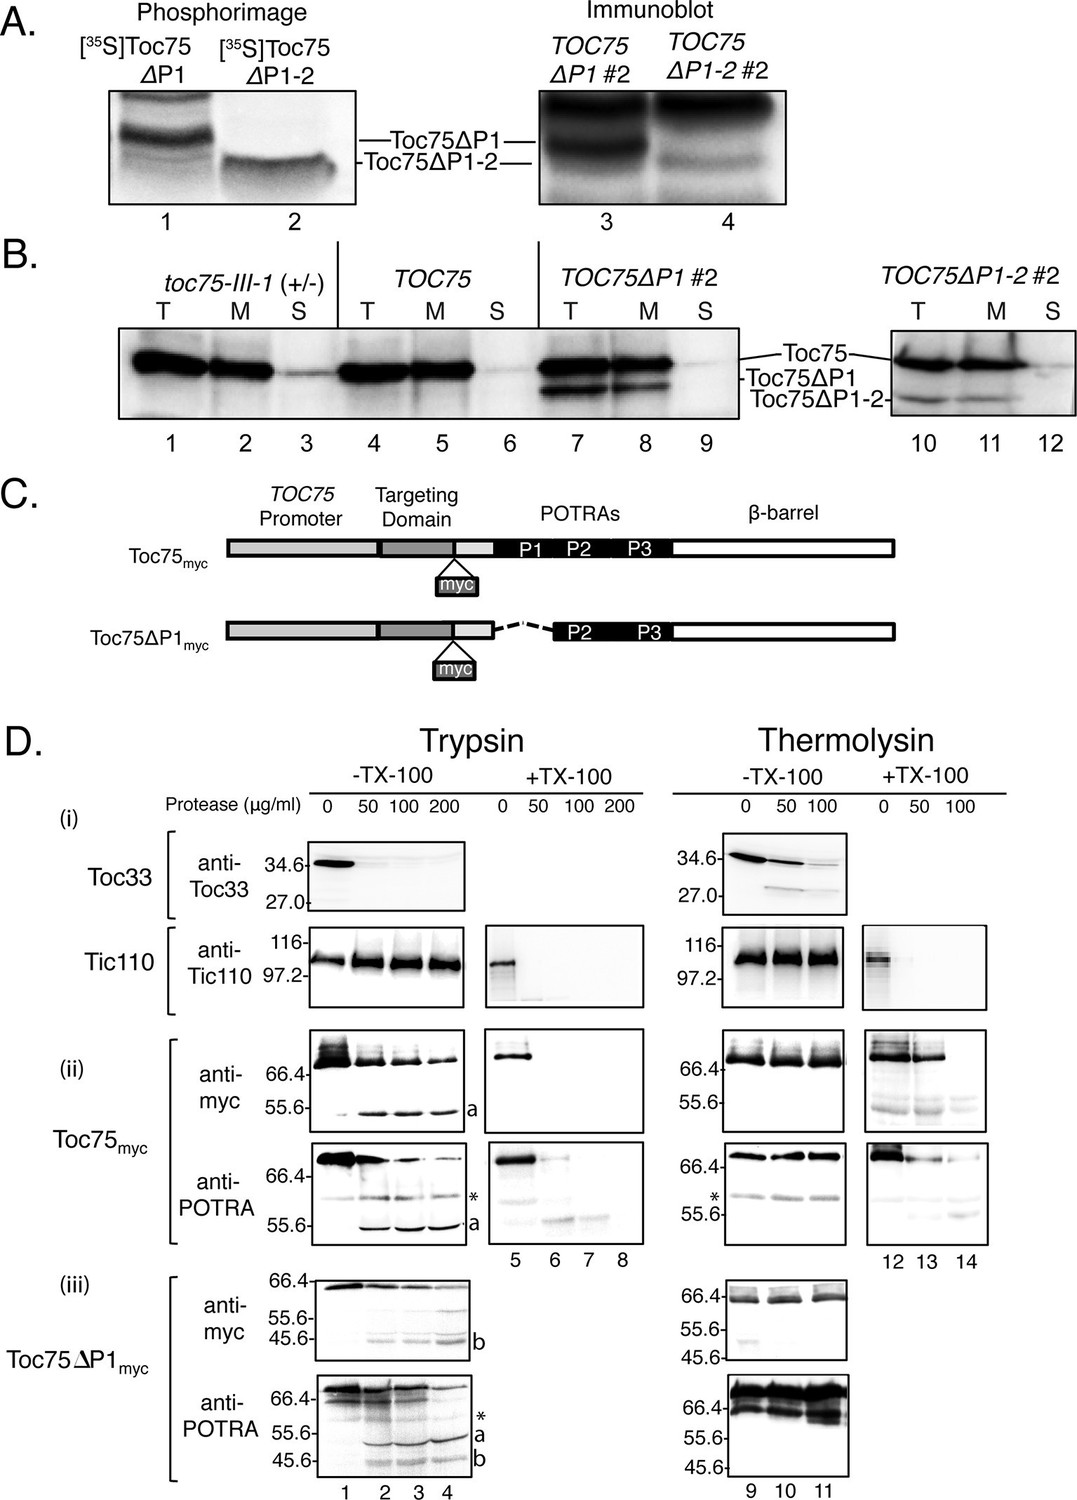
Toc75ΔP1 and Toc75ΔP1-2are properly targeted to the outer membrane with the POTRA domains oriented to the intermembrane space.
(A) Toc75ΔP1 and Toc75ΔP1-2 accumulate as their mature forms in TOC75ΔP1#2 and TOC75ΔP1-2#2 plants. In vitro translated mature [35S]Toc75ΔP1 and [35S]Toc75ΔP1-2 were mixed with chloroplasts extracts from TOC75ΔP1#2 and TOC75ΔP1-2#2 plants and analyzed by SDS-PAGE. The mobility of [35S]Toc75ΔP1 and [35S]Toc75ΔP1-2, detected by phosphorimaging (Lanes 1 and 2), was compared to the mobility of endogenous Toc75ΔP1 and Toc75ΔP1-2, detected by immunoblotting with anti-atToc75 serum (Lanes 3 and 4). (B) Toc75ΔP1 and Toc75ΔP1-2 are integrated into the chloroplast envelope. Isolated chloroplasts (T) from heterozygous toc75-III-1, TOC75, TOC75ΔP1#2 and TOC75ΔP1-2#2 plants were hypotonically lysed and fractionated by centrifugation at 18,000 × g for 30 min at 4°C into membrane pellet (M) and soluble (S) fractions. Equivalent samples of each fraction from chloroplasts corresponding to 10 μg chlorophyll was resolved by SDS-PAGE and immunoblotted with anti-atToc75 serum. (C) Toc75myc and Toc75ΔP1myc constructs used in this study. The dashed line represents the deleted POTRA domain region in POTRA1-deleted constructs. The site of insertion of myc tag is shown in each panel. (D) Protease sensitivity of Toc75myc, and Toc75ΔP1myc proteins in isolated intact chloroplasts. Intact chloroplasts from TOC75, TOC75myc and TOC75ΔP1myc seedlings were treated with trypsin or thermolysin in the absence (-) or presence (+) of 1% Triton X-100. Reactions were incubated on ice for 30 min, and proteolysis was stopped with 2.5 mM PMSF, 0.05 mg/mL Nα-Tosyl-L-lysine chloromethyl ketone (TLCK), 0.25 mg/mL soybean trypsin inhibitor, and 2 μg/mL aprotinin (for trypsin) or 20 mM EDTA (for thermolysin). Chloroplasts were analyzed by immunoblotting with antibodies against various proteins as indicated. The asterisk indicates the position of a non-specific immunoreactive band. a and b denote bands corresponding to the ~55 kDa and ~46 kDa trypsin fragments of Toc75myc and Toc75ΔP1myc, respectively.
Figure 7
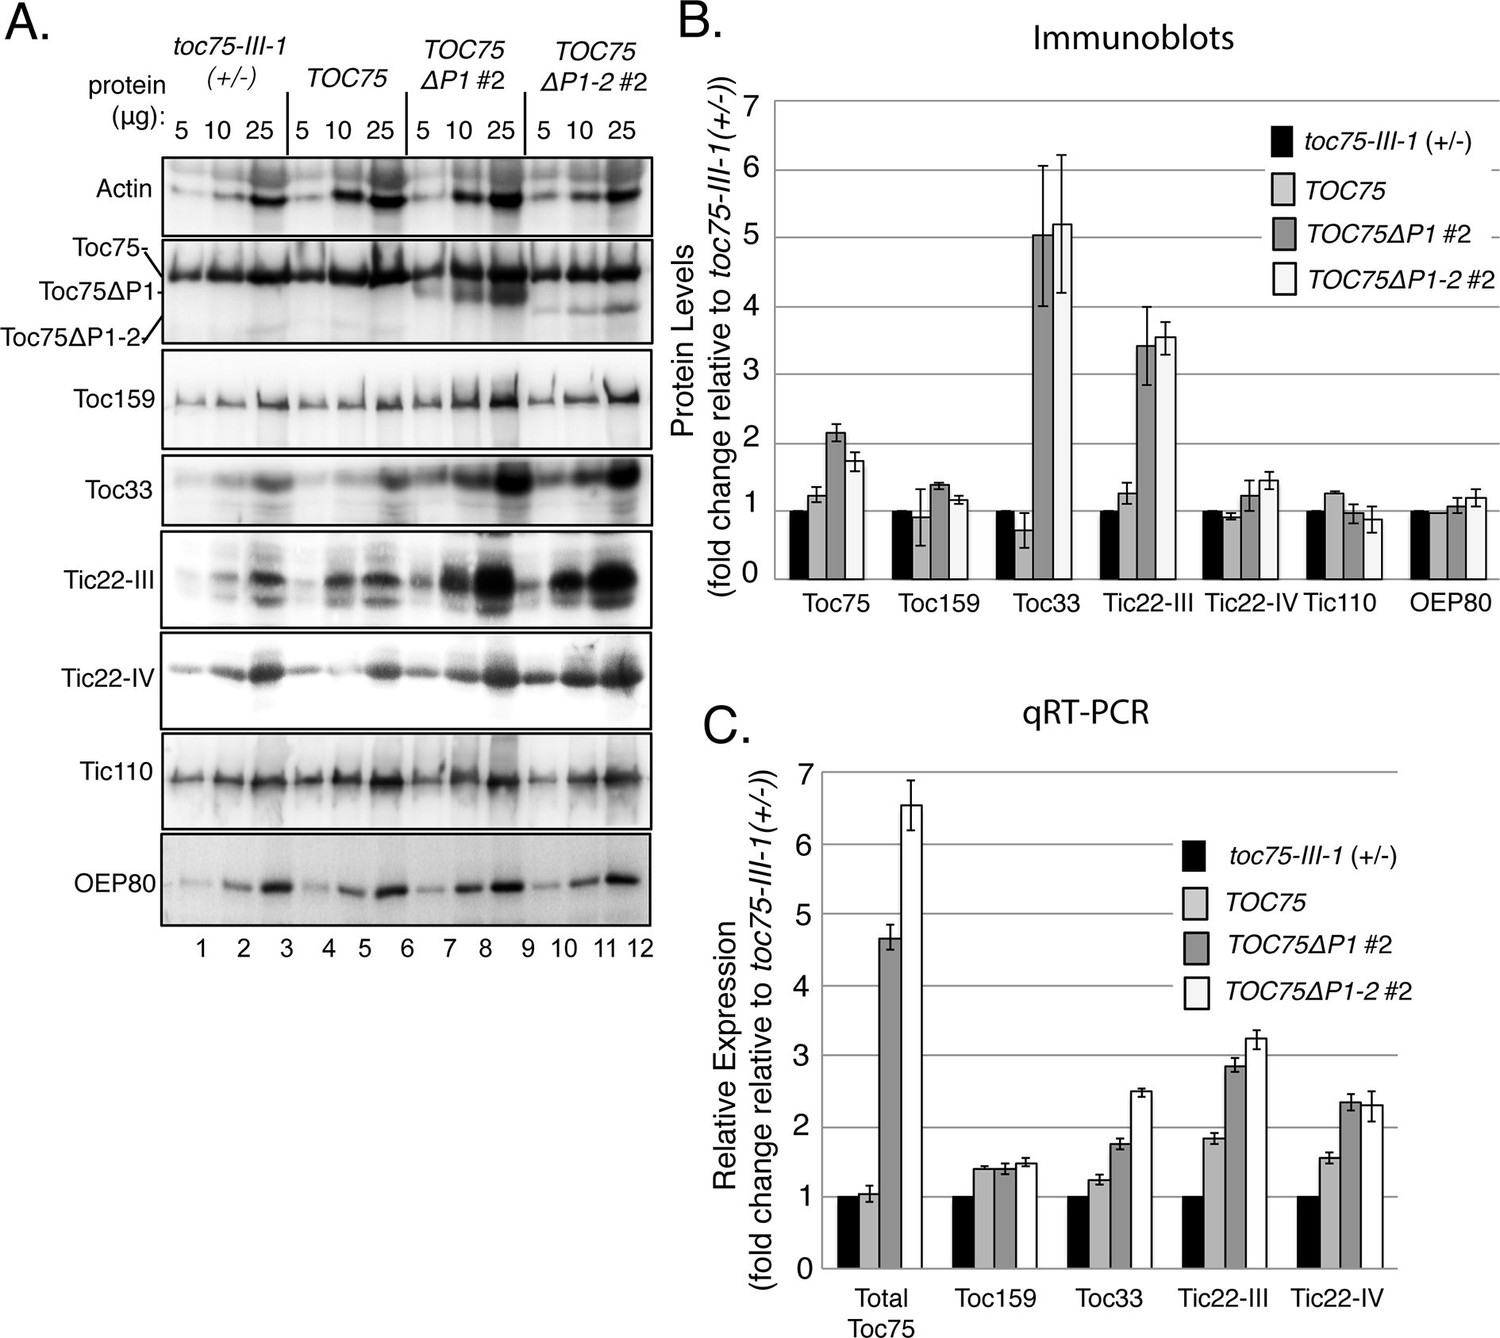
Accumulation of outer envelope proteins in TOC75ΔP1#2 and TOC75ΔP1-2#2 plants.
(A) Serial dilutions of protein extracts from toc75-III-1 (+/-), TOC75, TOC75ΔP1#2 and TOC75ΔP1-2#2 plants were immunoblotted using antisera corresponding to the proteins indicated at the left. (B) Relative quantitation of plastid proteins. The signal intensities falling within the linear range of chemiluminescence detection were normalized to the signal for actin in each sample and plotted as fold change relative to the levels of the corresponding protein in toc75-III-1 (+/-) plants. (C) Relative expression of various proteins analyzed by RT-qPCR from toc75-III-1 (+/-), TOC75, TOC75ΔP1#2 and TOC75ΔP1-2#2 plants. The values are normalized to the internal levels of actin mRNA and plotted as the fold change relative to the levels of the corresponding mRNA in toc75-III-1 (+/-) plants. Each error bar represents the mean ± SD (n = 3).
Figure 8
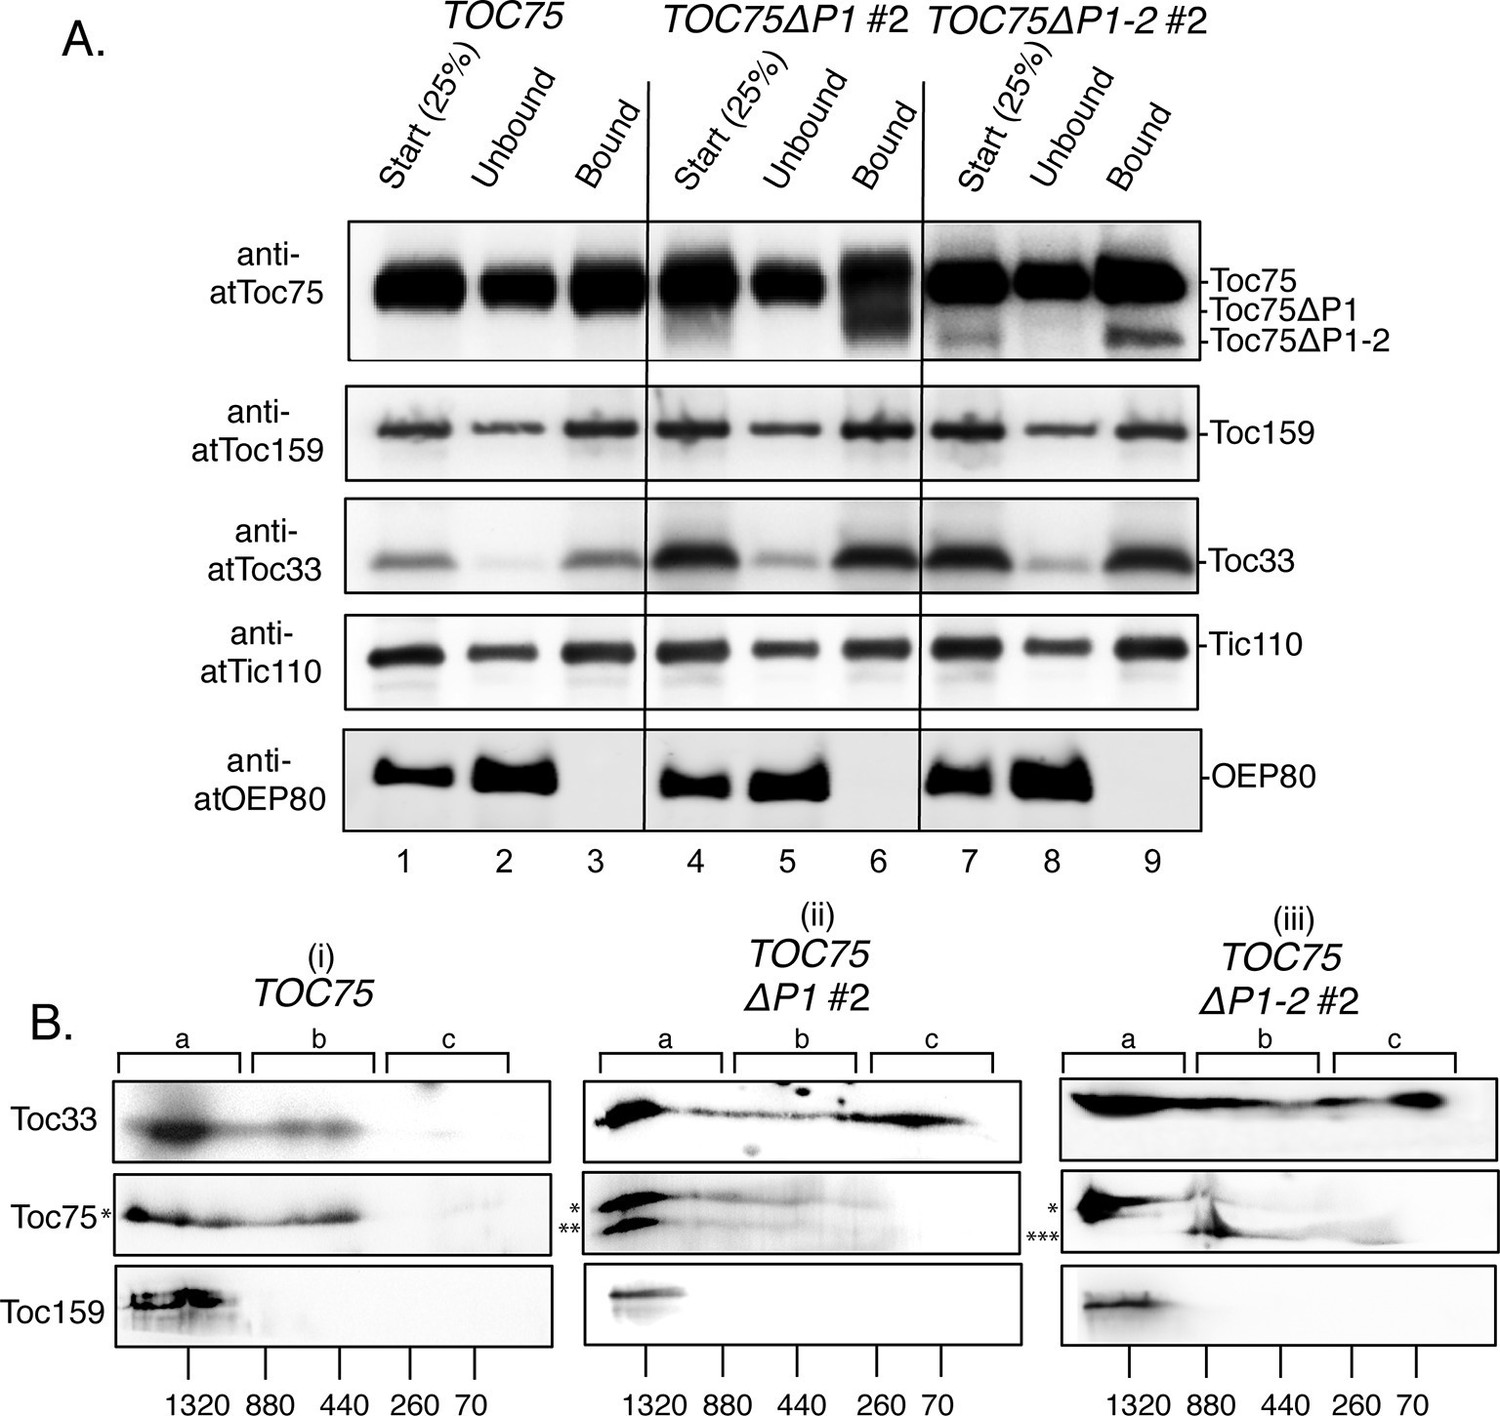
Toc75ΔP1 and Toc75ΔP1-2 interfere with the stoichiometric assembly of TOC complexes.
(A) Co-immunoprecipitation of Toc75ΔP1 and Toc75ΔP1-2 with Toc33 and Toc159. Detergent-soluble chloroplast membranes from TOC75, TOC75ΔP1#2 and TOC75ΔP1-2#2 plants were subjected to immunoaffinity chromatography on anti-atToc33 Sepharose. Twenty-five percent of the total extracts (Start) and unbound fractions (Unbound) or the eluate fractions (Bound) were resolved by SDS-PAGE and immunoblotted with antisera indicated to the left of each panel. (B) 2D Blue-native PAGE analysis of chloroplast membranes from TOC75, TOC75ΔP1#2 and TOC75ΔP1-2#2 plants. Chloroplast membranes from TOC75 (i), TOC75ΔP1#2 (ii) and TOC75ΔP1-2#2 (iii) plants were subjected to 4–12% BN-PAGE in the first dimension followed by 5–12% SDS-PAGE in the second dimension. Proteins were then transferred to a PVDF membrane and immunoblotted with the antisera indicated to the left of each panel. The positions of the major 1.3 MDa (region a), 440 kDa (region b) and 70 kDa (region c) complexes are indicated at the top of each panel. Asterisks to the left of the middle panels indicate the positions of the bands corresponding Toc75 (*), Toc75ΔP1 (**) and Toc75ΔP1-2 (***).
Figure 9

Toc75 POTRA domains interact directly with chloroplast preproteins and Tic22 isoforms.
(A) Binding of Tic22-III, Tic22-IV and preSSU to immobilized Toc75 POTRA domains. [35S]-labeled Tic22-III, Tic22-IV, preSSU and SSU were incubated with increasing amounts of Ni-NTA resin-immobilized Toc75 POTRA-His. Lane 2 in A shows the background binding of radiolabeled proteins to the Ni-NTA resin in the absence of POTRAs. In all cases, binding to Ni-NTA resin alone (lane 2) was less than 10% of added radiolabelled protein. (B) Quantitation of the binding in (A). Binding is presented as the percentage of added [35S]-labeled proteins recovered in each reaction after subtracting binding to Ni-NTA resin alone (lane 2). (C) Binding of POTRA domains to preSSU, Tic22-III or Tic22-IV is specific. Two hundred picomole immobilized POTRA-His was incubated with [35S]-labeled preSSU, Tic22-III or Tic22-IV in the absence or presence of increasing concentrations of soluble POTRA domains or SSU as a competitor. (D) Quantitation of the binding in (C). Binding is presented as the percentage of maximal initial binding. Each data bar represents the mean ± SEM (n = 3). Lanes labeled IVT in panels A and C contain 10% of the in vitro translation product added to each reaction.
Tables
Table 1
Segregation analysis of toc75-III-1 plants transformed with full-length and POTRA deletion constructs of Toc75 expressed under the TOC75 promoter.
| Parental plants | Hygromycin resistant (R) | Hygromycin sensitive (S) | R:S ratio | χ2- valuea | p0.05-valueb |
|---|---|---|---|---|---|
| A. | |||||
| toc75-III-1(+/-) | 76 | 41 | 1.85 | 0.18 | 0.67 |
| toc75-III-1(+/-) TOC75 (+/+) | 82 | 30 | 2.73 | 0.19 | 0.66 |
| toc75-III-1(+/+) TOC75 (+/+) | 119 | - | - | ||
| B. | |||||
| toc75-III-1(+/-) TOC75ΔP1(+/+)#1 | 79 | 38 | 2.08 | 3.49 | 0.062 |
| toc75-III-1(+/-) TOC75ΔP1-2(+/+)#1 | 76 | 39 | 1.95 | 4.87 | 0.027 |
| toc75-III-1(+/-) TOC75ΔP1-3(+/+)#1 | 72 | 35 | 2.06 | 3.39 | 0.065 |
| C. | |||||
| toc75-III-1(+/-) TOC75ΔP1(+/+)#2 | 67 | 48 | 1.4 | 17.19 | 0.001 |
| toc75-III-1(+/-) TOC75ΔP1-2(+/+)#2 | 64 | 50 | 1.28 | 21.62 | <0.001 |
| toc75-III-1(+/-) TOC75ΔP1-3(+/-)#2 | 61 | 59 | 1.03 | 37.37 | <0.001 |
| D. | |||||
| toc75-III-1(+/-) TOC75myc(+/+) | 112 | 38 | 2.95 | 0.009 | 0.92 |
| toc75-III-1(+/+) TOC75myc(+/+) | 115 | - | - | ||
| toc75-III-1(+/-) TOC75ΔP1myc (+/+) | 63 | 48 | 1.31 | 19.7 | <0.001 |
-
aGoodness-of-fit of the observed segregation ratios to the expected 2:1 ratio for toc75-III-1 (+/-) or expected 3:1 ratio for complementation of toc75-III-1 with the indicated TOC75 gene constructs was assessed by χ2 analysis.
-
bp-Values were calculated using Graphpad Prism software version 4.00.
Table 2
List of primers used for genotyping plants.
| Primers used for making POTRA deletions in TOC75 genomic construct for generating transgenic plant | ||||||
| For TOC75∆P1 | ||||||
| Primer 1 | CTTAGTGGTTTCAAGAAGTATTGGCAATCTGCTGATAGG | |||||
| Primer 2 | CCTATCAGCAGATTGCCAATACTTCTTGAAACCACTAAG | |||||
| For TOC75∆P1-2 | ||||||
| Primer 3 | CTTAGTGGTTTCAAGAAGTATATAACTCAGCTAGTTATTCAG | |||||
| Primer 4 | CTGAATAACTAGCTGAGTTATATACTTCTTGAAACCACTAAG | |||||
| For TOC75∆P1-3 | ||||||
| Primer 5 | CTTAGTGGTTTCAAGAAGTATCAGAAGTCAGCTGAAGCT | |||||
| Primer 6 | AGCTTCAGCTGACTTCTGATACTTCTTGAAACCACTAAG | |||||
| Primers used for myc insertions in TOC75 genomic construct for generating transgenic plant | ||||||
| For TOC75myc and TOC75∆P1myc using TOC75 and TOC75∆P1as templates, respectively | ||||||
| Primer 7 | GATGAAGAACAAAAACTTATTTCTGAAGAAGATCTGGAACAATCACCGGAT | |||||
| Primer 8 | ATCCGGTGATTGTTCCAGATCTTCTTCAGAAATAAGTTTTTGTTCTTCATC | |||||
| Primers used for genotyping transgenic plants | ||||||
| For TOC75 | ||||||
| Primer 9 | TTCTTTGATCGACGGAGAC | |||||
| Primer 10 | CAGCAAACGAGATTGTAACACC | |||||
| For TOC75∆P1 | ||||||
| Primer 11 | GGTTTCAAGAAGTATTGGCAATCTGCTGAT | |||||
| Primer 12 | GACATGTGTGTTCTTCACGGGTATTCTGATCTC | |||||
| TOC75∆P1-2 | ||||||
| Primer 13 | GGTTTCAAGAAGTATATAACTCAGCTAGTT | |||||
| Primer 14 | GACATGTGTGTTCTTCACGGGTATTCTGATCTC | |||||
| For TOC75∆P1-3 | ||||||
| Primer 15 | GGTTTCAAGAAGTATCAGAAGTCAGCTGAAGTC | |||||
| Primer 16 | GACATGTGTGTTCTTCACGGGTATTCTGATCTC | |||||
| Primers used for generating transit peptide deletions using TOC75∆P1 and TOC75∆P1-2 cDNA | ||||||
| Primer 17 | GAAGGAGATATACATATGGATGAAGAACAATCACCGG | |||||
| Primer 18 | CTACTTCTTGTTAGTGGCCCATATGTATATCTCCTTCTTAAAG | |||||
| Primers used to construct POTRA domain constructs for solid phage binding assays | ||||||
| Primer 19 | CTCGAGGGTGATGAAGAACAATCACCGG | |||||
| Primer 20 | CTCGAGTTCTAGCTCCTTAAGCTTGATCTC | |||||
Table 3
List of primers used for RT-qPCR.
| TOC75 | ||||
| Primer 21 | TTCTTTGATCGACGGAGAC | |||
| Primer 22 | CAGCAAACGAGATTGTAACACC | |||
| TOC75∆P1 | ||||
| Primer 23 | GGTTTCAAGAAGTATTGGCAATCTGCTGAT | |||
| Primer 24 | ACATCTGCATAACCTCACCATACA | |||
| TOC75∆P1-2 | ||||
| Primer 25 | GGTTTCAAGAAGTATATAACTCAGCTAGTT | |||
| Primer 26 | GCGTGGATTGACTTCAATGTT | |||
| TOTAL TOC75 | ||||
| Primer 27 | AAGCTTGGTAATGTGGTTGAA | |||
| Primer 28 | TCAACAATAATGCCCCCTTC | |||
| TOC159 | ||||
| Primer 29 | AGAACCAACCAACCCCTTCT | |||
| Primer 30 | ACCAAATTCGGCTTCTCCTT | |||
| TOC33 | ||||
| Primer 31 | GGTGCAAAACCTTGCTTGTT | |||
| Primer 32 | GGAAGAGCCTTTTCGTCCTT | |||
| TIC22-III | ||||
| Primer 33 | AAAACATGAGTTATCGCCCTGT | |||
| Primer 34 | TTGCTCAGTTGAAACCTCAAAA | |||
| TIC22-IV | ||||
| Primer 35 | ATGCGTTAGAGCTCAAATCCTC | |||
| Primer 36 | CATCTCCATTTTCCTCAACACA | |||
Download links
A two-part list of links to download the article, or parts of the article, in various formats.
Downloads (link to download the article as PDF)
Open citations (links to open the citations from this article in various online reference manager services)
Cite this article (links to download the citations from this article in formats compatible with various reference manager tools)
Multi-functional roles for the polypeptide transport associated domains of Toc75 in chloroplast protein import
eLife 5:e12631.
https://doi.org/10.7554/eLife.12631


