Dopamine regulates stimulus generalization in the human hippocampus
- Northwestern University Feinberg School of Medicine, United States
- University of Zurich, Switzerland
Figures
Figure 1
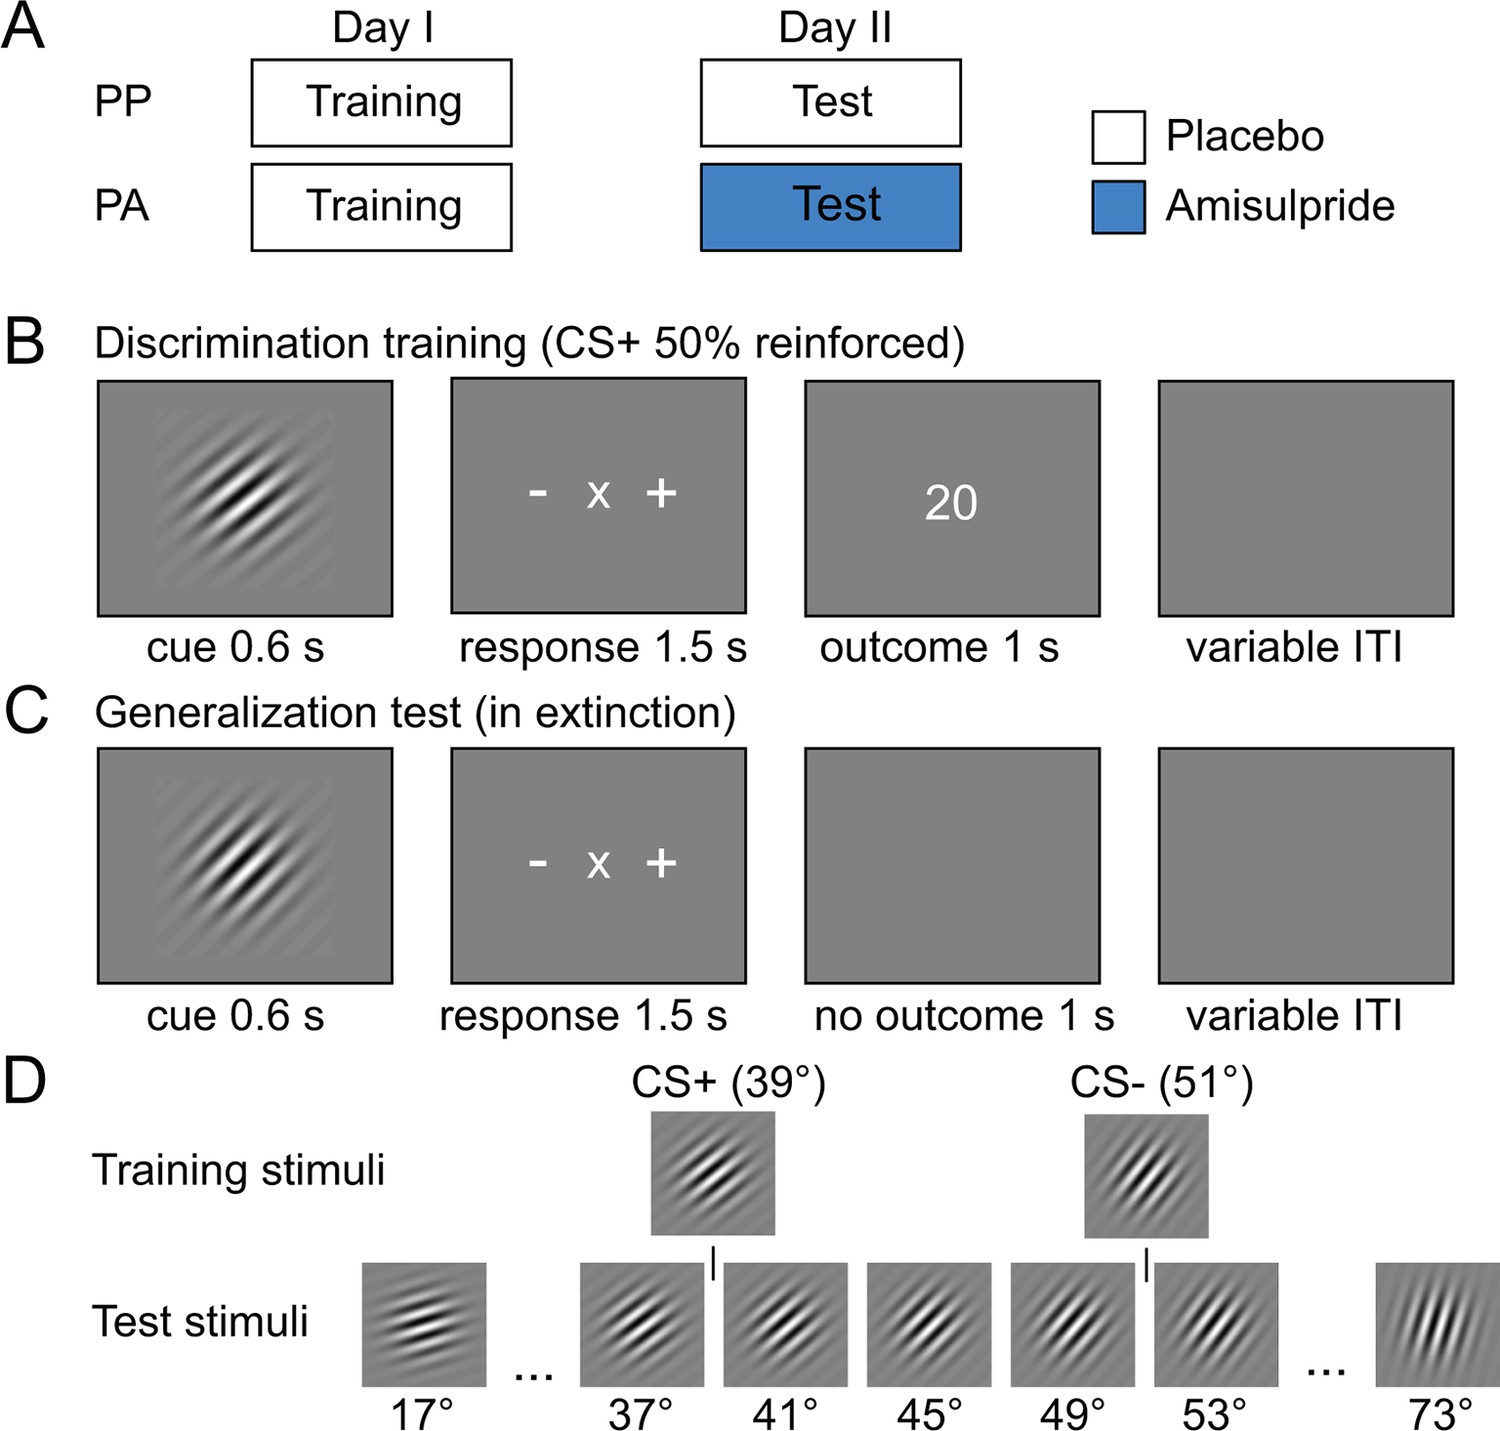
Experimental design and stimuli.
(A) Subjects were pseudo-randomly assigned into a placebo-placebo (PP) or placebo-amisulpride (PA) group. Subjects in the PP group received placebo on both days, whereas subjects in the PA group received placebo before the discrimination training and amisulpride before the generalization test. (B) Discrimination training on day I. During each trial, one orientation (CS+ or CS–) was shown for 600 ms. Subjects had to indicate whether the current orientation may be rewarded (+) or not rewarded (–) using a button press. Outcomes were delivered independently of subjects’ response. After the response, the outcome was presented (20 or 0 cents). (C) Generalization test on day II. On each trial, subjects were presented with one of 15 different test orientations and indicated whether the current orientation was the one previously associated with reward (+), no reward (–) or neither (×). The mapping between buttons and +/–/× was randomized on each trial and the generalization test was performed in extinction. (D) Stimuli used during the training and test session. Associations between stimuli and outcomes were counterbalanced across subjects.
Figure 2 with 1 supplement
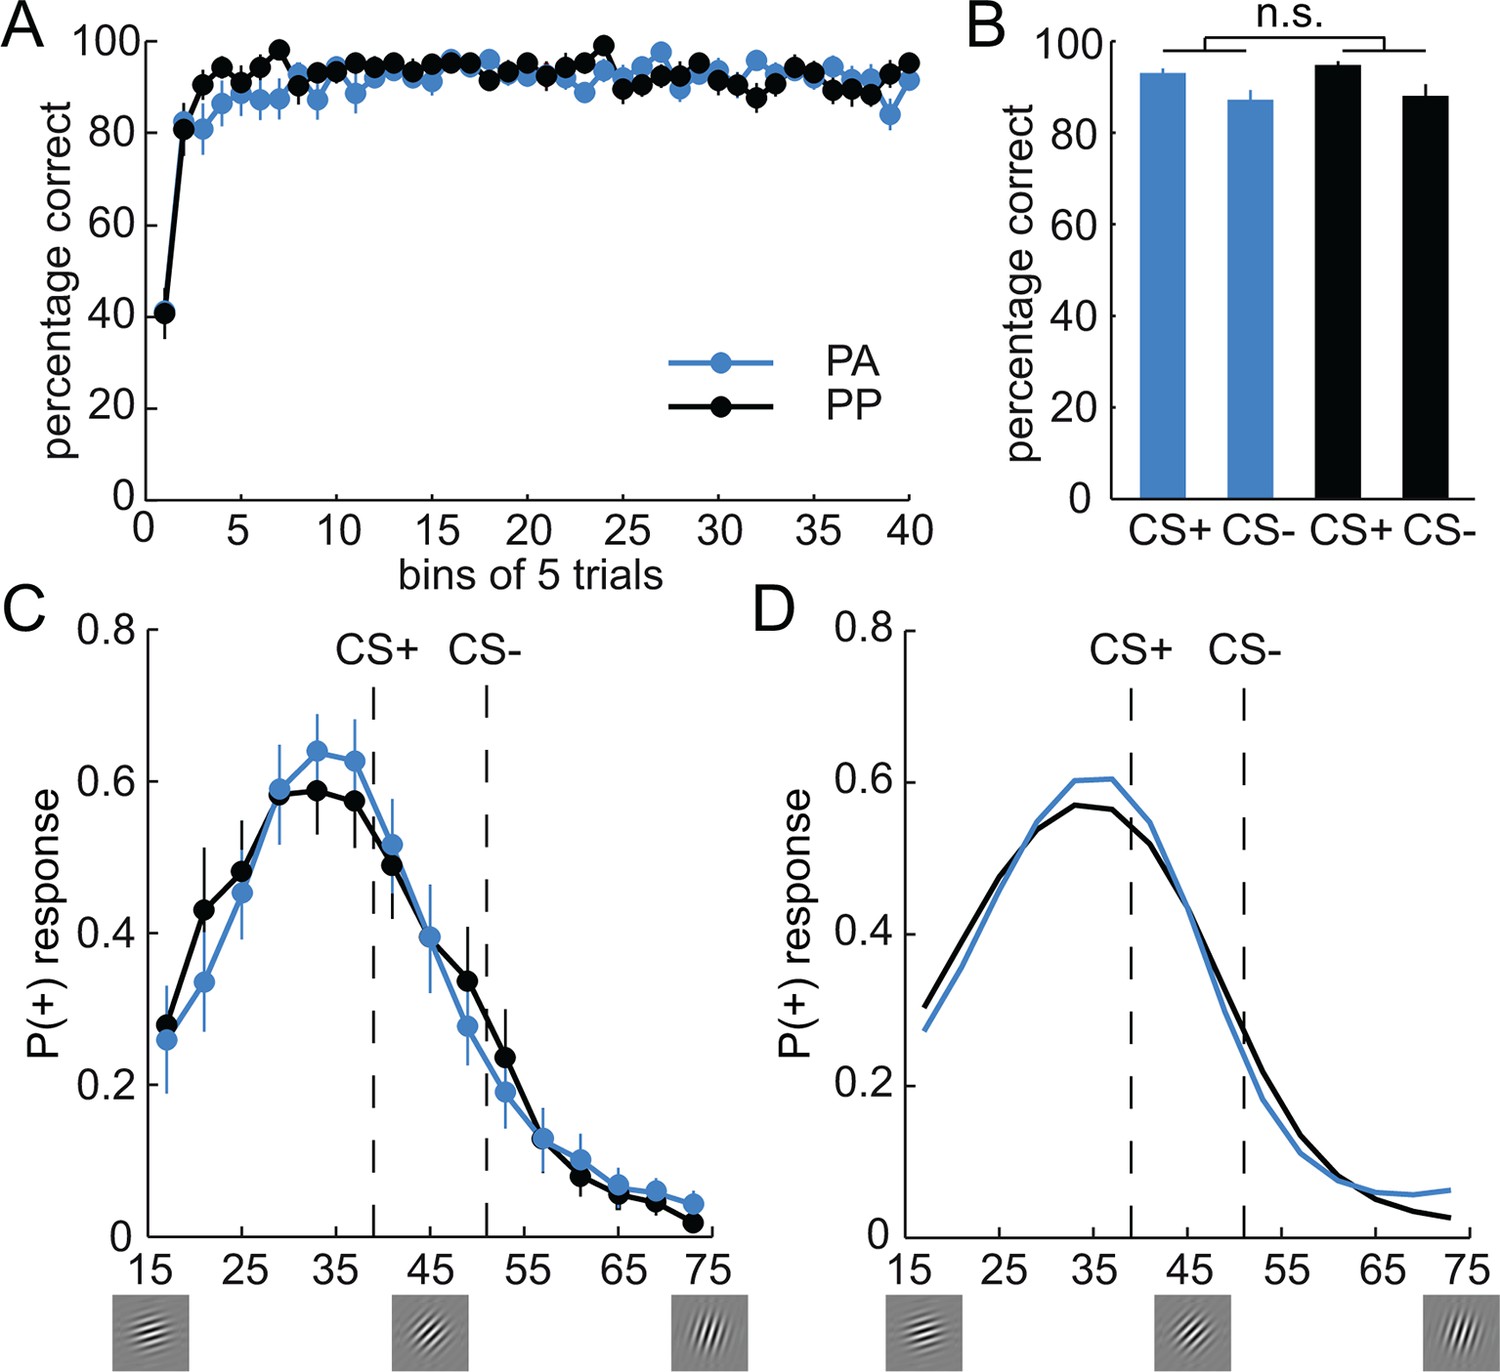
Behavioral responses during discrimination training and generalization test.
(A) Percentage of correct responses during discrimination training across time (bins of 5 trials). Subjects learned the stimulus-outcome associations within the first 50 trials, and maintained performance at a high level afterwards. Given that both groups received placebo during the training session, performance was not expected to, and indeed did not, differ. (B) Percentage of correct responses for CS+ and CS− is plotted for both groups separately. (C) Generalization gradients reflect the probability of a + response as a function of stimulus orientation during the test session. Responses reveal a peak-shift (stronger responding on the side of the CS+ that is opposite to the CS−). Subjects in the amisulpride group (PA, blue), showed a narrower generalization gradient with a higher peak compared to subjects receiving placebo (PP, black). (D) Generalization gradients of a similarity-based generalization model with parameters estimated from subjects’ behavioral responses in both groups, separately. The model accurately reproduces the empirical generalization gradients and the differences between the groups. Error bars are SEM for N=25 (PA) and N=21 (PP).
Figure 2—figure supplement 1
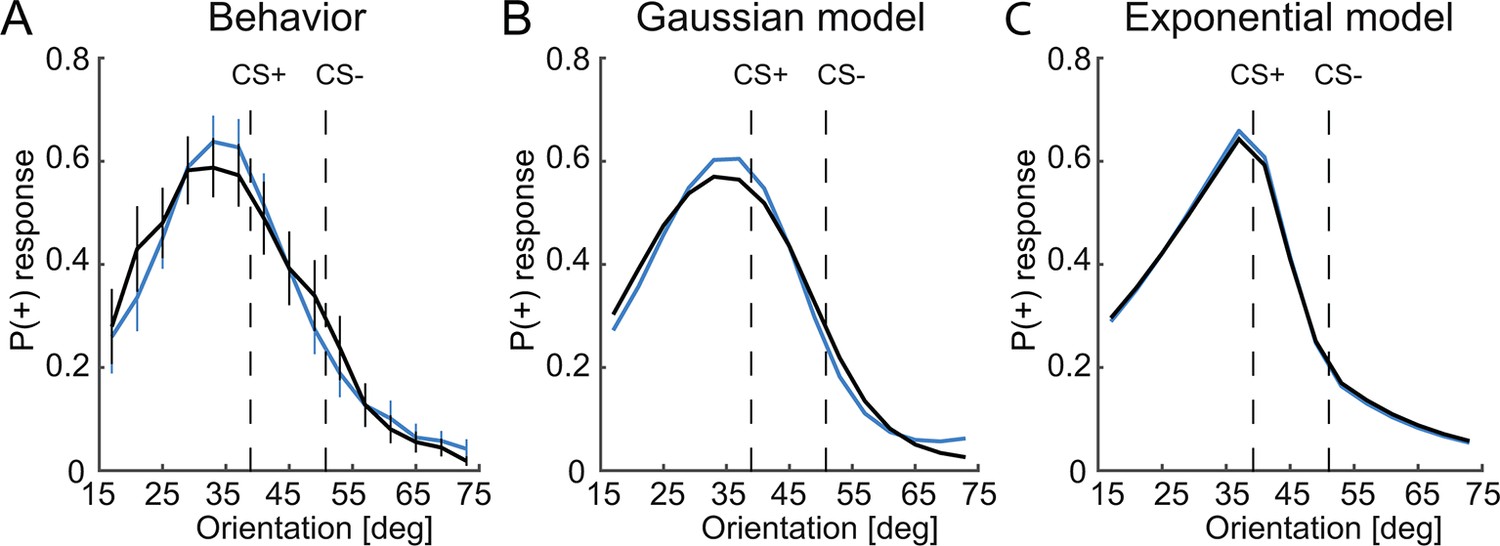
Comparison of Gaussian and exponential similarity functions.
(A) Behavioral responses, (B) P(+) responses derived from models with a Gaussian and (C) exponential similarity functions.
The model with the Gaussian similarity function better captures the behavior and the effect of the dopaminergic manipulation than the model with the exponential similarity function.
Figure 3

Prediction error responses in the ventral striatum during discrimination training.
(A) Regions in the ventral striatum (VS, left, x = -15, y = 8, z = -16, t = 6.97, P < 0.001, FWE whole brain corrected; right, x = 6, y = 14, z = -10, t = 6.22, P = 0.003, FWE whole brain corrected) in which activity is correlated with model-derived prediction errors (PE) during the training session across both groups. T-map from one-sample t-test (across the two groups) is thresholded at P < 0.05, FWE whole brain corrected and overlaid on a T1-weigthed image averaged across subjects. (B) Bar plots depict parameter estimates for PE-related activity in the VS. Given that both groups received placebo during the training session, neural PE-responses were not expected to differ, and indeed did not differ between groups (two-sample t-test, t = 0.58, P = 0.56). Error bars are SEM for N = 25 (PA) and N = 21 (PP).
Figure 4
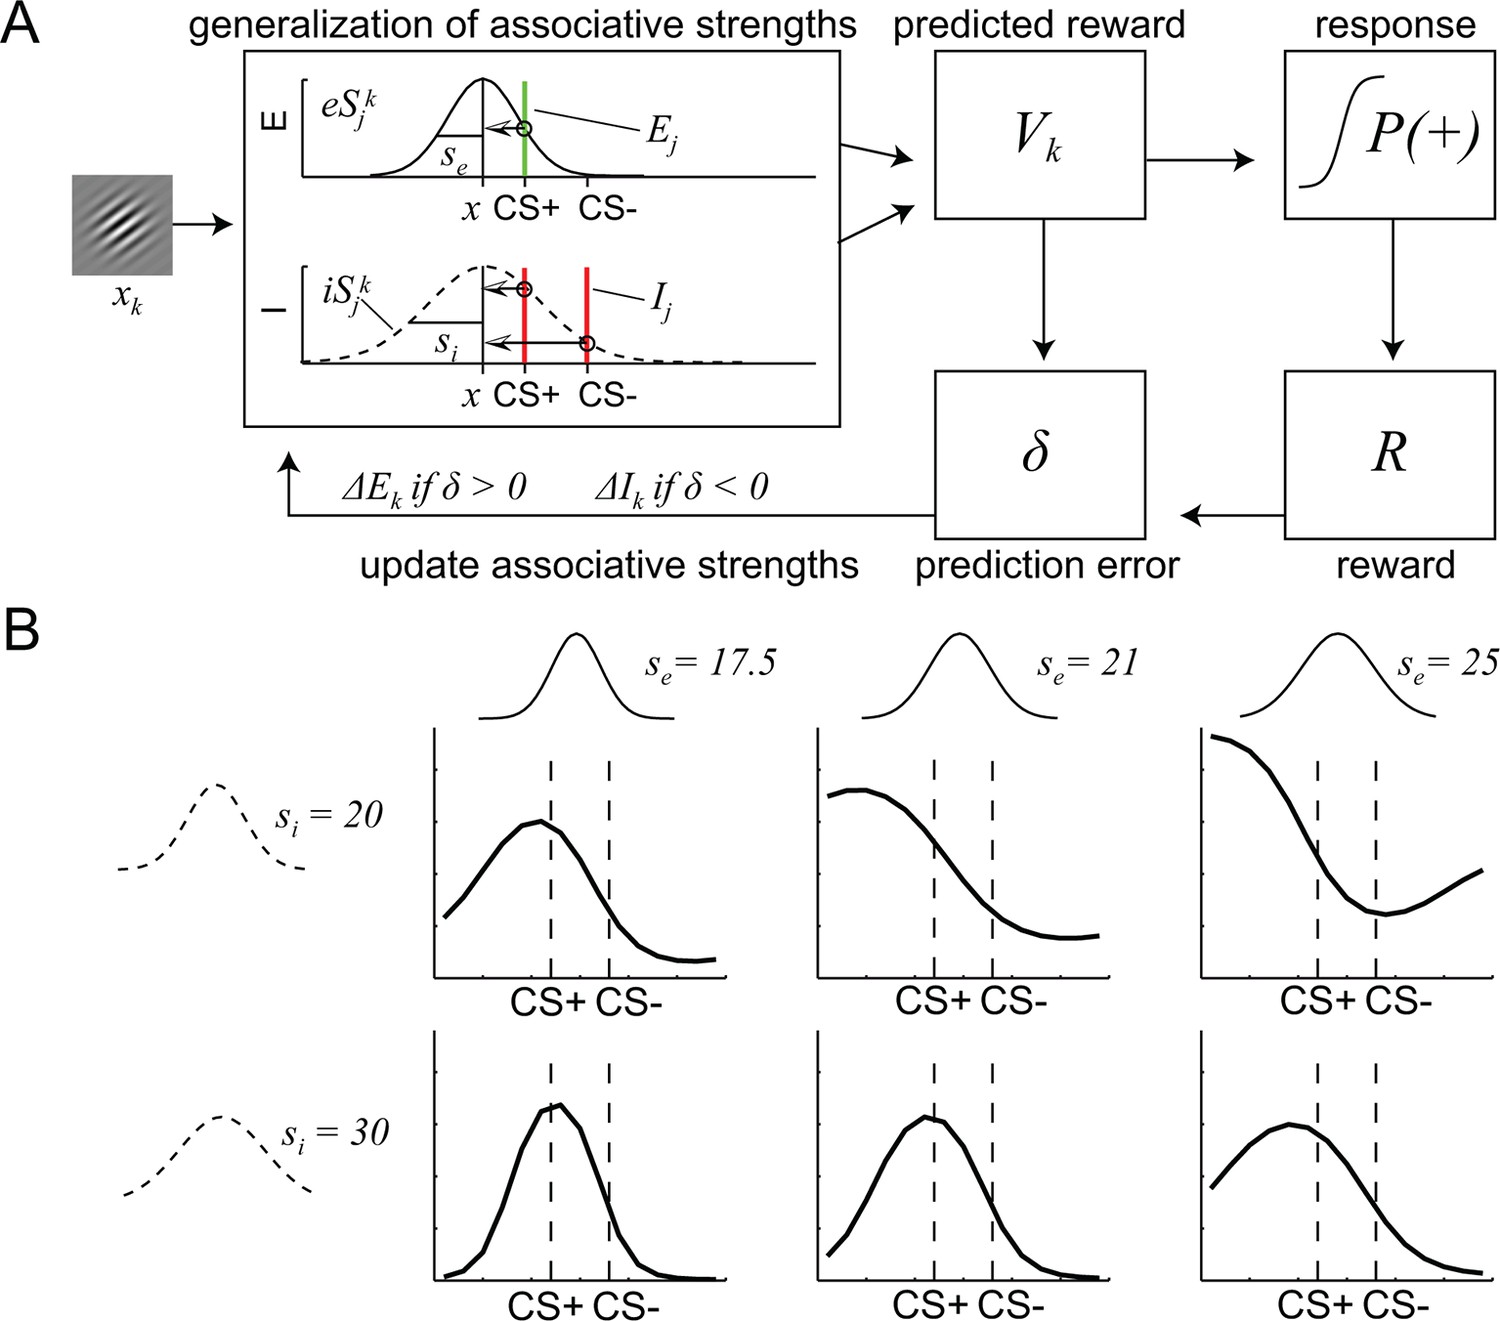
A computational model of similarity-based generalization.
(A) Schematic of the model. When a stimulus orientation xk is presented, the predicted reward for this orientation Vk is computed by integrating the excitatory and inhibitory associations E and I of all stimuli j that are similar to k, (including its own associations, j = k), weighted by the similarity between stimuli j and k. The similarity between j and k is determined by the excitatory and inhibitory generalization coefficients eSjk and iSjk, respectively, which are assumed to be Gaussian (or exponential, not shown here). The width of the excitatory and inhibitory generalization coefficients, and thus the degree to which excitatory and inhibitory associations generalize from j to k is determined by the parameters se and si. The reward prediction Vk is used to generate approach behavior P(+) and to compute a reward prediction error δ, which in turn updates the excitatory and inhibitory associations of k. (B) Illustration of the effects of changes in the width of excitatory and inhibitory generalization coefficients on generalization gradients.
Figure 5
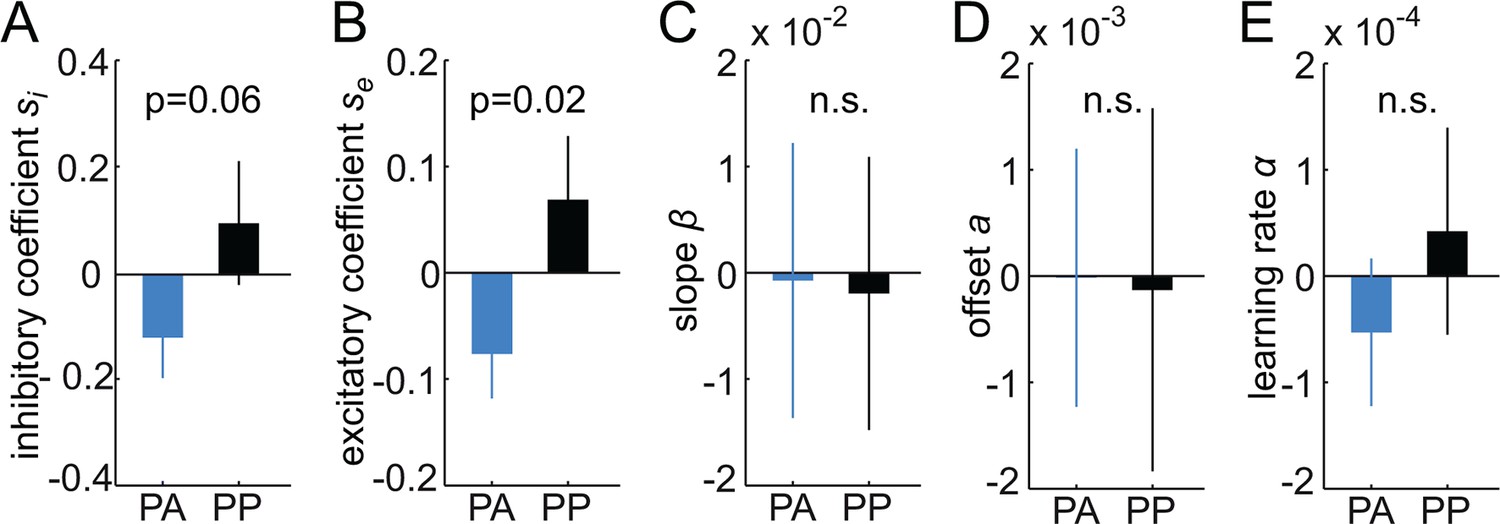
Estimates of individual differences in model parameters.
(A-–E) Each bar plot depicts the average difference between model parameters estimated based on the whole group (N) and a reduced group when one subject is left out (N-1). Values are averaged according to the group of the left out subject (i.e. PA or PP). Positive values indicate that removing subjects from the group decreased the parameter estimates in the N-1 group. Amisulpride reduced parameters controlling the width of generalization (width of inhibitory and excitatory generalization coefficients, A, B) but had no effect on the slope (C) and offset of responding (D), as well as the learning rate (E). P-values are based on two-sample t-tests. Error bars are SEM for N = 25 (PA) and N = 21 (PP).
Figure 6

Amisulpride does not enhance perceptual discrimination performance.
(A) Design and timing of the perceptual orientation discrimination task. Stimulus I was always 135°, whereas stimulus II was tilted by ± 0.2°, ± 0.4°, ± 0.9°, ± 1.9°, or ± 4°. Subjects had to indicate whether stimulus II is tilted counter-clockwise or clockwise relative to stimulus I. (B) Performance differed as a function of the difference in orientation between stimulus I and stimulus II (3-way ANOVA, F(4,172) = 74.46, P < 0.001), but not between groups (F(1,43) = 0.01, P = 0.93) or time (pre vs. post drug, F(1,43) = 2.73, P = 0.11). Importantly, there was no significant group-by-time interaction (F(1,43) = 0.07, P = 0.80). (C) Same data as in B, but collapsed across levels of orientation difference. Again, performance did not differ between groups (two-way ANOVA, F(1,43) = 0.99, P = 0.33), time (F(1,43) = 0.22, P = 0.65), and there was no significant group-by-time interaction (F(1,43) = 0.42, P = 0.52). Error bars are SEM for N = 24 (PA) and N = 21 (PP).
Figure 7
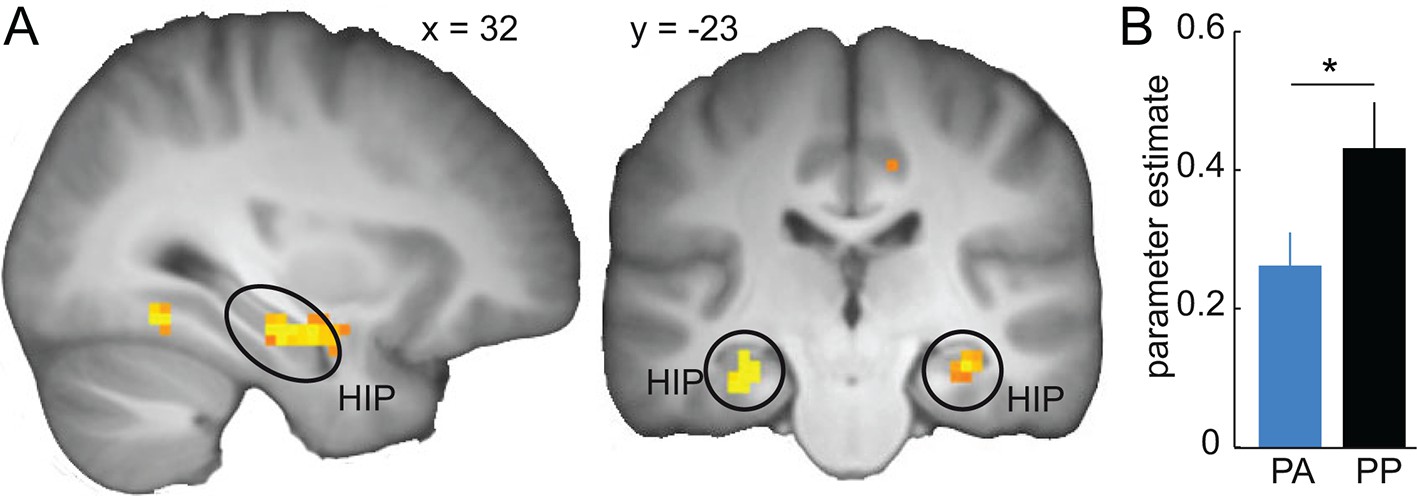
Similarity-based prediction error responses in the hippocampus during generalization.
(A) Across both groups, activity in the hippocampus is significantly correlated with model-derived prediction errors during generalization test. T-map from one-sample t-test is thresholded at P < 0.05, FWE whole brain corrected and overlaid on a T1-weigthed image averaged across subjects. (B) Prediction error-related activity in the hippocampus is significantly reduced by D2R blockade (two-sample t-test, t = -2.12, P = 0.02). Error bars are SEM for N = 25 (PA) and N = 21 (PP).
Figure 8
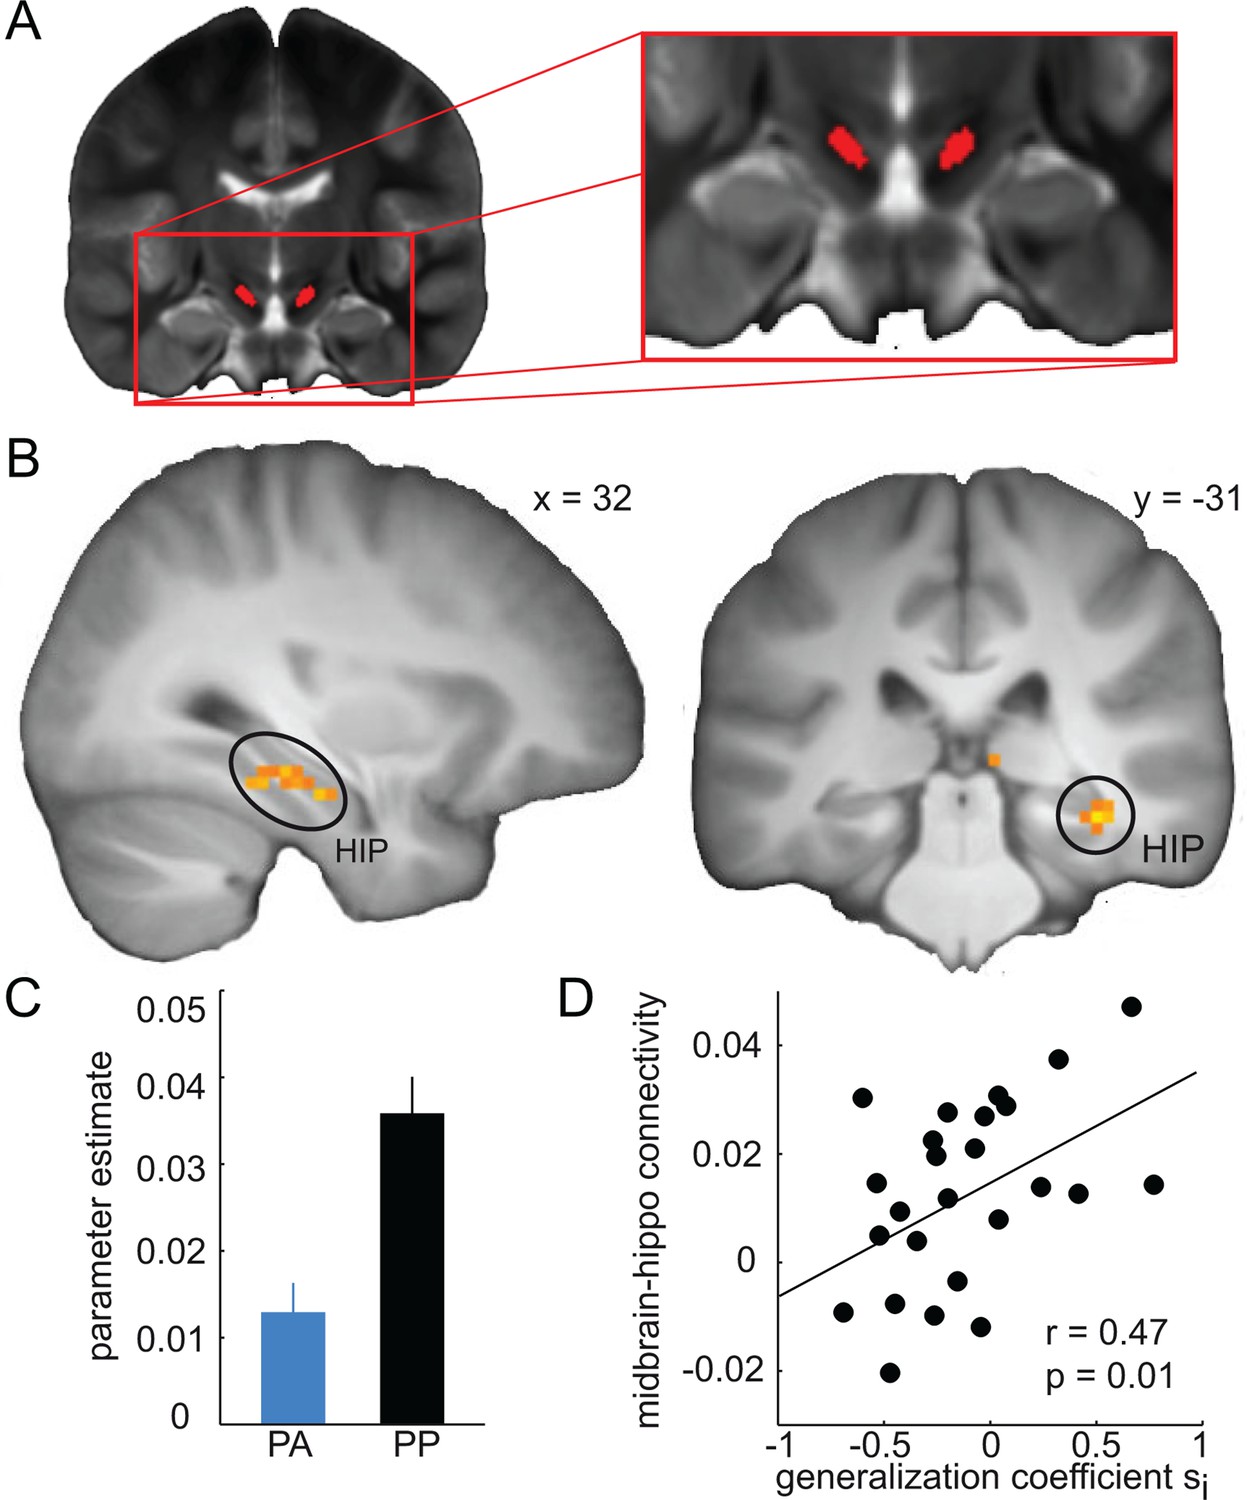
Amisulpride modulates midbrain-hippocampal connectivity.
(A) Anatomical seed region in the midbrain is overlaid on a T2-weigthed image averaged across subjects. (B) Functional connectivity between the midbrain and the hippocampus during generalization test is significantly reduced in the amisulpride group (P < 0.05, FWE small volume corrected). For illustration, t-map from two-sample t-test (PP > PA) is thresholded at P < 0.001, uncorrected and overlaid on a T1-weigthed image averaged across subjects. (C) For illustration, bar plot depicting average midbrain-hippocampus connectivity in both groups. (D) Strength of midbrain-hippocampal connectivity is positively correlated with the width of the model-estimated inhibitory generalization coefficient (r = 0.47, P = 0.01) in the amisulpride group. Error bars are SEM for N = 25 (PA) and N = 21 (PP).
Tables
Table 1
Group-specific model parameters.
| Group | Inhibitory coefficient si | Excitatory coefficient se | Slope β | Offset a | Learning rate αtest |
|---|---|---|---|---|---|
| PA group N=25 | 20.121 | 17.599 | 3.093 | 0.370 | 0.002 |
| PP group N=21 | 30.587 | 24.584 | 3.124 | 0.361 | 0.006 |
| Difference PA-PP | -10.465 | -6.985 | -0.031 | 0.009 | -0.004 |
| *P-value (PA-PP) | 0.069 | 0.035 | 0.495 | 0.462 | 0.214 |
-
Note: *P-value is based on 10.000 permutations.
Download links
A two-part list of links to download the article, or parts of the article, in various formats.
Downloads (link to download the article as PDF)
Open citations (links to open the citations from this article in various online reference manager services)
Cite this article (links to download the citations from this article in formats compatible with various reference manager tools)
Dopamine regulates stimulus generalization in the human hippocampus
eLife 5:e12678.
https://doi.org/10.7554/eLife.12678


