Two FGFRL-Wnt circuits organize the planarian anteroposterior axis
- Whitehead Institute for Biomedical Research, United States
- Massachusetts Institute of Technology, United States
- Howard Hughes Medical Institute, Massachusetts Institute of Technology, United States
Figures
Figure 1 with 2 supplements

Single-muscle-cell RNA sequencing identifies regionally expressed genes on the planarian AP axis.
(A) Single cells from each colored AP region were isolated by FACS and resultant cDNA was screened by qRT-PCR for muscle marker expression. Positive cells were sequenced and analyzed for differential expression. (B) Whole-mount in situ hybridization (ISH) (n=2 experiments) shows expression of a subset of new and previously known (#) muscle regionally expressed genes (mRGs). Images are representative of n>10 animals for new mRGs. Anterior, up. Scale bar, 100 μm. Right, violin plots show the expression distribution in muscle cells (black dots) within the 10 dissected regions. cpm, counts per million. (C) Double fluorescence ISH (FISH) show co-localization of several newly identified mRGs (magenta) and the muscle marker collagen (green). DAPI was used to label nuclei DNA (gray). Yellow arrows point to cells co-expressing both genes. Scale bar, 10 μm. (D) Heat map shows hierarchical clustering of the average expression per region of the 44 identified mRGs. Top color bar indicates dissected region. (*) marks genes that are named by best human BLASTx hits. (E) Pie chart shows the percentage, within the 44 genes shown in D, of Wnt-signaling genes, FGFRL, and Hox homologs.
Figure 1—figure supplement 1
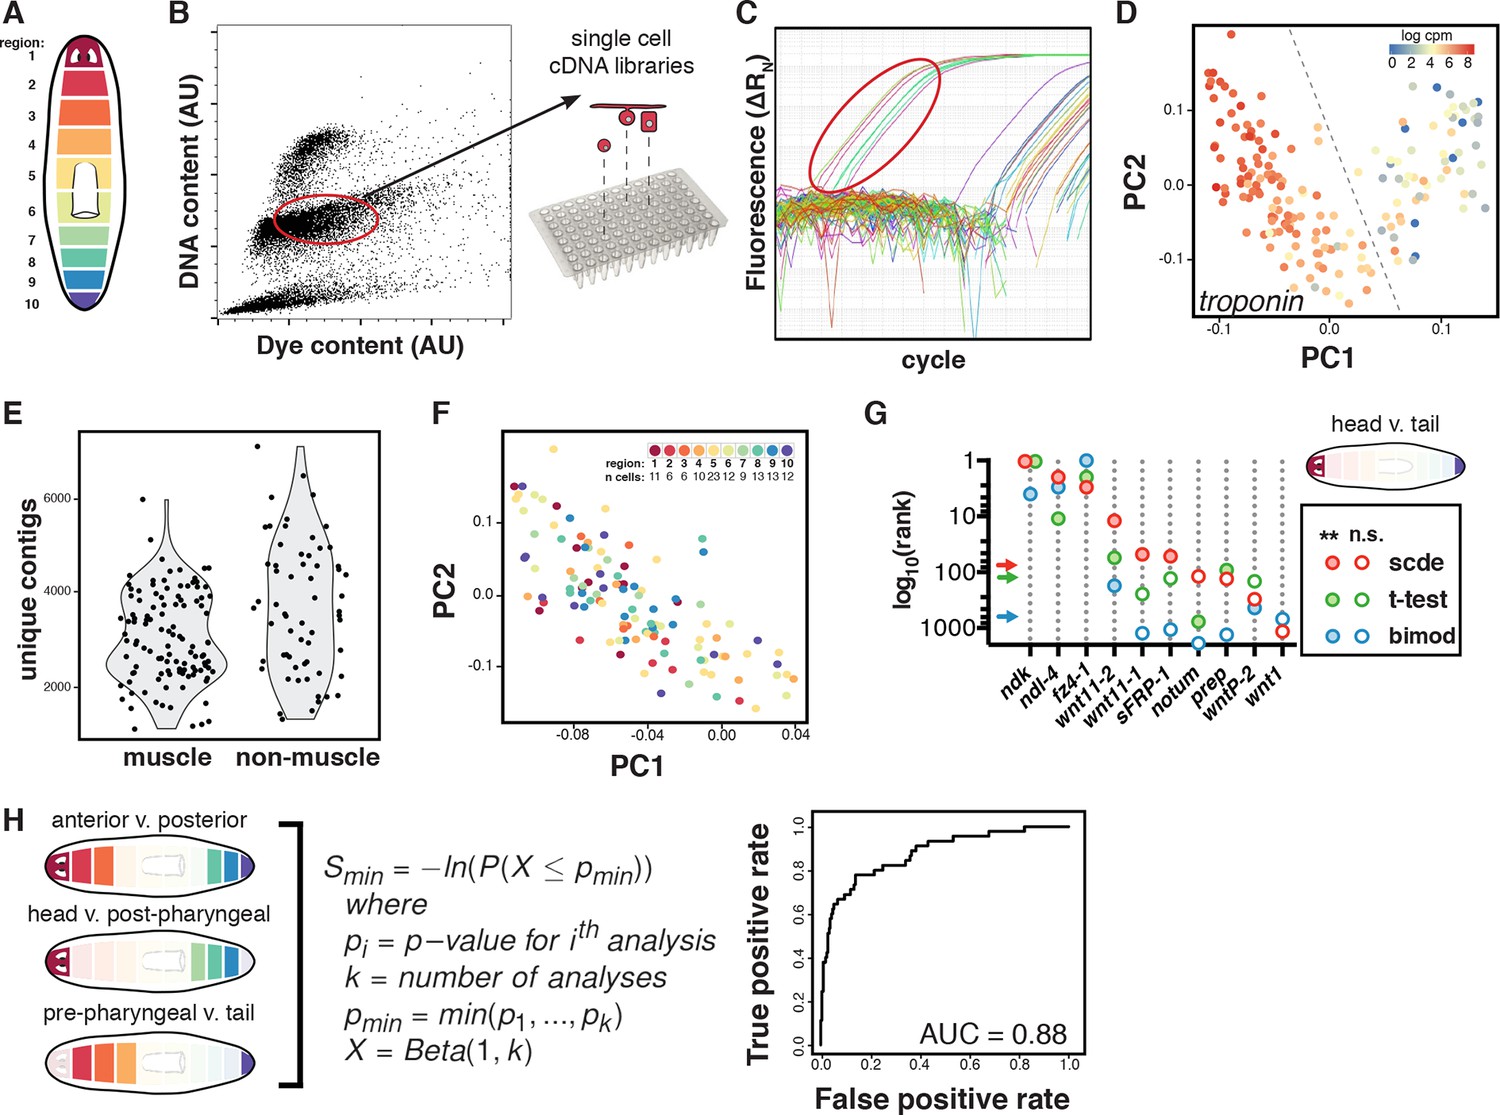
Single-muscle-cell sequencing and analysis.
(A) Schematic of the 10 regions dissected and macerated to isolate single cells. (B) Representative FACS plot of Hoechst-stained cells from a single region indicating the gate used to isolate non-dividing cells. (C) Representative qRT-PCR plot for the muscle marker troponin used to screen single-cell cDNA libraries. The libraries from cells circled in red were sequenced. (D) Principal component (PC) analysis and troponin expression identified 115 muscle cells. Cells separated along two significant principal components: PC1 (29.9% of variance explained, p=1.4E-120) separated muscle from epidermal lineage and PC2 (8.3% of variance explained, p=4.4E-44) separated neoblasts from differentiated cells (Supplementary file 1B). Cells to the left of the dashed line that expressed troponin were retained for further analysis as muscle cells. (E) Distribution of contigs with two or more reads in the 177 single-cell libraries used for PC analysis. Nearly all cells with a high number of expressed contigs that could signal a doublet event from FACS were categorized as non-muscle cells and excluded from differential expression analysis. (F) Muscle cells from all regions were evenly distributed throughout PC-space indicating that AP region of origin did not explain a significant proportion of the variance. Inset includes number of muscle cells analyzed per region. (G) Different differential expression analysis methods were tested for the ability to identify known mRGs. The rank order by p-value is shown on the y-axis in log10 scale for several canonical mRGs. Arrows mark the rank separating significant (filled circle) and not significant (n.s., unfilled circle) genes at p<0.01 for each method. (H) Three differential expression analyses (left) using SCDE were performed between the indicated regions. Ranking of genes by a differential expression score was used to generate a receiver-operator curve (right) to evaluate whether the SCDE analysis correctly classified genes as mRGs compared to ISH validation (Materials and methods).
Figure 1—figure supplement 2
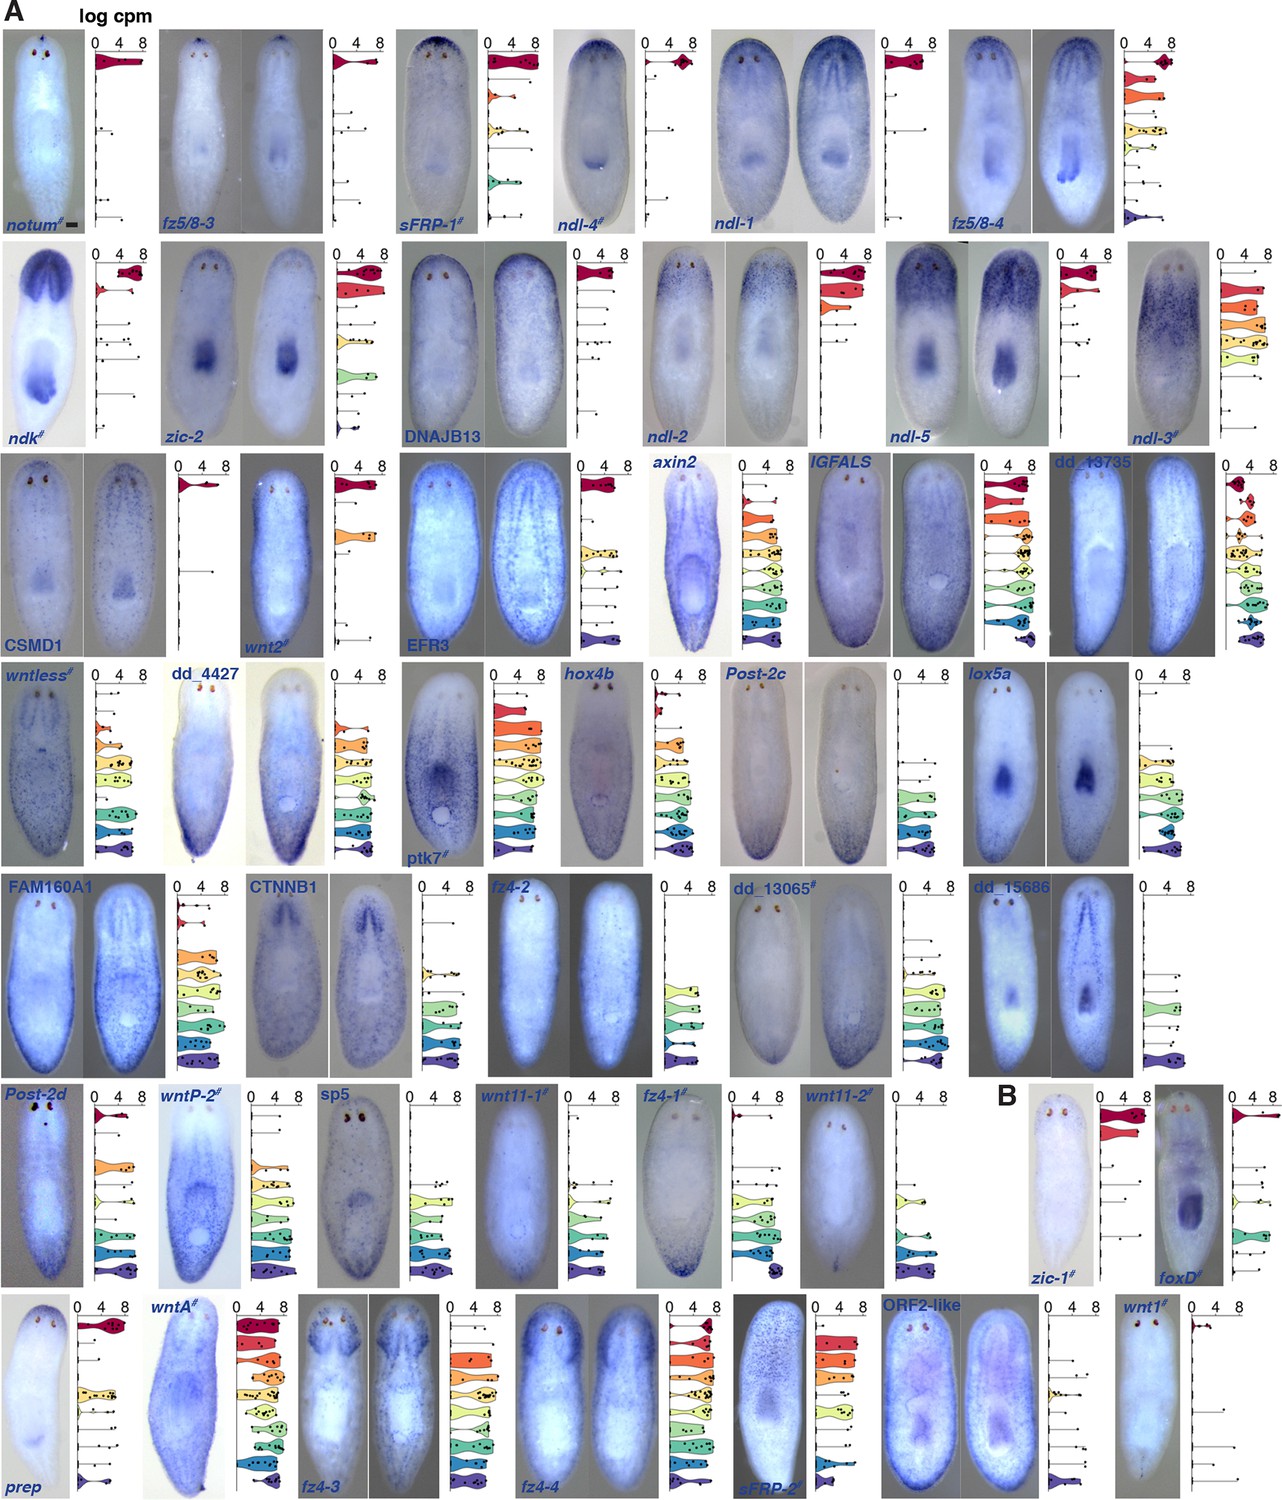
44 mRGs are distributed along the AP axis.
Colorimetric ISH of mRGs (blue) identified in SCDE analyses. Violin plots show the distribution of cells that express that gene in each of the 10 dissected regions; cpm, counts per million. #, previously known mRGs. (A) Genes with p<0.005 in any analysis; (B) Genes with p>0.005. Anterior, up. Scale bar, 100 μm. Each image is representative of n>5 animals. At least 2 independent ISH experiments were performed for each new mRG.
Figure 2 with 4 supplements

Co-expression of mRGs along the AP axis.
(A) FISH using mRGs maps discrete domains of mRG expression onto the planarian AP axis. Bars on left indicate the approximate extent of the expression domain for each of the genes analyzed. Images are representative of n≥5 animals. Anterior, up. Scale bar, 100 μm. (B) Heatmap shows co-expression of anterior FGFRL and Wnt pathway mRGs in the four anterior regions indicated in the cartoon (1–4). Each column shows expression within a single cell with color bars above indicating the dissected region of origin for the cell. cpm, counts per million (C) FISH using different FGFRL/ndl probes and Wnt pathway mRGs show co-expression in the four regions depicted in the cartoon. Black boxes (1–4) in the cartoon in B show the region imaged for the FISH, as denoted by the number and colored rectangle next to the merged image. Scale bar, 10 μm. Images are representative of n≥5 animals.
Figure 2—figure supplement 1
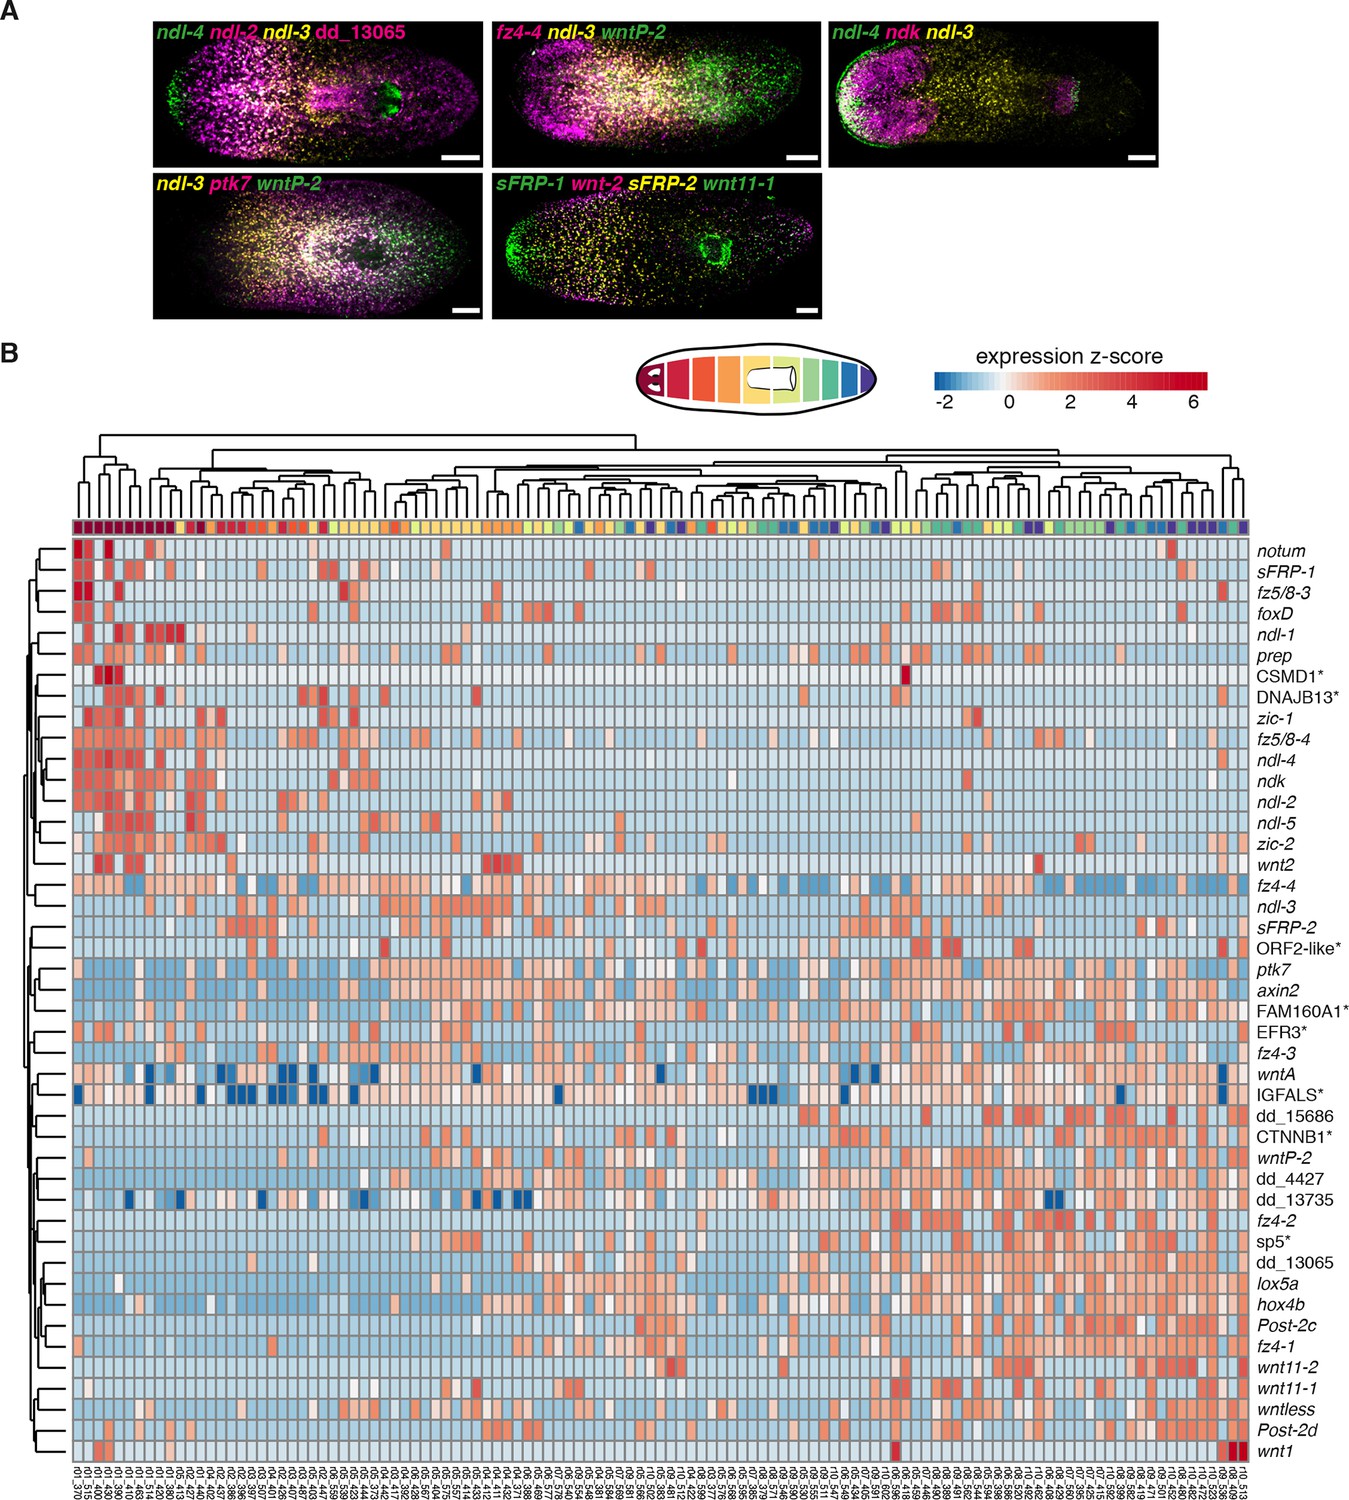
Axial mRG map and co-expression of multiple FGFRL genes and mRGs in the same muscle cell.
(A) FISH using a combination of known and new mRG RNA probes show distributions of gradients along the AP axis. Anterior, left. Scale bar, 100 μm. Each image is representative of n>5 animals. (B) Heatmap shows hierarchical clustering of the identified 44 mRGs in each of the 115 muscle cells analyzed. Cartoon on top depicts the 10 regions dissected. Top color bar indicates region of origin for that cell. Expression values for each gene are scaled across each row as z-scores. (*) marks transcripts that are named by best human BLASTx hits.
Figure 2—figure supplement 2
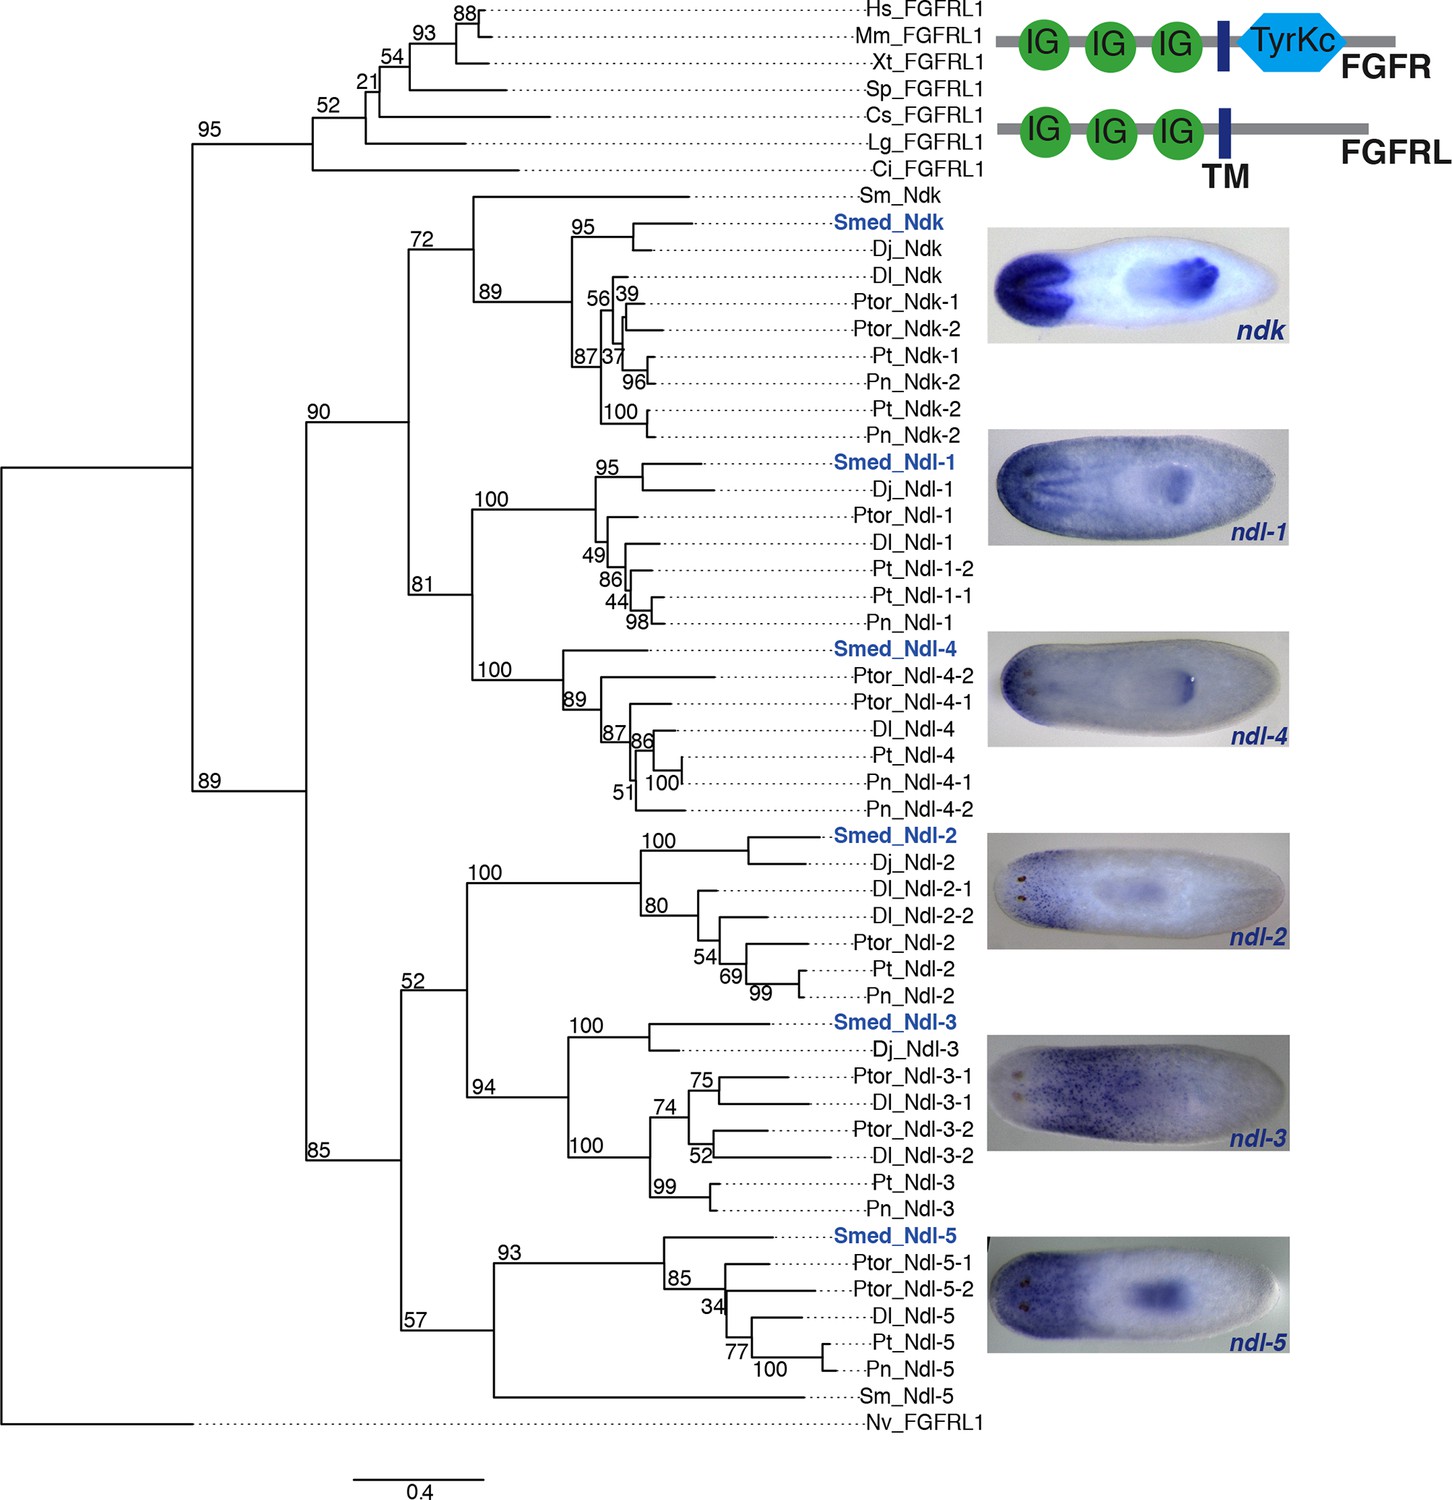
Phylogenetic analysis of SMED-FGFRL proteins.
Top right: Domain diagram of FGFR and FGFRL proteins. IG, immunoglobulin domain; TM, transmembrane domain; TyrKc, Tyrosine kinase. Tree showing 54 FGFRL proteins from diverse organisms, which were aligned using MUSCLE with default settings and trimmed with Gblocks. Maximum likelihood analyses were run using PhyML with 100 bootstrap replicates, the WAG model of amino acid substitution, 4 substitution rate categories and the proportion of invariable sites estimated from the dataset. All ML bootstrap values are shown above or below respective branch. Hs, Homo sapiens; Mm, Mus musculus; Xt, Xenopus tropicalis; Sp, Strongylocentrotus purpuratus; Cs, Capitella sp. I; Lg, Lottia gigantean; Ci, Ciona intestinalis; Sm, Schistosoma mansoni; Smed, Schmidtea mediterranea; Dj, Dugesia japonica; Dl, Dendrocoelum lacteum; Ptor, Planaria torva; Pt, Polycelis tenuis; Pn, Polycelis nigra; Nv, Nematostella vectensis. Right, ISH of the 6 Schmidtea mediterranea FGFRL genes shown in tree. Images are representative of n>10 animals. Anterior, left.
Figure 2—figure supplement 3
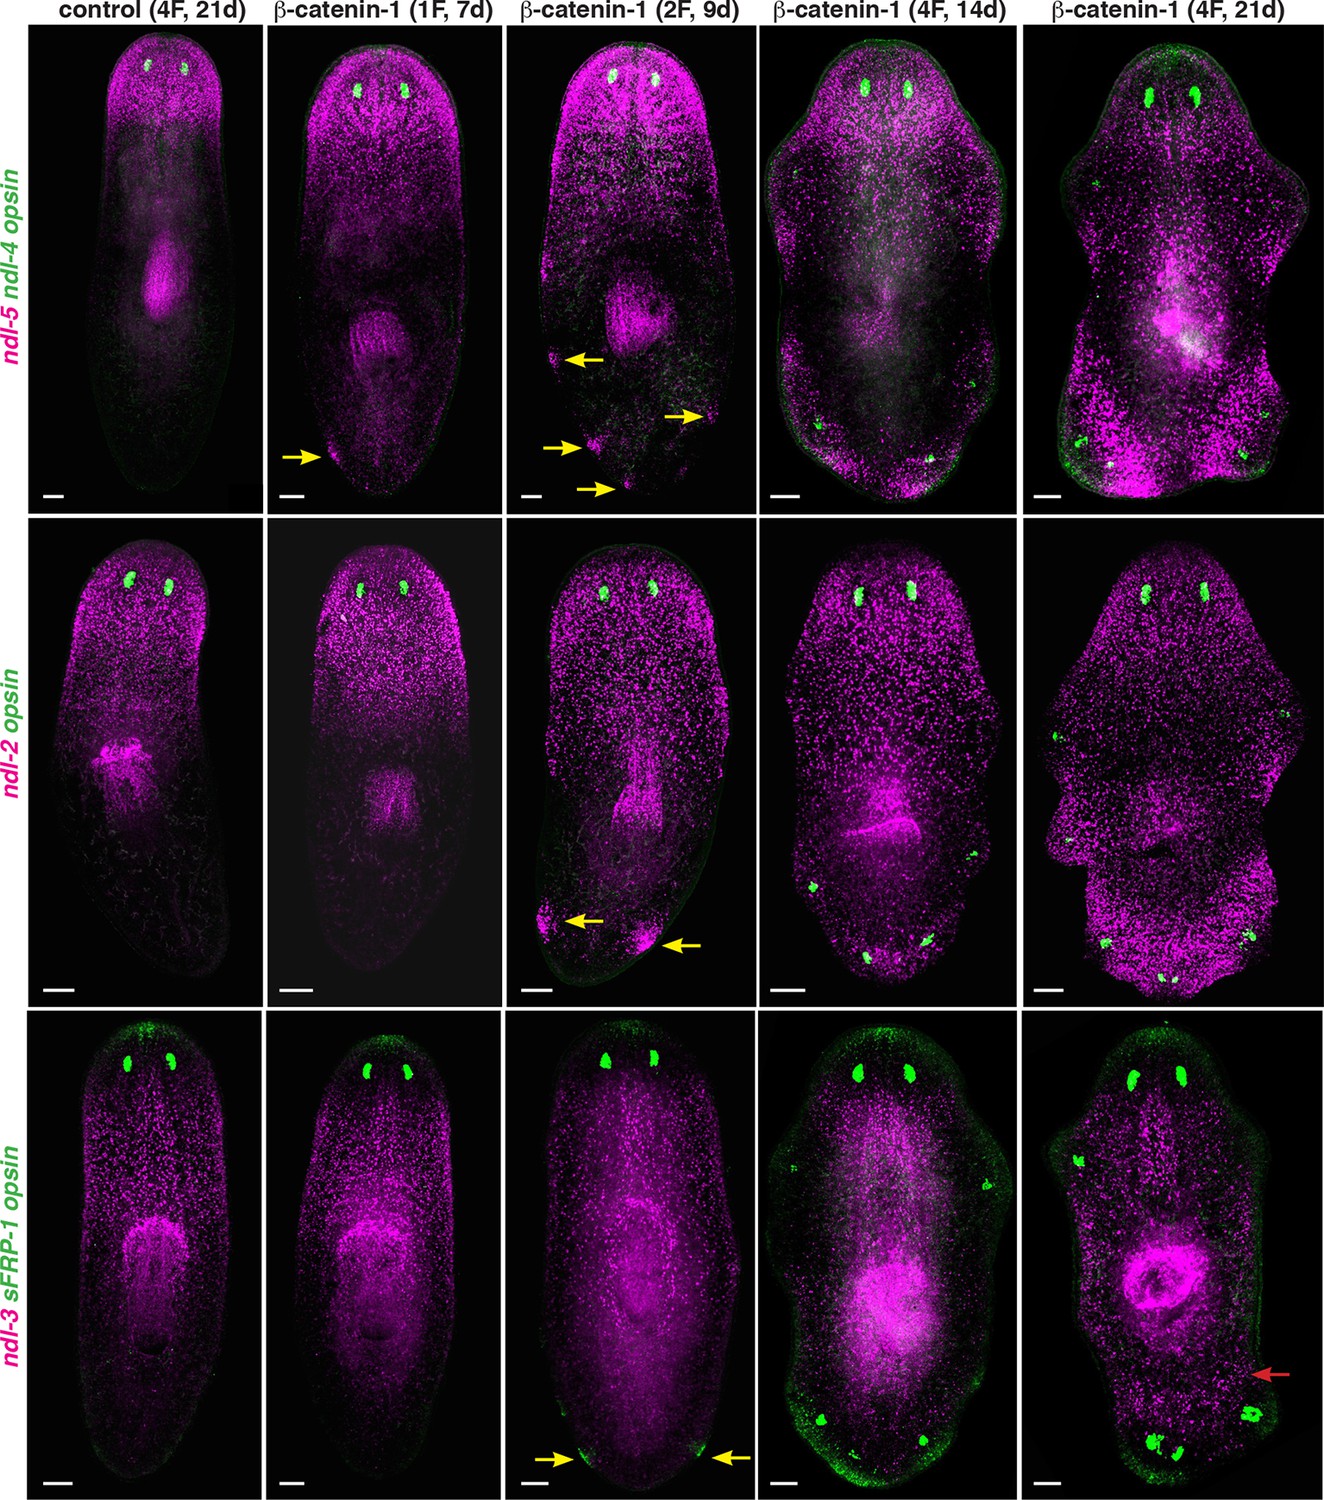
Pattern of FGFRL/ndl family expression in β-catenin-1 RNAi animals.
FISH shows expression of ndl-5, ndl-2, ndl-3, and sFRP-1 in control and β-catenin-1 RNAi animals after one, two, or four RNAi feedings (1F, 2F, 4F). Animals were fixed at different timepoints after initiation of RNAi, shown in brackets at the top. Yellow arrows show ectopic expression of anterior mRGs in posterior regions of the animal before ectopic eyes are visible. Red arrow indicates ectopic expression of the prepharyngeal mRG ndl-3. opsin (green) marks eyes. Anterior, up. Scale bar, 100 μm.
Figure 2—figure supplement 4
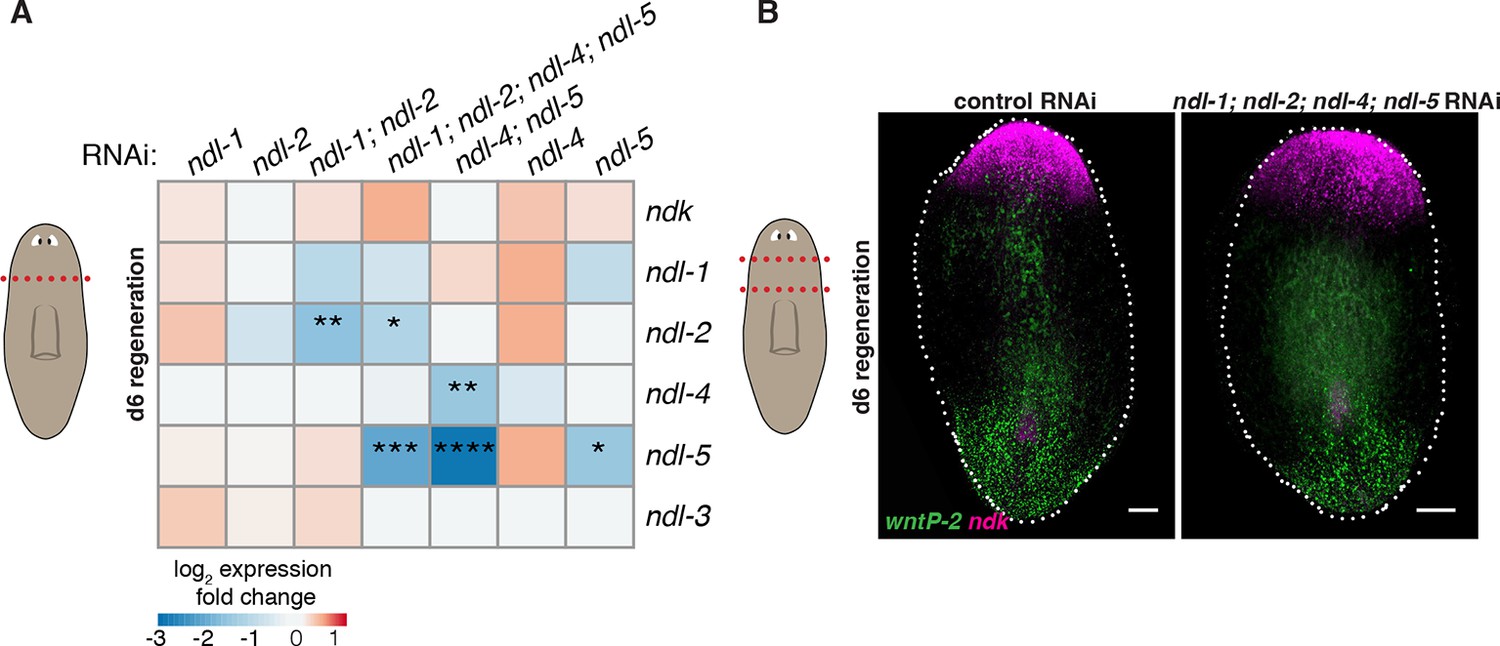
Inhibition of FGFRL genes does not significantly change expression of other members of the FGFRL family.
(A) Heatmap shows efficiency of RNAi inhibition in each condition, and no significant effects in the expression level of other genes. Color scale represents mean log2 fold change in expression of each gene (rows) in the RNAi conditions (columns) compared to control RNAi in 6 dpa head fragments (cartoon on left, screen RNAi feeding protocol was used, see Methods). At least three head fragments were analyzed by qRT-PCR in each condition. One-way ANOVA, * p<0.05, ** p<0.01, *** p<0.001, **** p<0.0001. (B) FISH shows normal expression of ndk and wntP-2 in ndl-1; ndl-2; ndl-4; ndl-5 RNAi animals in prepharyngeal fragments 6 dpa (cartoon on left, same RNAi feeding protocol as A). Anterior, up. Scale bar, 100 μm.
Figure 3 with 1 supplement
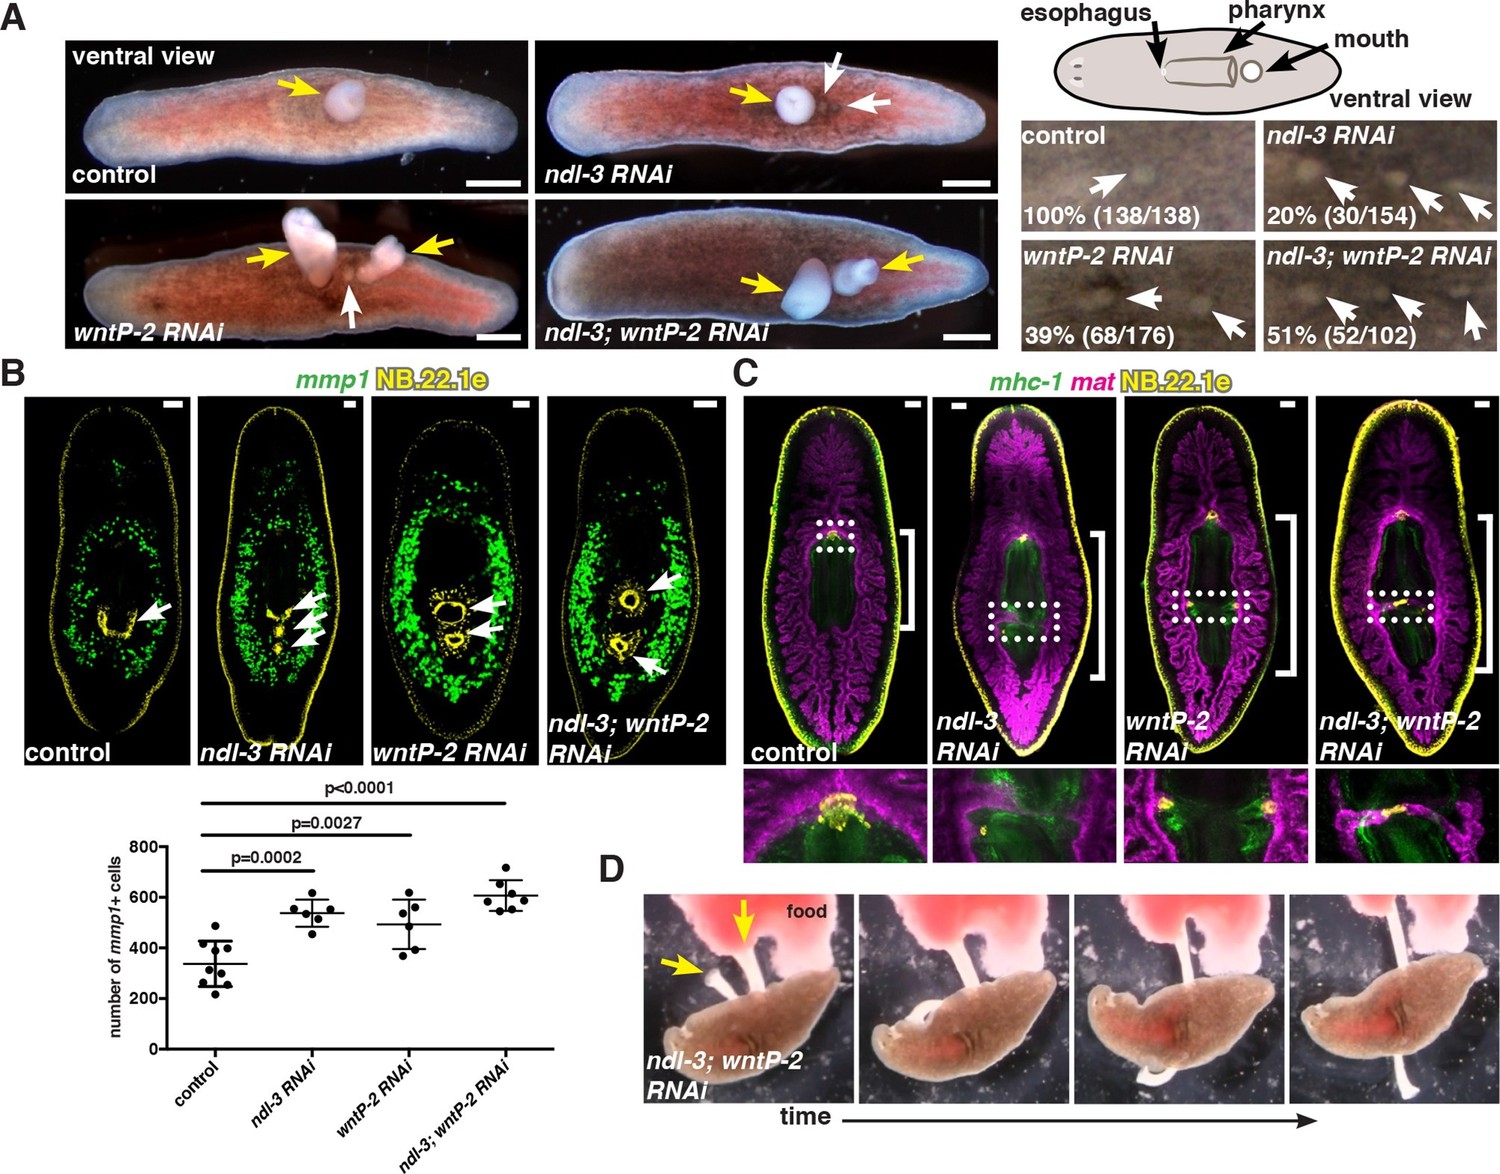
ndl-3 and wntP-2 restrict trunk positional identity.
(A) Live, ventral images of ectopic pharynges and mouths in 20–30 day post-amputation (dpa) RNAi animals. Right top, cartoon depicts esophagus, pharynx, and mouth. Left, pharynges (yellow arrows) and ectopic mouths without a protruding pharynx (white arrows). Scale bar, 500 μm. Right bottom, mouths (white arrows) in 7 dpa RNAi animals. Anterior, left. Total number of animals were pooled from at least 2 independent RNAi experiments. (B) Increased numbers of para-pharyngeal mmp1+ cells in RNAi animals. NB.22.1e labels mouths. Graph below shows mean ± SD (n>8 animals/condition, 2 pooled experiments, One-way ANOVA). (C) Esophagus-gut connection in 20 dpa trunk fragments, region in dotted rectangle is shown at higher magnification below. FISH: mat (gut), mhc-1 (pharynx), and NB.22.1e (esophagus). Bracket, pharyngeal cavity length. (D) Time-lapse images of an ndl-3; wntP-2 RNAi animal eating liver through both pharynges (yellow arrows), see Video 1.
Figure 3—figure supplement 1
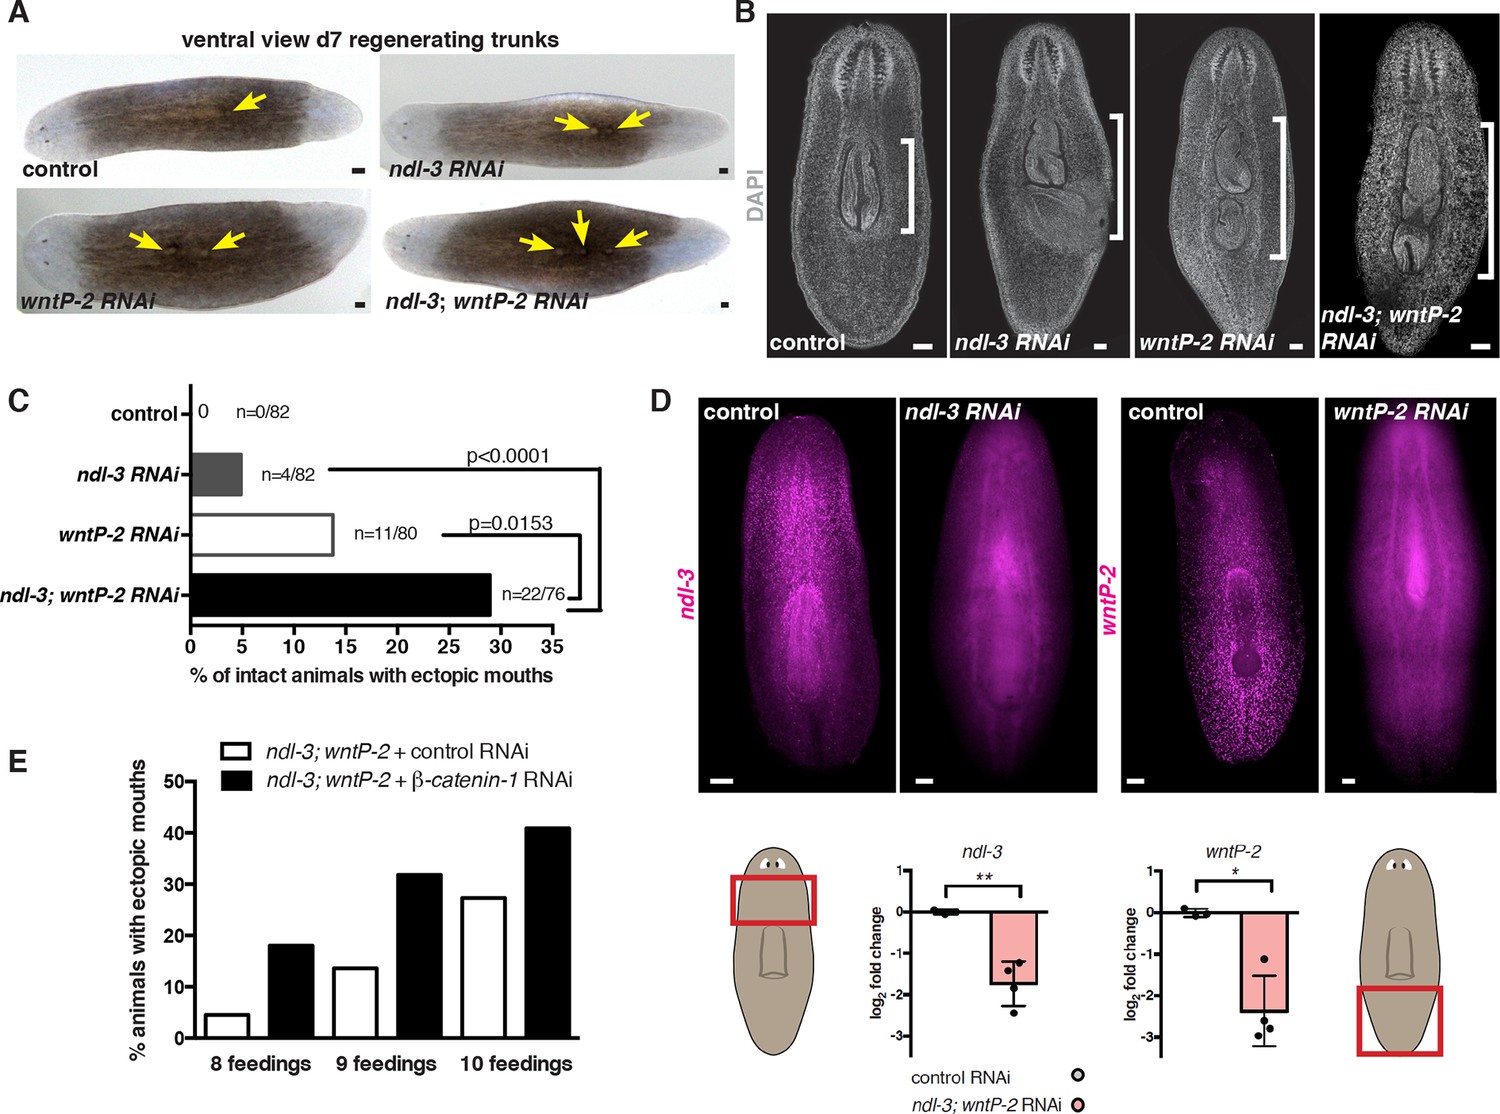
ndl-3 and wntP-2 restrict the number of mouths and pharynges in the trunk region.
(A) Ectopic posterior mouths are observed in regenerating trunk pieces of ndl-3, wntP-2, and ndl-3; wntP-2 RNAi animals 7 dpa. Number of animals showing ectopic mouths are described in Figure 3A. Yellow arrows point to mouths. Anterior, left; ventral, up. Scale bar, 100 μm. (B) DAPI stainings of RNAi animals show pharynges in the different RNAi conditions. Bracket indicates pharyngeal cavity length. Anterior, up; Scale bar, 100 μm. Images are representative of n>10 animals per condition. (C) Graph shows the percentage of intact RNAi animals with a total of two or more mouths after 8 RNAi feedings. p-values, Fisher’s exact test. 3 independent RNAi experiments are pooled in this analysis. Number of animals with ectopic mouths out of total animals (n) are indicated. (D) FISH using RNA probes for ndl-3 and wntP-2 show a decrease in the expression of those genes following their RNAi demonstrating the efficiency of the inhibition (total of 8 RNAi feedings). Graphs below (mean ± SD) show quantification of the mRNA levels by qRT-PCR. Student's t-test, * p<0.05, ** p<0.01. Cartoons show the region from where the mRNA was extracted. (E) Graph shows the percentage of intact RNAi animals with a total of two or more mouths after different number of RNAi feedings. The first five RNAi feedings were performed with only ndl-3; wntP-2 dsRNA. β-catenin-1 or control dsRNA was added in addition to ndl-3; wntP-2 starting on feeding six.
Figure 4 with 1 supplement

Trunk mRG gradients are shifted in ndl-3 and wntP-2 RNAi animals with ectopic pharynges/mouths.
mRG expression analyses by FISH: (A) expanded expression of trunk mRG ndl-3, (B) reduction of the lateral expression of the posterior mRG wntP-2. Left panel, ventral view. Right panel, dorsal view. Red arrows point to the mRG expression domain boundary shifted. White arrows point to mouths. Yellow arrows indicate esophagus. Anterior, up. Scale bar, 100 μm. All FISH images are representative of n>8 animals per condition, and at least 2 independent RNAi experiments have been performed. (C–E) Graphs show quantification of the shifts in expression domains for the mRGs shown in the FISH experiments (mean ± SD, at least 3 independent experiments were pooled. One-way ANOVA for sFRP-1, unpaired Student's t-tests for ndl-3 and wntP-2). Cartoons on the left depict the expression domain in the wild-type animal and the distance that was measured in each case. Length of expression domain measured was normalized by total length of the animal. All measurements were scored blind.
Figure 4—figure supplement 1
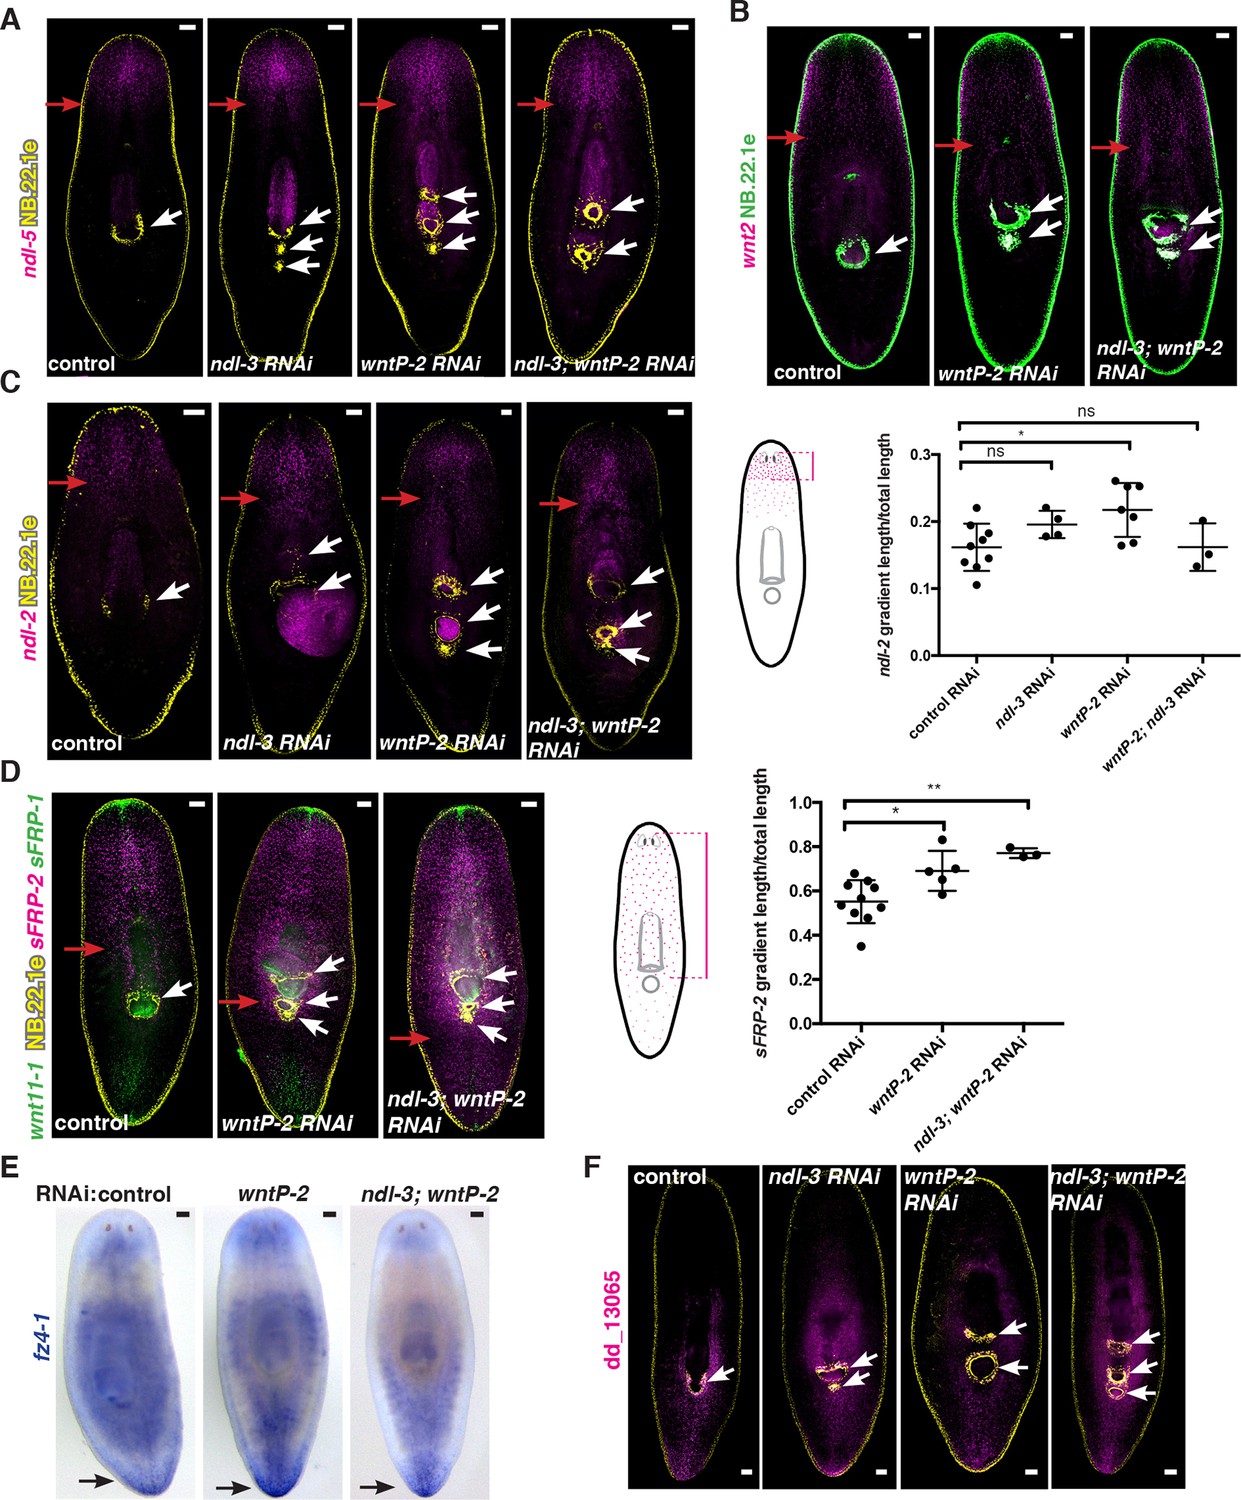
ndl-3 and wntP-2 restrict trunk but not head or tail mRG expression domains in animals with ectopic pharynges/mouths.
(A-D, F) FISH using RNA probes for different mRGs and the esophagus and mouth marker NB.22.1e (yellow or green). White arrows indicate mouths. (A–D) Red arrows point to the posterior edge of the mRG expression gradient. (A) ndl-5 (magenta) and (B) wnt2 (magenta) expression domains do not obviously expand. (C) ndl-2 (magenta) and (D) sFRP-2 (magenta) expression domain slightly expands in some RNAi conditions. Graph on right (mean ± SD) shows quantification of gradient shifts. One-way ANOVA * p<0.05, ** p<0.01. Cartoons on the left depict the gradient in the wild-type animal and the distance that was measured in each case. All measurements were scored blindly. (E) Colorimetric whole-mount ISH using the RNA probe for the posterior mRG fz4-1. Black arrows point to fz4-1 expression. (F) Expression of the posterior mRG dd_13065 (magenta) is still present. FISH images are representative of n>8 animals, ventral view. All FISH and ISH experiments have been repeated at least twice from independent RNAi experiments. All animals were fixed 20 dpa. The screen RNAi feeding protocol was used (see Materials and methods). Anterior, up; scale bar, 100 μm.
Figure 5 with 1 supplement

fz5/8–4, wntA, and ndk restrict head positional identity.
(A) Posterior ectopic eyes seen in uninjured RNAi animals. Black arrows, ectopic eyes. Total number of animals have been pooled from 3 independent RNAi experiments. Cartoon on left shows area imaged. Graph below shows the percentage of intact animals with ectopic posterior eyes in each RNAi condition. (B,C) Posterior expansion of neuronal markers (B) ChAT and notum and eyes (anti-ARRESTIN/VC-1 antibody, images representative of n>5) and (C) glutamic acid decarboxylase (gd, red arrows mark posterior-most cell) and photoreceptor marker opsin. Cartoon on left shows area imaged. Below, graph shows increased gd+ cell numbers, mean ± SD (n>5 animals/condition, 2 independent RNAi experiments, One-way ANOVA) normalized by the length from head tip to the esophagus.
Figure 5—figure supplement 1
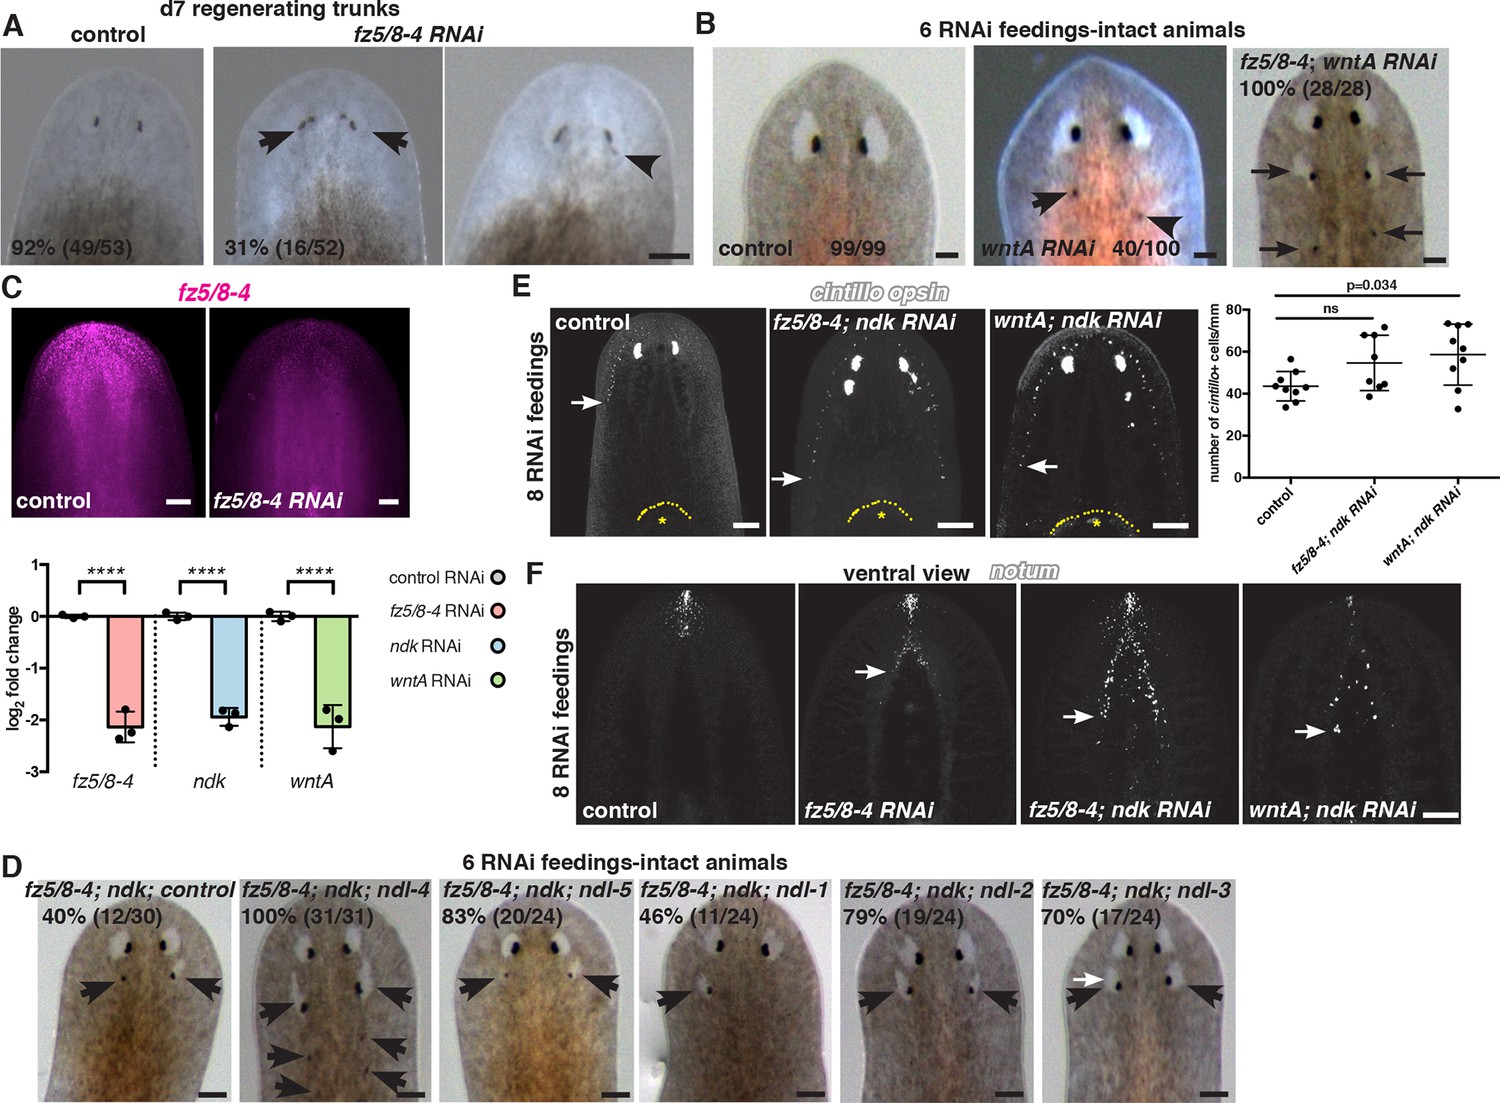
fz5/8–4, wntA, and ndk restrict the brain tissue to the head region.
(A) Ectopic eyes are shown in 7 dpa trunk fragments of fz5/8–4 RNAi animals. Black arrows point to ectopic eyes. Total numbers of RNAi animals are indicated. (B) Ectopic eyes (black arrows) are shown in an intact wntA RNAi and in a fz5/8–4; wntA double RNAi intact animal after 6 RNAi feedings. RNAi experiments were performed three times. Total numbers of RNAi animals are indicated. (C) FISH using the RNA probe fz5/8–4 shows decreased expression of this gene following its RNAi demonstrating the efficiency of the inhibition (6 RNAi feedings). Graph below (mean ± SD) shows quantification of the mRNA levels by qRT-PCR in different RNAi conditions. mRNA was extracted from 6 dpa head fragments. One-way ANOVA, **** p<0.0001. (D) Synergistic RNAi effect of several members of the FGFRL family on the fz5/8–4; ndk RNAi phenotype. RNAi experiments have been performed twice. Total number of RNAi animals is indicated. Black arrows point to ectopic eyes. (E,F) FISH using the neuronal markers: (E) cintillo, and (F) notum, and the photoreceptor marker opsin (E). Graph shows the percentage of cintillo+ cells (mean ± SD) in intact RNAi animals normalized by the length of the animal (from the tip of the head to the esophagus), (n>8 animals per RNAi condition, two independent RNAi experiments, One-way ANOVA). Yellow dotted line shows the esophagus location, * shows pharynx. White arrows show the posterior-most cell expressing the neuronal marker analyzed. Anterior, up; dorsal view unless indicated. Scale bar, 100 μm.
Figure 6 with 1 supplement
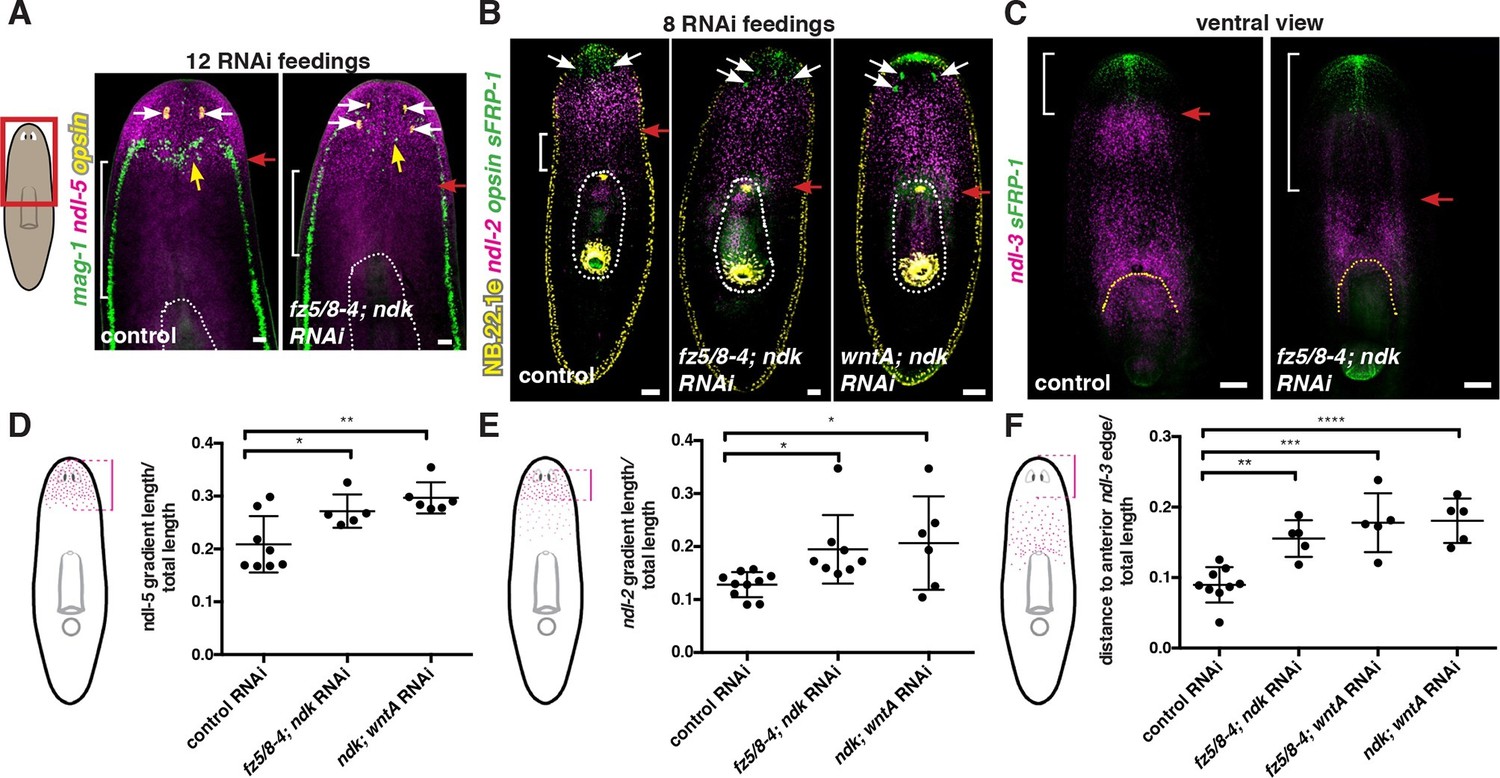
Anterior and prepharyngeal mRG gradients are shifted in fz5/8–4, ndk, and wntA RNAi animals with expanded brain tissue and ectopic eyes.
(A,B) Expansion of mRG expression domains towards the animal posterior. White bracket marks distance between mRG posterior boundary and esophagus; red arrows mark expression domain shifts. White dotted lines outline pharynx. (A) ndl-5, and (B) ndl-2. (A) Disorganization of mag-1 expression (yellow arrows). White arrows and opsin expression mark eyes. (C) Retraction of the pre-pharyngeal mRG ndl-3. Red arrows points to the shift towards the posterior of the anterior gradient boundary. White bracket indicates distance from the tip of the head to the anterior edge of the ndl-3 gradient. In all panels, anterior is up. Scale bar, 100 μm. All FISH images are representative of n>10 animals and at least 2 independent RNAi experiments were performed. (D–F) Graphs show quantification of the expression domain shifts for the mRGs shown in the FISH experiments (mean ± SD, at least 3 independent experiments were pooled, One-way ANOVA). Cartoons on the left depict the expression domain in the wild-type animal and the distance (normalized to total length) that was measured in each case. All measurements were scored blind.
Figure 6—figure supplement 1
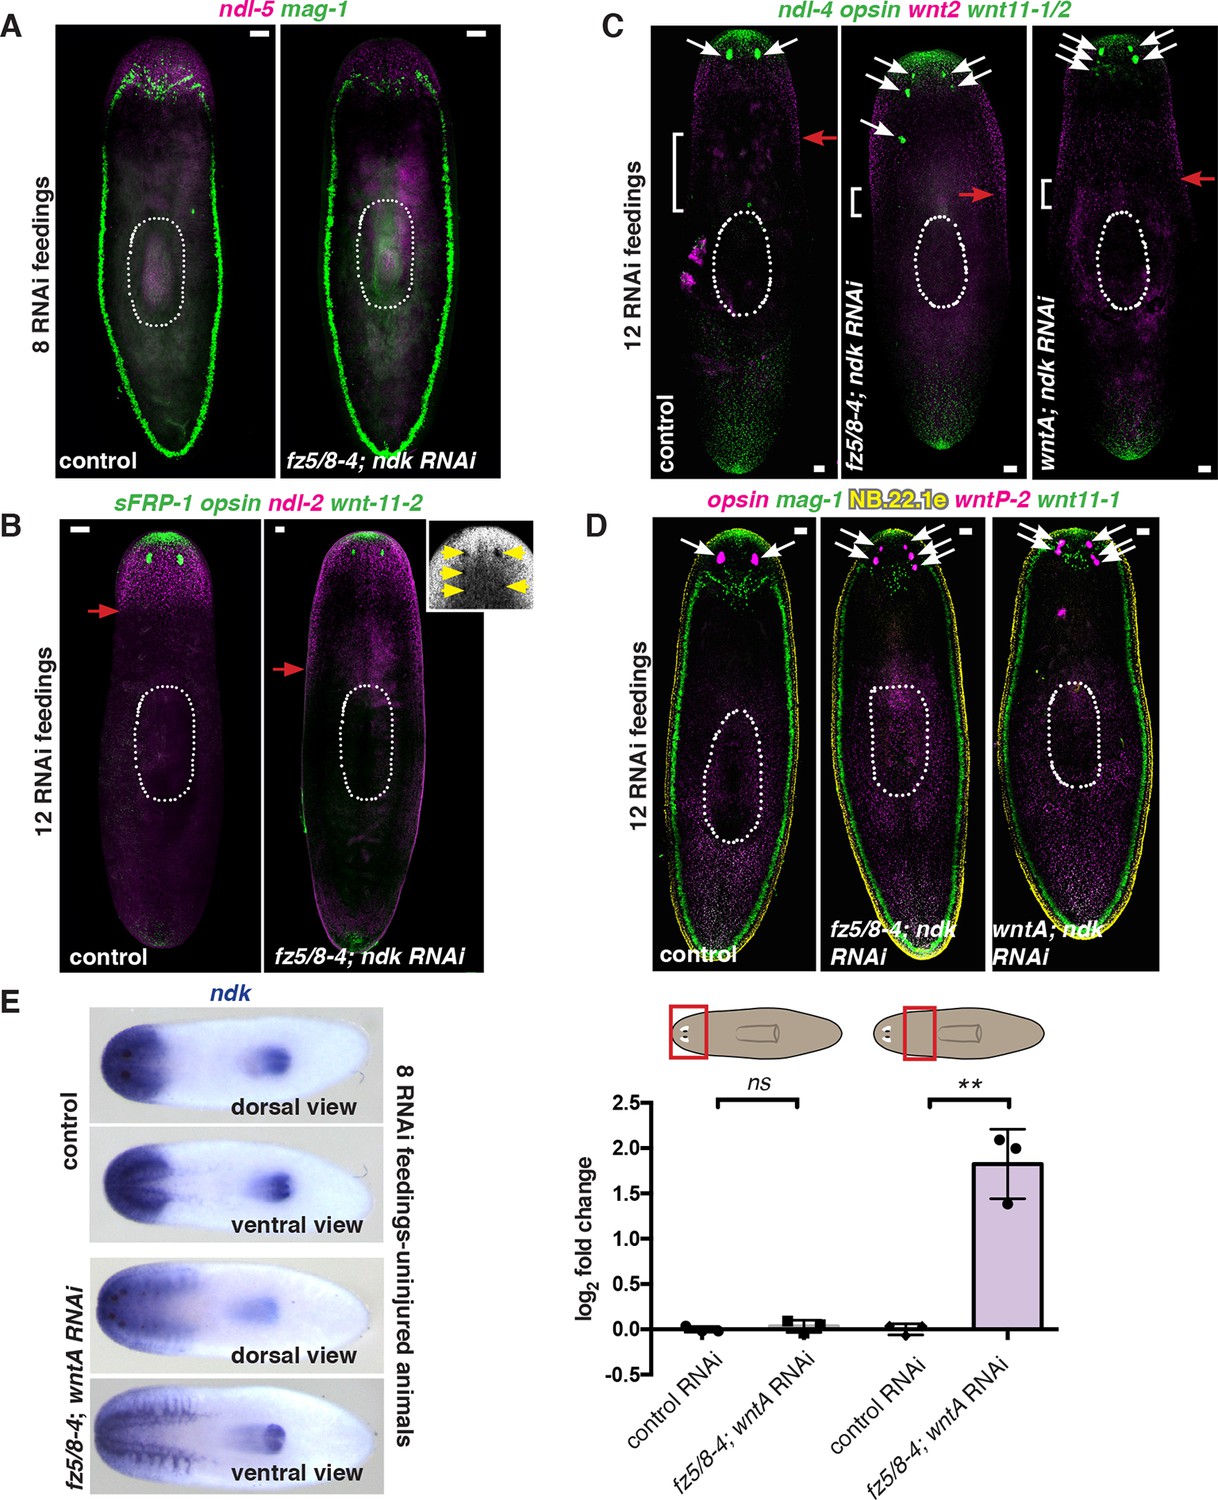
fz5/8–4, wntA, and ndk locally restrict mRG expression in animals with expanded brain tissue and ectopic eyes.
FISH and ISH in intact RNAi animals after 8 or 12 RNAi feedings. (A,D) FISH experiments show normal (A, after only 8 RNAi feedings) and abnormal (D, after 12 RNAi feedings) organization in the expression of the secretory cell marker mag-1 (green). (B,C) FISH experiments show expression domain shifts of prepharyngeal mRGs ndl-2 (magenta, B) and wnt2 (C). (B–D) Posterior mRG expression domains (wntP-2, wnt11-1, wnt11-2, both wnt11 genes pooled in C) did not change. opsin (green or magenta) and NB.22.1e (yellow). For all FISH images, red arrows point to the posterior edge of the mRG expression domain. White arrows point to eyes. Anterior, up. Scale bar, 100 μm. FISH images are representative of n>8, FISH experiments. DAPI shows ectopic eyes in the fz5/8–4; ndk RNAi animal imaged (yellow arrows) in B. FISH was performed twice from independent RNAi experiments. (E) ISH using ndk RNA probe shows posterior expansion of the ndk expression domain in a fz5/8–4; wntA RNAi animal after 8 RNAi feedings. Images are representative of n≥5 animals per condition. Anterior, left. Right graph shows quantification of increased ndk expression by qRT-PCR. Cartoons on top indicate the region from which mRNA was extracted.
Figure 7
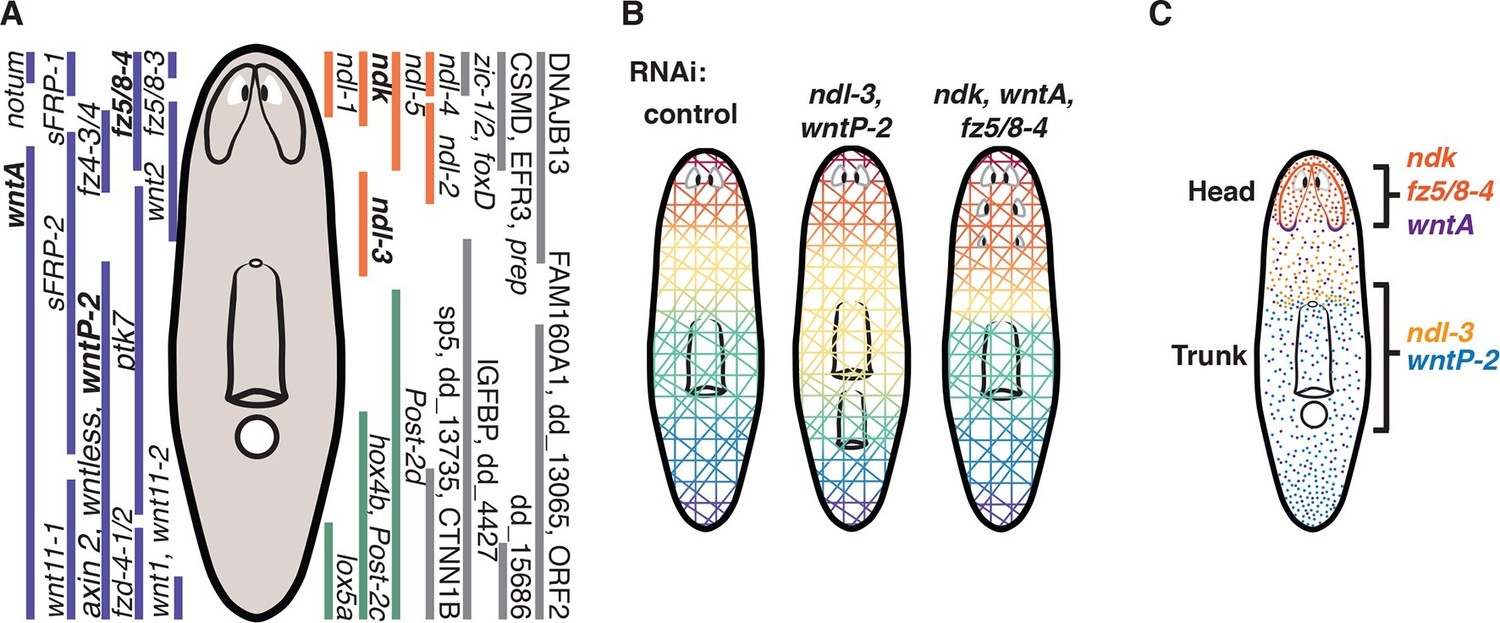
Two FGFRL-Wnt circuits control AP patterning in planarians.
(A) Expression domains of all identified mRGs along the planarian AP axis. Wnt pathway (purple), FGFRL (orange), and Hox genes (green). In bold, genes shown here to be involved in maintaining regional identity. (B) Cartoons summarize the characterized RNAi phenotypes. ndl-3 and wntP-2 restrict the number of pharynges and mouths in the trunk region. wntP-2 RNAi animals with ectopic pharynges/mouths have an expanded ndl-3 domain whereas ndl-3 RNAi animals with ectopic pharynges/mouths have a reduced wntP-2 expression domain. fz5/8–4, ndk, and wntA restrict the brain tissue to the head. Inhibition of these genes results in ectopic posterior eyes, brain expansion, and expanded domains of head mRGs. (C) Expression domains of the two FGFRL-Wnt circuits are shown. Black brackets indicate the region controlled by the FGFRL-Wnt circuits.
Videos
Video 1
Control, wntP-2, and ndl-3; wntP-2 RNAi animals eating from one or two pharynges.
https://doi.org/10.7554/eLife.12845.013Additional files
-
Supplementary file 1
Summary of mRG data from single-cell RNA sequencing data, ISH screen, and RNAi screen.
(A) Single-cell library information. (B) Top 12 significant genes defining principal components (PC) 1 and 2. (C) Anterior (regions 1-3) versus Posterior (regions 8-10) SCDE analysis and ISH results. (D) Head (region 1) versus post-pharyngeal (regions 7-9) SCDE analysis and ISH results. (E) Pre-pharyngeal (regions 2-4) versus post-pharyngeal (region 10) SCDE analysis and ISH results. (F) List of 44 mRGs. (G) RNAi summary. (H) qRT-PCR primers.
- https://doi.org/10.7554/eLife.12845.021
Download links
A two-part list of links to download the article, or parts of the article, in various formats.
Downloads (link to download the article as PDF)
Open citations (links to open the citations from this article in various online reference manager services)
Cite this article (links to download the citations from this article in formats compatible with various reference manager tools)
Two FGFRL-Wnt circuits organize the planarian anteroposterior axis
eLife 5:e12845.
https://doi.org/10.7554/eLife.12845


