Myosin III-mediated cross-linking and stimulation of actin bundling activity of Espin
- Shenzhen Peking University-The Hong Kong University of Science and Technology Medical Center, China
- Hong Kong University of Science and Technology, China
- Pennsylvania State University College of Medicine, United States
- Chinese Academy of Sciences, China
Figures
Figure 1 with 2 supplements
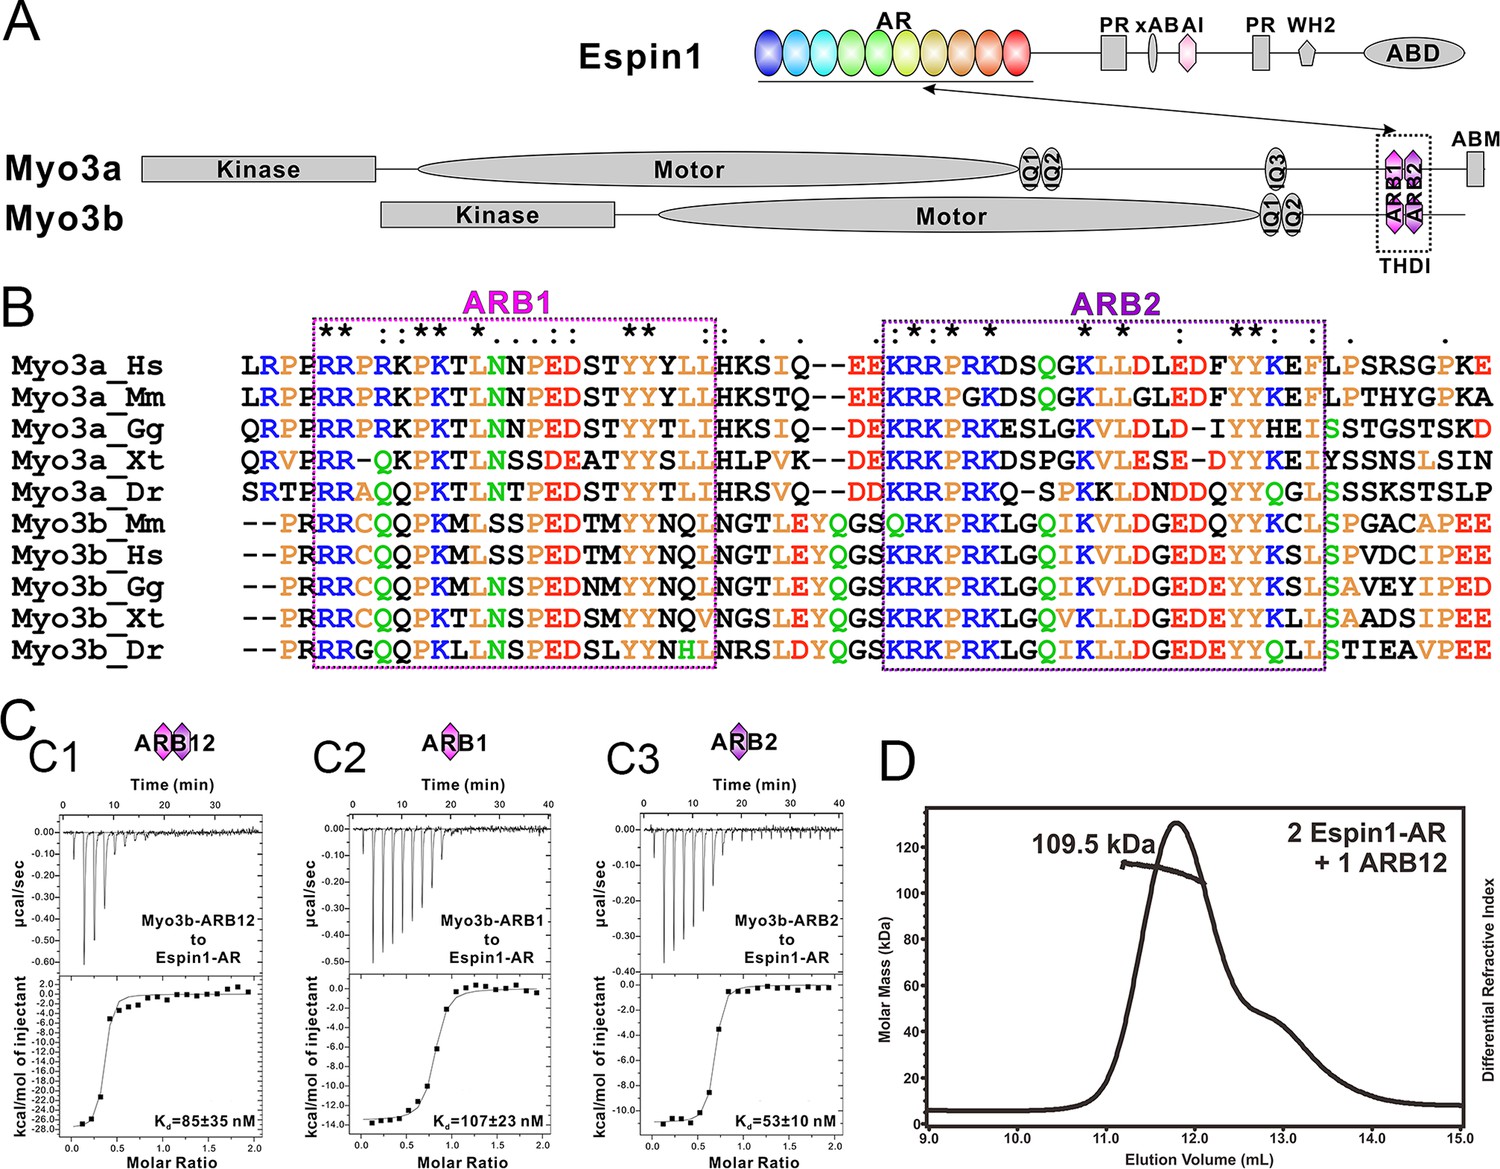
Biochemical characterizations of the Myo3/Espin1 interaction.
(A) Domain organizations of Espin1, Myo3a and Myo3b. (B) Sequence alignment of THDI of Myo3a and Myo3b showing that there are a pair of repeating sequences within THDI, which we term as ARB1 and ARB2. Hs, human; Mm, mouse; Gg, chicken; Xt, Xenopus tropicalis; Dr, Danio rerio. (C) ITC results showing that Myo3b-ARB12 (C1) as well as each individual site (C2 for ARB1 and C3 for ARB2) can bind to Espin1-AR with strong affinities. (D) FPLC-MALS showing that ARB12 and Espin1-AR form a 1:2 complex.
Figure 1—figure supplement 1
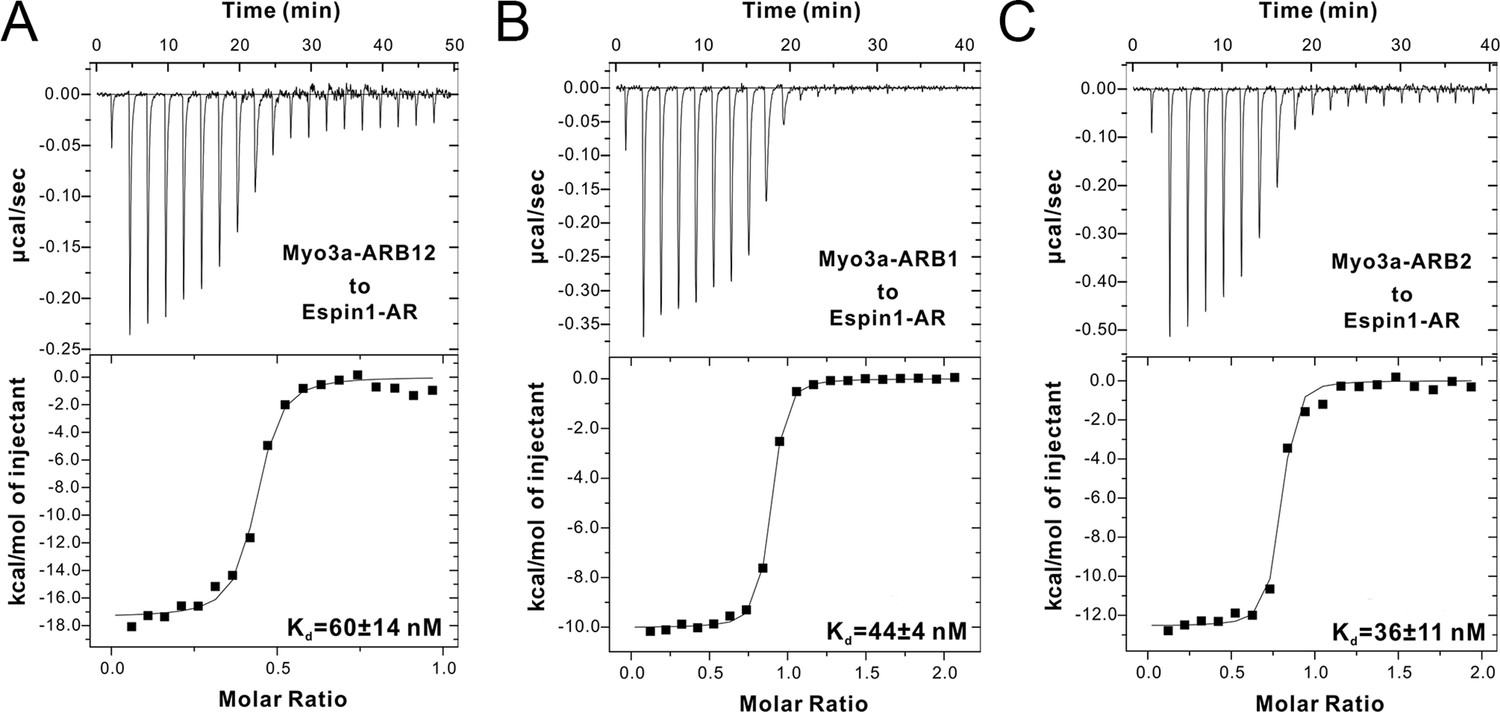
ITC results of Myo3a-ARBs binding to Espin1-AR.
(A–C) ITC results showing that Myo3a-ARB12 (A) as well as each individual ARB (B for ARB1 and C for ARB2) can bind to Espin1-AR with strong affinities.
Figure 1—figure supplement 2
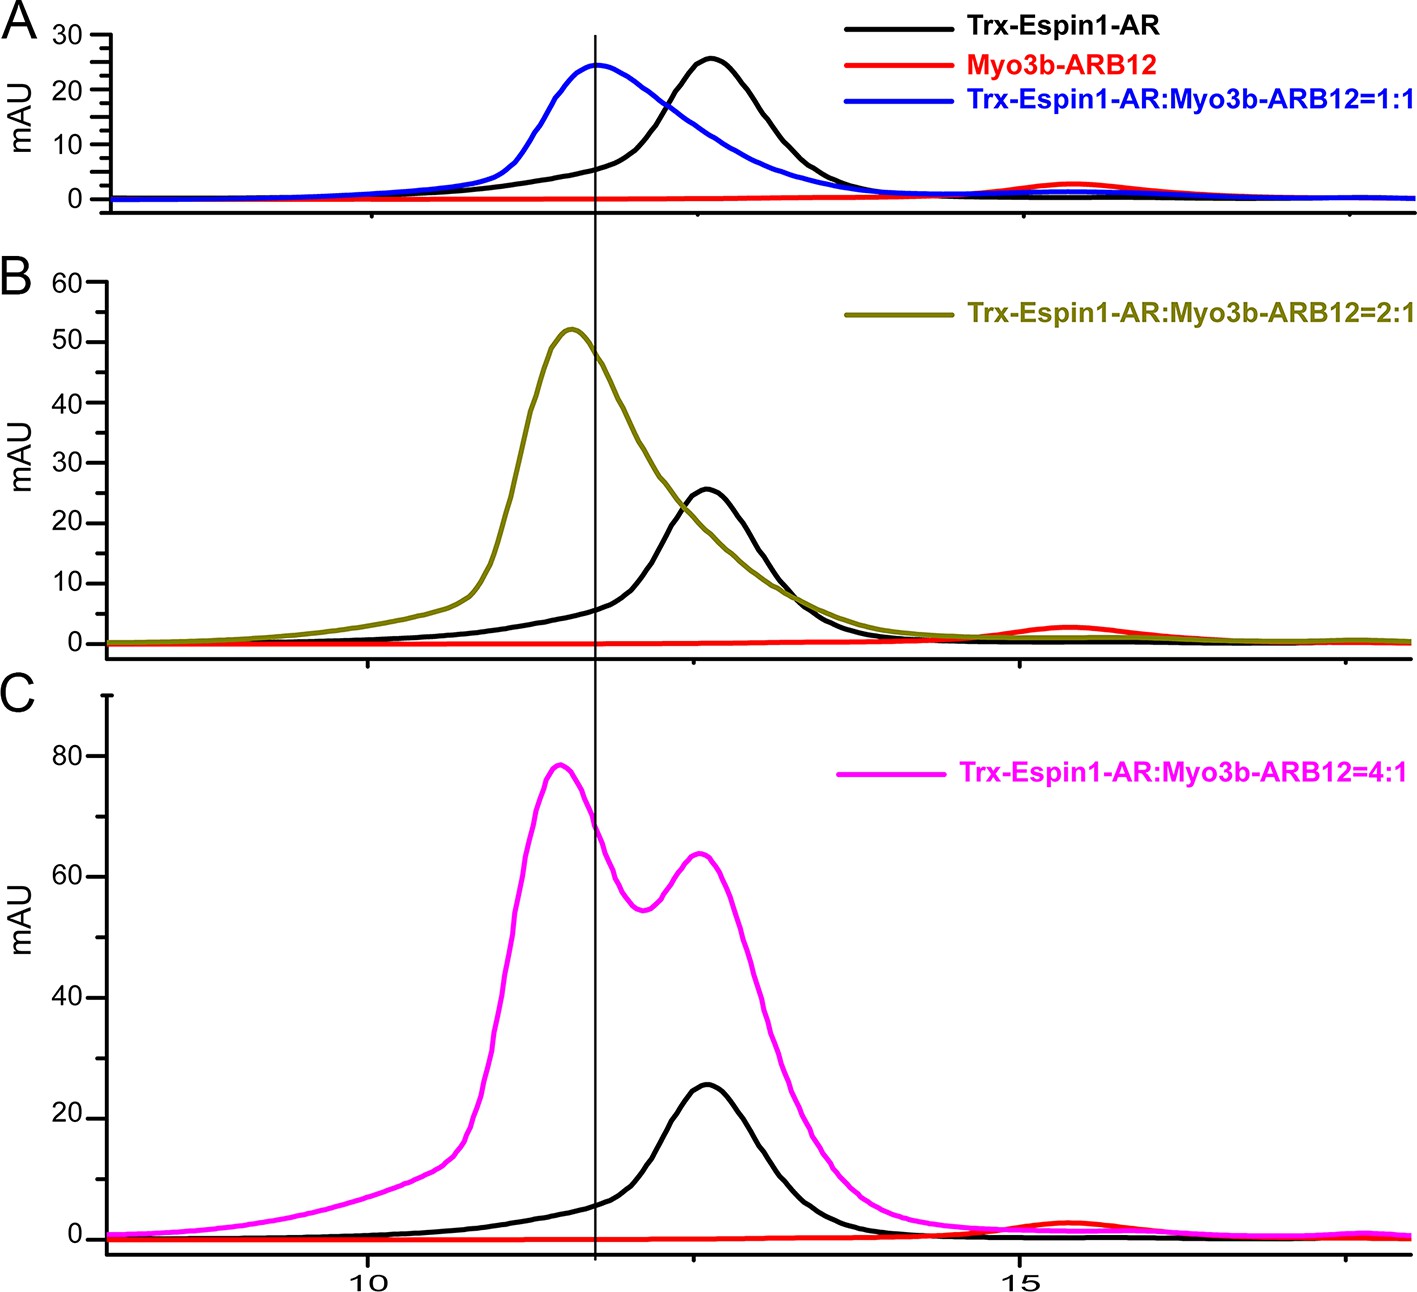
Analytical gel filtration chromatography analysis of the Espin1-AR and Myo3b-ARB12 interaction.
(A–C) The profiles of mixtures of Trx-Espin1-AR and Myo3b-ARB12 with different molar-ratios. The black and red curves in each panel represent the elution profiles of Trx-Espin1-AR alone and Myo3b-ARB12 alone, respectively.
Figure 2 with 2 supplements
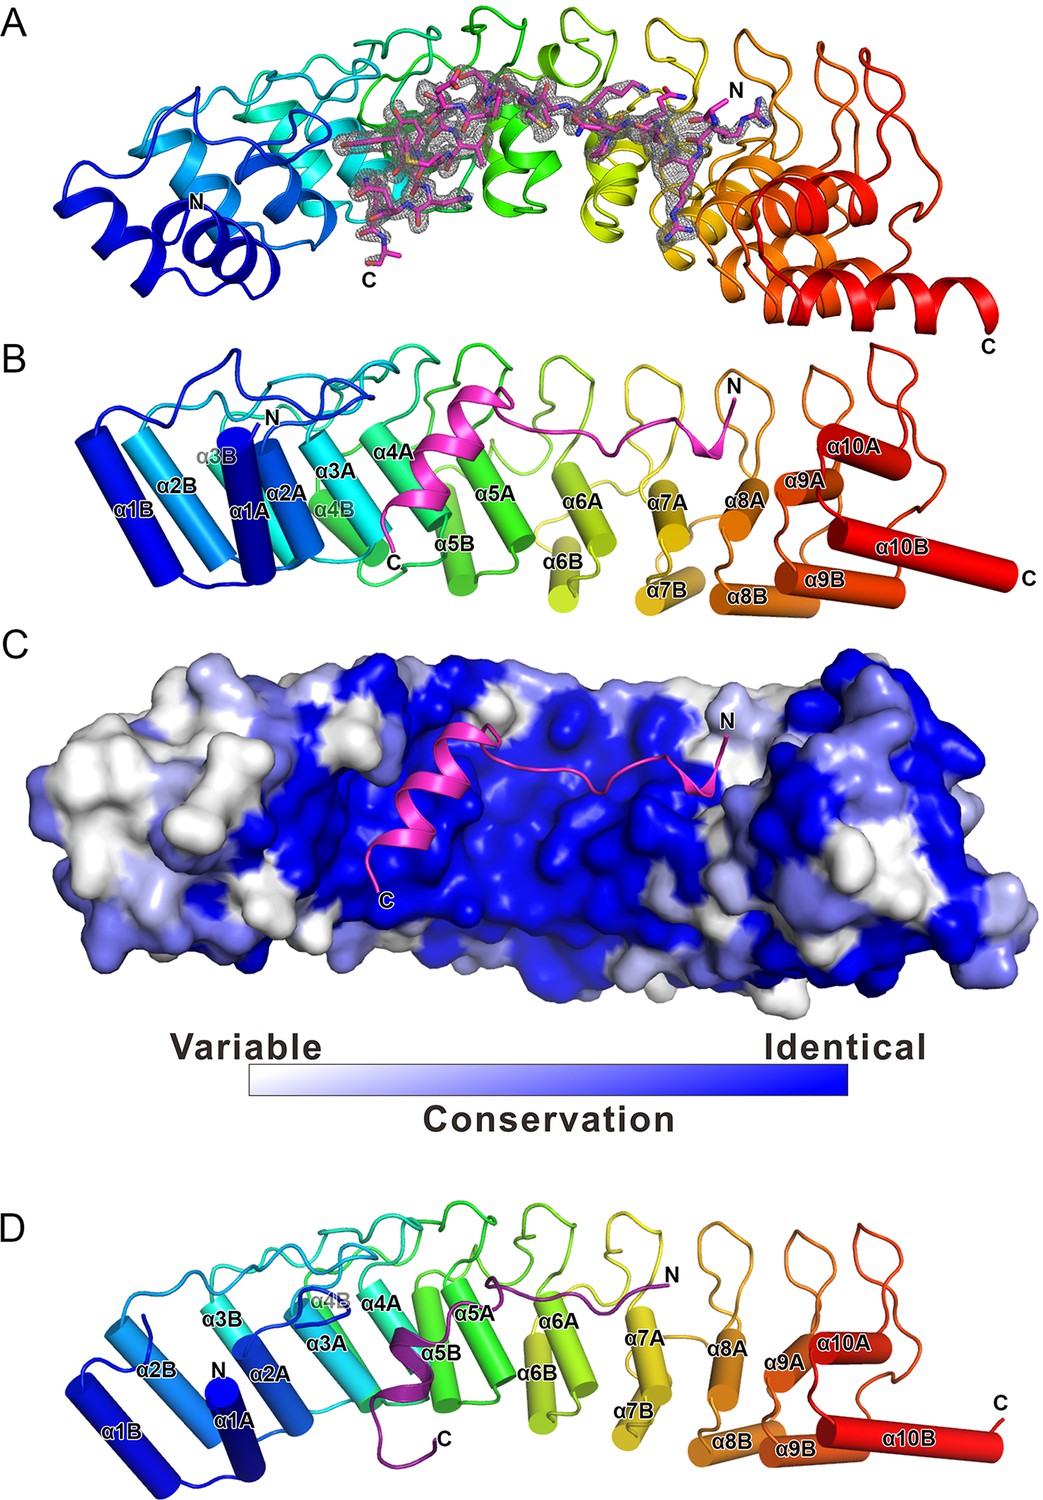
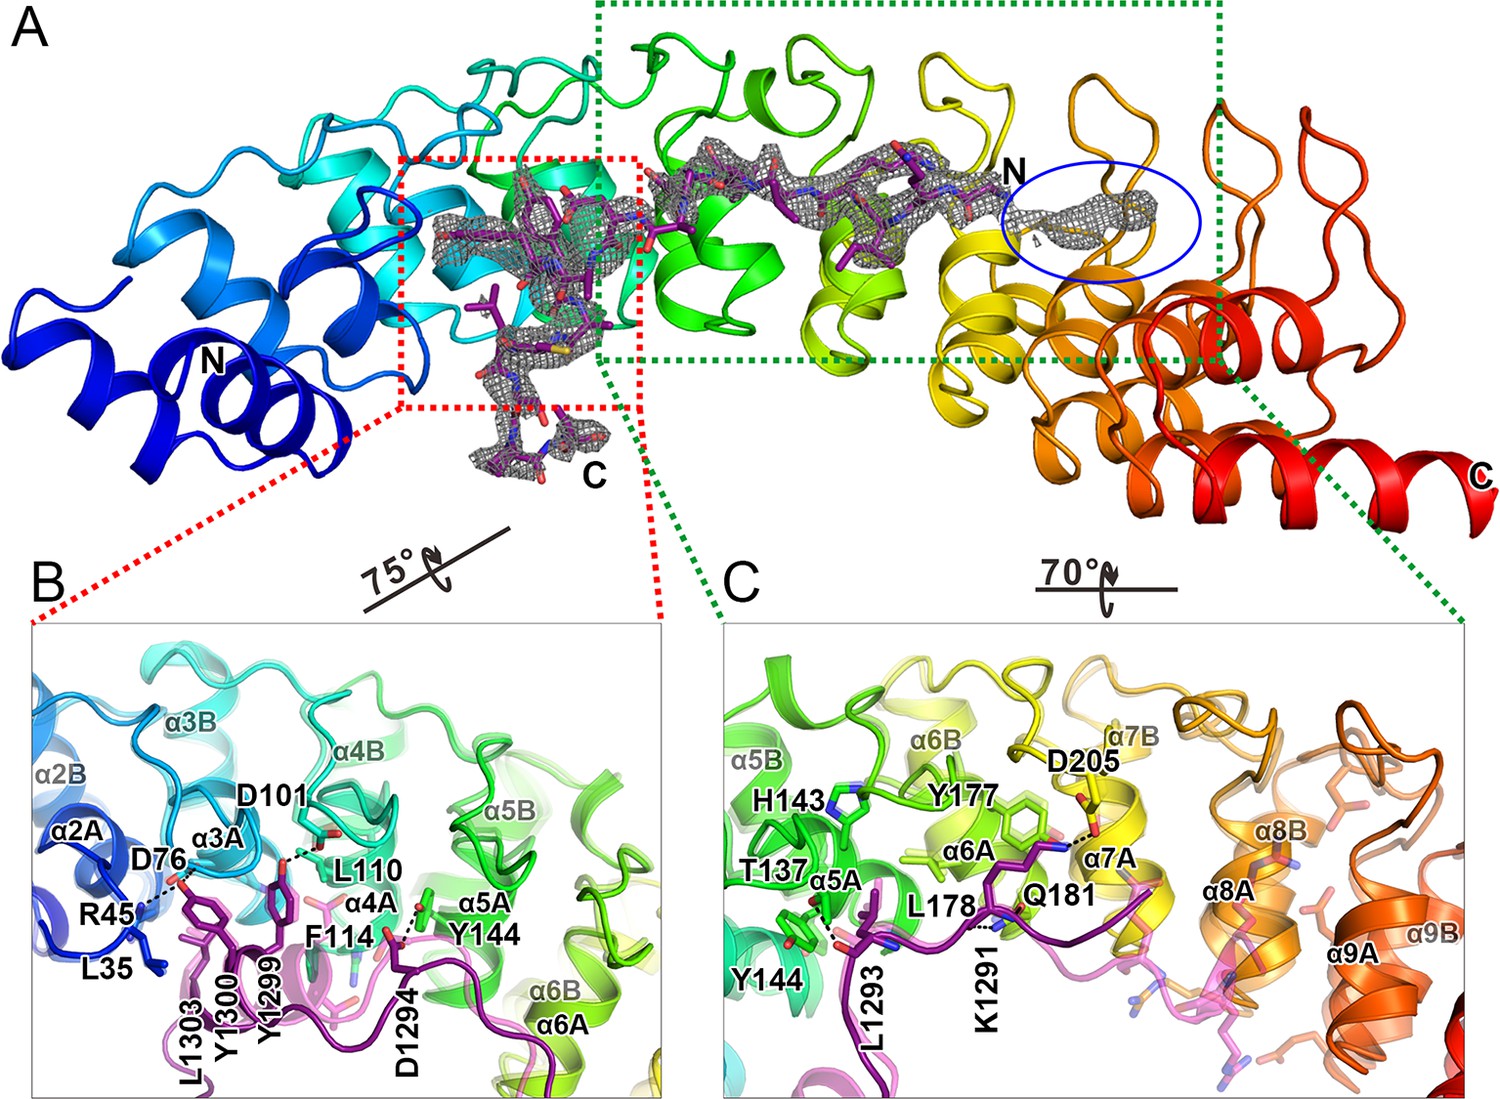
The overall structure of the Myo3-ARB/Espin1-AR complex.
(A) An omit map showing the binding of Myo3b-ARB1 to Espin1-AR. The Fo-Fc density map was generated by deleting the Myo3b-ARB1 part from the final model and contoured at 3.0σ. The Myo3b-ARB1 fitting the electron density is displayed in the stick model. (B) The overall structure of the Myo3b-ARB1/Espin1-AR complex. The Espin1-AR is shown in cylinders, Myo3b-ARB1 is shown with the ribbon diagram and colored in magenta. (C) The amino acid conservation map of Espin1-AR. The conservation map was calculated based on the sequence alignment of vertebrate Espin1 and mammalian Espin-like proteins shown in Figure 2—figure supplement 1. The identical residues are colored in dark blue; the strongly similar residues are colored in blue; the weakly similar residues are colored in light blue; the variable residues are colored in white. (D) The overall structure of Myo3b-ARB2/Espin1-AR complex. The Espin1-AR is shown in cylinders, Myo3b-ARB2 is shown in ribbon diagram and colored in dark purple.
Figure 2—figure supplement 1
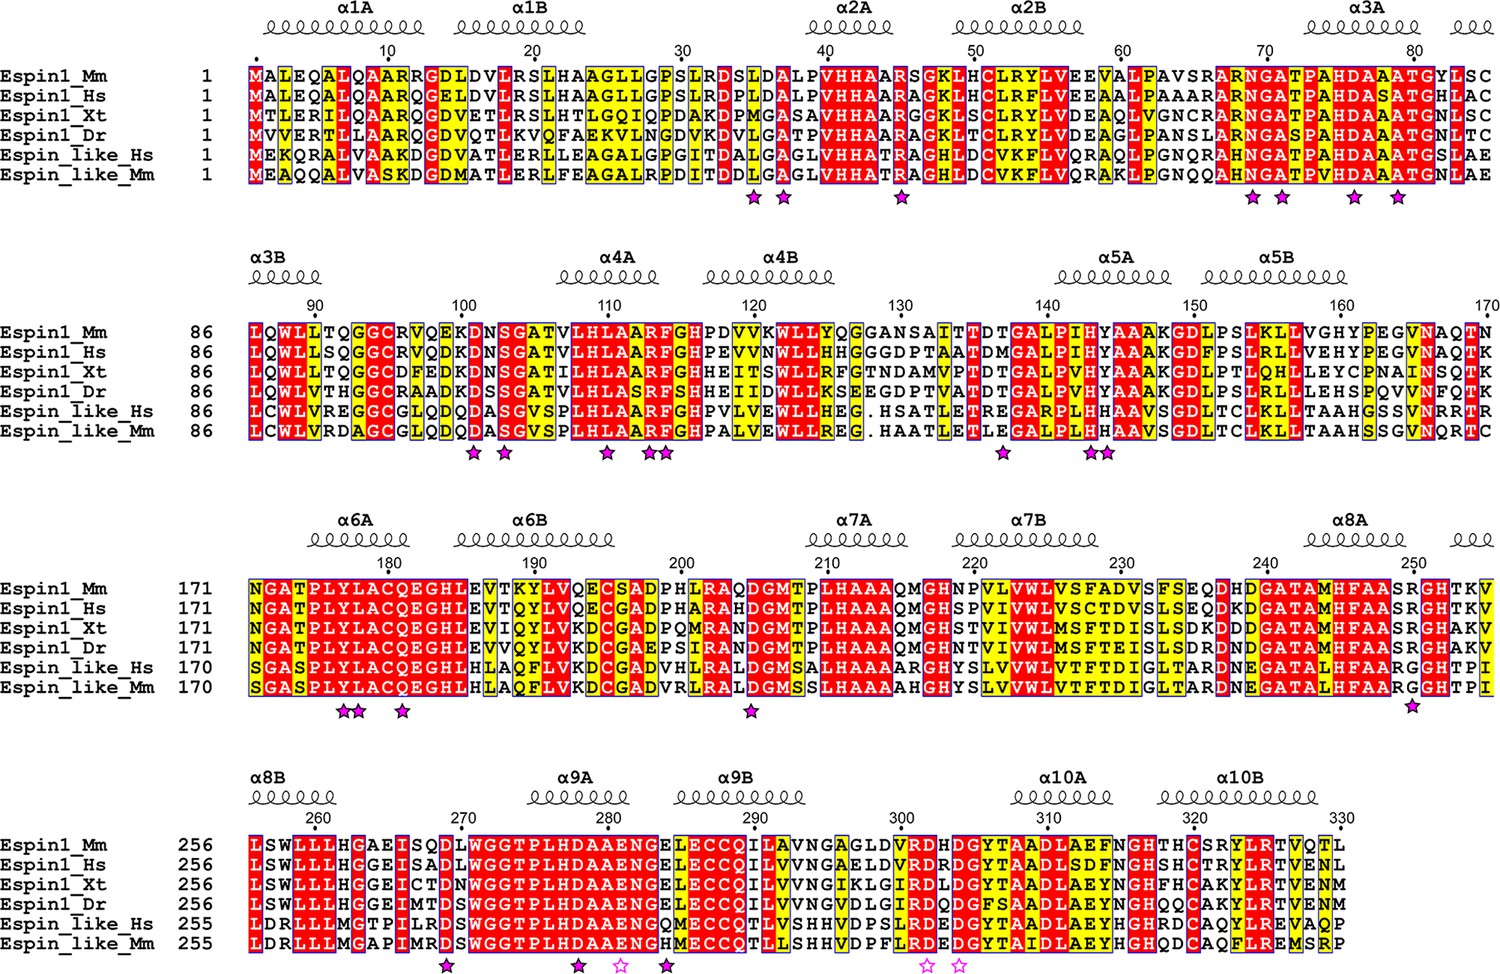
Structural-based sequence alignments of AR of Espin1 from different vertebrate species and Espin-like proteins from mammals.
Residues that are identical and highly similar are shown in red and yellow boxes, respectively. Residues that are directly involved in ARBs binding are highlighted with solid magenta stars. Negatively charged residues in region 3 that extend the negatively charged pockets (also refer to Figure 3) are highlighted with unfilled magenta stars. The alignment was created using ESPript 3.0 (http://espript.ibcp.fr/ESPript/ESPript/).
Figure 2—figure supplement 2
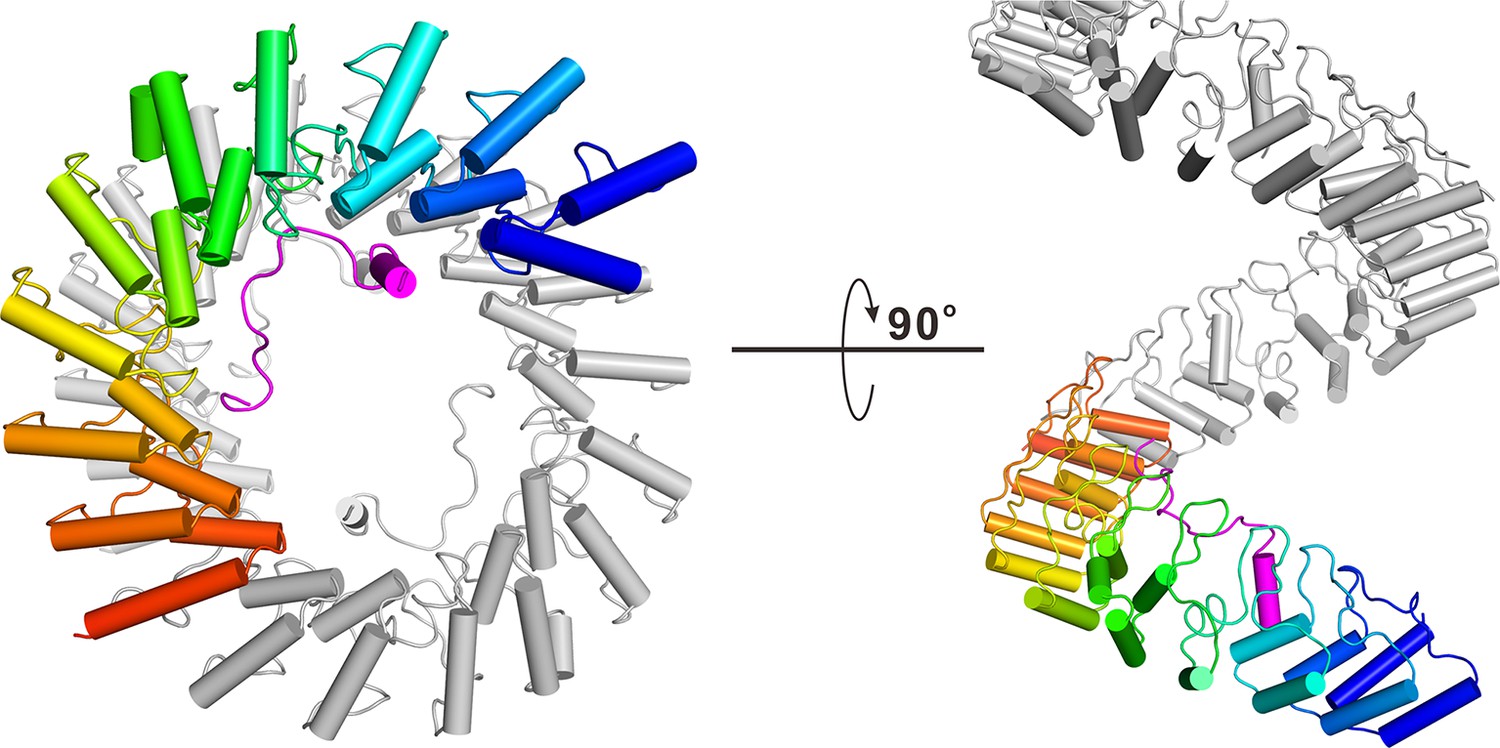
Superhelical model of Espin1-AR.
The superhelical model of Espin1-AR viewed from the top (left) and side (right). To illustrate the curvature nature of the ANK repeats, we artificially connected several Espin1-AR units in a head-to-tail manner, and showing one Espin1-AR unit using the color mode as used in Figure 2.
Figure 3 with 2 supplements
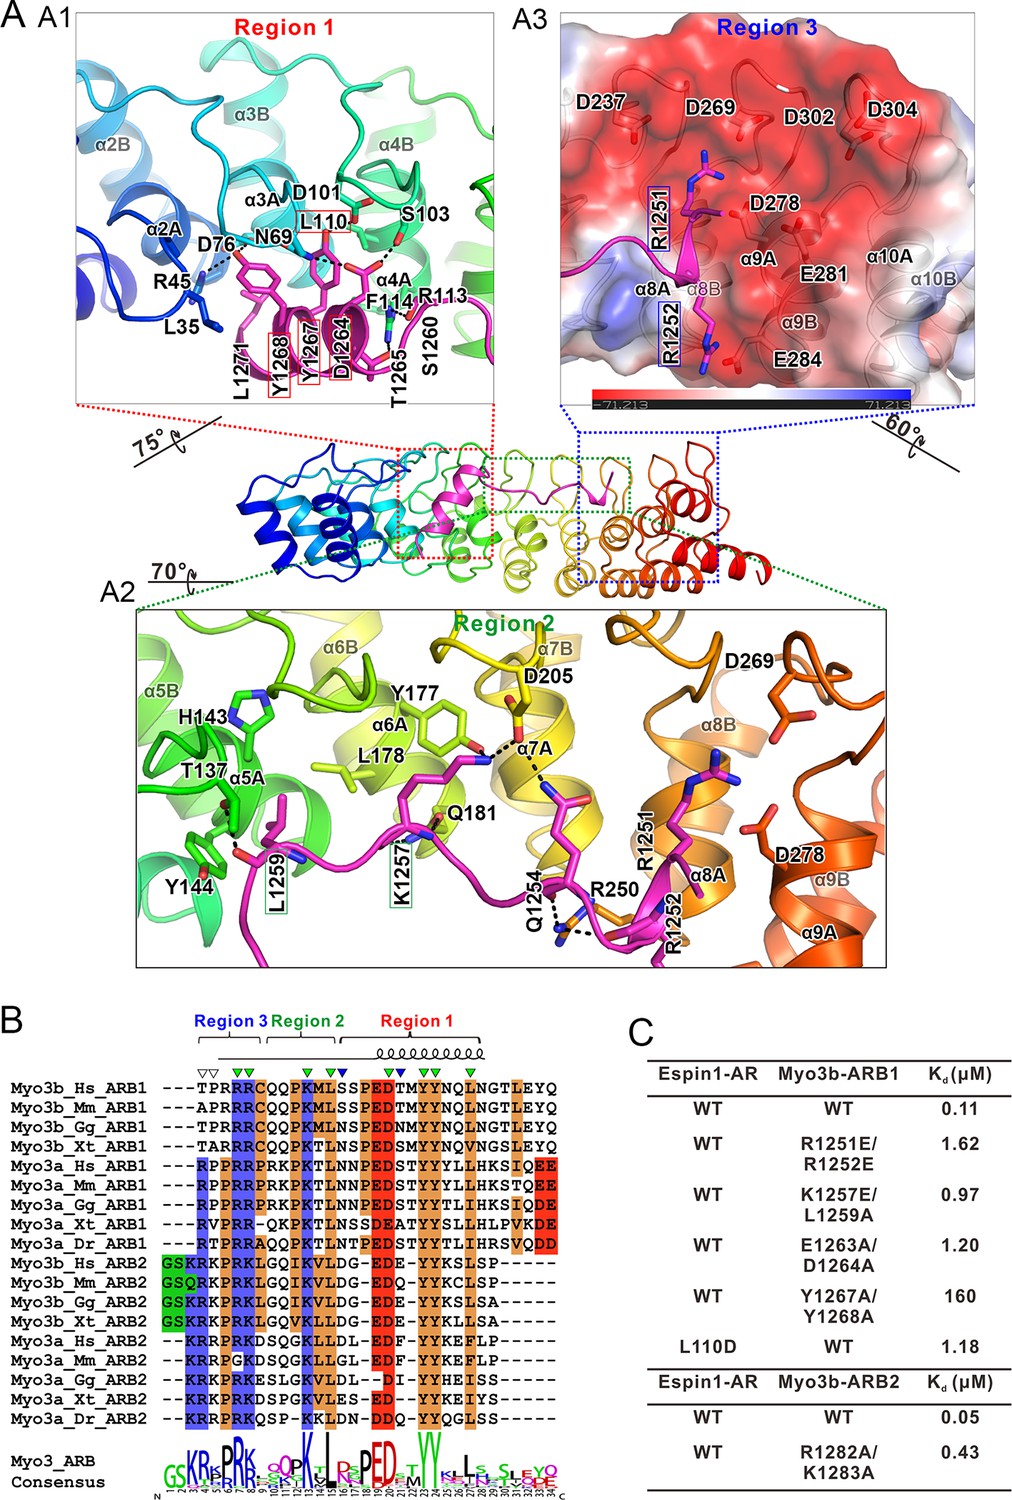
The detailed Myo3/Espin1-AR interaction.
(A) The Myo3b-ARB1/Espin1-AR interface is divided into three regions corresponding to the ‘YY’ motif (A1), the ‘KxL’ motif (A2) and the N-terminal positively charged residues (A3) of Myo3b-ARB1. The residues tested with the mutagenesis experiments are highlighted with boxes. The side chains or main chains of the residues involved in the interactions are highlighted in the stick model. Charge-charge and hydrogen bonding interaction are highlighted by dashed lines. The electrostatic surface potentials were calculated using PyMol. (B) Sequence alignment of Myo3-ARBs showing the conservation of ARBs. The conserved residues involved in the binding are highlighted with solid green triangles. The variable residues involved in the binding are highlighted with solid blue triangles. The two positively charged residues in ARB2 that are not resolved in the structure are highlighted with unfilled triangles. The sequence logo beneath the alignment was generated using WebLogo (Crooks et al., 2004). (C) ITC derived dissociation constants showing that mutations of the critical residues in the interface invariably weakened the binding. The original ITC data are shown in Figure 3—figure supplement 1.
Figure 3—figure supplement 1
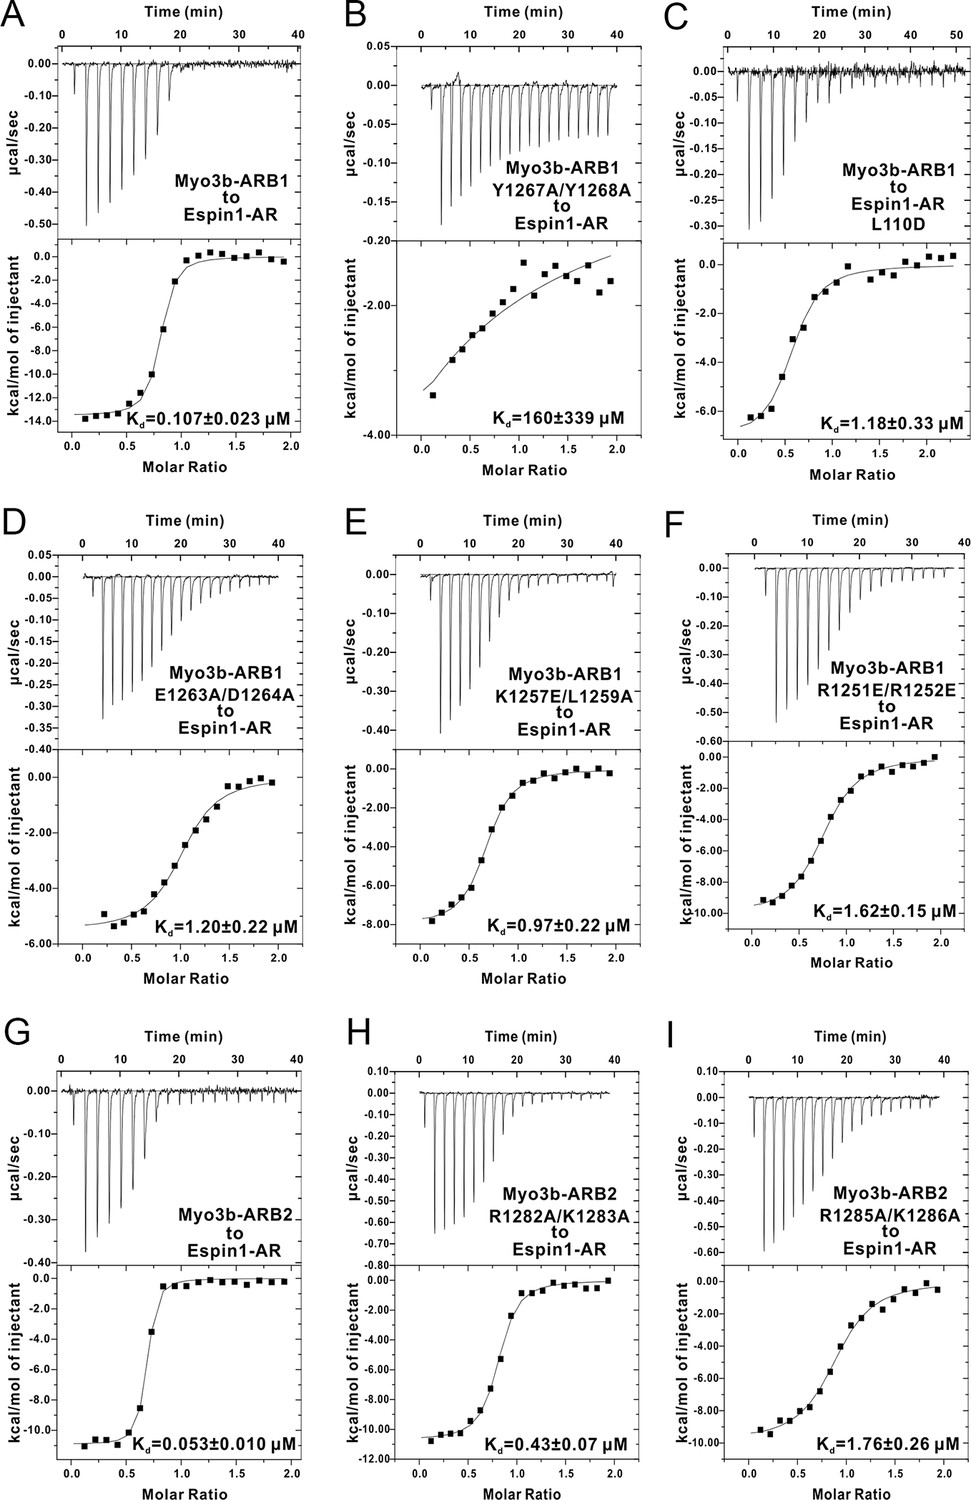
The ITC titration curves for calculating the dissociation constants shown in Figure 3C.
Note that Panels A & G are the same as Figure 1C2 and C3.
Figure 3—figure supplement 2
Comparison of Myo3b-ARB2/Espin1-AR and Myo3b-ARB1/Espin1-AR structures.
(A) An omit map showing the binding of Myo3b-ARB2 to Espin1-AR. The Fo-Fc density map was generated by deleting the Myo3b-ARB2 part from the final model and contoured at 2.5σ. The Myo3b-ARB2 fitting the electron density is displayed in the stick model. (B and C) The Myo3b-ARB2/Espin1-AR interface corresponding to the ‘YY’ motif (B) and the ‘KxL’ motif (C). The side chains or main chains of the residues involved in the interactions are highlighted in the stick model. Charge-charge and hydrogen bonding interaction are highlighted by dashed lines. As a comparison, the structure of Myo3b-ARB1/Espin1-AR is transparent.
Figure 4 with 1 supplement
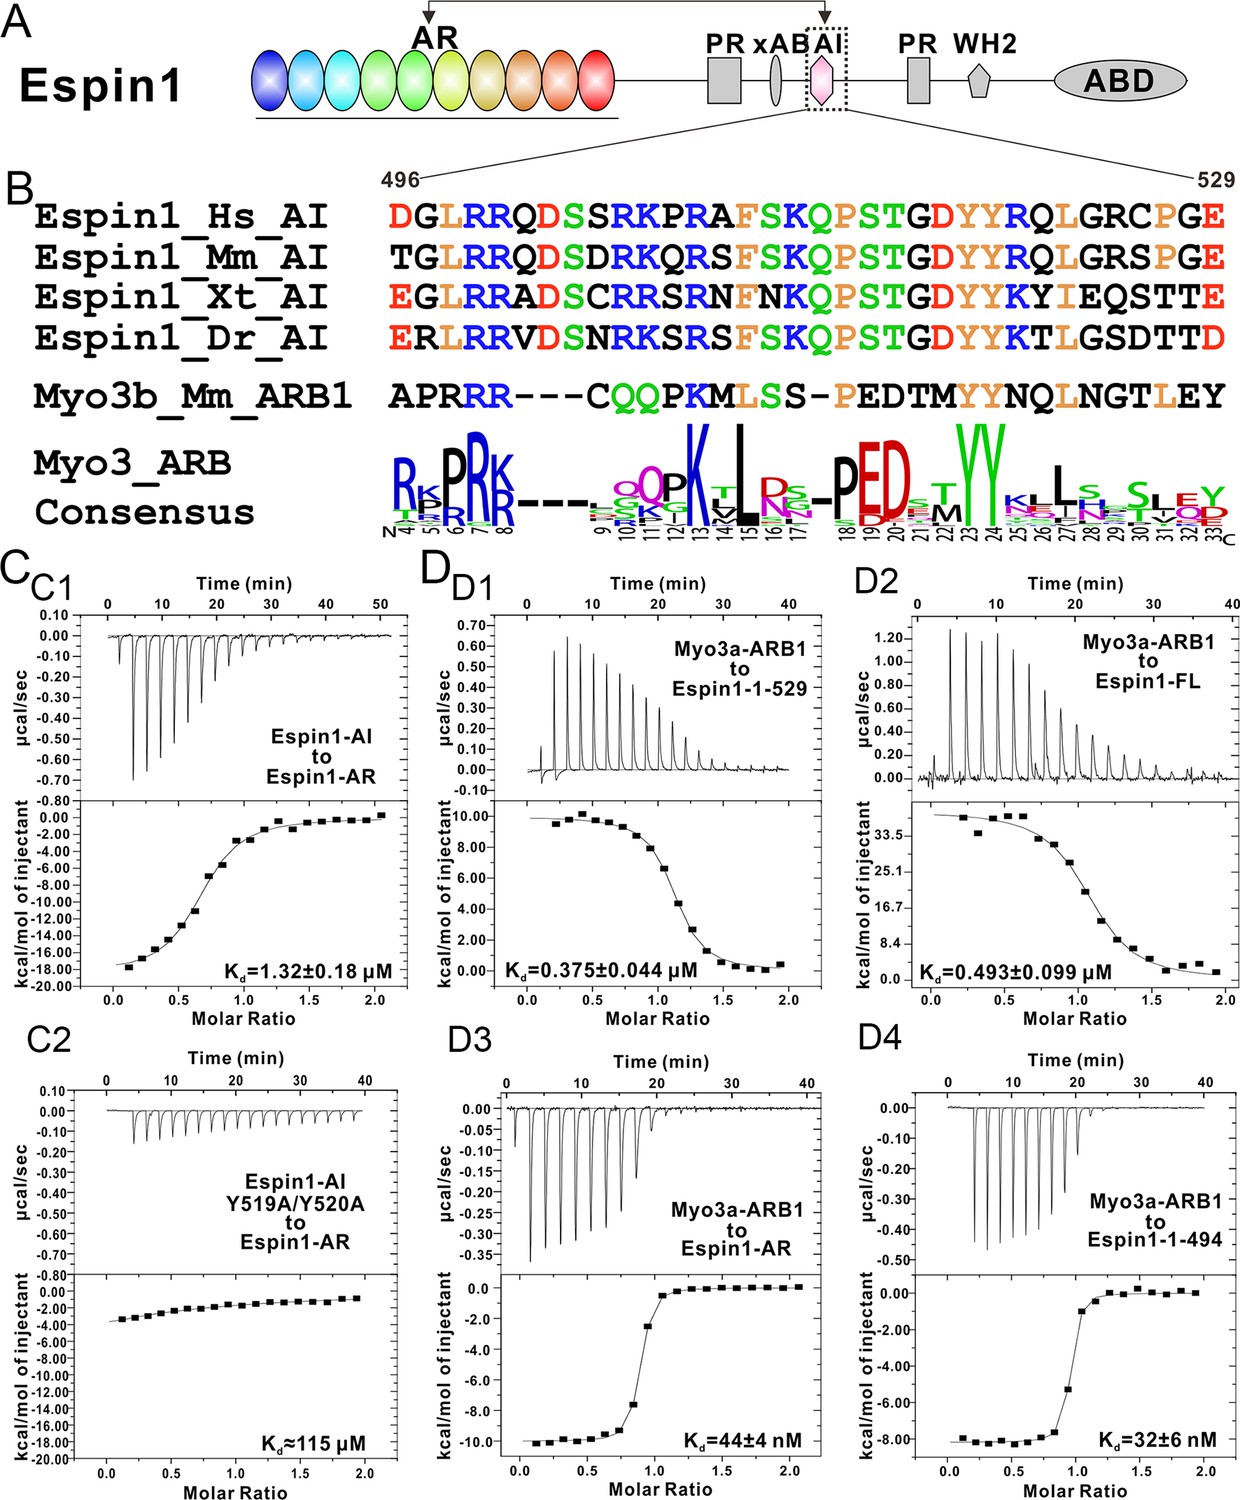
Biochemical characterization of the Espin1 auto-inhibition.
(A) Domain organization of Espin1 showing that the Espin1-AI in the middle may bind to Espin1-AR at the N-terminus. (B) Sequence alignment of Espin1-AI from different vertebrate species, and comparison of Espin1-AI with the consensus sequence of Myo3-ARBs as shown in Figure 3D. (C) ITC result showing that Espin1-AI binds to Espin1-AR with a moderate affinity (C1). Mutation of the ‘YY’ motif to alanine greatly decrease the binding (C2). (D) ITC results showing that Myo3a-ARB1 can still bind to Espin1-1-529 (D1) and Espin1-FL (D2) with a sub-micromolar affinity. In contrast, Myo3a-ARB1 binds to Espin1-AR (D3) and Espin1-1-494 with comparable strong affinities (D4). Panel D3 is the same as Figure 1—figure supplement 1B.
Figure 4—figure supplement 1
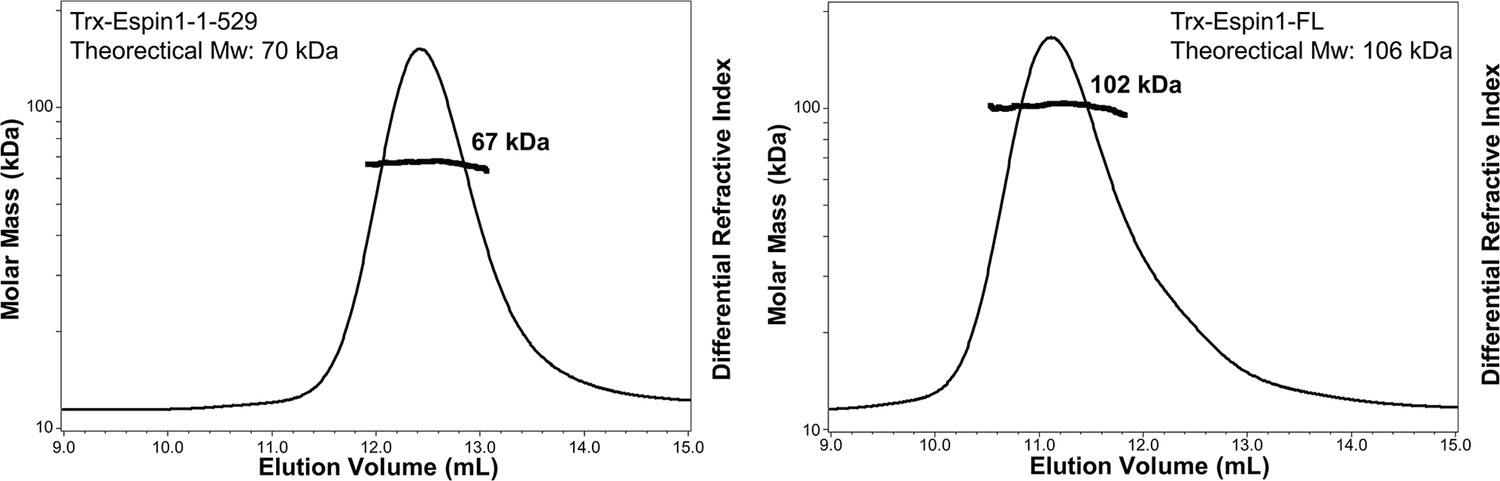
FPLC-MALS results of Espin1-1-529 and Espin1-FL.
The FPLC-SLS results showing that Espin1-1-529 (left) and Espin1-FL (right) each exists as a monomer in solution.
Figure 5 with 1 supplement
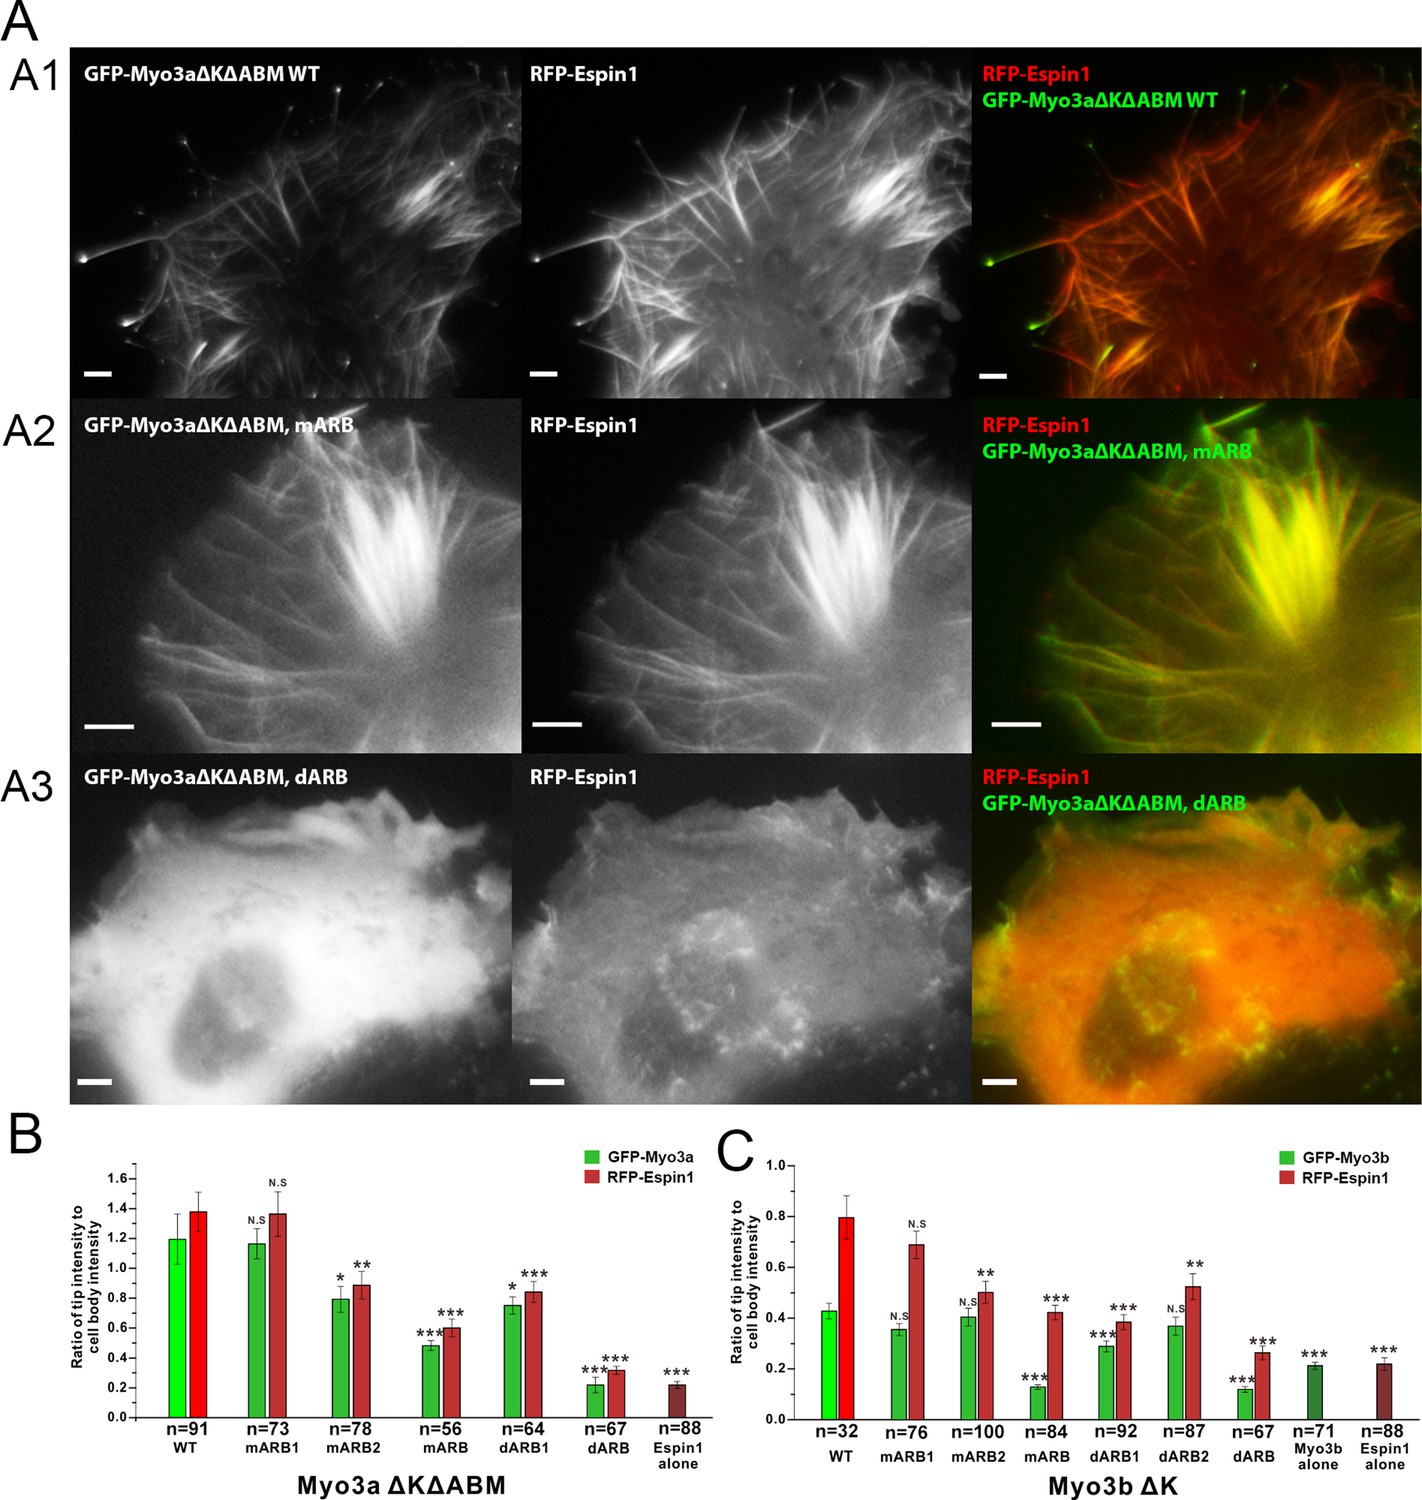
Myo3-ARBs/Espin1 interaction is critical for the filopodia tip localizations of Espin1 and Myo3.
(A) Representative fluorescence images of COS7 cells co-expressing RFP-Espin1 and various GFP-Myo3a experimental constructs. A1, Myo3aΔKΔABM WT; A2, Myo3aΔKΔABM mARB; A3, Myo3aΔKΔABM dARB. Scale bar: 5 µm. (B) Quantifications of the tip to cell body ratios of GFP-Myo3a (or its mutants) and RFP-Espin1 based on the experiments shown in panel A. (C) Quantifications of the tip to cell body ratios of GFP-Myo3b (or its mutants) and RFP-Espin1 when expressed in COS7 cells. The representative images for this group of experiments are shown in Figure 5—figure supplement 1. Values are means ± SEM and analyzed with Two-tailed Student’s t test; *p<0.05, **p<0.01, ***p<0.001.
Figure 5—figure supplement 1
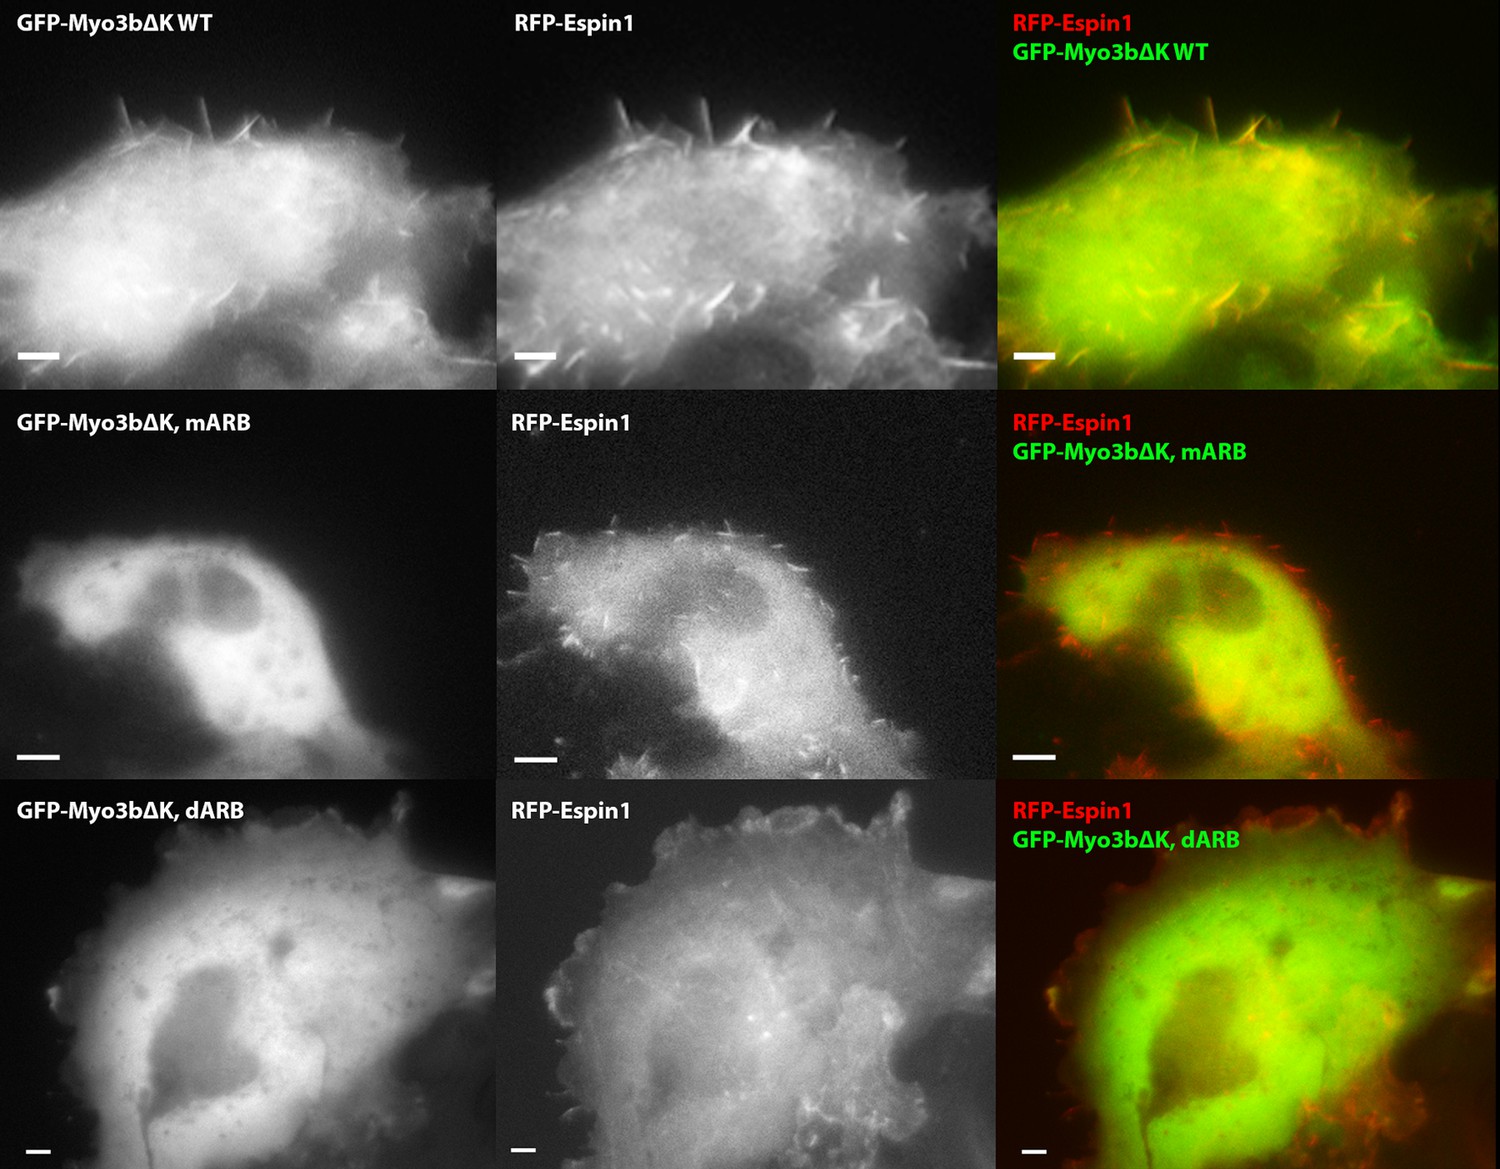
ARBs are required for both Myo3b and Espin1 filopodia tip localization.
Representative COS7 cells images of RFP-Espin1 co-transfected with different constructs of GFP-Myo3b. Row 1, Myo3bΔKΔABM WT; Row 2, Myo3bΔKΔABM mARB; Row 3, Myo3bΔKΔABM dARB. Scale bar: 5 µm.
Figure 6 with 1 supplement
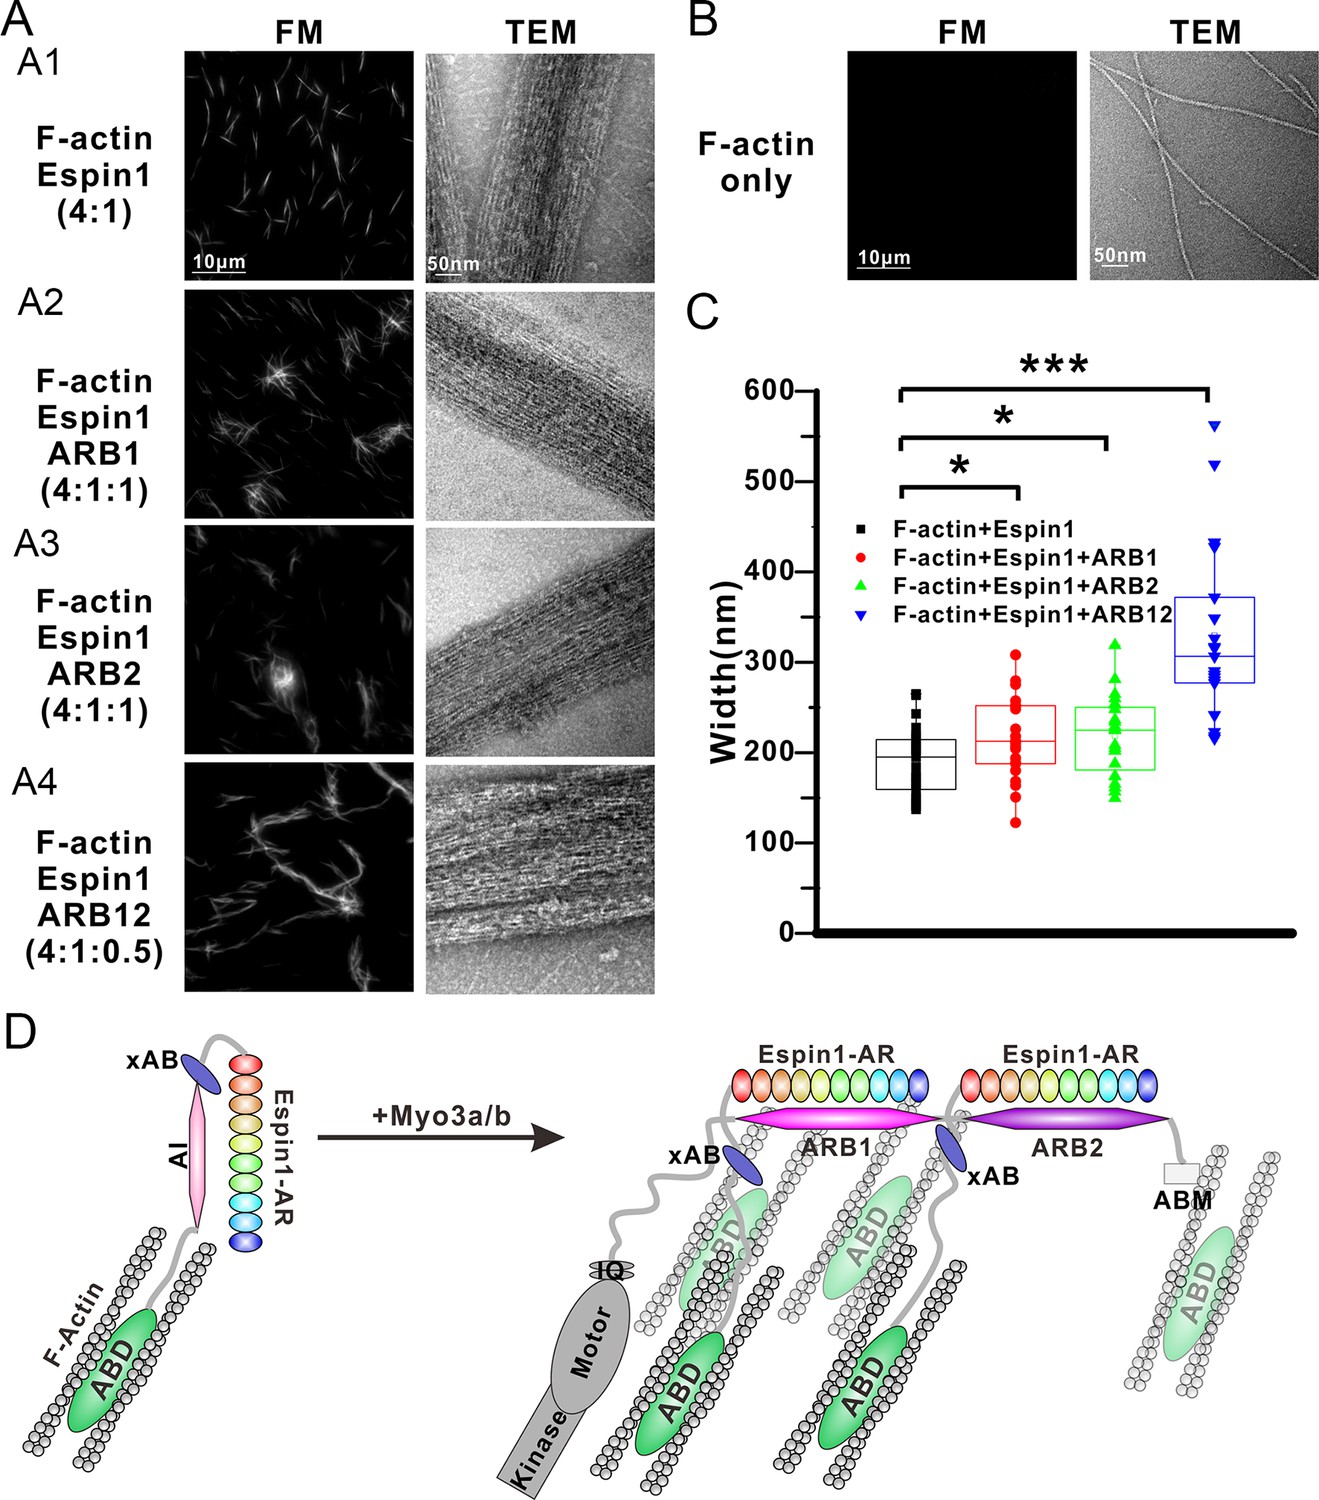
Myo3 binding promotes Espin1’s higher order actin bundling activity.
(A) Representative images of actin bundles induced by Espin1 with and without the presence of various forms of Myo3-ARBs under fluorescent microscopy (left) or transmission electron microscopy (right). A1: F-actin+Espin1 with a 4:1 molar ratio mixing; A2: F-actin+Espin1+ARB1 with a 4:1:1 molar ratio mixing; A3: F-actin+Espin1 +ARB2 with a 4:1:1 molar ratio mixing; A4: F-actin+Espin1+ARB12 with a 4:1:0.5 molar ratio mixing. The scale of each column is the same and is indicated at the top panel. (B) Representative images of F-actin only under fluorescent microscopy (left) and transmission electron microscopy (right). (C) Distribution of the width of actin bundles from the different groups of experiments. Black: F-actin+Espin1; red: F-actin+Espin1+ARB1; green: F-actin+Espin1+ARB2; blue: F-actin+Espin1+ARB12. Statistics are performed by box plot as well as Two-tailed Student’s t test. *p<0.05, **p<0.01, ***p<0.001. (D) Cartoon diagram showing Myo3 mediated higher order actin bundling by Espin1. Without Myo3, the thin actin bundles were induced by Espin1-ABD (left). With Myo3, the two ARBs can bring two Espin1 together, facilitating the formation of higher order actin bundles (right). The xAB region of this Myo3-activated Espin1 and the ABM of Myo3a may further stabilize the higher order actin bundles.
Figure 6—figure supplement 1
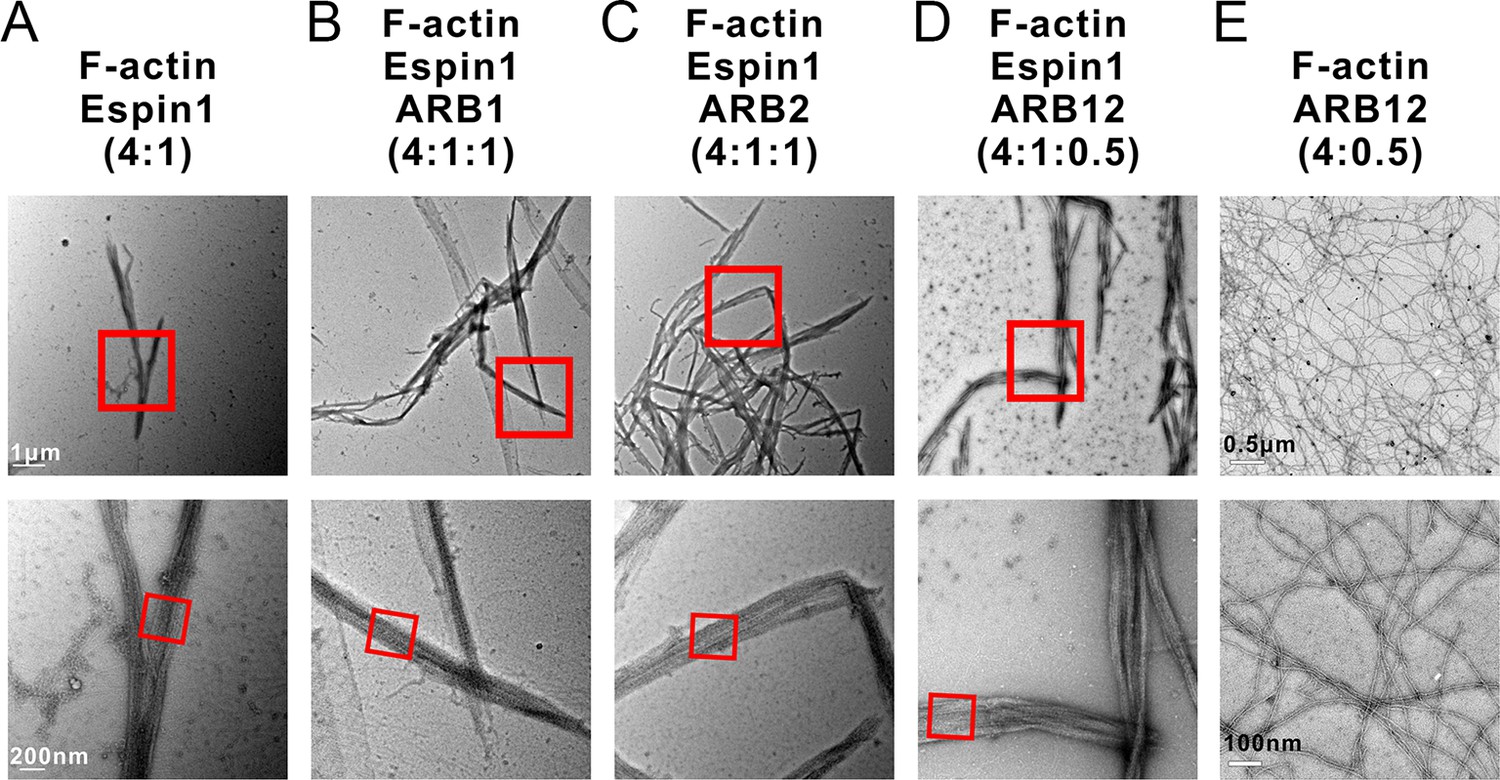
Representative TEM images of actin bundles.
(A–D) Representative images of actin bundles induced by Espin1 with and without the presence of various forms of Myo3-ARBs under transmission electron microscopy. A: F-actin+Espin1 with a 4:1 molar ratio mixing; B: F-actin+Espin1+ARB1 with a 4:1:1 molar ratio mixing; A3: F-actin+Espin1+ARB2 with a 4:1:1 molar ratio mixing; C: F-actin+Espin1+ARB12 with a 4:1:0.5 molar ratio mixing. The scale of each column is the same and is indicated at the left panel. (E) Representative images of actin bundles induced by ARB12 only with a 4:0.5 molar ratio mixing under transmission electron microscopy at different magnifications. Scale bar: 0.5 µm for the top panel and 100 nm for the bottom panel.
Author response image 1

ITC results showing that Myo3a-ARB2 binds to Espin1-1-494 with similar affinity compared to Espin1-AR.
https://doi.org/10.7554/eLife.12856.019Tables
Table 1
Statistics of X-ray Crystallographic Data Collection and Model refinement Numbers in parentheses represent the value for the highest resolution shell. a. Rmerge=Σ Ii- <I> / ΣIi, where Ii is the intensity of measured reflection and <I> is the mean intensity of all symmetry-related reflections. b. Rcryst=Σ Fcalc – Fobs /ΣFobs, where Fobs and Fcalc are observed and calculated structure factors. c. Rfree= ΣTFcalc – Fobs /ΣFobs, where T is a test data set of about 5% of the total unique reflections randomly chosen and set aside prior to refinement. d. B factors and Ramachandran plot statistics are calculated using MOLPROBITY (Chen et al., 2010). e. CC* and CC1/2 were defined by Karplus and Diederichs (Karplus and Diederichs, 2012).
Data sets | Espin1-AR/Myo3b-ARB1 5ET1 | Espin1-AR/Myo3b-ARB2 5ET0 |
|---|---|---|
Space group | P21 | P2 |
Wavelength (Å) | 0.9791 | 0.9795 |
Unit Cell Parameters (Å) | a=72.74, b=71.14, c=76.88 α=γ=90°, β=96.88° | a=39.74, b=68.78, c=173.45 α=γ=90°, β=90.04° |
Resolution range (Å) | 50-1.65 (1.68–1.65) | 50-2.30 (2.42–2.30) |
No. of unique reflections | 93433 (4625) | 39636 (5866) |
Redundancy | 3.7 (3.7) | 3.7 (3.8) |
I/σ | 18.5 (1.7) | 7.7 (1.9) |
Completeness (%) | 99.8 (99.9) | 94.9 (96.6) |
Rmergea (%) | 8.9 (91.6) | 10.3 (79.9) |
CC* for the highest resolution shell e | 0.866 | 0.878 |
CCi/2 for the highest resolution shell e | 0.599 | 0.627 |
Structure refinement | ||
Resolution (Å) | 50-1.65 (1.71–1.65) | 10-2.3 (2.38–2.30) |
Rcryst b/Rfree c (%) | 16.94/19.11 (25.77/28.64) | 22.32/25.34 (26.74/30.90) |
rmsd bonds (Å) / angles (°) | 0.006 / 0.795 | 0.010 / 1.113 |
Average B factor (Å2) d | 23.2 | 60.5 |
No. of atoms | ||
Protein atoms | 5374 | 4985 |
Water | 378 | 23 |
Ligands | 30 | 0 |
No. of reflections | ||
Working set | 89061 | 37660 |
Test set | 4345 | 1925 |
Ramachandran plot regions d | ||
Favored (%) | 98.9 | 98.4 |
Allowed (%) | 1.1 | 1.6 |
Outliers (%) | 0 | 0 |
Download links
A two-part list of links to download the article, or parts of the article, in various formats.
Downloads (link to download the article as PDF)
Open citations (links to open the citations from this article in various online reference manager services)
Cite this article (links to download the citations from this article in formats compatible with various reference manager tools)
Myosin III-mediated cross-linking and stimulation of actin bundling activity of Espin
eLife 5:e12856.
https://doi.org/10.7554/eLife.12856


