Neuronal processing of noxious thermal stimuli mediated by dendritic Ca2+ influx in Drosophila somatosensory neurons
- Kyoto University, Japan
- National Institute for Basic Biology, Japan
Figures
Figure 1 with 2 supplements
ThermoTRP-dependent responses of Class IV neurons to IR-laser irradiation.
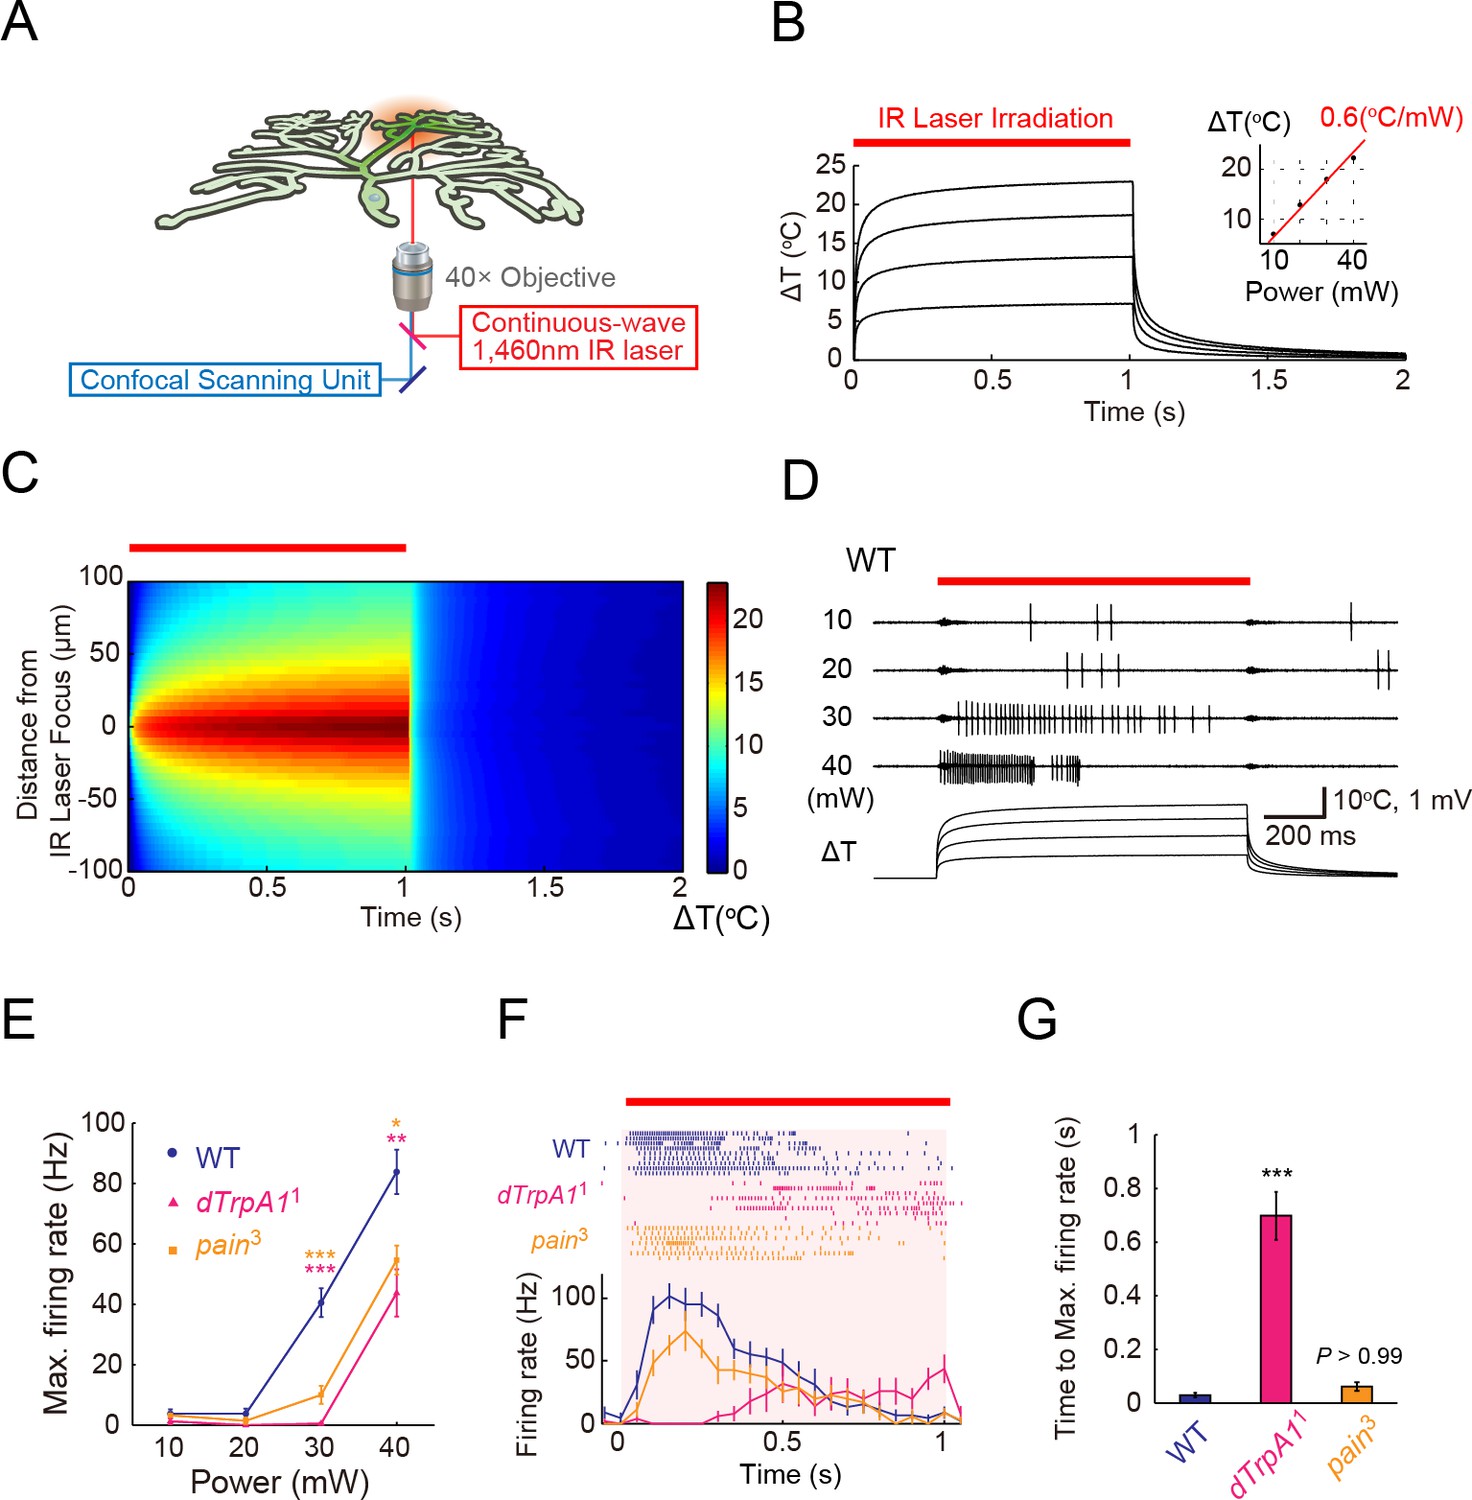
(A) A schematic diagram of the heat-stimulation system with the IR-laser irradiation. The IR-laser beam passed through an objective and targeted Class IV neurons in whole- or fillet-mounted larvae. The wavelength of IR matches the combination of symmetric and anti-symmetric OH stretching modes of water and can heat water efficiently (Palmer and Williams, 1974). We measured firing responses of the neuronal somata using an extracellular recording electrode in fillet preparations, and acquired ratiometric data of neuronal Ca2+ fluctuations in whole-mount or fillet preparations. (B and C) Temporal and spatial profiles of the IR-laser induced temperature changes of the microenvironment. A specimen was irradiated with the IR-laser beam for 1 s (orange horizontal bar) and temperature changes at the laser focus were calculated on the basis of changes of electrical resistances of a solution in a glass microelectrode (see details in Methods). (B) Traces represent temporal changes of temperature at corresponding laser powers (10, 20, 30, and 40 mW). The inset shows a plot of temperature increments at 700 ms at each power, and the red line indicates a linear fit to the data (slope = +0.6°C/mW). (C) Pseudo-color map of spatiotemporal temperature changes around the laser focus (the zero point along Y-axis) in response to 40-mW laser irradiation and subsequent shut-off. The position of the glass microelectrode was shifted along the Y-axis at 5 μm intervals to monitor temporal changes at individual locations. At right is the color scale for the temperature change. (D–G) Extracellular single-unit recordings of Class IV neurons that were irradiated at various output powers (D and E) or at 40 mW (F and G) for 1 s (orange horizontal bar in D and F). A location in the proximal dendritic arbor was targeted. (D) Spike trains and time courses of temperature changes at IR foci (bottom). (E) Power-dependent increment in the maximum firing rate (defined in 'Materials and methods') of the wild type (circle), dTrpA11 mutant (triangle), and pain3 mutant (square). (F) Raster plots of firing (top) and time course of firing rate (bottom) of the wild type and the mutants (bin size 50 ms). (G) Quantification of timing of maximum excitation ('Time to Max. Firing Rate' as defined in 'Materials and methods') of Class IV neuron of each genotype. Numbers of neurons tested were 9 (the wild type), 10 (dTrpA11), and 7 (pain3), and data are presented as mean ± s.e.m. (E–G). * p < 0.05, ** p < 0.01, *** p < 0.001 versus wild type by unpaired t-test with Bonferroni correction (E and G). IR, infrared.
-
Figure 1—source data 1
The maximum firing rate of the wild type, dTrpA11 mutant, and pain3 mutant (Columns A–F) and Quantification of timing of maximum excitation of Class IV neuron of each genotype (Columns H–J).
- https://doi.org/10.7554/eLife.12959.004
Figure 1—figure supplement 1

ThermoTRP-dependent responses of Class IV neurons to IR-laser irradiation.
(A–C) Extracellular single-unit recordings of Class IV neurons that were irradiated at 40 mW for 1 s (orange horizontal bar). A location in the proximal dendritic arbor was targeted. (A) Raster plots of firing (top) and time course of firing rate (bottom) of dTrpA1 heterozygote and pain null homozygotes (bin size 50 ms). Numbers of neurons tested were 10 (dTrpA11/ins), 8 (painpc), and 8 (painpf), and data are presented as mean ± s.e.m. dTrpA1 mutant (dTrpA11/ins compound heterozygotes) and pain mutants (painpc and painpf homozygotes) exhibited normal basal firing in the neurons (data not shown), but showed significantly lower firing rates, compared to WT, during the IR-laser irradiation (B) [painpc] 43.1 ± 6.6 Hz, n = 8 cells; [painpf] 48.1 ± 6.4 Hz, n = 8; [dTrpA11/ins] 24.3 ± 10.2 Hz, n = 10 cells). Interestingly, dTrpA11/ins mutants displayed a significantly longer latency time between the onset of the IR irradiation and the increase in firing rate when compared to the wild-type, painpc and painpf larvae (C) Time to Max. Firing Rate: [painpc] 159.8 ± 84.4 ms; [painpf] 46.6 ± 11.0 ms; [dTrpA11/ins] 632.8 ± 96.3 ms). * p < 0.05, ** p < 0.01, *** p < 0.001 versus wild type (Figure 1E–1G) by unpaired t-test with Bonferroni correction. Genotype: (painlesspc) painpc/painpc; 3×[ppk-TN-XXL] (attP2)/ 3×[ppk-TN-XXL] (attP2) (painlesspf) painpf/painpf; 3×[ppk-TN-XXL] (attP2)/ 3×[ppk-TN-XXL] (attP2) (dTrpA11/ins) +/+; 3×[ppk-TN-XXL] (attP2) dTrpA11/ dTrpA1ins
Figure 1—figure supplement 2

Assessment of effects of IR-laser irradiation on Class IV neurons.
IR laser irradiations had no apparent effect on the integrity of actin filaments (A) and the morphology of mitochondria (B) in dendritic arbors of the neurons. (A) Effects of IR-laser irradiation (42 mW, 1 s) targeting a Class IV neuron expressing Lifeact:GFP (marker for F-actins). (Left) Shown are GFP fluorescence images of dendrites before irradiation (before), in the middle of irradiation (middle), and after irradiation (after). The red dashed circle represents the focus of the IR-laser beam. (Right) The time course of the fluorescent brightness change in the region indicated by the blue rectangle in 'before.' The magenta shades and the red bar indicate timings of IR-laser irradiations. The cyan line represents the estimated photobleaching curve of GFP fluorescence. We assume that the transient decreases of fluorescence are due to heat-dependent attenuations of fluorescence during IR irradiations (Kamei et al., 2009). Note that the brightness recovered to the estimated fluorescent level after the irradiations and that no apparent gap was found in the fluorescence image. (B) Effects of IR-laser irradiation onto a soma (top) or dendrites (bottom) of a Class IV neuron expressing mito:GFP (marker for mitochondria). The red dashed circle represents the focus of the IR-laser beam (soma: 38 mW, 1 s; dendrite: 42 mW, 1 s × 3). No obvious changes in mitochondrial signals were detected. Genotype: (A) UAS-Lifeact-GFP/+; ppk-Gal4/+, (B) UAS-mito-HA-GFP/ppk-Gal4. IR, infrared.
Figure 2 with 3 supplements

L-type VGCC-dependent global Ca2+ transients occur in Class IV neurons upon noxious thermal stimulation.
Ca2+ responses of Class IV neuron ddaC expressing TN-XXL in whole-mount larvae, except for F (fillet preparations), upon IR irradiation. Throughout this figure, somata were targeted (red dotted circle in A). The output power of the laser was 38 mW except for C. Red squares above traces and magenta shadings in A, B, E, and F indicate the 1 s irradiations. (A) (Left) Time-projected image that is constructed by multiplying CFP and YFP images at every time point. Rectangles i–vii indicate the regions of interest (ROIs). (Right) Global Ca2+ transients were detected in individual ROIs (i–vii). The transient was also detected when we drew a ROI around the entire dendritic arbor excluding the soma (whole dendrite). Ca2+ transient measured in somata displayed slower fluctuation compared to the dendritic ones (soma). (B) Time courses of Ca2+ transients in whole dendrites. Gray lines indicate dendritic Ca2+ transients of 14 cells, and the blue line represents the averaged amplitude. The data from cells that did not generate Ca2+ transients were excluded. (C) Occurrence rate of dendritic Ca2+ transients when stimulated with different IR-laser output powers. We performed one trial per cell and the number of cells examined is displayed at the top of each bar. (D) Occurrence rate of dendritic Ca2+ transients was dramatically reduced in Class IV neurons overexpressing Kir2.1 (ppk-Gal4 UAS-Kir2.1) or in neurons of larvae with mutations of the L-type VGCC gene (Ca-α1DX10/AR66 and Ca-α1DX7/AR66). *** p < 0.001 versus wild type by Fisher’s exact test. (E) Ca2+ fluctuations in dendrites of Ca-α1D mutant neurons (Ca-α1DX10/AR66). Gray lines indicate Ca2+ responses of 17 cells, and the blue line represents the averaged amplitude. (F) Ca2+ fluctuations in dendrites of fillet preparations when treated with 5 μM Nimodipine. Gray lines indicate Ca2+ responses of 11 cells, and the blue line represents the averaged amplitude. In E and F, we excluded data where ratiometric signals could not be continuously recorded due to movements of mounted larvae.
-
Figure 2—source data 1
A sample file of FRET imaging.
- https://doi.org/10.7554/eLife.12959.008
Figure 2—figure supplement 1
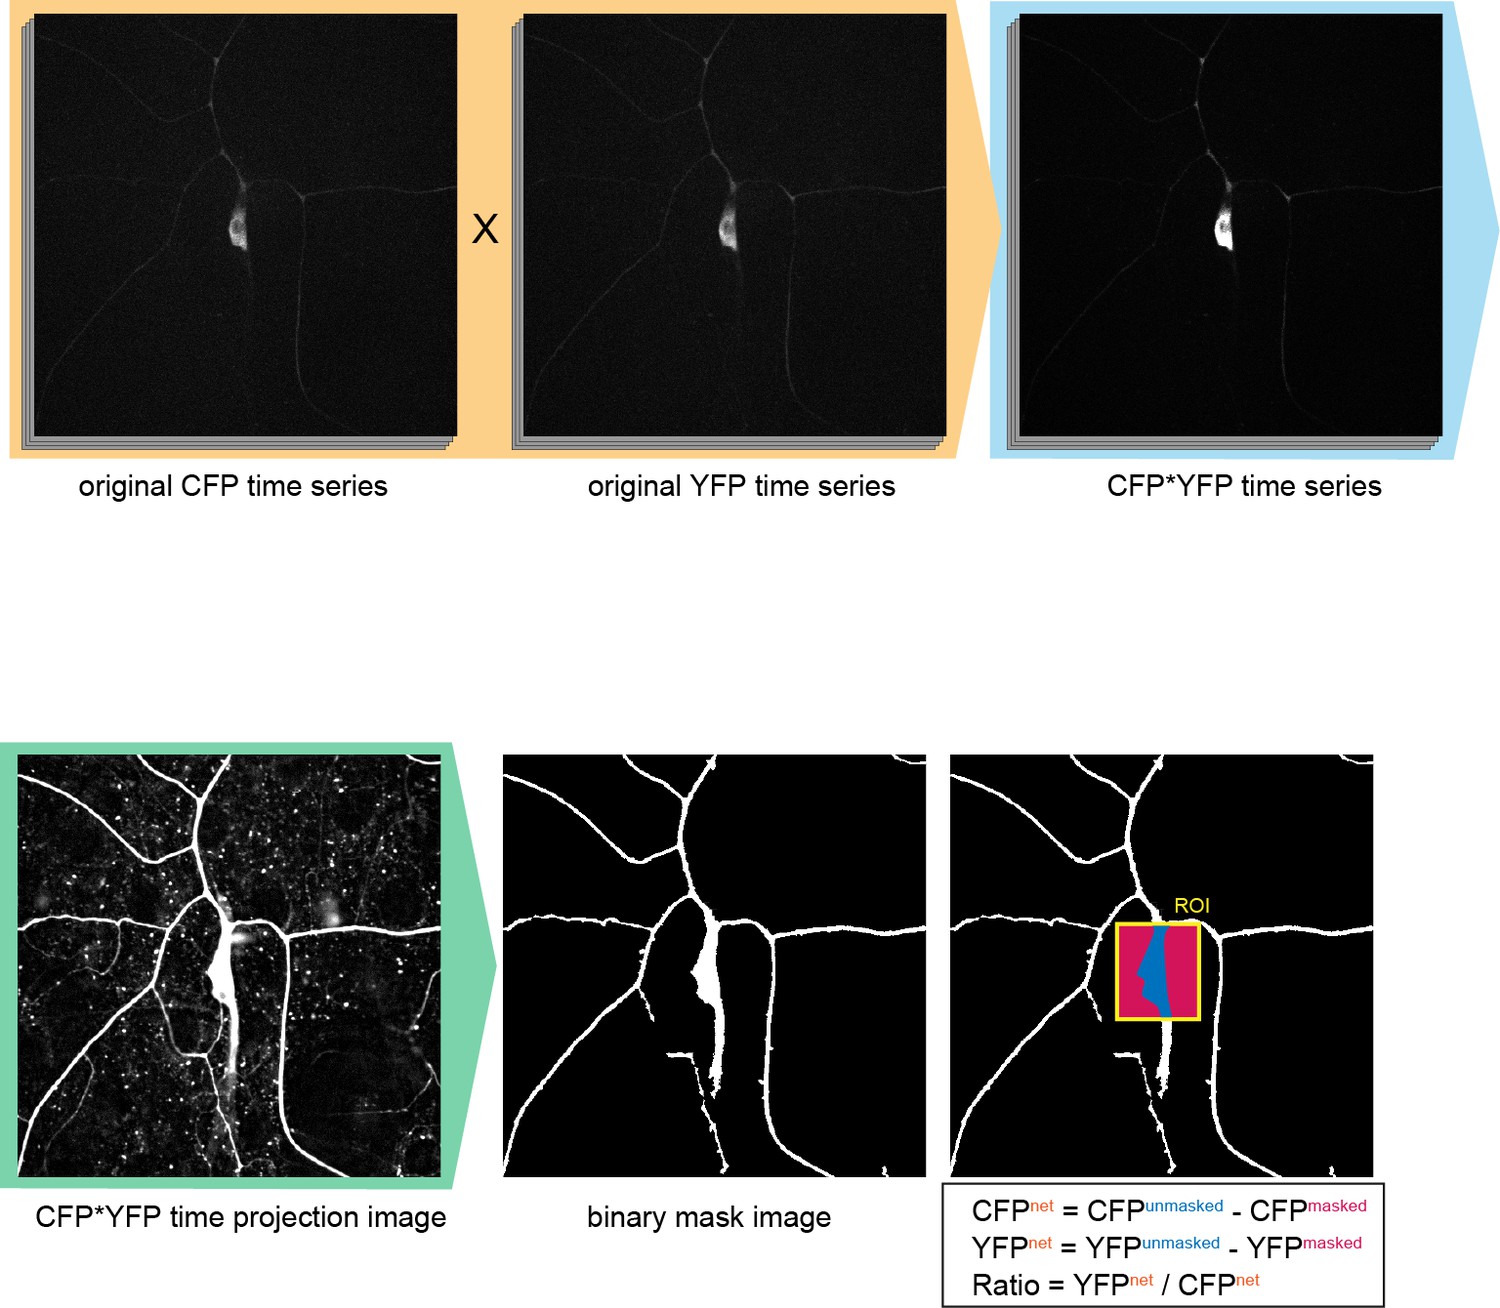
Configuration of the region-of-interest (ROI) in Ca2+ FRET imaging.
To improve the fluorescent S/N ratio, original CFP time series were multiplied by the YFP series (orange shading). Then the multiplied images (CFP*YFP time series) were projected on the time-axis (CFP*YFP time projection image). Next the backgrounds of the image were equalized and the connected components (such as dendrites) were weighted by using the 'morphology filter' (MATLAB, MathWorks), and then the image was binarized to make the 'binary mask image'. The ROIs were indicated by rectangles on the original CFP or YFP time series, and the regions of proper signals and of background noise were determined by using the 'binary mask image' within such ROIs. Genotype: 3×[ppk-TN-XXL] (attP40)/+.
Figure 2—figure supplement 2
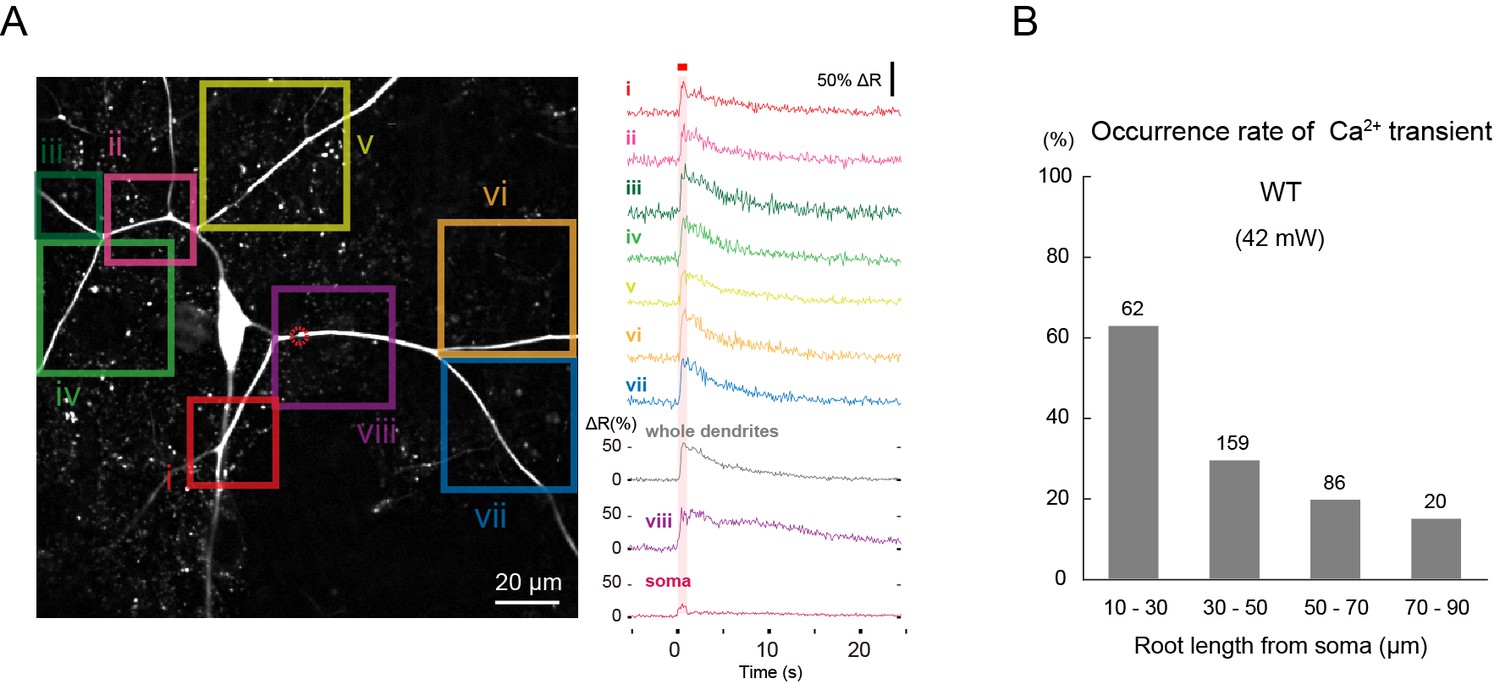
Ca2+ transients evoked by IR-laser irradiation of dendrites.
Ca2+ responses of Class IV neuron ddaC expressing TN-XXL in whole-mount larvae upon IR irradiation. Throughout this figure, dendrites were targeted (e.g. red dotted circle in A). The output power of the laser was 42 mW. (A) (Left) Time-projected image that was constructed by multiplying CFP and YFP images at every time point. Rectangles i-viii indicate the regions of interest (ROIs). (Right) Global Ca2+ transients were detected in individual ROIs (i–viii). The transient was also detected when we drew a ROI around the entire dendritic arbor and excluded the soma (whole dendrite). Ca2+ transient measured in the dendrites including the IR-laser focus (trace labeled as 'viii') displayed a slower decay compared to the other dendritic regions (i–vii). A red square above traces and a magenta shading indicate duration of 1 s irradiation. (B) Occurrence rate of dendritic Ca2+ transients when stimulated at dendrites located at different root distances from somata. We performed one trial per cell and the number of cells examined is displayed above each bar. Genotype: 3×[ppk-TN-XXL] (attP2)/+.
Figure 2—figure supplement 3

Effects of genotypes and pharmacological treatments on occurrence rates of dendritic Ca2+ transients, peak amplitudes of the transients, and/or slow Ca2+ rises in somata, when somata were irradiated.
(A) Occurrence rates of dendritic Ca2+ transients in whole-mount preparations of the wild type, dTrpA1, and painless mutants, which were evoked by IR-laser irradiations (38 mW, 1 s) onto somata. We performed one trial per cell, and the number of cells of each genotype examined are indicated above each bar. (B) Peak amplitudes in somata of individual trials are plotted. Note that Ca2+ rises in somata were slow in contrast to the sharp dendritic Ca2+ transients when somata were irradiated (cf. Figure 2A; 'soma'). The magenta dots in B indicate occurrences of dendritic Ca2+ transients; the gray dots represent those with no apparent Ca2+ transient. The peak amplitudes of these slow Ca2+ rises were significantly decreased in dTrpA1 null mutants. This result was suggestive of a contribution of a dTrpA1-mediated physiological process, although an exact mechanism underlying such slow fluctuations remains unclear. (C–E) Occurrences of dendritic Ca2+ transients in the presence of TTX or Thapsigargin treatment, which depletes the cytoplasmic Ca2+ store. We focused the IR-laser (38 mW, 1 s) onto the somata of Class IV neurons in the fillet-mounted larvae, which were pretreated with TTX and Thapsigargin (C and D, respectively). Blue traces indicate the amplitudes of Ca2+ transients of controls, whereas magenta traces indicate those with the drugs. The semitransparent traces represent amplitudes of Ca2+ transients of individual cells, and the solid traces show the average values of each group. Error bars indicate the standard deviations of the peak amplitudes of Ca2+ transients. The TTX-treatment had no effect on the occurrence and amplitude of Ca2+ transients (C), whereas the Thapsigargin-treatment only decreased the amplitude of Ca2+ transients (D). The effects of TTX was confirmed by loss of spikes. The application of TTX is indicated by a green bar above the trace (E). Fisher’s exact test (A), ANOVA and Dunnet post-hoc analysis (B), and Student’s unpaired t-test (C and D) were performed and statistical significances were assigned, *p < 0.05, **p < 0.01, ***p < 0.001. Genotype: 3×[ppk-TNXXL] (attP40)/+. To further address the contribution of Ca2+-induced Ca2+-release (CICR) from the cytoplasmic Ca2+ store to the formation of Ca2+ transients, we examined mutants for the inositol triphosphate receptor gene (Itp-r83A05616/90B.0) (Venkatesh and Hasan, 1997) or the Ryanodine receptor gene (RyRK04913/16) (Casas-Tinto et al., 2011; Gao et al., 2013). Both mutants showed Ca2+ transients with occurrence and amplitude that were not significantly different from those in the wild type (data not shown), showing that the role of CICR was negligible.
Figure 3 with 3 supplements
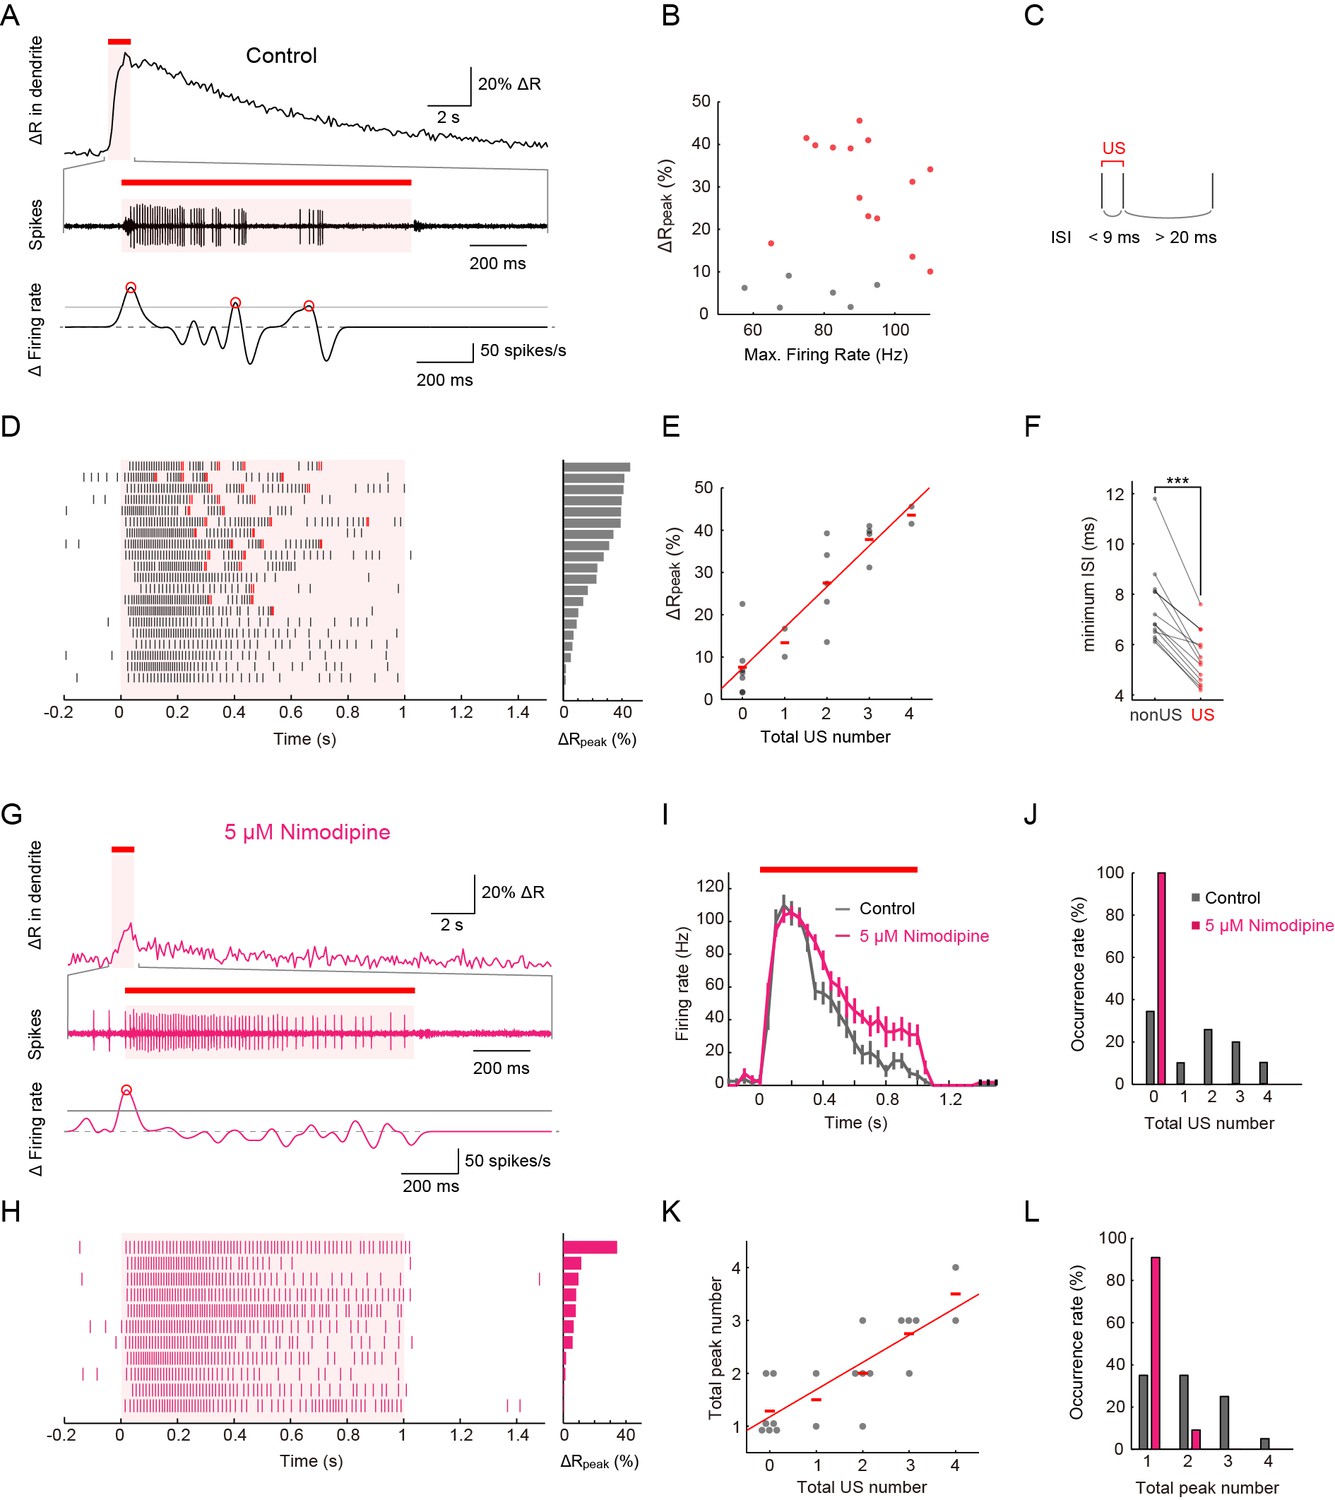
Simultaneous recordings of firing responses and dendritic Ca2+ transients in fillet preparations of larvae upon noxious thermal stimulation.
Data obtained from fillet preparations of control larvae (A–F), those from L-type VGCC-blocked larva (G and H), and their comparisons (I–L). In each trial, 40-mW IR laser was focused onto a proximal dendritic branch for 1 s (indicated by red bars above traces, and magenta shadings in (A, D, G, I and H) and the Ca2+ transient was detected from a ROI that was set on a distal branch 100 μm away from the focus of the IR-laser beam. (A and G) Representative recordings of a control larva (A) and a larva treated with 5 μM Nimodipine (G). Dendritic Ca2+ fluctuations for 20 s (top) and an enlarged trace of an extracellular recording for 1.675 s including the 1 s duration of the IR-laser irradiation (middle). The time derivative of firing rate fluctuation based on the spike density estimation with the Gaussian kernel (σ = 25 ms) and the normalized threshold settings (bottom). The peak of firing rate fluctuation is defined as in the text and marked with red circles. (B) Peak amplitudes of Ca2+ transients are plotted against maximum firing rates (defined in Materials and methods). ΔRpeak is defined as the averaged ratio of 400–700 ms after the cessation of IR-laser stimulation, which is employed as a representative value of each trial. See also the legend of D. A significant correlation was not observed (p > 0.46, ρ = 0.17; Spearman's rank correlation test; n = 20 cells). (C) The definition of 'unconventional spikes' (US). Signatures of US were extracted according to the following two conditions: (1) the first interspike interval (ISI) of three sequential spikes was less than 9 ms, and (2) the second ISI was longer than 20 ms. Then, a pair of the first and second spikes within each sorted triplet was designated as 'US'. (D and H) Raster plots of firing (left) and magnitudes of ΔRpeak (right). (D) All trials in panel (B), where control larvae were used, are sorted in a descending order of magnitude of ΔRpeak (right gray bars). Red raster lines indicate US. Six trials that elicited no US are labeled by gray color in B. (H) When fillet preparations were treated with 5 μM Nimodipine, none of the 11 trials elicited US during IR irradiation. (E) Amplitudes of ΔRpeak are plotted against total US numbers for each trial. Short horizontal red bars indicate the averages of ΔRpeak, and the red line is a linear regression of plotted data (p < 1.9 × 10⁻⁸, ρ = 0.91; Spearman’s rank correlation test; n = 20 cells). Our original definition of US in fact displayed a suboptimal correlation to the peak amplitude. We redefined USs using different parameter sets (lengths of the first and second interspike intervals) and calculated Spearman’s correlation coefficients to estimate how well the total US number is correlated with the peak amplitude. As a result, our original definition in C in fact displayed a suboptimal correlation to the peak amplitude (data not shown). (F) Comparative analysis of ISI between US and between non-US events. For trials with at least one US, the minimum length of ISI between US in each trial was compared to that between non-US (p < 5.2 × 10⁻⁶; paired t-test; n = 13 cells). (I–L) Temporal patterns of firing rates (I) and histograms of the total US number (J) or the total peak number (L) in control and Nimodipine-treated larva (gray and magenta, respectively). See also the legend of A. (K) A plot of total peak numbers versus total US numbers for each trial in the control. Data in I are presented as mean ± s.e.m.
Figure 3—figure supplement 1
Simultaneous recordings of firing responses and dendritic Ca2+ transients in fillet preparations of larvae upon noxious thermal stimulation.
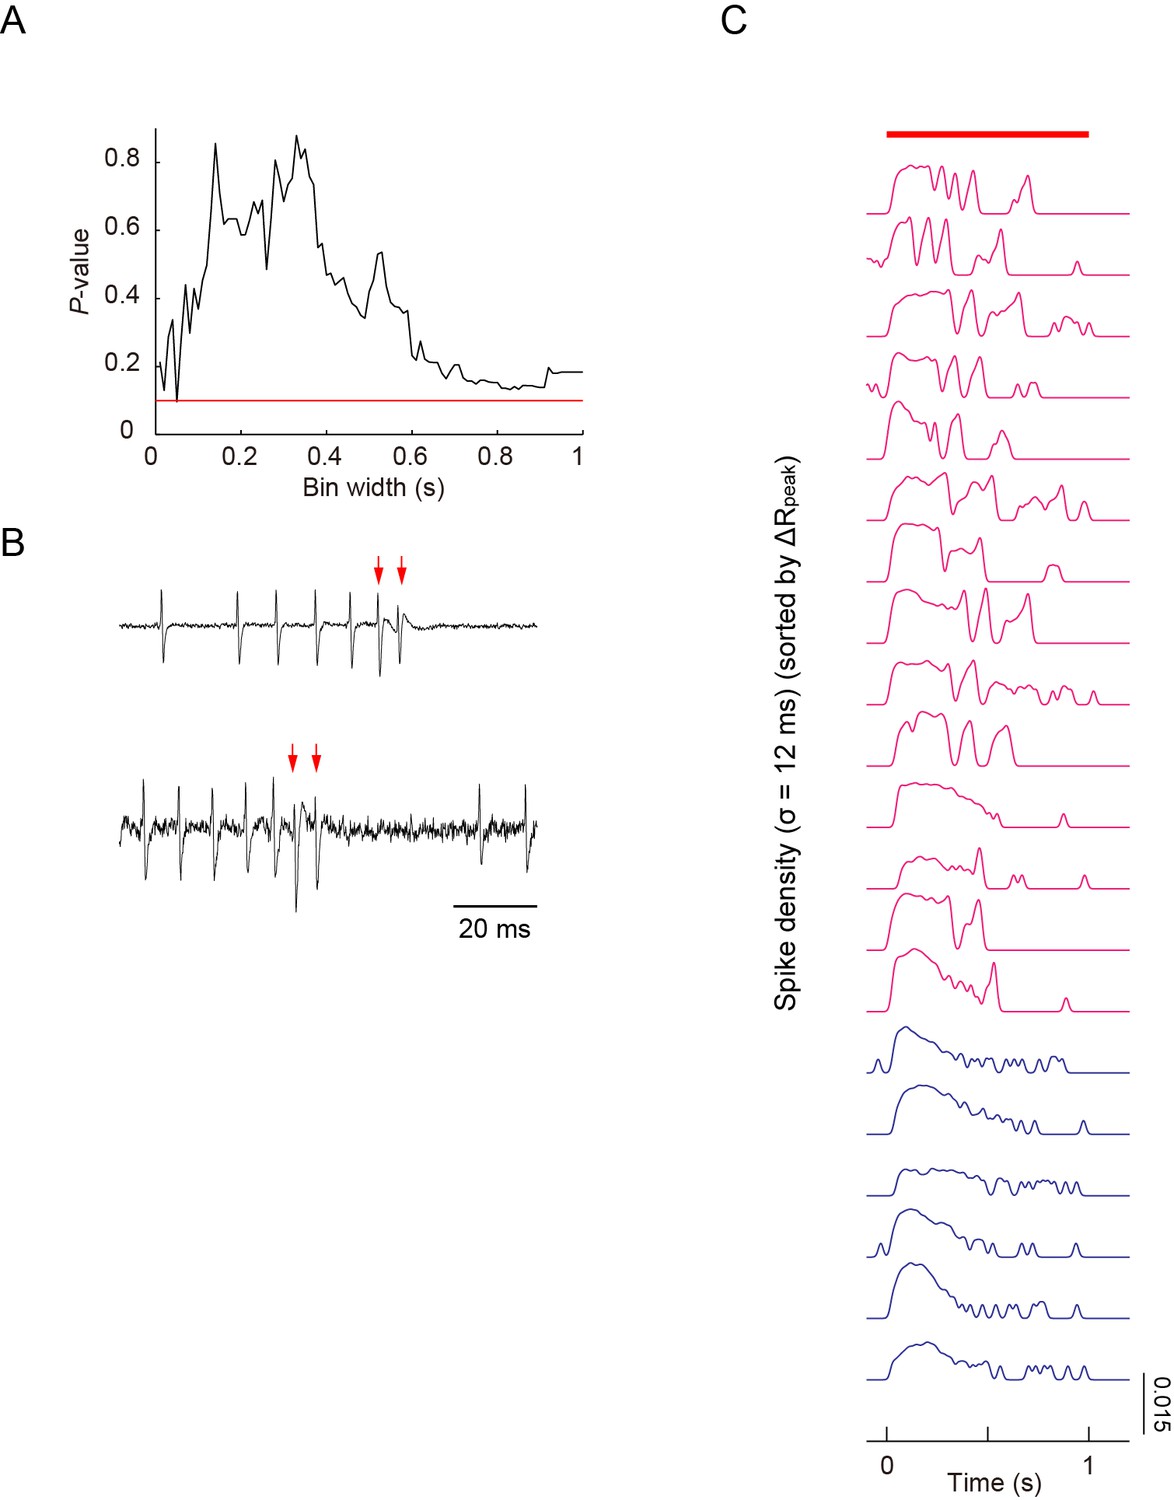
(A) As shown in Figure 3B, peak amplitudes of Ca2+ transients did not display a strong correlation with maximum firing rates, which were defined by one window size (the sliding window/∆t = 400 ms), when 40-mW IR-laser irradiation was given to proximal dendrites. We increased ∆t between 10 ms and 1000 ms in steps of 10 ms; and showed that there were no statistically significant correlations between the estimated maximum firing rates and the peak amplitudes of Ca2+ transients (Spearman rank correlation test). The red line indicates p = 0.1. (B) In two out of 20 datasets, extracellular displayed irregular waveforms representing the fluctuation of membrane conductance during the US, suggesting the presence of the excitatory currents. The red arrows indicate the spikes identified as the components of US. This low success rate of detecting the irregular waveform was possibly due to the spatially restricted membrane area of the soma where the recording electrode can detect the minute change of cellular conductance. We hypothesized that these differential patterns may encode command signals and that those signals should be transmitted to and decoded by target neuron(s) (see 'Discussion'). (C) The spike density representation of the firing patterns, which are indicated by raster plots in Figure 3D. Traces of spike densities were estimated using a Gaussian filter kernel with σ = 12 ms. All traces are sorted in descending order of magnitude of ΔRpeak. The magenta traces indicate that the amplitudes of ΔRpeak are greater than 10%; the blue traces indicate those below the threshold. The red bar above the traces represents the timing of IR-laser irradiation. Genotype: 3×[ppk-TNXXL] (attP2)/ 3×[ppk-TNXXL] (attP2).
Figure 3—figure supplement 2

Simultaneous recordings of firing responses and dendritic Ca2+ transients in fillet preparations of larvae expressing the lowest-threshold form of dTrpA1.
(A–D) Simultaneous recordings of dendritic Ca2+ transients and firing responses that were obtained from a single dTrpA1-A-expressing Class IV neuron. One second IR-laser irradiation (red bars above traces in A) was targeted to the proximal dendritic arbors, and the output power was raised from 10 to 18 mW in steps of 2 mW. (A) Dendritic Ca2+fluctuations (top) and an enlarged trace of extracellular recording for 1.4 s (from –0.2 to 1.2 s) including the duration of IR-laser irradiation (bottom). Colors represent trials at the indicated power settings (e.g. the green traces are from the same trials with 14-mW IR-laser power). The red arrows indicate the occurrences of US. The following three measurements of two neurons are plotted in (B–D): the maximum firing rates (Max. Firing Rate [Hz]; B), the peak amplitudes of ΔR (ΔRpeak [%]; C), and the number of occurrences of US (US number; D). The firing rate was almost linearly correlated to the laser power (B); on the other hand, the peak amplitude of the Ca2+ transient and the number of accompanied USs abruptly rose at power settings above 14 mW (n = 3 cells; C and D). These occurrences of both the 'burst and pause' firing pattern and the Ca2+ transient above a certain threshold in the TrpA1-A+ neurons is comparable to the responses of the wild-type neurons (compare Figure 3—figure supplement 2A with Figure 1D, and Figure 3—figure supplement 2B with Figure 1E), except for the fact that the TrpA1-A+ neuron continued to respond to the repetitive IR-laser irradiations onto the identical location within the dendritic tree. (E) Effects of Nimodipine on the firing responses of neurons ectopically expressing dTrpA1-A, tested at three different output powers. The firing responses are presented as the spike density estimation computed by using a Gaussian filter kernel (σ = 12 ms) as in Figure 3—figure supplement 1C. The peaks and troughs of the spike density fluctuations clearly show the occurrences of USs clearly in the control neurons (left, blue traces). By contrast, the traces from Nimodipine-treated neurons display much flatter transitions (right, magenta traces). The red bars above the traces and the magenta shading indicate the timings of IR-laser irradiations. Genotype: w; 3×[ppk-TNXXL] (attP40)/+; UAS-dTrpA1-A/ppk-Gal4.
Figure 3—figure supplement 3
Dual recordings of firing responses from the soma and the axon bundle.
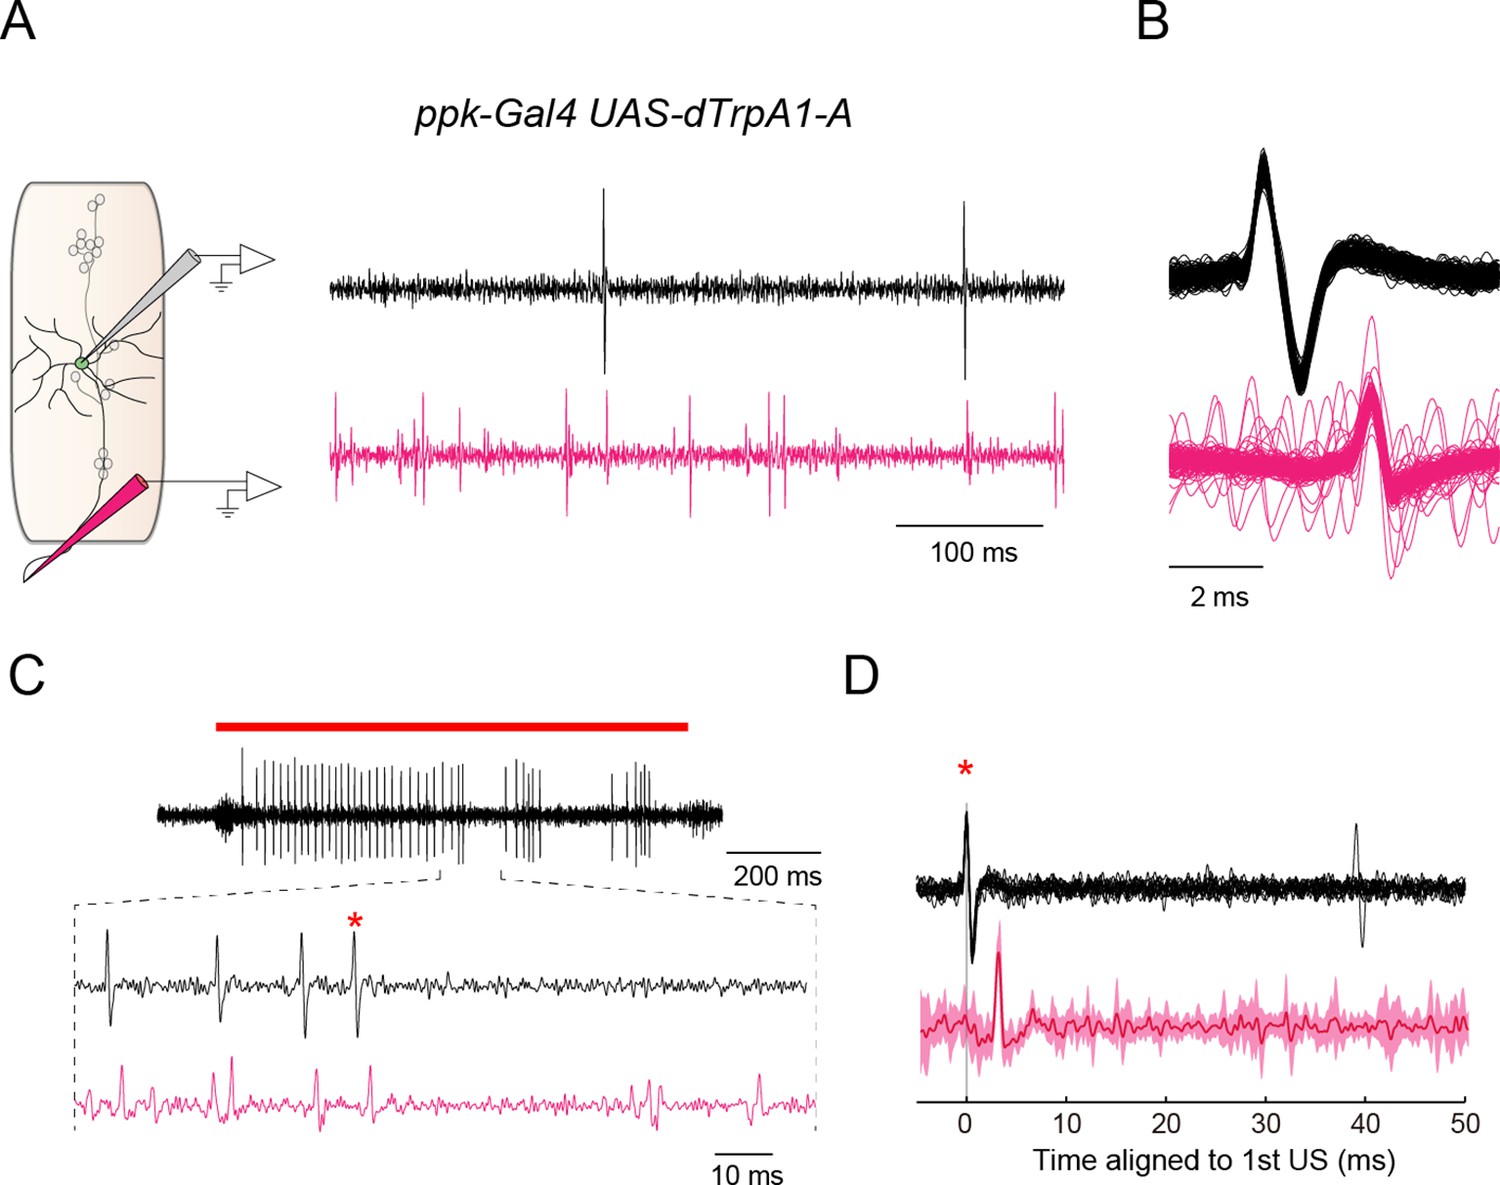
We performed dual extracellular recordings from the soma of a Class IV neuron and its axon bundle (black waveforms and magenta waveforms in (A–D), respectively). (A) (Left) A schematic diagram of a subset of sensory neurons in a larval abdominal hemisegment, and pipets for the extracellular recording from the soma of a Class IV neuron (gray electrode) and the axon bundle (magenta electrode). (Right) An example of dual recordings of spontaneous activities. The upper black trace shows the recording from a soma; the lower magenta one displays that from the axon bundle. Spikes of variable amplitudes were observed in the trace from the axon bundle, which were presumably evoked in sensory neurons other than the Class IV. Genotype throughout this figure: w; 3×[ppk-TNXXL](attP40)/+; UAS-dTrpA1-A/ppk-Gal4. (B) The superposition of multiple waveforms from the dual recordings. The traces are aligned by the peak position of somatic spikes (black). Voltage traces from individual axon bundles (magenta) always contained spikes lagging those from the somata by an invariant latency. (C) An example of firing responses dually recorded from the soma (black) and the axon bundle (magenta) upon IR-laser irradiation of the proximal dendritic arbors (18 mW, 1 s; red bar above the traces). In the extracellular recording from the soma, the red asterisk identifies the second spike of the first US (cf. Figure 3C). We focused on voltage traces right after US to see whether US from soma were followed by pauses in firing from both the soma and the axon or not. Although it was difficult to detect such coinstantaneous pauses, due to the interference of predominant spikes of sensory neurons other than Class IV, we did find several instances where firing was paused from both an axon bundle and the corresponding soma. (D) The averaged waveforms of a part of the dual extracellular recordings that include the second spike of the US in C (red asterisks in C and D). The invariant dendritic location of the same cell was irradiated repeatedly by IR-laser as in C. The recordings from the soma of the same neuron were aligned at the spikes (red asterisk), and then the averaged values were computed. (Bottom) The solid magenta line indicates the average and the magenta shading represents the standard deviations of trials (n = 14 trials). When all of the voltage traces of axon bundles were aligned relative to the peak amplitudes of the first US from somata, the mean change of the voltage traces disclosed no additional spikes behind the US for 50 ms.
Figure 4 with 1 supplement
Responses of Class IV neurons with a knockdown of Ca-α1D and behavioral analysis of the knockdown larvae upon noxious thermal stimulation.
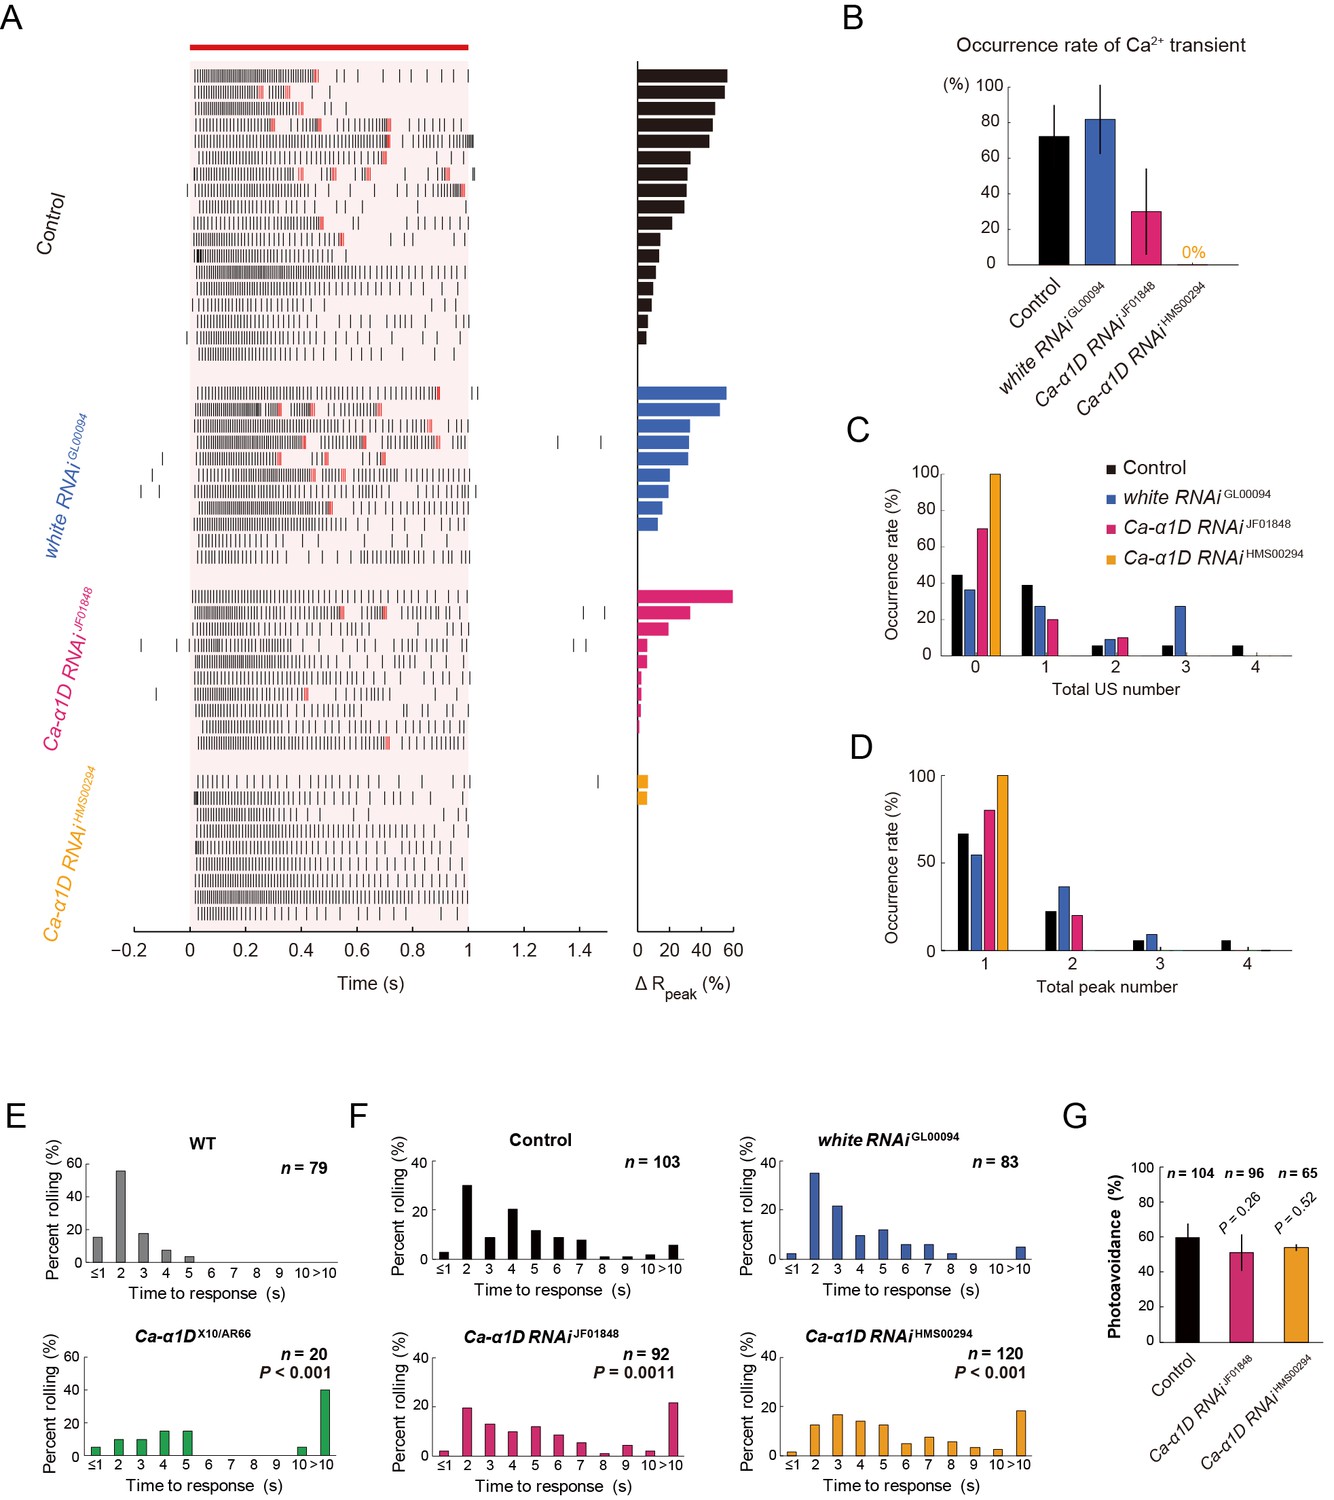
(A–D) Responses of control Class IV neurons (Control, n = 18 and white RNAi GL00094, n = 11) and Ca-α1D knockdown neurons (Ca-α1D RNAi JF01848, n = 10 and Ca-α1D RNAi HMS00294, n = 9) to 1 s irradiation of a 48-mW IR laser. (A) Raster plots of firing (left) and magnitudes of ΔRpeak corresponding to Ca2+ transients (right). Trials are sorted in a descending order of the magnitude of ΔRpeak (right bars). Red bar indicates the 1 s irradiation and red raster lines are US. (B) Occurrence rate of dendritic Ca2+ transients in each genotype([Control] 72.2 ± 17.6%, [white RNAi GL00094] 81.8 ± 19.4%, [Ca-α1D RNAi JF01848] 30.0 ± 24.2%, [Ca-α1D RNAi HMS00294] 0.0 ± 0.0%; mean ± 95% confidence interval [Clopper-Pearson method]). (C and D) Histograms of the total US number (C) or the total peak number (D) during the irradiation in the control and the knockdown neurons. The total peak number of firing rate fluctuation is defined as in the text. See also Figure 3A and its legend. (E and F) The distribution of nocifensive escape locomotion latency for wandering third-instar larvae of the wild type and the Ca-α1D mutant that were stimulated with a 47°C probe. The numbers of larvae tested are indicated and data are presented as percentage. (E) The distributions of the wild-type and Ca-α1D mutant larvae (mean latency: [w1118] 1.78 s, [Ca-α1D AR66/X10] 6.12 s; Wilcoxon rank-sum test). (F) The distributions of control larvae and larvae with Class IV neuron-specific white or Ca-α1D knockdown. The Ca-α1D mutant and the Ca-α1D knockdown larvae showed significant delayed nocifensive responses in comparison to the wild type (E) and the controls (Control and white RNAi GL00094) (F), respectively. p values in F are those of the test between white RNAi GL00094 and each of the Ca-α1D knockdowns (mean latency: [Control] 3.87 s, [white RNAi GL00094] 3.39 s, [Ca-α1D RNAi JF01848] 5.21 s, [Ca-α1D RNAi HMS00294] 5.25 s; Wilcoxon rank-sum test with Bonferroni correction). (G) Percentage of larvae avoiding blue light (457–487 nm; 0.72 mW/mm2; [Control] 59.6 ± 8.0%, [Ca-α1D RNAi JF01848] 53.9 ± 10.3%, [Ca-α1D RNAi HMS00294] 51.0 ± 8.5%; mean ± 95% confidence interval [Clopper-Pearson method]). We employed GMR-hid to ablate Bolwig’s organs in the photo-avoidance assay. p values are indicated (two-tailed Fisher’s exact test). Sixty-five to 104 larvae were tested for each condition.
-
Figure 4—source data 1
The distributions of nocifensive escape locomotion latency for wandering third-instar larvae of the wild-type and Ca-α1D mutant larvae (Columns A, B) and The distributions of control larvae and larvae with Class IV neuron-specific white or Ca-α1D knockdown (Column D–G).
- https://doi.org/10.7554/eLife.12959.019
Figure 4—figure supplement 1

Simultaneous recordings of firing responses and dendritic Ca2+ transients in fillet preparations of Ca-α1D knockdown larvae upon noxious thermal stimulation.
(A and B) Responses of control Class IV neurons (Control and white RNAi GL00094) and Ca-α1D knockdown neurons (Ca-α1D RNAi JF01848 and Ca-α1D RNAi HMS00294) to 1 s irradiation of a 48-mW IR laser. (A) Time courses of firing rates of the wild type and the Ca-α1D knockdown larvae upon noxious thermal stimulations. (B) The max. firing rate (defined in Methods) of the Control, white RNAi GL00094, Ca-α1D RNAi JF01848, and Ca-α1D RNAi HMS00294 showed normal firing rates during the IR-laser irradiation ([Control] 96.2 ± 5.1 Hz, n = 18 cells; [white RNAi GL00094] 100.0 ± 8.4 Hz, n = 11 cells; [Ca-α1D RNAi JF01848] 85.5 ± 4.1 Hz, n = 10; [Ca-α1D RNAi HMS00294] 82.5 ± 7.7 Hz, n = 9). (C) Quantification of timing of maximum excitation ('Time to Max. Firing Rate' as defined in Methods) of Class IV neuron of each genotype. (Time to Max. Firing Rate: [Control] 47.5 ± 16.8 ms, [white RNAi GL00094] 37.8 ± 11.9 ms; [Ca-α1D RNAi JF01848] 21.1 ± 3.3 ms; [Ca-α1D RNAi HMS00294] 23.5 ± 1.6 ms). Data are presented as mean ± s.e.m (A–C). No statistically significant difference was observed between the Ca-α1D RNAi neurons and wild type or white RNAi GL00094 by unpaired t-test with Bonferroni correction (B and C). Genotypes: (Control) w1118/+; ppk-Gal4/+; 3×[ppk-TNXXL] (attP2)/+ (white RNAi GL00094) ppk-Gal4/+; 3×[ppk-TN-XXL] (attP2)/UAS-white RNAi GL00094 (Ca-α1D RNAi JF01848) ppk-Gal4/+; 3×[ppk-TNXXL] (attP2)/UAS-Ca-α1D RNAiJF01848 (Ca-α1DRNAi HMS00294) ppk-Gal4/+; 3×[ppk-TNXXL] (attP2)/UAS-Ca-α1DRNAiHMS00294
Figure 5
Optogenetic activation of Class IV neurons.
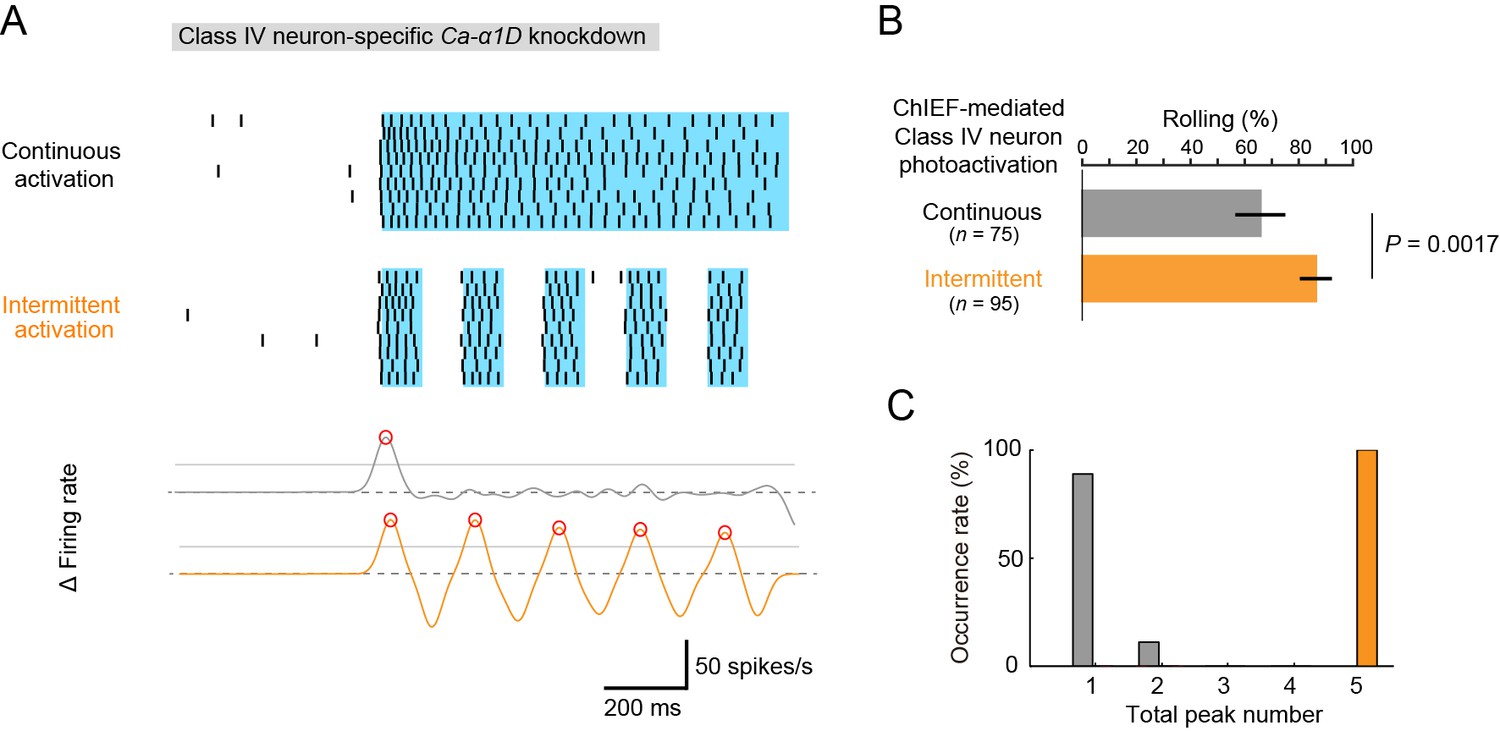
(A) Data obtained from fillet preparations of larvae where Ca-α1D gene was knocked down specifically in Class IV neurons. (Top) Raster plots of firing. A faster kinetic variant of ChR2, ChIEF, was expressed selectively in the neurons and activated with a blue LED continuously ('Continuous activation'; n = 9) or in a pulsatile fashion ('Intermittent activation'; n = 9). (Bottom) The time derivative of firing rates under the continuous activation (gray) or intermittent activation (orange). The peak of firing rate fluctuation is defined as in the text and marked with red circles. (B) Percentage of larvae rolling their bodies upon optogenetic activation ([Continuous] 65.9 ± 11.5%, n = 75; [Intermittent] 88.5 ± 7.6%, n = 95; mean ± 95% confidence interval [Clopper-Pearson method]). p-Value is indicated (two-tailed Fisher’s exact test). (C) A histogram of the total peak number during the continuous activation (gray) or intermittent activation (orange).
Figure 6 with 1 supplement
Firing responses of Class IV neurons upon illumination with blue light.
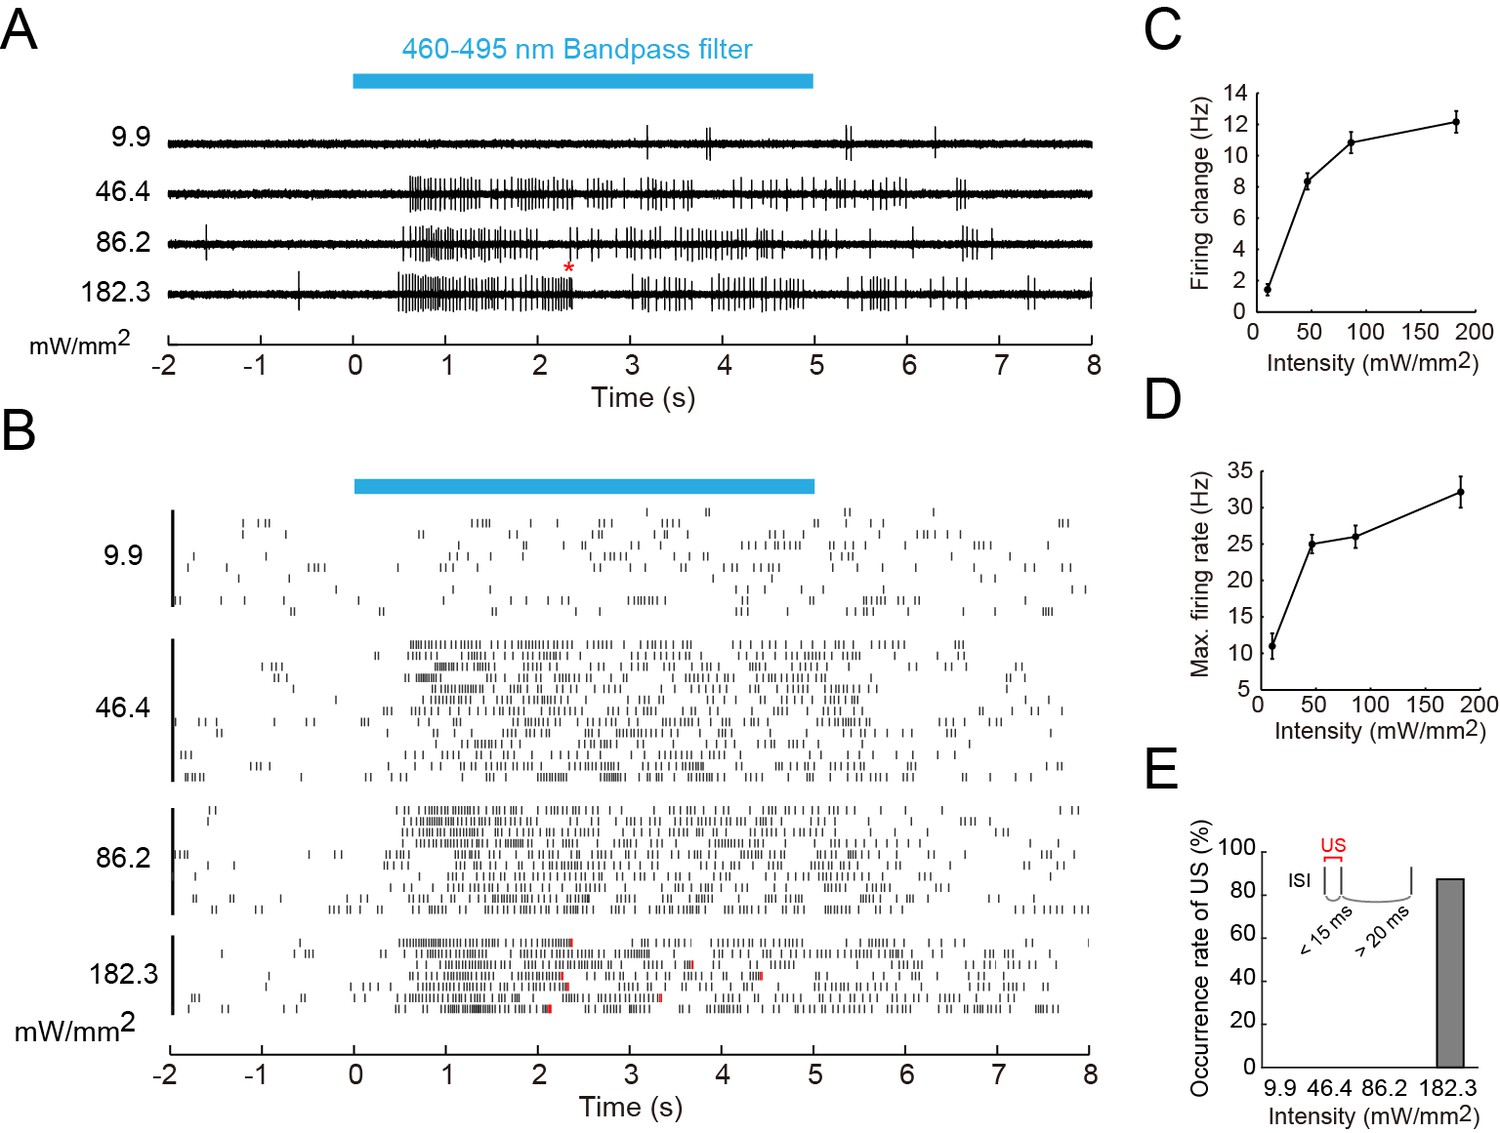
Extracellular single-unit recordings of blue light (460–495 nm)-stimulated Class IV neurons in fillet-mounted larvae. (A) The blue bar above the traces indicates the 5 s duration of blue light illumination. Power densities of illumination are indicated on the left sides of individual traces (9.9–182.3 mW/mm2). The red asterisk indicates a redefined unconventional spike (see US in the inset of E and the definition below). (B) Raster plots of firing with various power densities of illumination (n = 7~13). Red tick marks in the responses to 182.3 mW/mm2 indicate redefined US (see also D). (C) Firing frequency changes (average frequency of 5 s before blue light exposure subtracted from average frequency during 5 s of blue light exposure [Xiang et al., 2010]) are plotted against power density. (D) Maximum firing rates are plotted against intensity of blue light. Data are presented as mean ± s.e.m. (E) Occurrences of redefined US upon blue light illumination. US is redefined as follows: (1) the first interspike interval (ISI) of three sequential spikes is less than 15 ms, and (2) the second ISI is longer than 20 ms. Then, a pair of the first and second spikes within each sorted triplet is designated as 'redefined US' (inset).
Figure 6—figure supplement 1

A model of the information processing: The polymodal encoding of thermo- and photo-nociception and decoding.
(Top) The nociceptive receptors in Class IV neurons. Painless and dTrpA1 channels generate cation influx upon noxious heat stimuli in a synergistic manner (orange box), whereas Gr28b and dTrpA1 mediate the formation of receptor potential upon noxious light exposure (blue box). (Bottom) A model of sensory transduction of thermal and optical nociception in Class IV neurons. Thermal stimuli induce the relatively larger generator currents (orange line); in contrast, noxious light inputs evoke the smaller currents (blue line). L-type VGCC has a relatively high threshold of activation (green line). When the input exceeds the threshold, the neuron evokes the 'burst and pause' firing pattern.
Videos
Video 1
Dendritic Ca2+ transients (1).
Related to Figure 2. Ratiometric pseudocolor time-lapse images of TN-XXL-expressing Class IV neuron ddaC in a whole-mount preparation of a larva. The time course is indicated in the upper left corner of each image, and the duration of IR irradiation (1 s at 38 mW) is displayed by red squares in upper right corner of relevant images. Genotype: 3×[ppk-TN-XXL] (attP2)/ 3×[ppk-TN-XXL] (attP2).
Video 2
Dendritic Ca2+ transients (2).
Related to Figure 2. Intensiometric unicolor time-lapse images of GCaMP5G-expressing Class IV neuron ddaC in a whole-mount preparation of a larva. The time course is indicated in the upper left corner of each image, and the duration of IR irradiation (1 s at 38 mW) is displayed by red squares in upper right corner of relevant images. Genotype: UAS-GCaMP5G/+; ppk-Gal4/+.
Additional files
-
Source code 1
The code to select regions of interest (ROIs), measure the intensities of both CFP and YFP in each ROI, and compute the FRET ratios.
- https://doi.org/10.7554/eLife.12959.024
-
Source code 2
The code to manipulate the timings of LED illumination and the imaging in the optogenetics behavioral assay.
- https://doi.org/10.7554/eLife.12959.025
Download links
A two-part list of links to download the article, or parts of the article, in various formats.
Downloads (link to download the article as PDF)
Open citations (links to open the citations from this article in various online reference manager services)
Cite this article (links to download the citations from this article in formats compatible with various reference manager tools)
Neuronal processing of noxious thermal stimuli mediated by dendritic Ca2+ influx in Drosophila somatosensory neurons
eLife 5:e12959.
https://doi.org/10.7554/eLife.12959


