Eighteenth century Yersinia pestis genomes reveal the long-term persistence of an historical plague focus
- University of Tübingen, Germany
- Max Planck Institute for the Science of Human History, Germany
- Northern Arizona University, United States
- McMaster University, Canada
- The University of Sydney, Australia
- Université Bordeaux, France
Figures
Figure 1
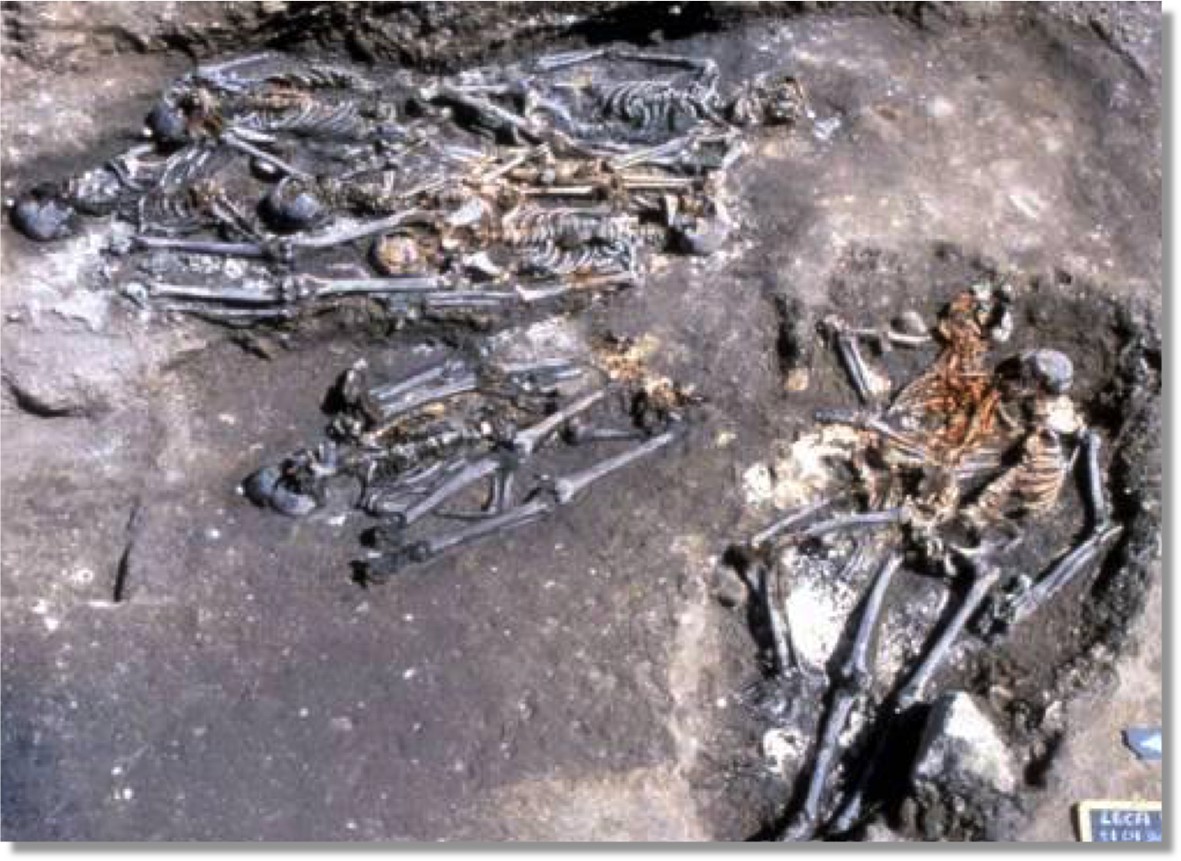
Photograph of rescue excavations at l’Observance in Marseille, France.
LAPMO Université de Provence – URA 164 CNRS/AFAN.
Figure 2
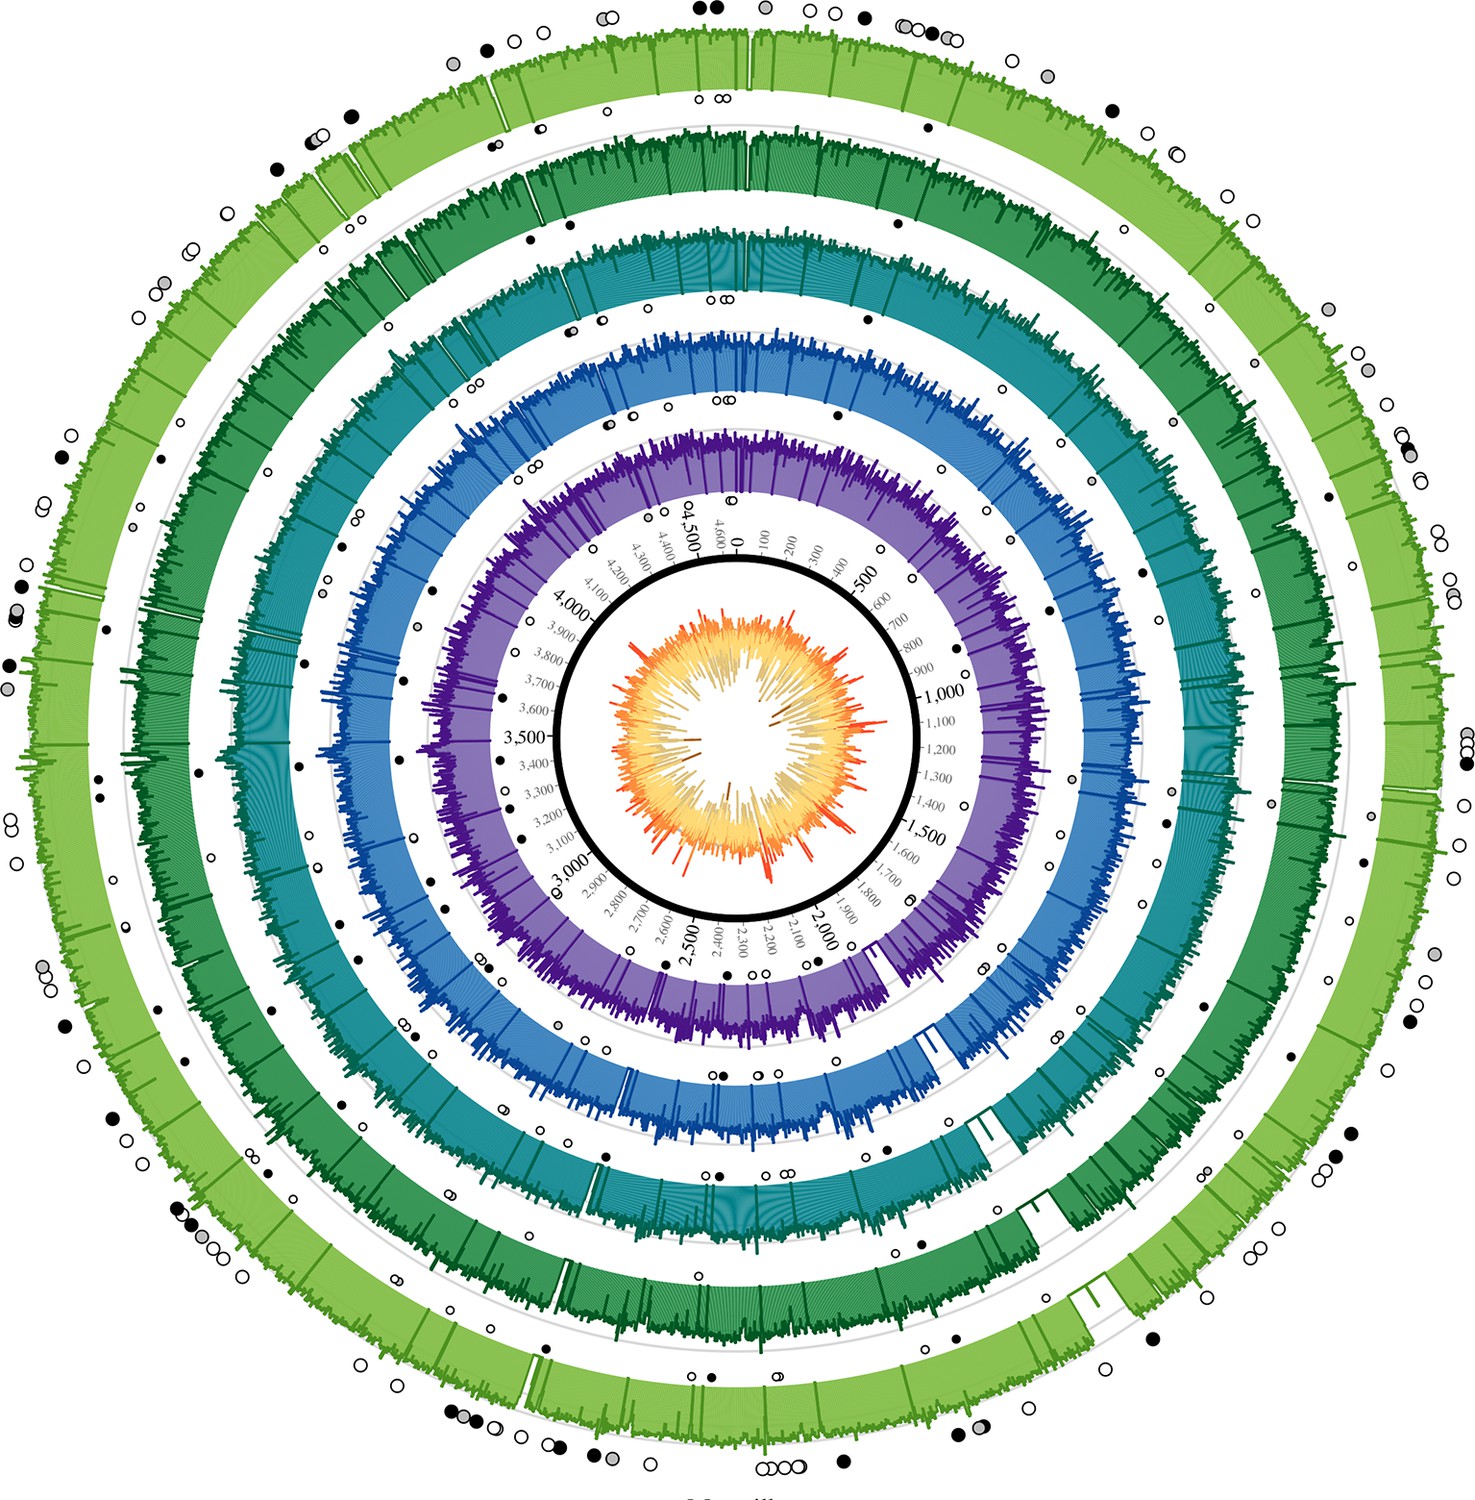
Coverage plots for all reconstructed Observance core genomes.
Inner ring: GC content from low (brown, <30%) to high (orange, >55%). Outer concentric rings: from inner to outer, coverage plots of OBS107, 110, 116, 124, and 137 on a logarithmic scale. Axes are at 30x and 100x. Dots: SNPs (black = non-synonymous, grey = synonymous, white = intergenic). Outer ring (larger dots) is SNPs shared by all five strains. Inner rings (smaller dots) are associated with the strain immediately outside and are SNPs that are not shared by all five strains (but may be shared by 2–4 strains). Krzywinski, M. et al. Circos: an Information Aesthetic for Comparative Genomics. Genome Res (2009) 19:1639–1645
Figure 3
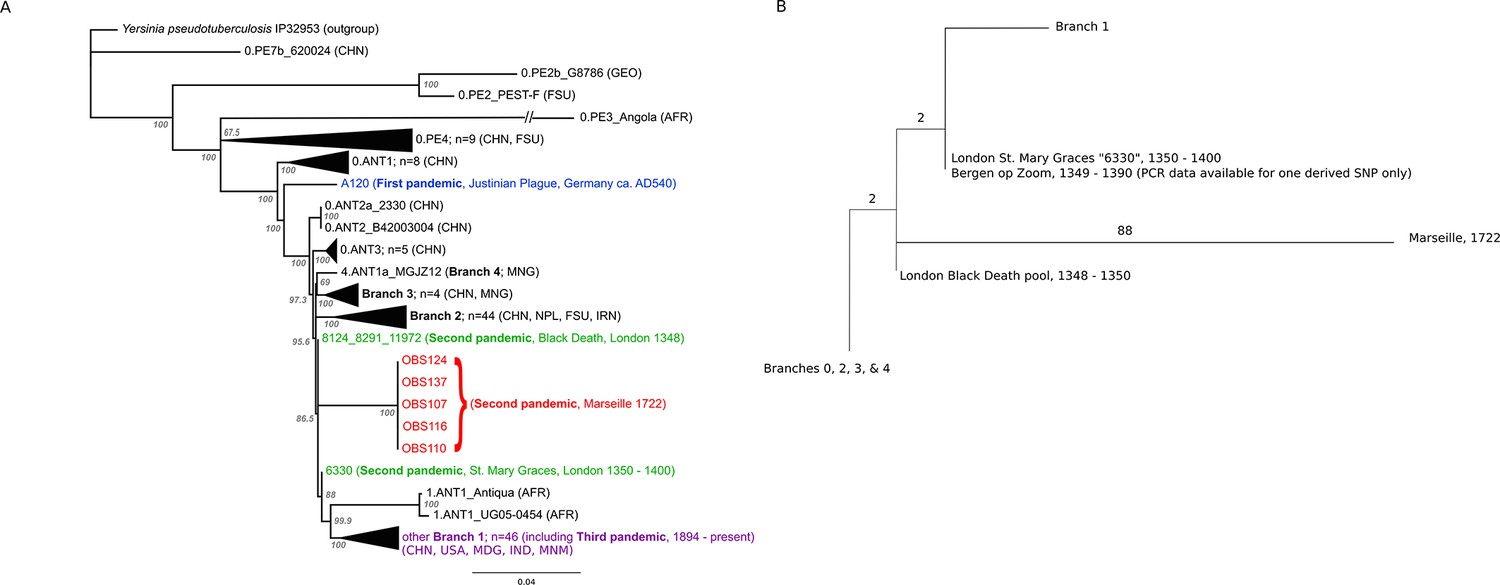
Phylogenetic tree for Yersinia pestis.
(A) Maximum likelihood phylogeny of Y. pestis genomic SNPs showing the position of the Observance (OBS) lineage (red) relative to those of 130 modern (black) and three ancient strains (Black Death in green and Justinian Plague in blue). Modern strains from the third pandemic are shown in purple to highlight their close genetic relatedness. Monophyletic groups of sequences have been collapsed to improve clarity and are shown as triangles. The tree is rooted using single strain of Y. pseudotuberculosis (IP32953), with all derived SNPs removed to assist scaling, with branch lengths reflecting the number of nucleotide substitutions/SNP site. The length of the branch leading to the 0.PE3_Angola (AFR) lineage was reduced because its excessive length adversely affected the scaling of the tree. Location abbreviations are as follows: CNH (China), GEO (Georgia), FSU (Former Soviet Union), MNG (Mongolia), NPL (Nepal), IRN (Iran), AFR (Africa), USA (United States of America), MDG (Madagascar), IND (India). (B) Expanded phylogeny schematic to show the relative positions of the Black Death and the Observance lineages. Numbers on branches correspond to SNPs.
Tables
Table 1
Quantitative PCR data for the pla gene obtained for the 19 Observance teeth extracted. Values below std curve detection are highlighted in grey.
| PCR Blks: | Copies per μl |
|---|---|
| PCR Blk 1 | 0 |
| PCR Blk 2 | 0 |
| PCR Blk 3 | 0 |
| PCR Blk 4 | 0 |
| Extraction Blks: | Copies per μl |
| BLk 1 | 0 |
| Blk 2 | 0 |
| Blk 3 | 0 |
| Blk 4 | 0 |
| Extracts: | |
| Sample | Copies per μl |
| 101a | 0 |
| 101b | 0 |
| 102 | 0 |
| 103 | 0 |
| 107 | 39 |
| 108 | 0 |
| 109 | 0 |
| 110 | 50 |
| 116 | 105 |
| 117a | 0 |
| 117b | 1 |
| 118 | 0 |
| 123 | 0 |
| 124 | 142 |
| 125 | 0 |
| 126 | 0 |
| 130 | 0 |
| 134 | 1 |
| 137 | 30 |
| 144 | 0 |
Table 2
Mapping statistics.
| Sample ID | Raw read pairs | Preprocessed reads | Mapped reads | % mapped | Dedupped | Duplication factor | Fold coverage | % covered |
|---|---|---|---|---|---|---|---|---|
| OBS107 | 14,646,710 | 15,395,287 | 1,850,734 | 12.02% | 851,096 | 2.17 | 12.20 | 84.79 |
| OBS110 | 9,879,257 | 10,458,571 | 1,581,158 | 15.12% | 855,988 | 1.85 | 14.61 | 90.63 |
| OBS116 | 16,858,273 | 17,876,883 | 2,931,554 | 16.40% | 1,363,415 | 2.15 | 20.04 | 92.56 |
| OBS124 | 48,797,602 | 52,345,884 | 4,972,347 | 9.50% | 973,763 | 5.11 | 13.34 | 85.37 |
| OBS137 | 120,018,142 | 129,095,434 | 12,669,625 | 9.81% | 1,583,596 | 8.00 | 24.40 | 92.76 |
Additional files
-
Supplementary file 1
Combined SNP table from three SNP calling approaches.
- https://doi.org/10.7554/eLife.12994.008
-
Supplementary file 2
List of genomes used in SNP calling and phylogeny.
- https://doi.org/10.7554/eLife.12994.009
Download links
A two-part list of links to download the article, or parts of the article, in various formats.
Downloads (link to download the article as PDF)
Open citations (links to open the citations from this article in various online reference manager services)
Cite this article (links to download the citations from this article in formats compatible with various reference manager tools)
Eighteenth century Yersinia pestis genomes reveal the long-term persistence of an historical plague focus
eLife 5:e12994.
https://doi.org/10.7554/eLife.12994


