Atomic structure of the 26S proteasome lid reveals the mechanism of deubiquitinase inhibition
- The Scripps Research Institute, United States
- University of California, Berkeley, United States
- Howard Hughes Medical Institute, University of California, Berkeley, United States
Figures
Figure 1 with 7 supplements
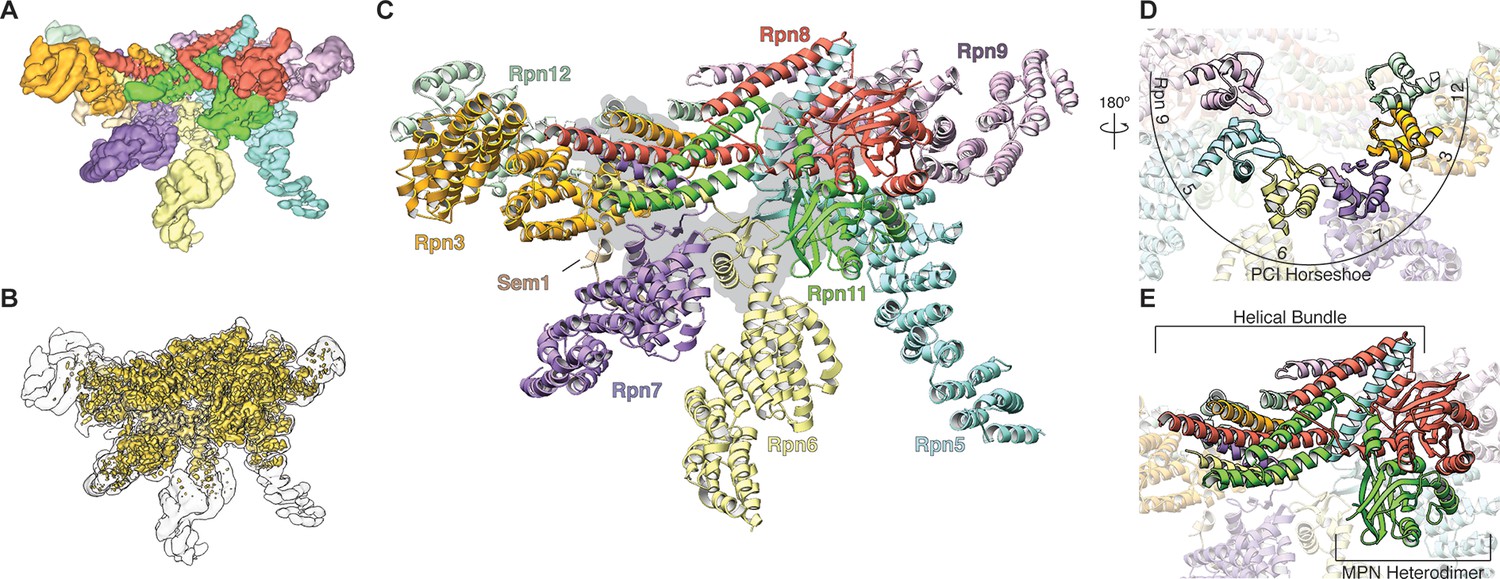
Architecture of the isolated proteasome lid sub-complex.
(A) The segmented 3.5 Å resolution cryo-EM density is shown at a low isocontour level, with each subunit colored differently. Rpn3 is shown in orange, Rpn5 in light blue, Rpn6 in yellow, Rpn7 in purple, Rpn8 in red, Rpn9 in magenta, Rpn11 in green, Rpn12 in light green, and Sem1 in tan. This coloring scheme is maintained throughout all figures. (B) The unsegmented cryoEM density is shown at a higher isocontour level (in gold) to demonstrate the molecular details observable in the reconstruction (~3Å in certain regions). The lower isocontour level used for the segmented map is overlaid as a silhouette. (C) The atomic model of the proteasome lid is depicted using a ribbon representation, with each subunit colored according to the segmentation shown in A. The central location of the six PCI domains is illustrated by a gray shadow underneath the structure. (D) The PCI domains form a horseshoe, held together by an 18-stranded β-sheet. (E) Close-up of the helical bundle and the MPN heterodimer.
Figure 1—figure supplement 1
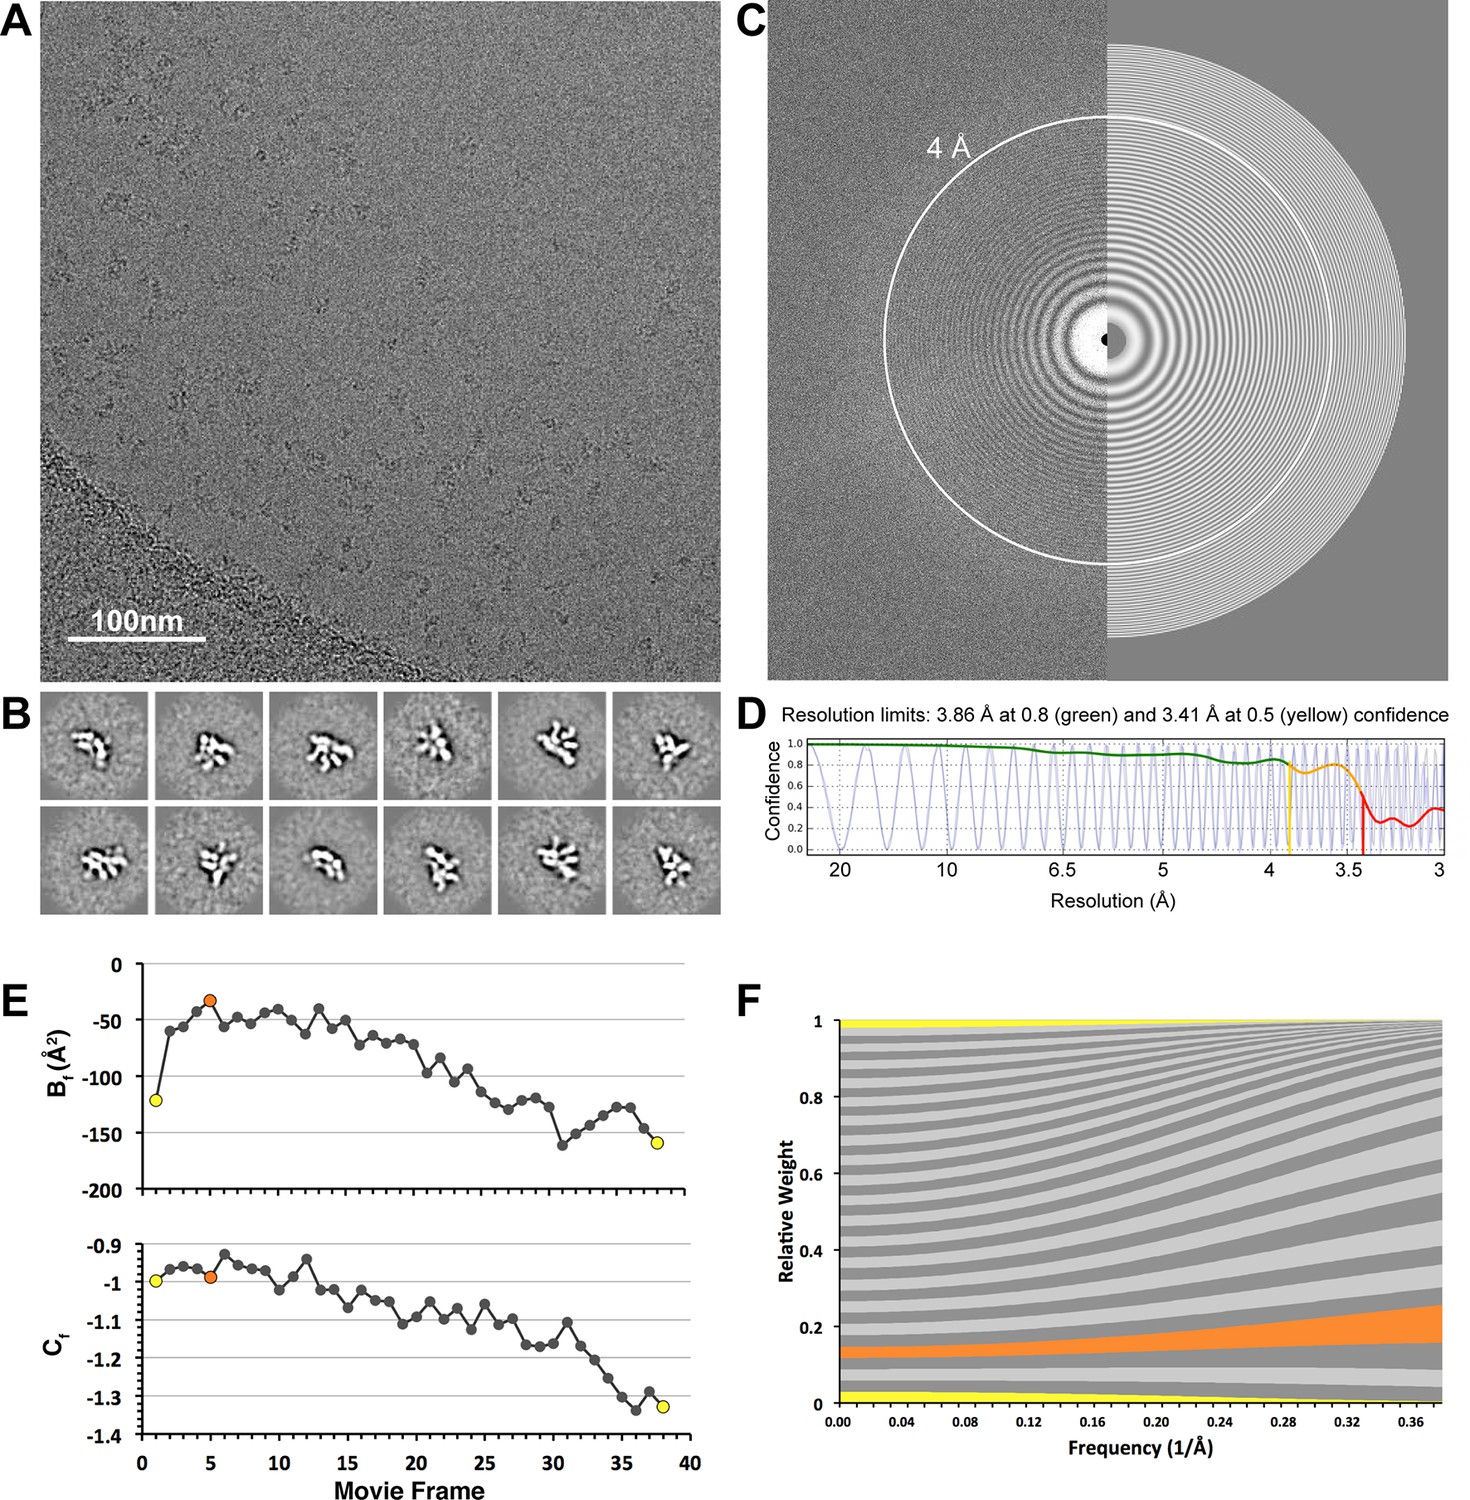
CryoEM data collection.
(A) A representative cryo-electron micrograph (scale bar = 100 nm) after whole-frame alignment. (B) Reference-free 2D class averages of frozen-hydrated particles, showing a variety of different projection views of the lid complex. (C) A Fourier transform of the representative micrograph, with a simulated CTF estimated by CTFFind3 overlaid on the right half of the image. Thon rings are clearly observed beyond 4Å (white circle). (D) A 1-dimentional plot showing the correlation of the experimental CTF (blue) and the estimated CTF (black). Images having a correlation of the of greater than 50% beyond 4 Å resolution were used for subsequent processing. (E) Per-frame B-factors (Bf, top) and intercepts (Cf, bottom). (F) Per-frame weighting of spatial frequencies, based on the Bf and Cf estimates shown in e. First and last frames are colored in yellow, and the frame with the least negative relative Bf is colored in orange (frame 5). Frames 4–16 are the major contributors to the high-resolution spatial frequencies.
Figure 1—figure supplement 2
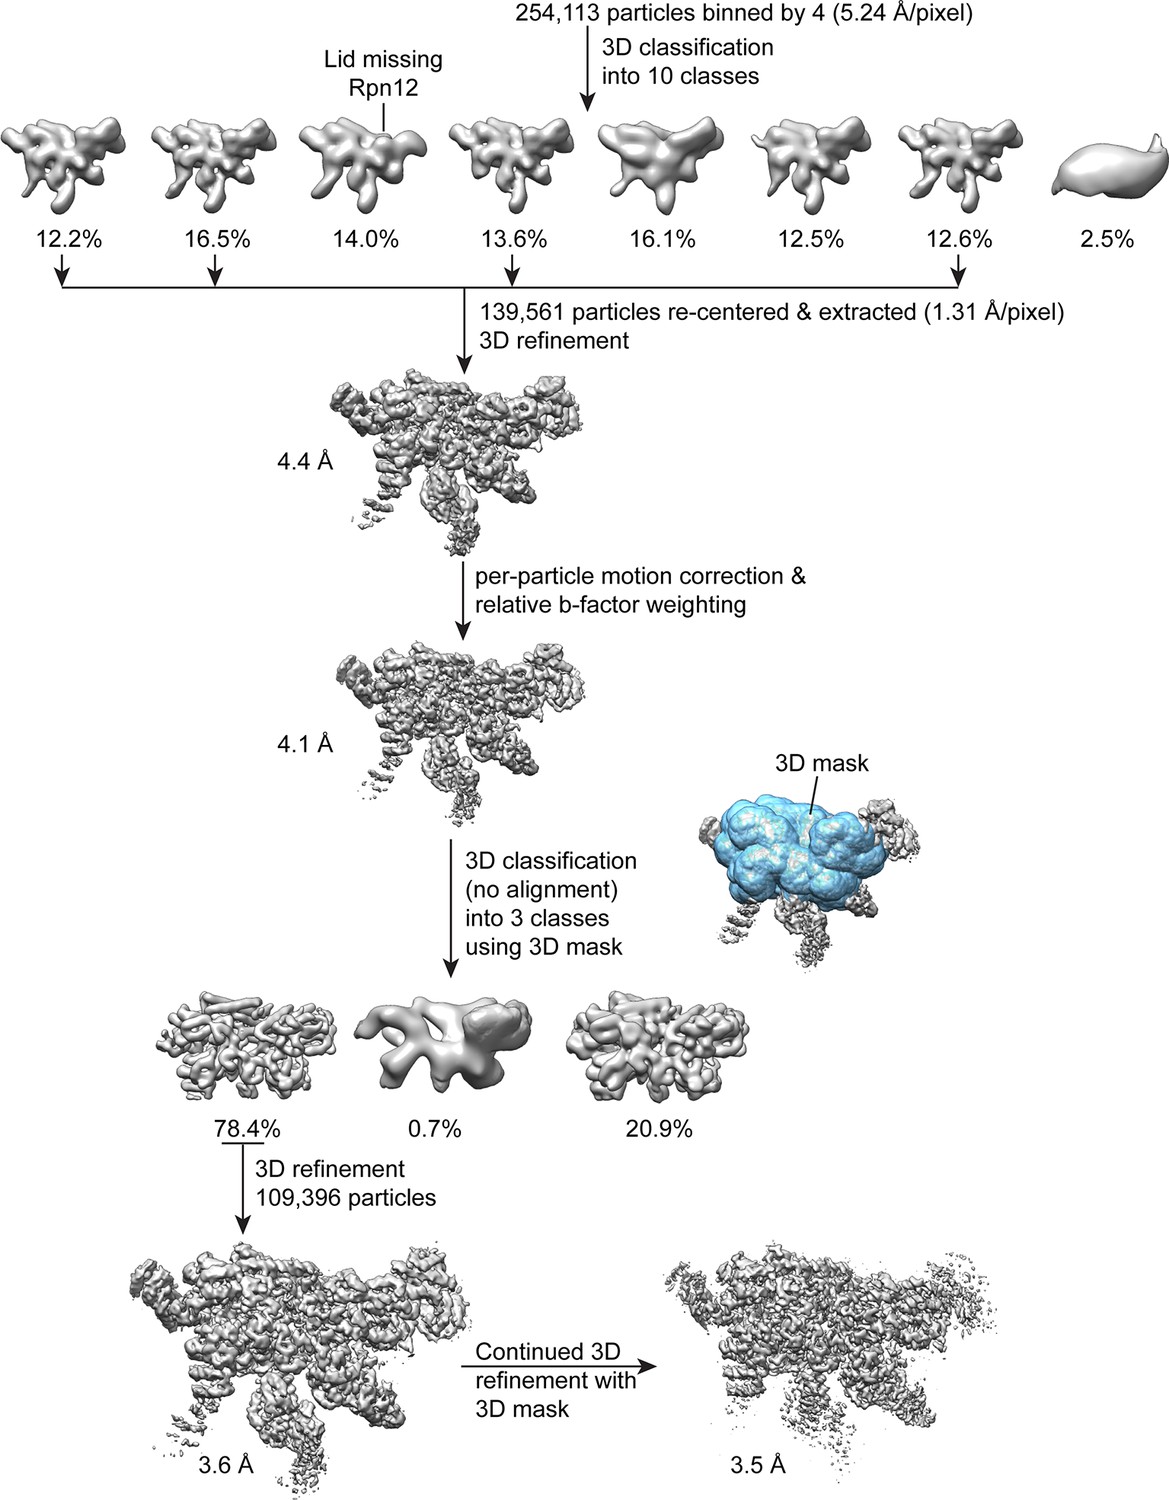
Single particle analysis of the lid complex.
A total of 254,113 particles were extracted from micrographs, scaled by a factor of 0.25, and subjected to 3D classification into 8 classes in RELION. The particle coordinates corresponding to the four highest resolution classes that showed density for all lid components were re-centered, based on the translations determined from 3D classification. These coordinates were used to extract 139,561 unbinned particles for 3D refinement with RELION, which yielded a reconstruction of 4.4 Å. After correcting for particle motion and electron beam damage (particle polishing), the resolution was improved to 4.1 Å. A 3D mask surrounding the most structurally stable regions of the map (the PCI domains, the MPN heterodimer, and the helical bundle) was generated, and used in an alignment-free 3D classification of the data into 3 classes. The 109,396 particles contributing to the highest resolution 3D class were used for further 3D refinement in RELION without applying a mask, yielding a 3.6 Å structure. Continued refinement of these alignment parameters using the same 3D mask that was applied earlier improved the resolution of the central regions of the structure by 0.1 Å.
Figure 1—figure supplement 3
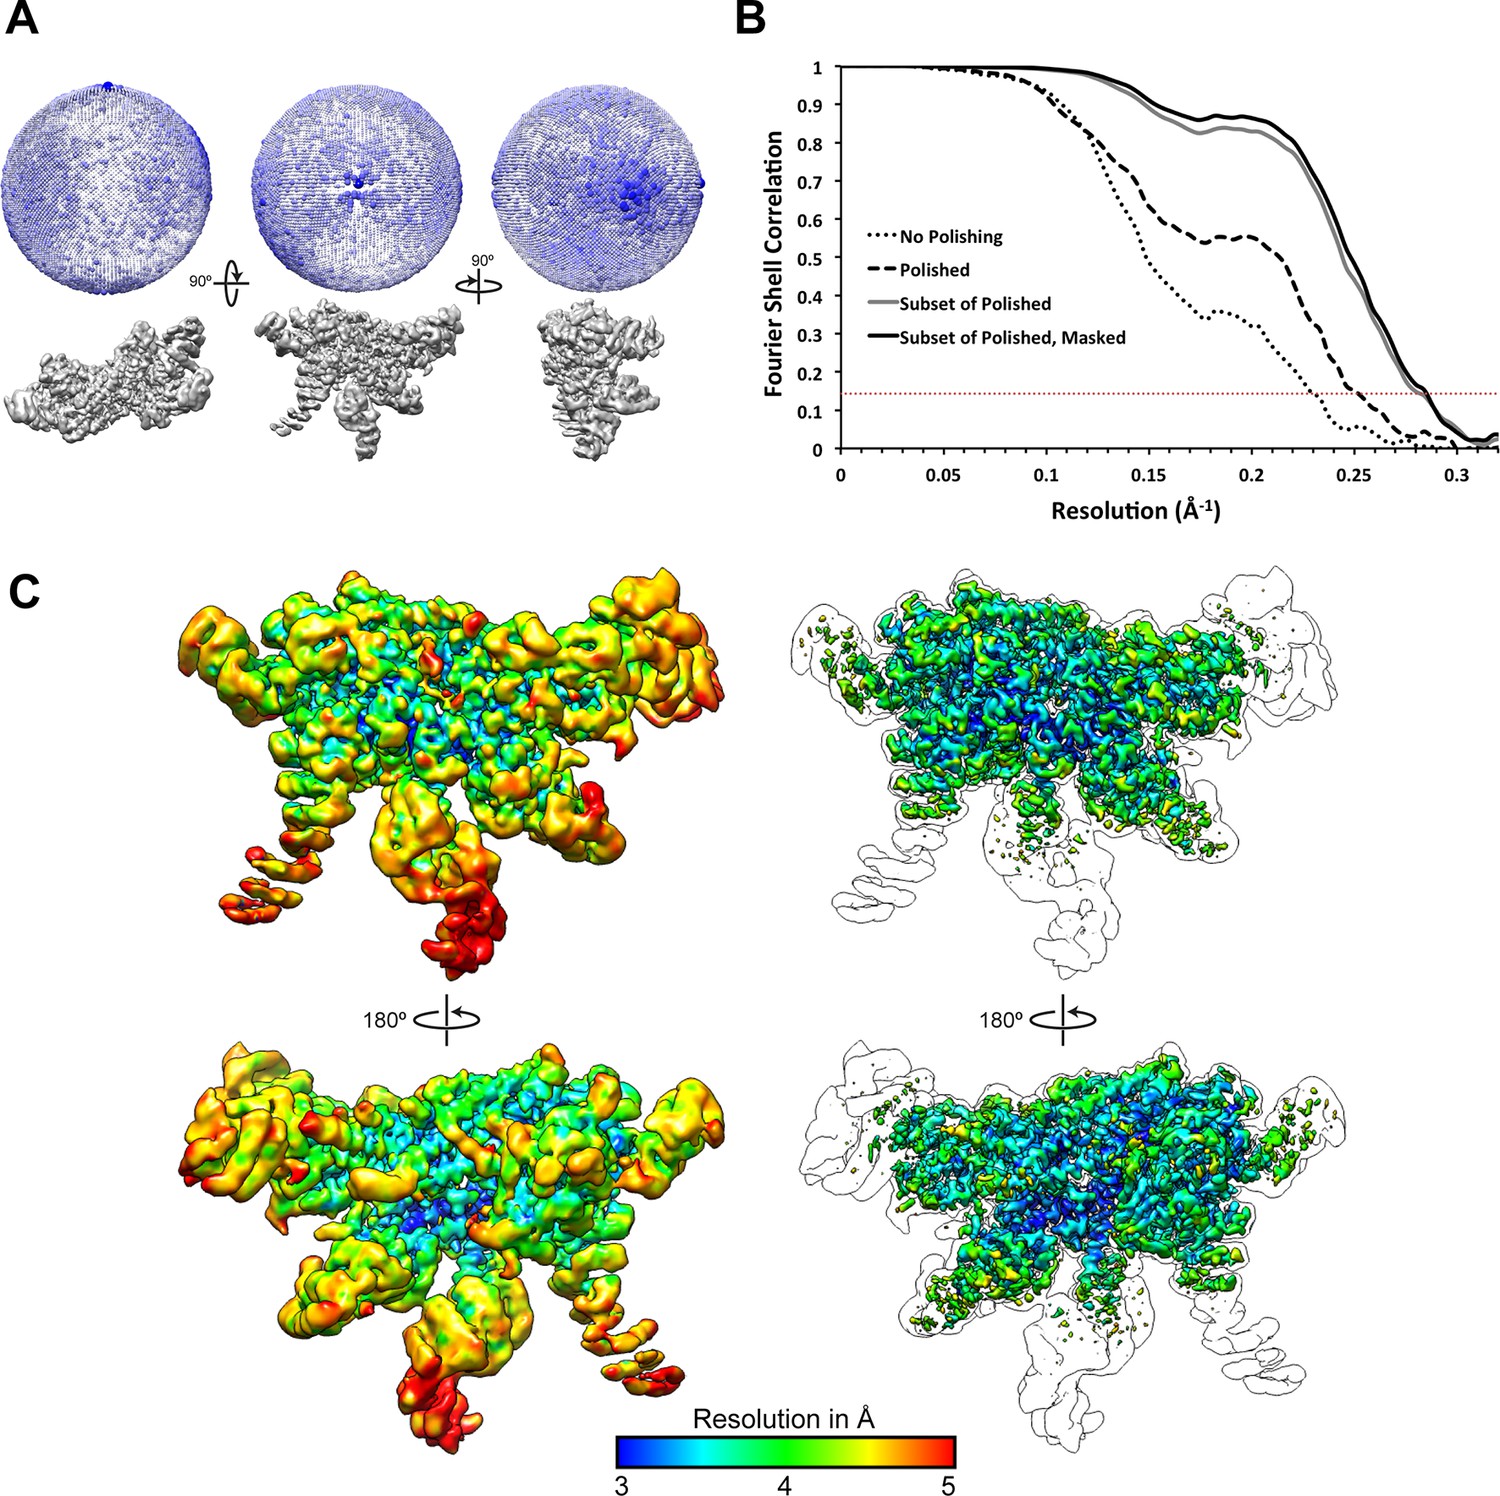
Resolution assessment of the reconstructions.
(A) 3D angular distribution plot, shown from three orthogonal angles of the reconstruction. The diameter and color saturation of the spheres increases with occupancy of particles at a given Euler angle. (B) Fourier Shell Correlation plots of lid reconstructions at different stages of processing. (C) The final map is shown at two contour levels, colored according to a local resolution estimation using Bsoft (Heymann and Belnap, 2007). A lower contour level (left) shows the more disordered regions, while the higher contour level (right) shows that regions of the map were resolved to 3 Å resolution. An outline of the lower contour is overlaid on top of the images on the right for reference.
Figure 1—figure supplement 4
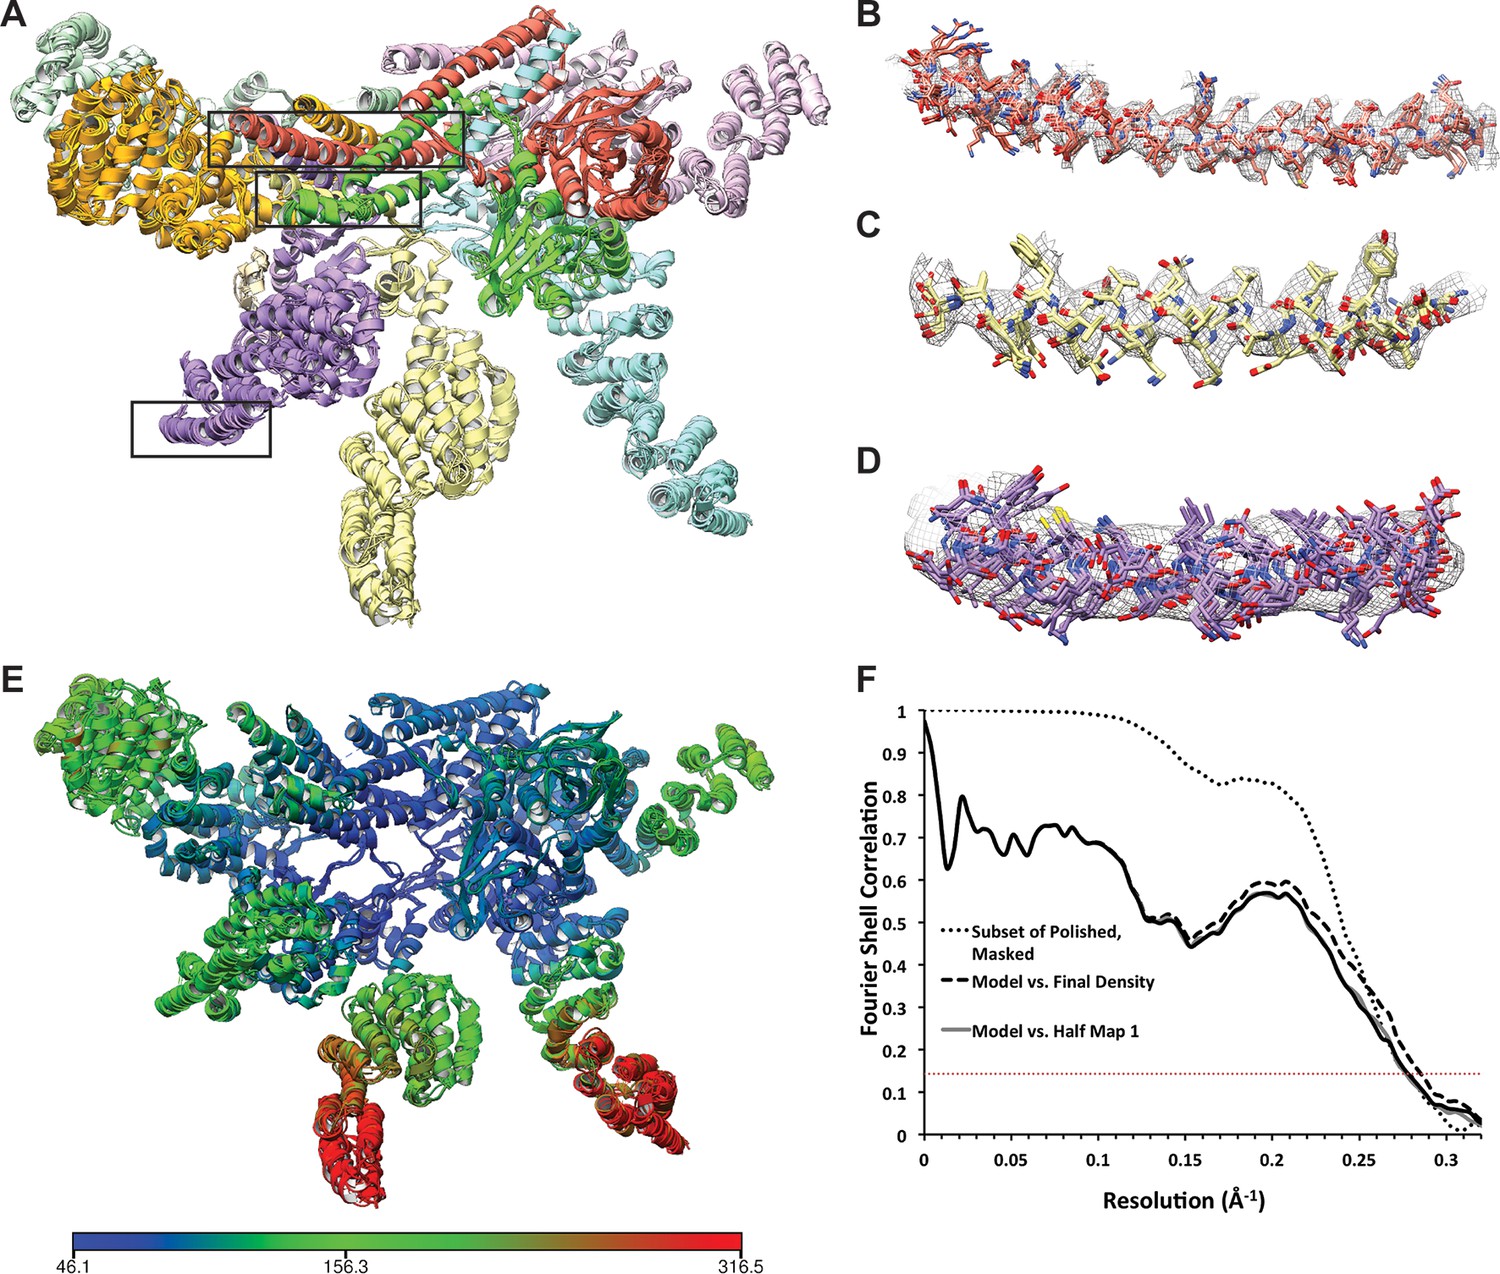
Atomic modeling of the lid sub-complex.
(A) The 5 top-scoring models are shown, with each subunit colored differently. Close-up views of the cryo-EM density in the regions within the black boxes are shown in (B–D). Side chains in the helical bundle (B, C) were well-resolved, and the 5 models were largely consistent in these regions. At the periphery of the complex, however, structural features were less well-resolved and the models are less consistent. (E) The atomic model is colored according to B-values, which are largely consistent with the local resolution map shown in Figure 1—figure supplement 3. Blue regions correspond to B-values of ~50 Å2, while red regions correspond to B-factors of ~300 Å2. (F) The FSCs between the top-scoring atomic model refined against one of the half-maps and the final 3.5 Å map (dashed line) and the two independently refined half maps (light and dark solid lines) are shown. For comparison, the FSC between the independently refined half maps is also plotted (dotted line). The overlap of the curves in the high spatial frequencies indicate that the model was not over-fitted.
Figure 1—figure supplement 5

Subunits of the yeast 26S proteasome lid sub-complex.
The well-ordered cryo-EM densities for the 9 lid subunits are shown as transparent surfaces, with the atomic models shown as ribbons. Side-chain density is clearly visible for the C-terminal helices of the PCI-containing domains, and the MPN-containing subunits are well-resolved throughout. The cryoEM density for the PCI-containing subunits become less ordered near the N-terminus of these subunits, and is only visible at lower contour levels.
Figure 1—figure supplement 6
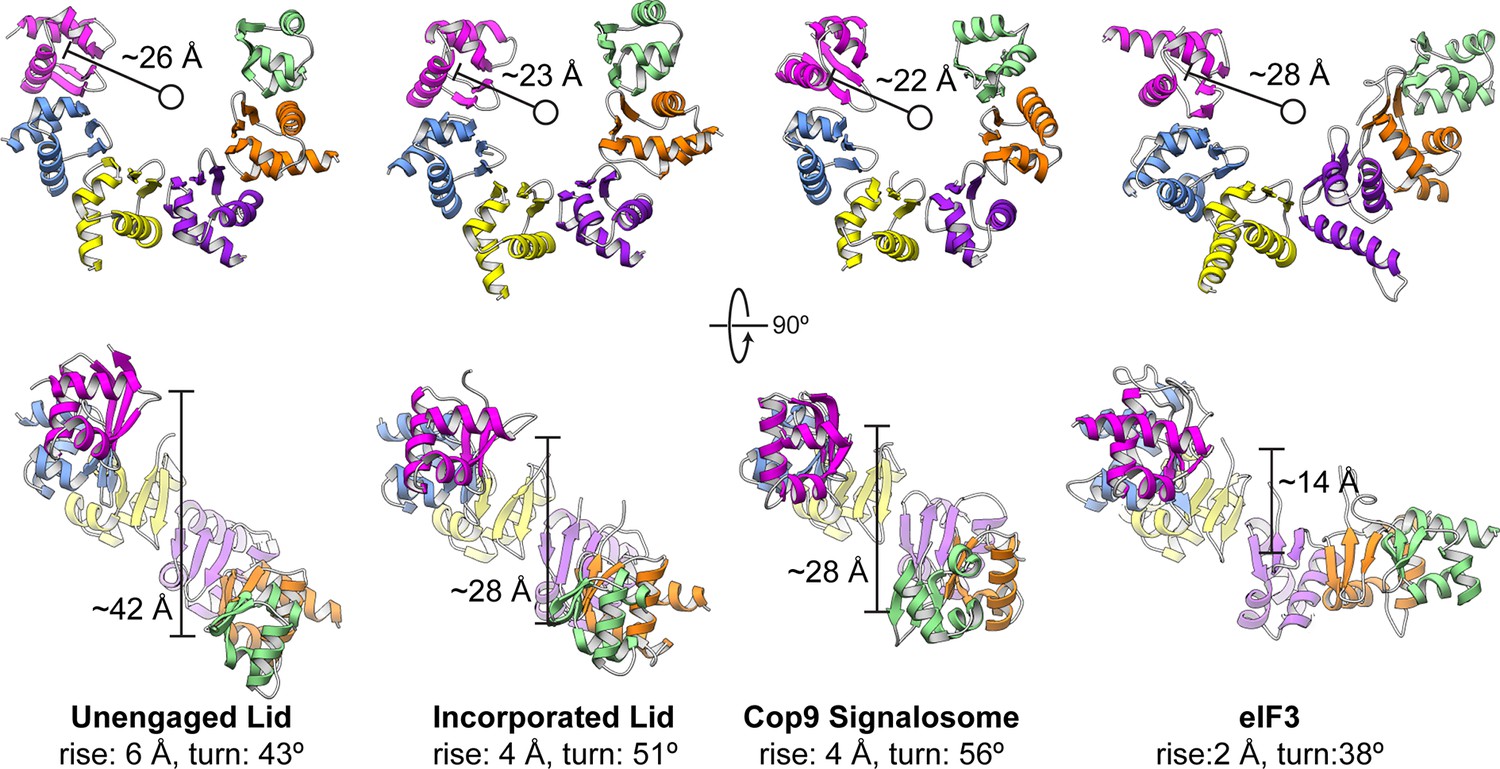
Comparison of PCI horseshoes in different complexes.
Shown are ribbon representations of the PCI horseshoes of (from left to right) the unincorporated lid, the incorporated lid (PDB ID: 4CR2) (Unverdorben et al., 2014), the COP9 signalosome (PDB ID: 4D18) (Lingaraju et al., 2014), and eIF3 (PDB ID: 5A5T) (des Georges et al., 2015). The PCI horseshoes all adopt a staircase arrangement, and the pseudo-helical pitch for each horseshoe was determined, as well as the radius of the helix. The PCI horseshoe in the unincorporated lid complex (left) is more open, and less planar than that of the incorporated lid. The helical parameters and diameter of the PCI horseshoe in the incorporated lid closely resembles that of the COP9 Signalosome. Of the four PCI horseshoes, the arrangement of eIF3 is most open and least helical in arrangement.
Figure 1—figure supplement 7

Interactions of the helical bundle with surrounding lid components.
The helical bundle (which is emphasized by a semi-transparent Gaussian-filtered surface) only makes significant interactions with the PCI domain of Rpn9 (magenta-colored ribbon). There also appears to be a contact established between the C-terminus of the Rpn6 helix (yellow) and the N-terminal domain of Rpn3 (orange). The cryoEM density is shown in the lower left panel, showing the putative Rpn3-Rpn6 interaction.
Figure 2 with 2 supplements
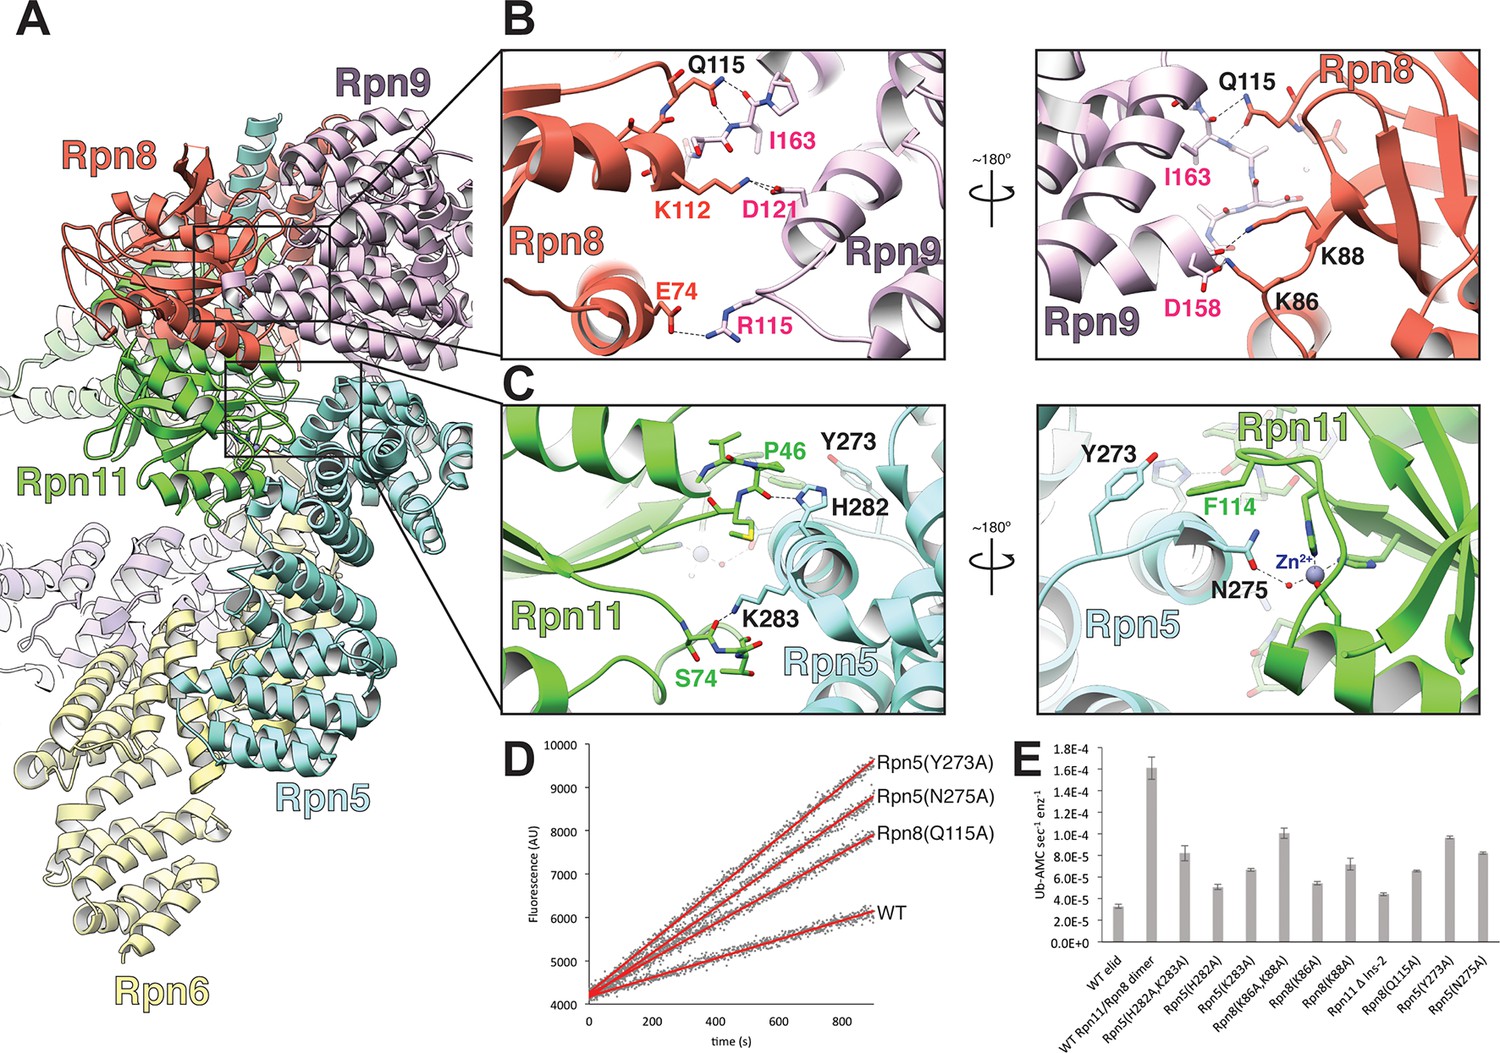
The MPN heterodimer interacts extensively with Rpn5 and Rpn9.
(A) Side view of the lid sub-complex shows that the MPN heterodimer (Rpn8 in red, Rpn11 in green) interacts closely with the Rpn5 (blue) and Rpn9 (lavender) subunits. Side-chain interactions likely responsible for maintaining the MPN heterodimer in this configuration are shown in detail in panels (B) and (C). Residues that were mutated to alanine for deubiquitination assays are labeled in black. (D) Measurements of fluorescence increase upon Rpn11-mediated cleavage of ubiquitin-AMC are shown for three lid mutants relative to the wild-type lid. (E) Ubiquitin-AMC cleavage rates show activation of Rpn11 in the lid upon mutation of residues within Rpn5 and Rpn8.
Figure 2—figure supplement 1
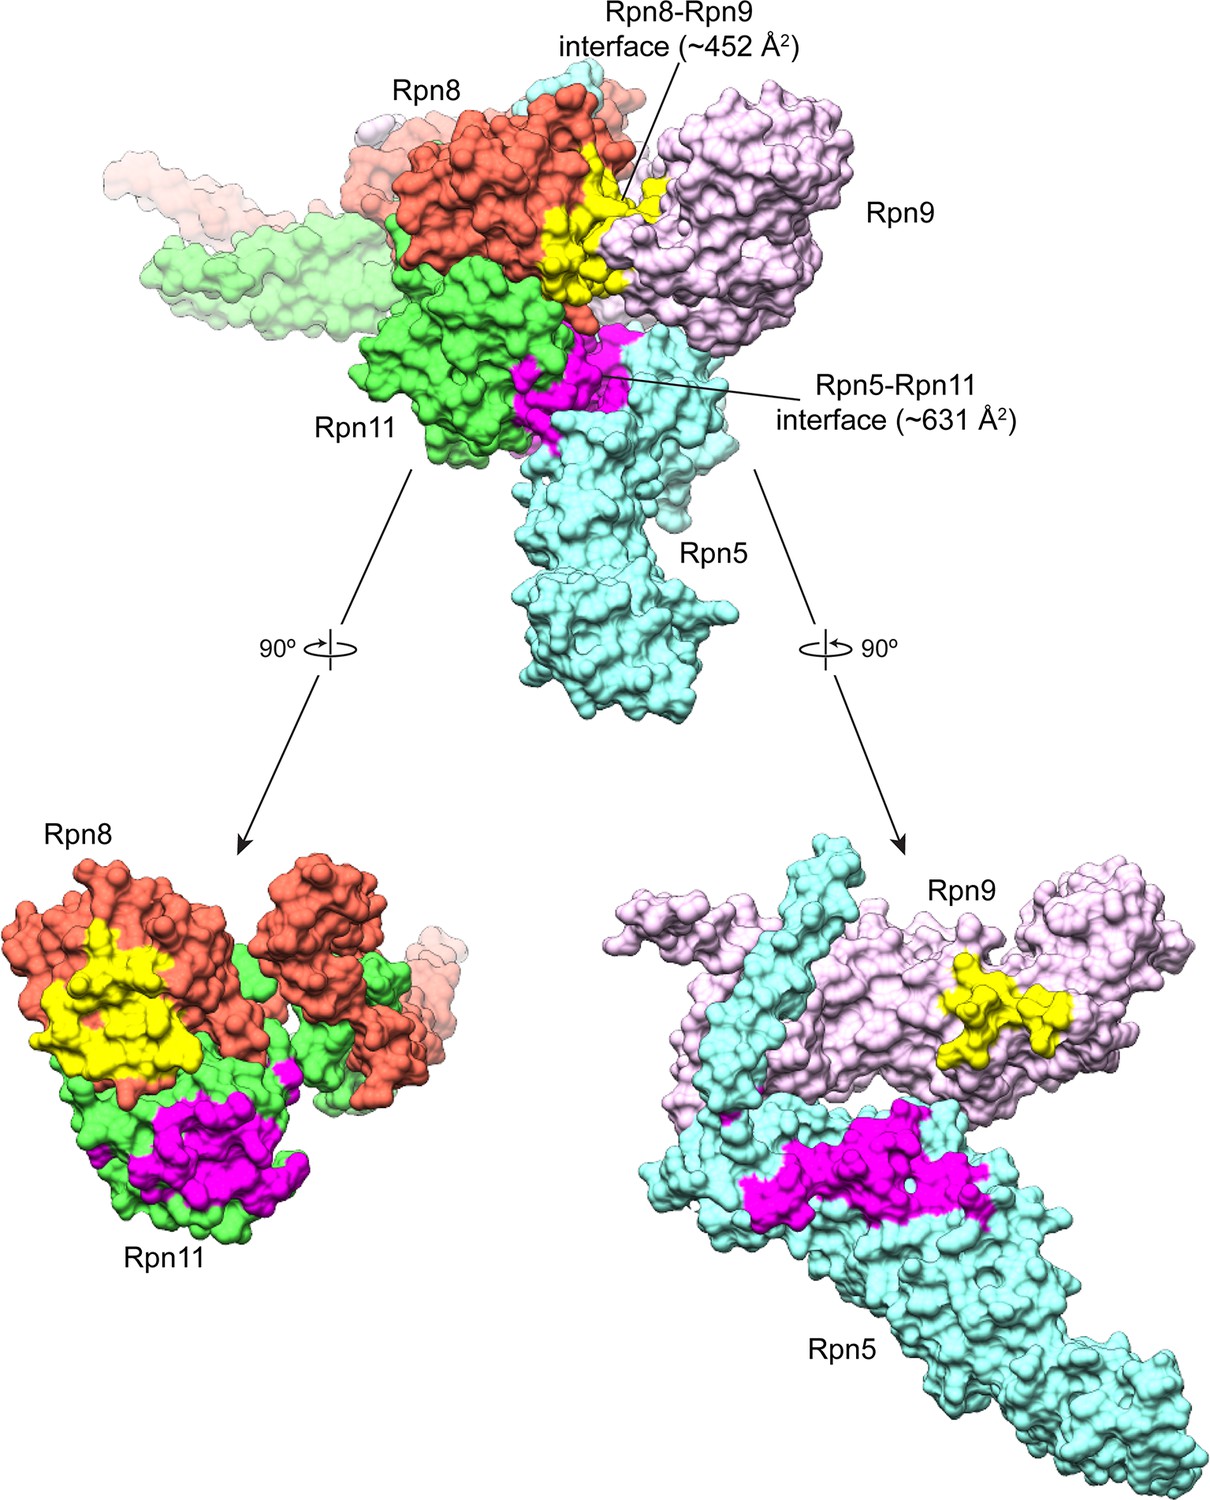
Buried surface area between the MPN heterodimer and Rpn9 and Rpn5.
An MSMS surface was generated from the atomic model of the lid sub-complex, and the buried surface area was calculated for the interfaces of Rpn8 and Rpn9 (colored yellow), and Rpn11 and Rpn5 (colored magenta). The Rpn11-Rpn5 interface is the largest site of interaction between the all of the PCI-containing subunits and the MPN-heterodimer, with a buried surface area of ~631 Å2. The Rpn8-Rpn9 interface is the next largest, with a buried surface area of ~452 Å2.
Figure 2—figure supplement 2

Interface mutations in Rpn5 and Rpn9 release the MPN dimer from its inhibited conformation.
Negative stain EM analysis was performed on the lid mutants. On the left are 2D class averages depicting the canonical hand-shaped arrangement of the lid sub-complex from the front and top views. On the right are 3D reconstructions of the lid, showing the organization of the PCI horseshoe, as well as the position of the Rpn11/Rpn8 heterodimer (red and green) relative to Rpn9 (pink) and Rpn5 (blue). The 2D and 3D analyses of the wild type particles show that the MPN heterodimer is closely associated with the Rpn5 and Rpn9 subunits (top row). The mutants, however, show that the while overall organization of the PCI-containing subunits are preserved, the MPN dimer is released from its position in the palm of the lid sub-complex. In the 2D class averages, the detached MPN dimer can be identified as an additional density that is not observed in the WT class average (indicated by a yellow arrow). In the 3D reconstructions, the WT structure shows the MPN dimer (green and red) are connected to Rpn5 (blue) and Rpn9 (purple). The density corresponding to the dimer in all the mutants is clearly detached from Rpn5 and Rpn9. The MPN dimer within the Rpn5 (Y273A) (bottom row) had such an increased level of flexibility, that the dimer itself is poorly resolved.
Figure 3 with 2 supplements

The Rpn11 active site is inhibited in the isolated lid.
(A) The catalytic Zn2+ (gray sphere) within the Rpn11 active site (green ribbon) is coordinated by three residues from Rpn11, and a water molecule acts as a fourth ligand, likely mediated by Asn275 from the neighboring Rpn5 subunit (blue). The cryoEM density in this region is shown as a mesh. (B) Comparison of the Rpn11 active sites from the isolated Rpn11/Rpn8 heterodimer crystal structure (PDB ID: 4O8X, purple) and isolated lid (green) shows that the two structures are nearly superimposable. (C) A di-ubiquitin substrate (tan) was modeled into the active site and shown as a transparent surface rendering. The modeled substrate severely clashes with the locked Rpn11 Ins-1 loop and Rpn5. (D) In CSN, a Glu within the Ins-1 loop provides a fourth point of coordination for the Zn2+ ion. (E) Similar to CSN, an AMSH mutant utilizes an Asp from the Ins-1 loop to establish tetrahedral coordination of the catalytic Zn2+.
Figure 3—figure supplement 1
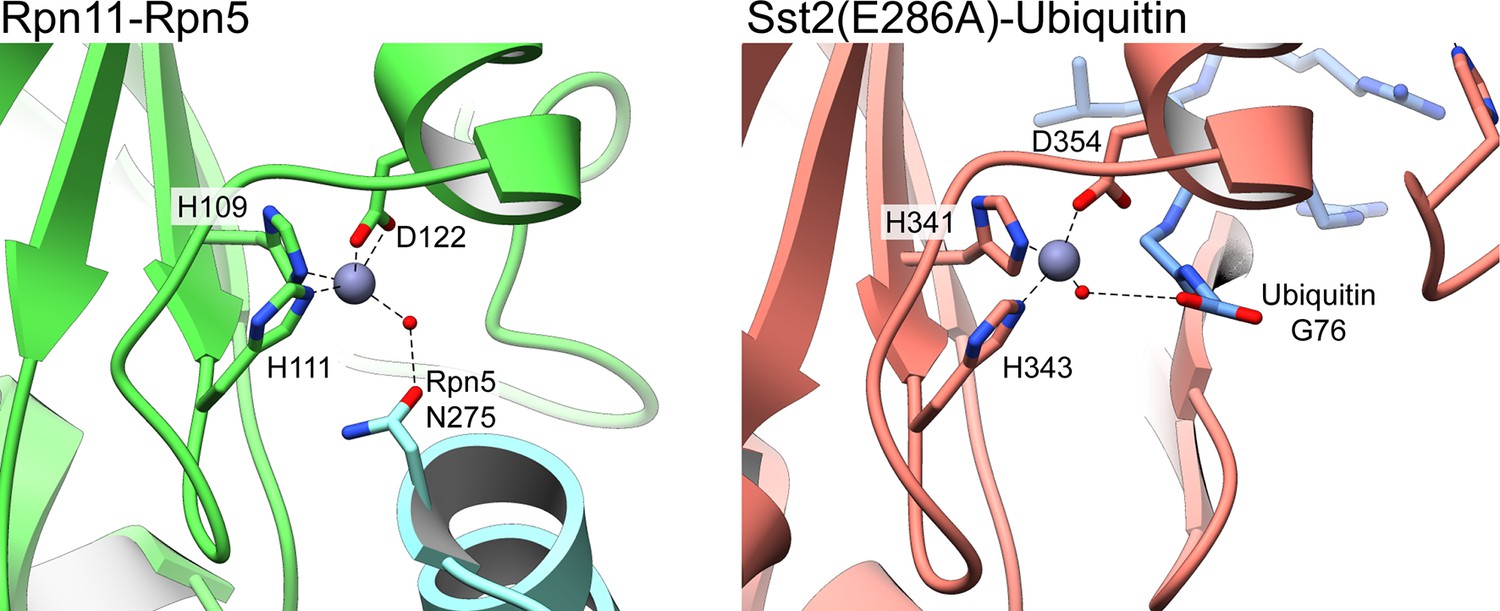
Water-mediated tetrahedral coordination of active site Zn2+ in Rpn11 and AMSH orthologue Sst2.
The deubiquitinase active site of isolated lid’s Rpn11 subunit (left) and an Sst2 mutant (PDB ID: 4MSM) (Shrestha et al., 2014) (right) are shown, depicting the coordination of the catalytic Zn2+ (gray sphere) by three active site residues, and a catalytic water molecule (red sphere). In both structures, the water molecule is hydrogen-bonded to a residue from an additional component. In the lid, the catalytic water in the Rpn11 active site is bound to N275 from Rpn5, and in the Sst2 mutant, the water interacts with the carboxylate group of Gly76 from a cleaved Ubiquitin.
Figure 3—figure supplement 2
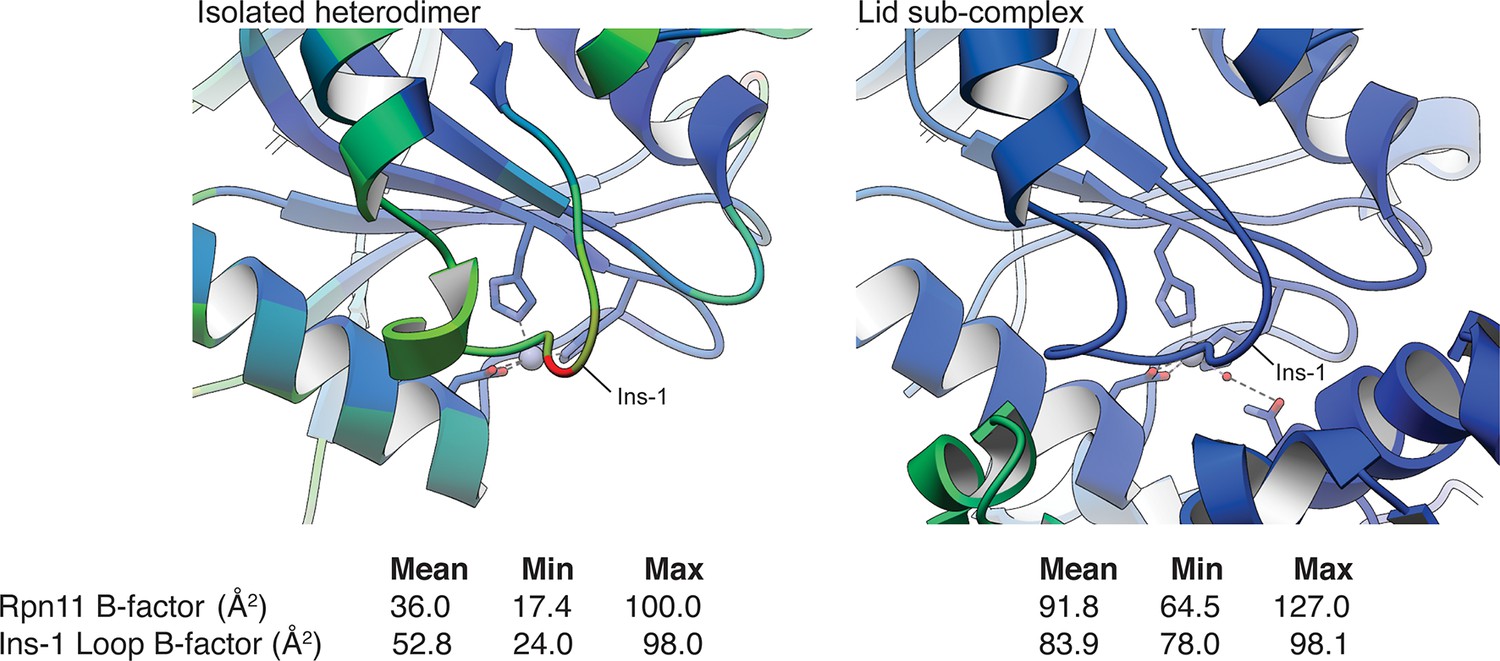
Relative B-values of the Rpn11 Ins-1 loop in the isolated Rpn11/Rpn8 heterodimer and in the isolated lid sub-complex.
A ribbon representation of the Rpn11 Ins-1 loop in the crystal structure of the isolated Rpn11/Rpn8 heterodimer and within the isolated lid sub-complex is colored according to the B-factor values (blue = low B-factor, red = high B-value). Notably, the Ins-1 loop in the isolated MPN heterodimer has significantly higher average B-values than the rest of Rpn11, while the B-values of the Ins-1 loop in the cryo-EM structure of the lid sub-complex are slightly lower than the average B-factor value of the Rpn11 subunit. This suggests that the Ins-1 loop is stabilized in this conformation within the lid assembly.
Figure 4 with 3 supplements
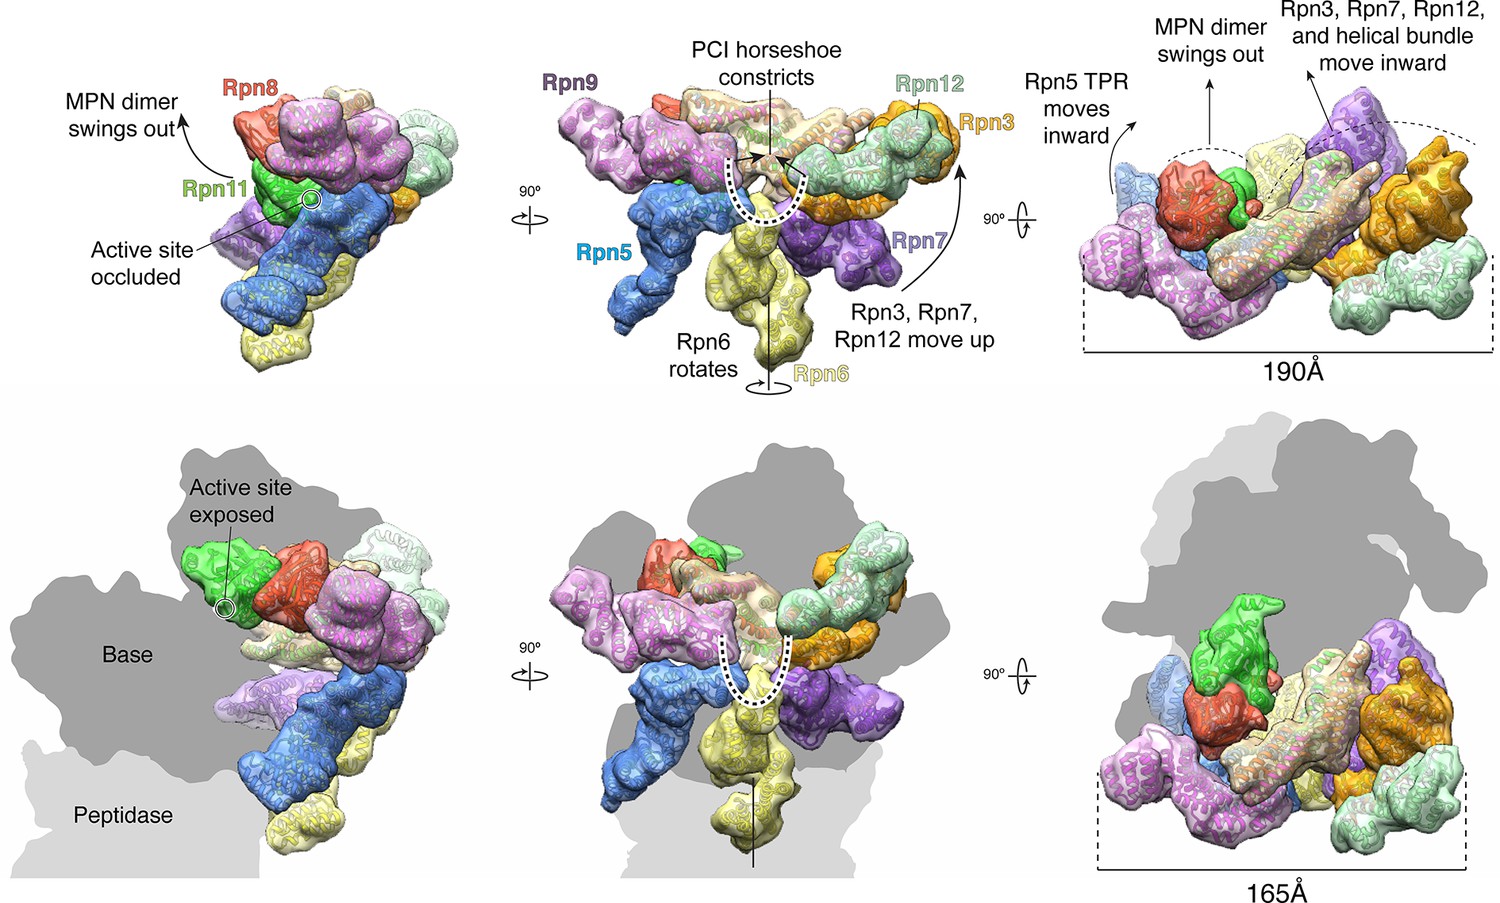
The lid sub-complex undergoes a dramatic reorganization upon incorporation to the 26S holoenzyme.
Motions associated with lid incorporation are shown from three orthogonal views. Top panels correspond to the isolated lid, while bottom panels represent the proteasome-incorporated lid. Atomic models of the lid subunits were used to generate semi-transparent Gaussian filtered surfaces for visualization. For clarity, the helical bundle, which moves as a rigid body, is shown as a single surface. Sem1 is not shown. The base and core peptidase components are depicted as shadows to not occlude details of the lid rearrangement. Notable rearrangements include: a 90° rotation of the MPN dimer away from the inhibited conformation, movement of Rpn3, 7, and 12 away from Rpn5, 6, and 9, constriction of the PCI horseshoe, and an overall closure of the lid sub-complex around the regulatory particle.
Figure 4—figure supplement 1
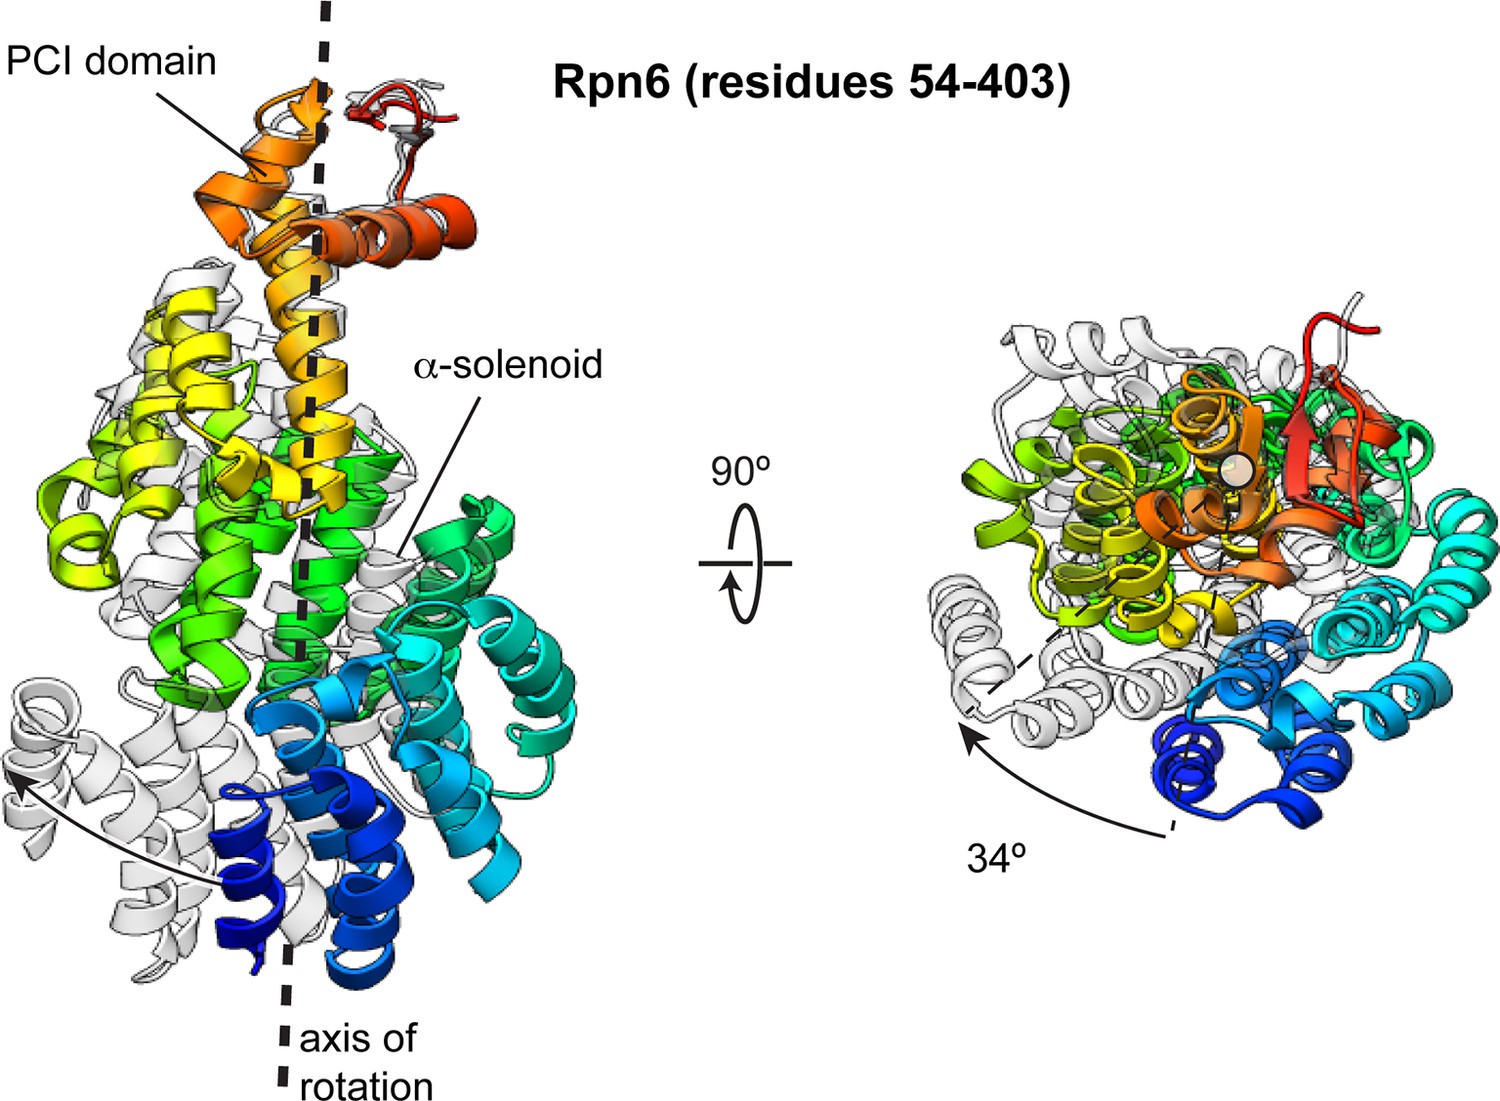
The Rpn6 α-solenoid domain rotates during incorporation into the holoenzyme.
The N-terminal α-solenoid domain rotates ~34° (calculated using DynDom [Hayward and Berendsen, 1998]) during incorporation of the lid into the holoenzyme. The PCI domain of the two conformations were aligned, and the overlay of these structures illustrates the solenoid movement, shown from the side and down the axis of rotation. The Rpn6 subunit in the isolated lid sub-complex is colored using a rainbow scheme, with residues at the N-terminus colored blue, and progressing through the color spectrum to red for C-terminal residues. The Rpn6 conformation in the incorporated lid is shown in transparent gray.
Figure 4—figure supplement 2
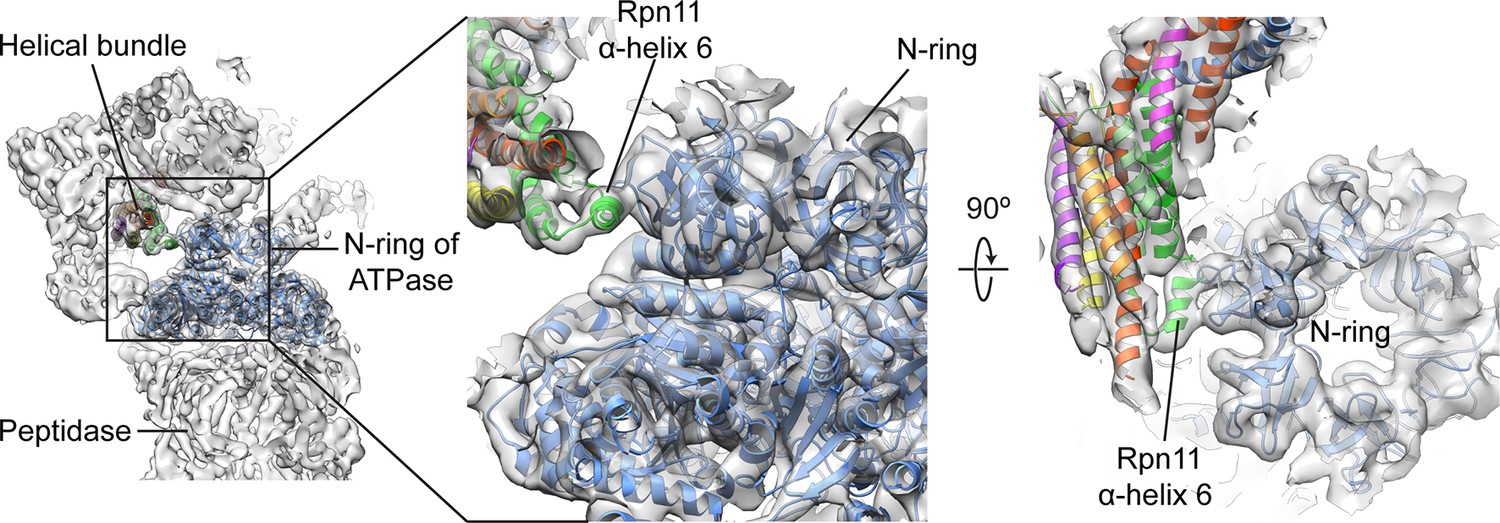
Rpn11’s bundle helix binds to the N-ring of the holoenzyme ATPase.
Upon incorporation into the holoenzyme, a short helix from Rpn11 within the helical bundle interacts with the N-ring of the ATPase. This interaction may aid in stabilizing the lid’s position at the side of the regulatory particle.
Figure 4—figure supplement 3
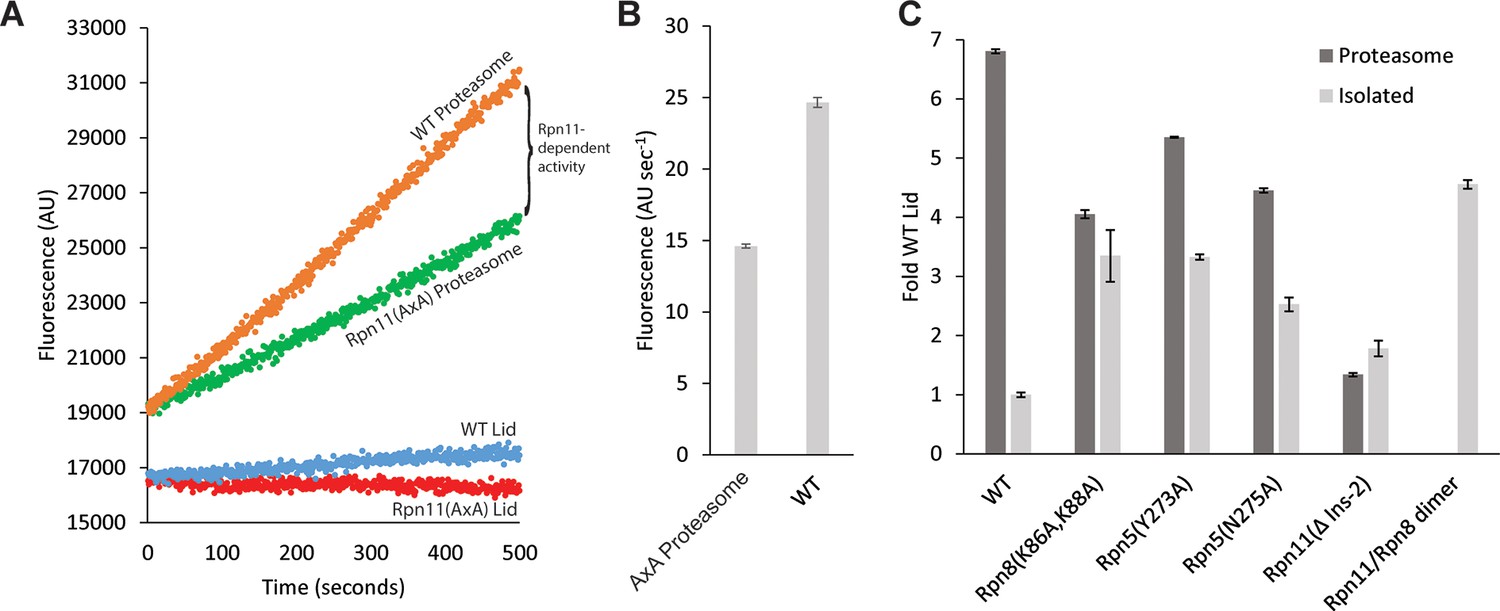
Lid incorporation activates Rpn11.
(A) Rpn11 activation during proteasome incorporation monitored by ubiquitin-AMC hydrolysis. Fluorescence time courses for the isolated WT lid and Rpn11 (AxA) lid are shown in blue and red, respectively. Background DUB activity of proteasomes reconstituted with Rpn11 (AxA) lid is shown in green, and the activity of proteasomes reconstituted with WT lid is shown in orange. The difference between the time courses for proteasomes reconstituted with WT and Rpn11 (AxA) lid corresponds to Rpn11-dependent DUB activity. (B) Quantification of the ubiquitin-AMC cleavage activities for WT and Rpn11 (AxA) proteasomes shown in a. (C) Normalized Ubiquitin-AMC hydrolysis activity of Rpn11-containing complexes in isolation (grey bars) and background-corrected activity of Rpn11 in proteasomes reconstituted with different lid variants (dark grey bars). Error bars in b and c correspond to 1 standard deviation of the data (n = 3).
Videos
Video 1
Lid subunit rearrangements that occur during incorporation into the 26S holoenzyme.
The atomic model of the isolated lid is interpolated into the pseudo-atomic model of the 26S holoenzyme (Unverdorben et al., 2014), showing the motions associated with lid incorporation.
Tables
Table 1
CryoEM data collection, processing, and modeling
| Data collection | |||
|---|---|---|---|
| Microscope | FEI Titan Krios | ||
| Camera | Gatan K2 Summit | ||
| Voltage | 300 keV | ||
| Magnification | 22,500 | ||
| Pixel size | 1.31 Å (0.655 Å, super-resolution) | ||
| Dose rate | 9.9 e-/pixel/s | ||
| Cumulative electron dose | 43.8 e-/Å2 | ||
| Exposure | 7.6 s | ||
| Number of frames | 38 | ||
| Defocus range | 1.5–3.5 µm | ||
| Micrographs collected | 3,432 | ||
| Acquisition software | Leginon (Suloway et al., 2005) | ||
| Image Processing | |||
| Preprocessing package | Appion (Lander et al., 2009) | ||
| Frame alignment software | MotionCorr (whole image) (Li et al., 2013) | ||
| CTF estimation software | CTFFind3 (Mindell and Grigorieff, 2003) | ||
| CTF cutoff criterion | 4 Å at 0.5 confidence | ||
| Particle picking software | FindEM (Roseman, 2004) | ||
| Micrographs used | 3,365 | ||
| Particles selected | 254,112 | ||
| Reconstruction | |||
| Software | RELION 1.3 (Scheres, 2012) | ||
| Particles contributed | 109,396 | ||
| Rotational accuracy | 1.392 degrees | ||
| Translational accuracy | 0.671 pixels | ||
| B-factor applied | -75.9 | ||
| Final resolution @ FSC 0.143 | 3.5 Å | ||
| Model building and Refinement | |||
| Number of residues | 2743 (86%) | ||
| Map CC (whole unit cell) | 0.758 | ||
| Map CC (all atoms) | 0.853 | ||
| R.M.S deviations | |||
| Bond length (Å) | 0.02 | ||
| Bond angle (˚°) | 1.15 | ||
| Ramachandran plot stats | |||
| Preferred | 2646 (96.47%) | ||
| Allowed | 92 (3.35%) | ||
| Outlier | 5 (0.18%) | ||
| Rotamer outliers | 5 (0.20%) | ||
| C-beta deviations | 0 (0.00%) | ||
Download links
A two-part list of links to download the article, or parts of the article, in various formats.
Downloads (link to download the article as PDF)
Open citations (links to open the citations from this article in various online reference manager services)
Cite this article (links to download the citations from this article in formats compatible with various reference manager tools)
Atomic structure of the 26S proteasome lid reveals the mechanism of deubiquitinase inhibition
eLife 5:e13027.
https://doi.org/10.7554/eLife.13027


