Cryo-EM single particle analysis with the Volta phase plate
- Max Planck Institute of Biochemistry, Germany
Figures
Figure 1
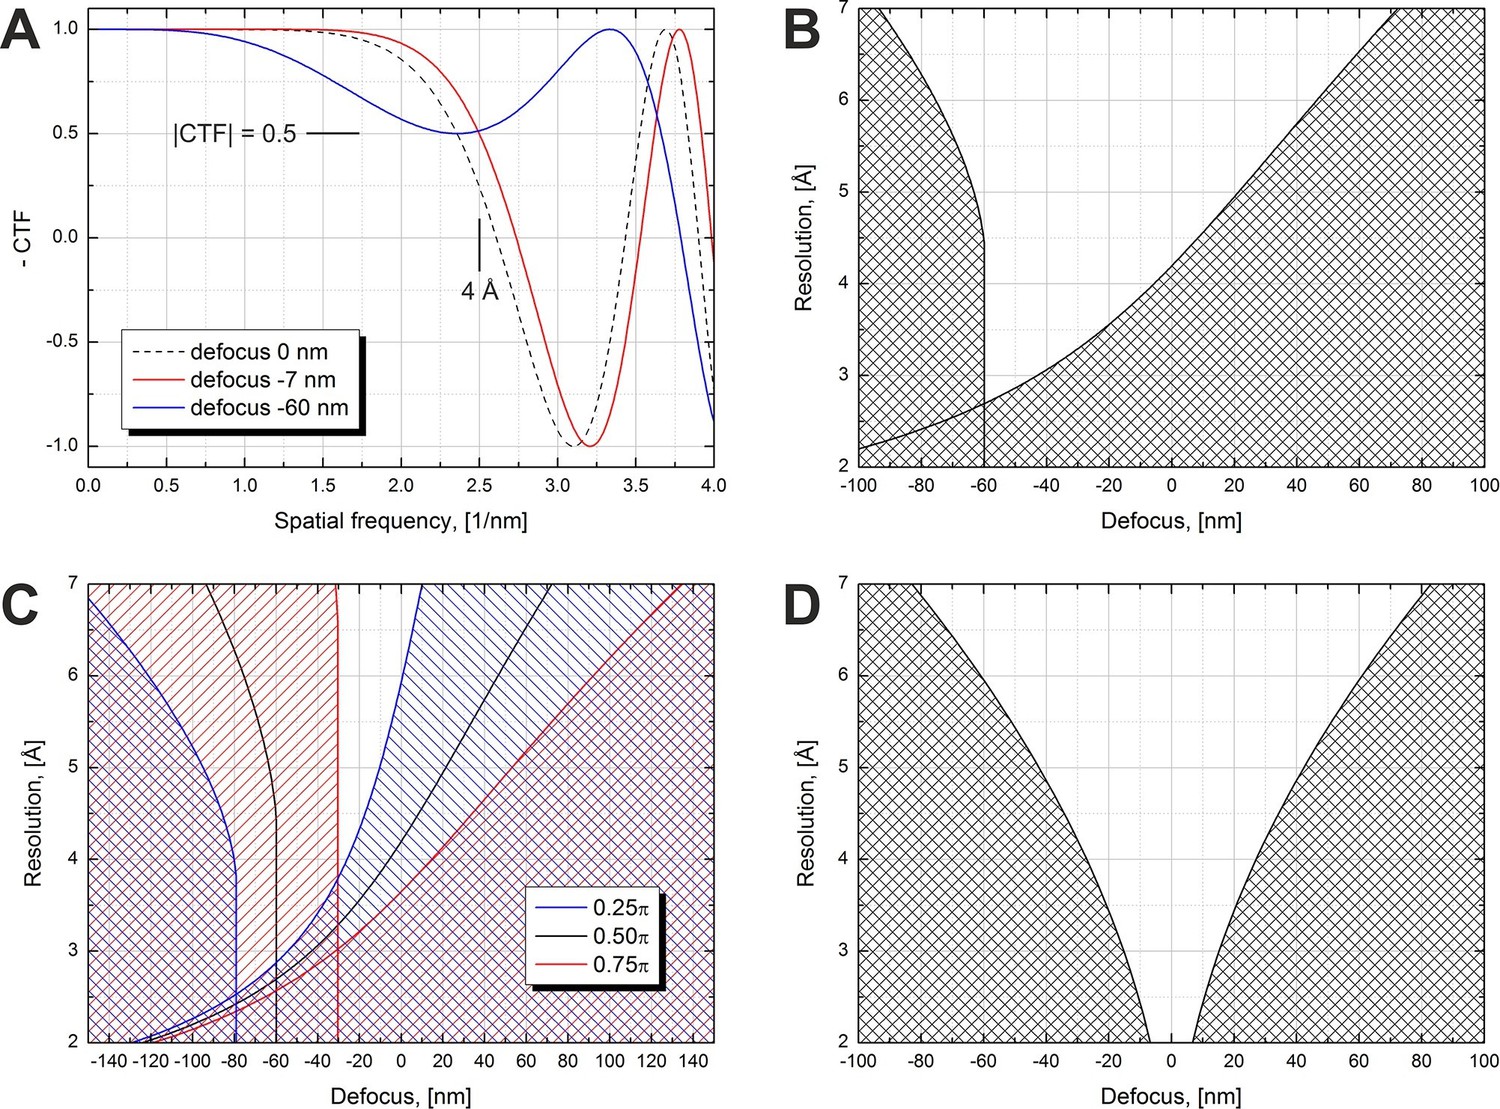
Volta phase plate CTF examples and allowed defocus ranges versus resolution.
(A) Illustration of CTFs at defocus values that limit the resolution to 4 Å according to a |CTF|=0.5 criterion. (B) Defocus limits versus resolution according to the |CTF|=0.5 criterion for a π/2 phase plate and 2.7 mm spherical aberration. The shaded areas are 'prohibited' in a sense that for those defocus values the CTF amplitude drops below 0.5 at a resolution lower than the value on the y-axis. (C) Same as (B) but for three different phase shift values. (D) Same as (B) but for a Cs-corrected microscope (0 mm spherical aberration).
Figure 2
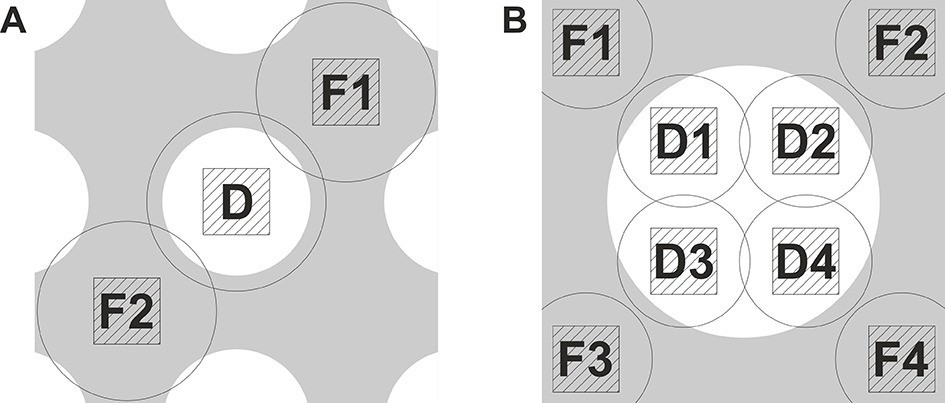
Data acquisition schemes that enable precise focusing superposed on a holey support film.
(A) Two focusing areas, F1 and F2, on opposite sides of the data acquisition position D are used to perform a linear interpolation of the measured defocus. (B) Multiple focusing areas F1 to F4 around a support film hole can be used to interpolate the defocus and acquire multiple data images (D1 to D4) per hole.
Figure 3
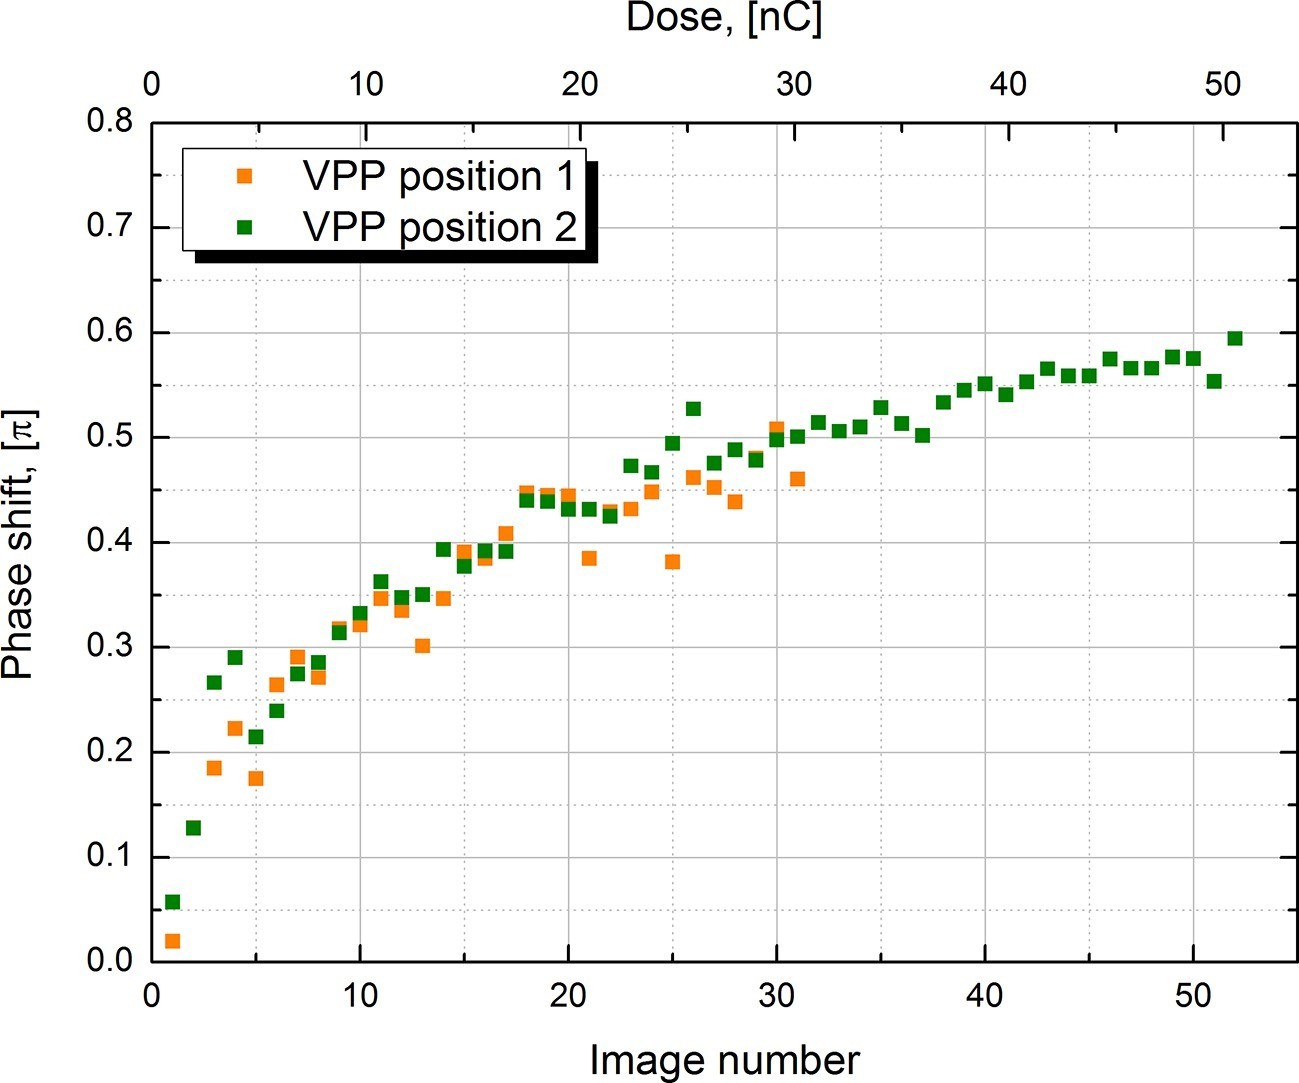
Measured phase shift of the VPP as a function of the image number/total dose on the phase plate.
The measurement was performed at two consecutive positions on the phase plate.
Figure 4
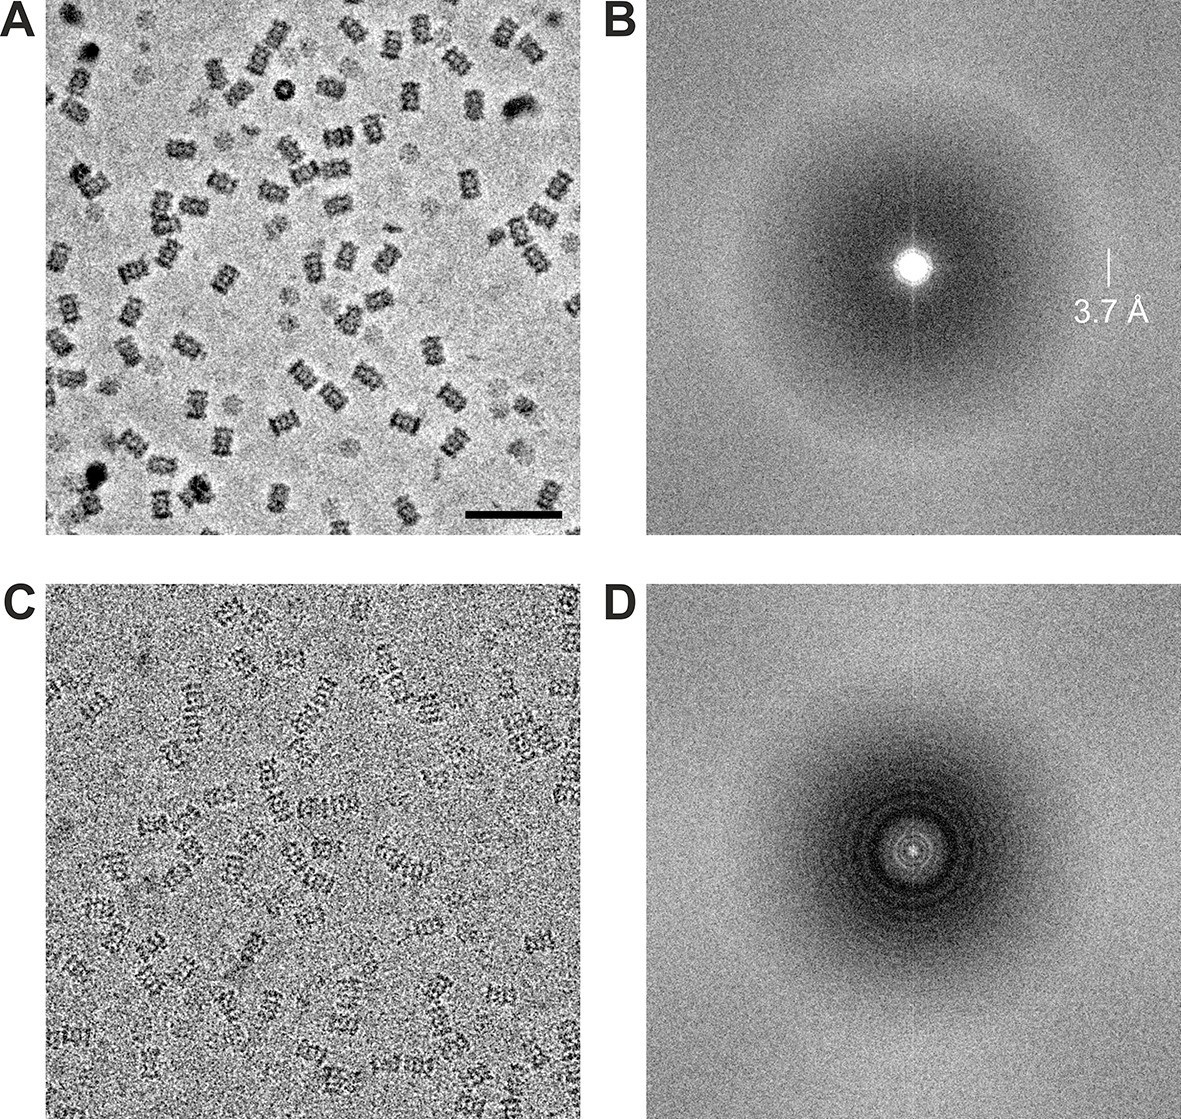
Representative images from 20S proteasome datasets acquired with and without a phase plate.
(A) In-focus image acquired with the Volta phase plate. (B) Power spectrum of the image in (A). The presence of the amorphous ice ring at 3.7 Å indicates that there is good information transfer to at least that spatial frequency. (C) Conventional defocus image at −1.6 μm defocus. (D) Power spectrum of the image in (C) showing CTF Thon rings. Scale bar: 50 nm.
Figure 5
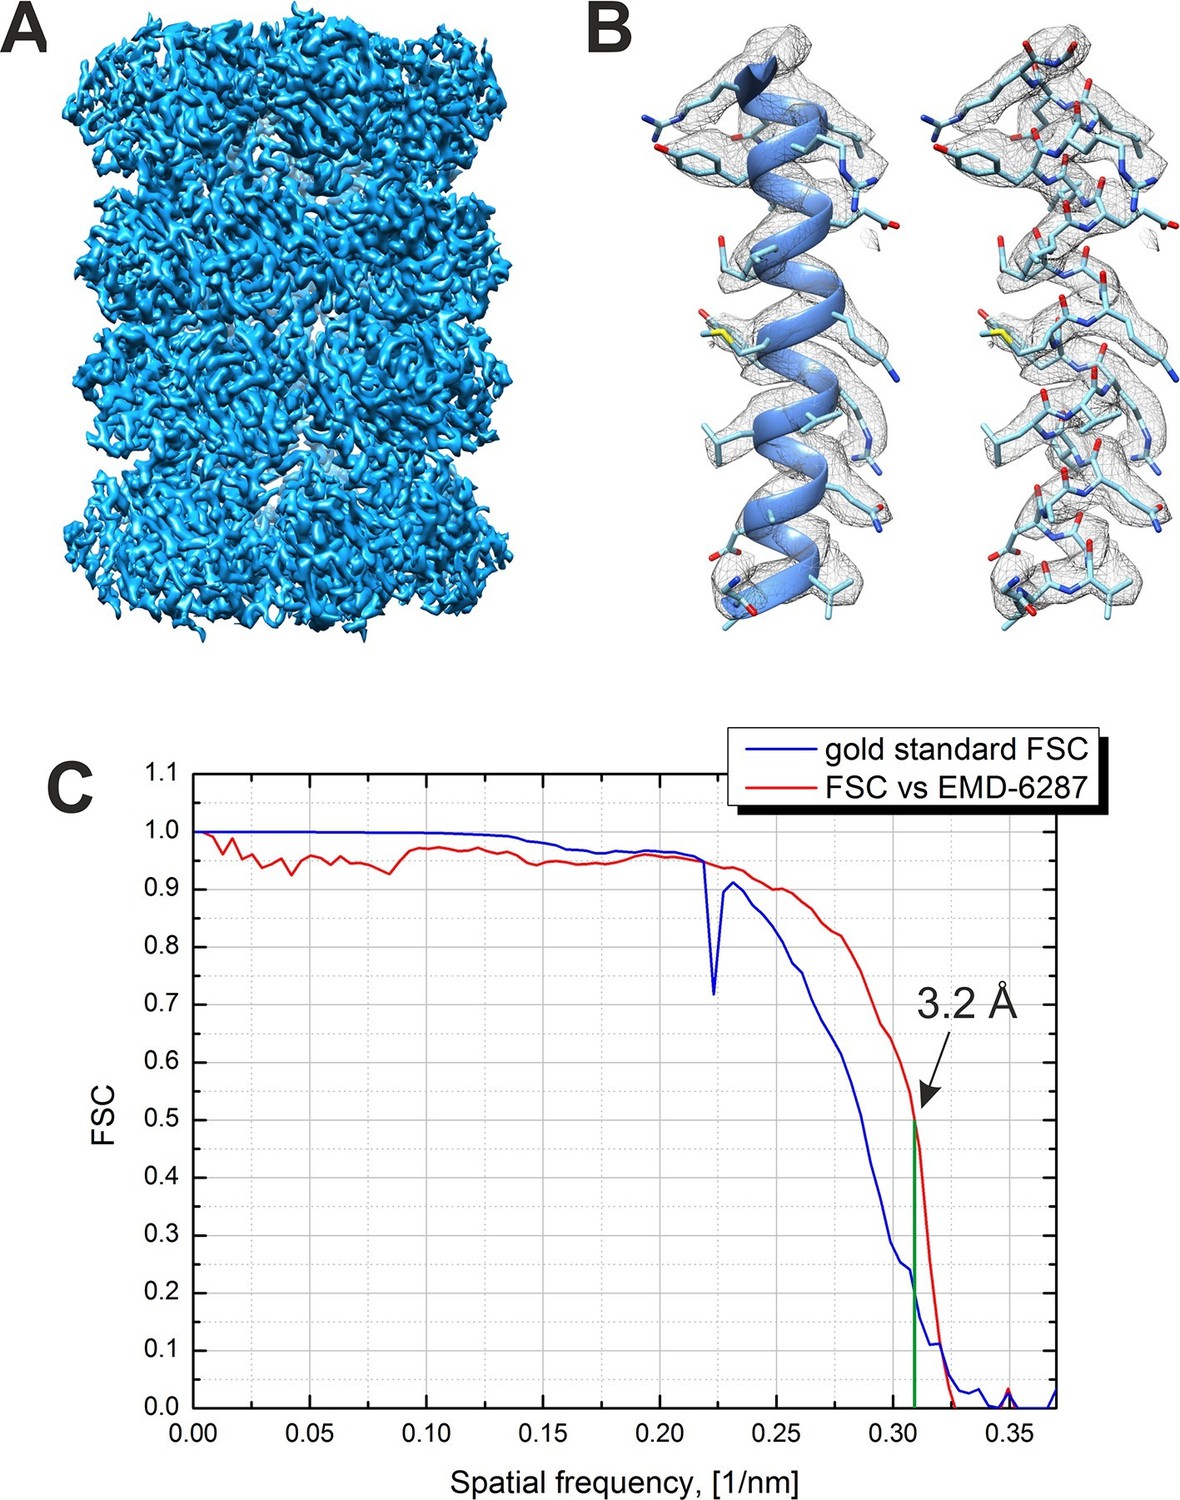
Result from the 3D reconstruction of 20S proteasome from an in-focus dataset acquired with the Volta phase plate.
(A) An isosurface representation of the density map. (B) A ribbon and a stick representations of an α-helical segment from the β subunit docked into the density map demonstrating the presence of sidechain densities. (C) Fourier shell correlation (FSC) curves from the Relion software’s internal 'gold standard' and from a comparison with an external 2.8 Å density map (EMD-6287). Both criteria indicate a resolution of 3.2 Å at a 0.143 level for the 'gold standard' FSC and at a 0.5 level for the external map. The Nyquist frequency is at 2.7 Å (0.37 1/nm).
Figure 6
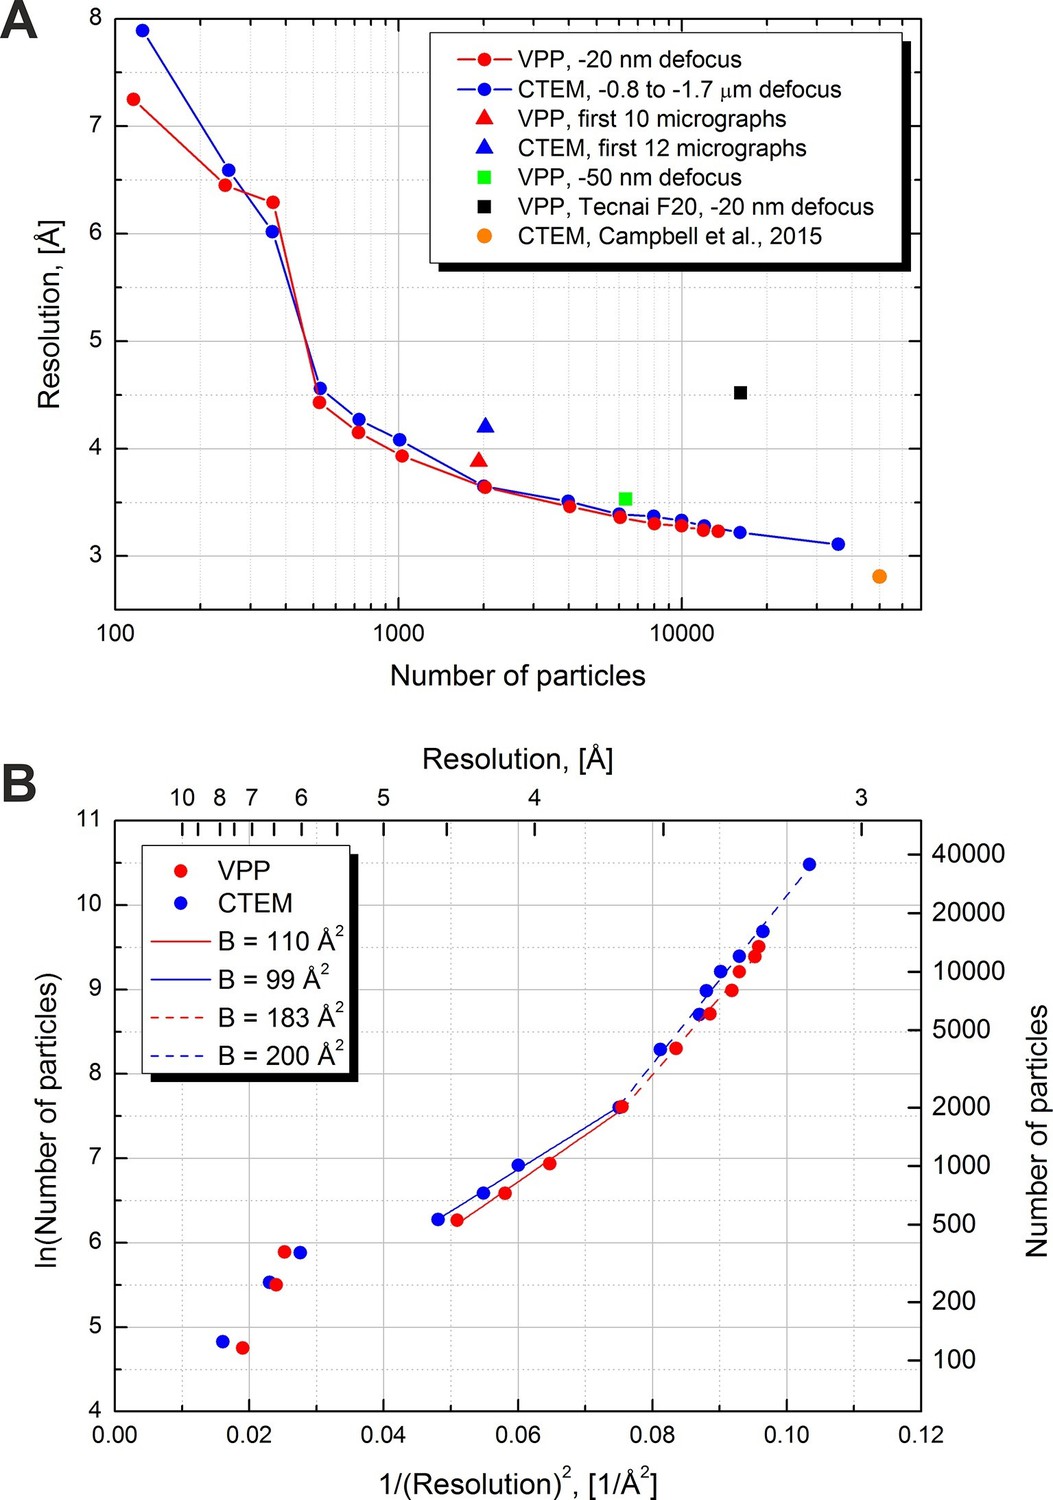
Resolution versus number of particles and B-factor estimations.
(A) Resolution versus number of particles for several datasets. The resolutions were calculated based on the 0.5 FSC level versus an external 2.8 Å density map (EMD-6287). For two of the datasets (red and blue lines) the number of particles was varied artificially by using random subsets of particles. (B) Logarithm of the number of particles versus the squared reciprocal resolution plots of the two main datasets in (A). The legend contains B-factors estimated by linear fits of two data regions.
Download links
A two-part list of links to download the article, or parts of the article, in various formats.
Downloads (link to download the article as PDF)
Open citations (links to open the citations from this article in various online reference manager services)
Cite this article (links to download the citations from this article in formats compatible with various reference manager tools)
Cryo-EM single particle analysis with the Volta phase plate
eLife 5:e13046.
https://doi.org/10.7554/eLife.13046


