Internalization and presentation of myelin antigens by the brain endothelium guides antigen-specific T cell migration
- Vrije Universiteit Medical Center, The Netherlands
Figures
Figure 1 with 2 supplements
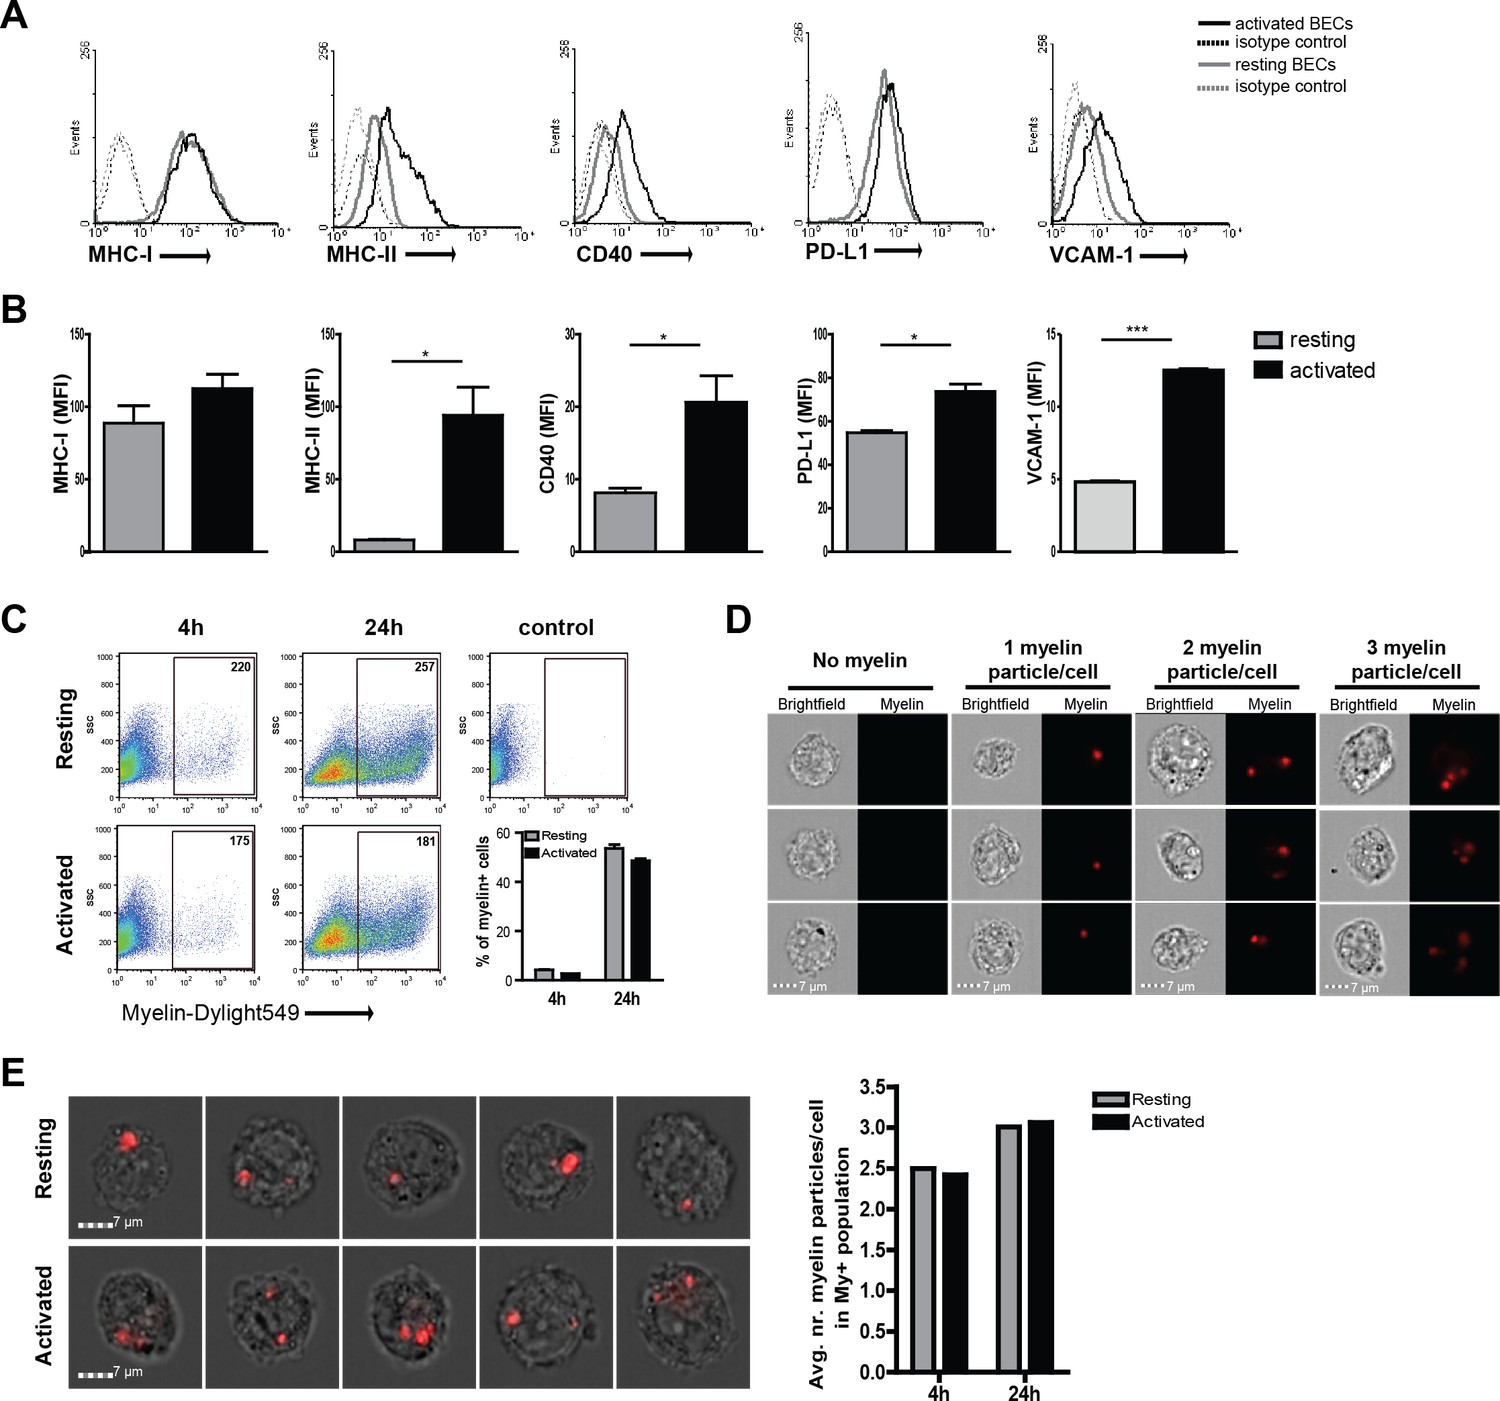
Human brain endothelial cells internalize myelin particles.
Confluent monolayers of brain endothelial cells (BECs) were stimulated with 5 ng/ml TNFα for 24 hr. (A) Expression of MHC-I, MHC-II, CD40, PD-L1 and VCAM−1 was determined by flow cytometry. Histograms depict expression of indicated markers in resting (grey solid line) and activated (black solid line) BECs. Dashed lines indicate isotype controls. (B) The MFI of expression of the indicated markers is shown. Data are presented as the mean ± SD of duplicate values (n = 5 independent experiments). *p<0.05, **p<0.01, ***p<0.001 (Student t-test). (C–E) Fluorescent labeled human myelin was added to resting or activated BECs for 4 hr or 24 hr and uptake was analyzed by (C) flow cytometry or (D–E) imaging flow cytometry. (C) Representative facs plots of myelin uptake by BECs, numbers in plots indicate the MFI of myelin-positive cells. The percentage of myelin-positive resting and activated BECs at 4 and 24 hr after loading with antigen is shown in a graph. (D–E) Myelin-positive BECs internalized between 1–3 particles/cell. On average, BECs acquired 2–3 myelin particles/cell. Activation of BECs did not affect the number of internalized particles. The average number of internalized myelin particles per cell is shown in a bar graph. Data presented are the means of triplicate values ± SEM of at least three independent experiments. *p<0.05, **p<0.01, ***p<0.001 (Student t-test).
Figure 1—figure supplement 1

Human brain endothelial cells increase MHC and costimulatory molecule expression upon activation by IFN-γ.
Confluent monolayers of brain endothelial cells (BECs) were stimulated with 10 ng/ml IFN-γ for 24 hr. Expression of MHC-I, MHC-II, CD40 and VCAM−1 was determined by flow cytometry. Histograms depict expression of indicated markers in resting (orange line) and activated (green line) BECs. Red and blue lines indicate isotype controls.
Figure 1—figure supplement 2
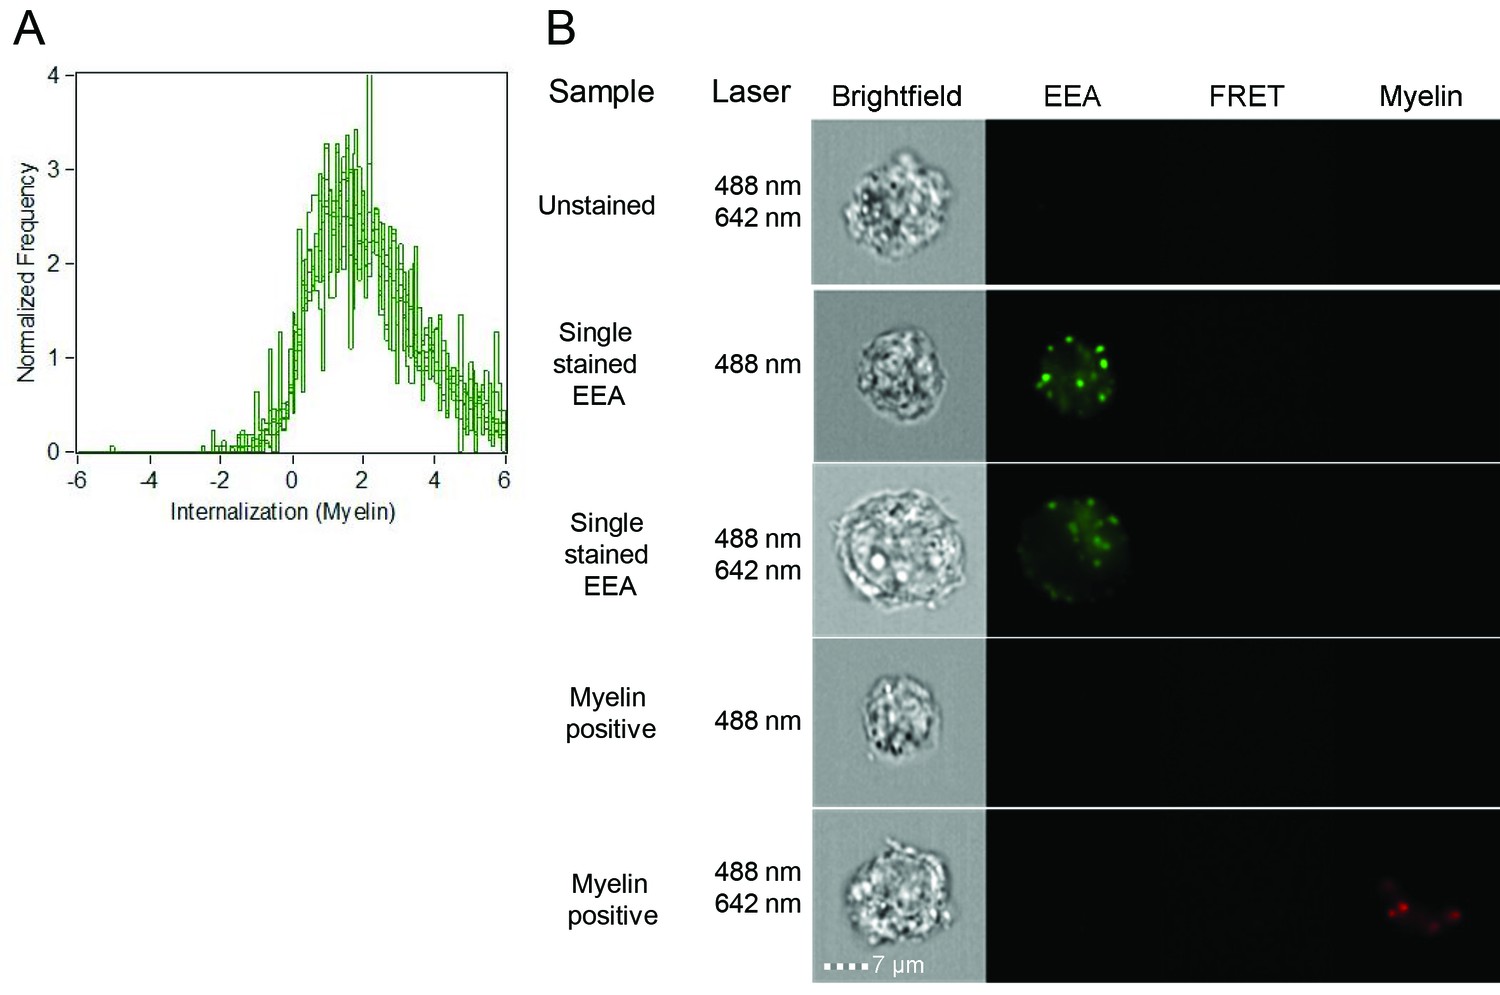
Brain endothelial cells internalize myelin particles.
BECs were loaded with fluorescently labeled human myelin and internalization of myelin particles was assessed by imaging flow cytometry. To determine internalization scores, a mask was designed based on the surface of BECs in the brightfield image. This mask was then eroded to exclude the cell membrane. The resulting mask was applied to the fluorescence channel. The internalization score, interpreted as a ratio of the intensity of the intracellular space versus the intensity of the whole cell, was calculated on this mask using the internalization feature of the Ideas v6.0 software (AMNIS Merck Millipore). Cells that have internalized antigens have positive scores, as depicted here for BECs.
Figure 2
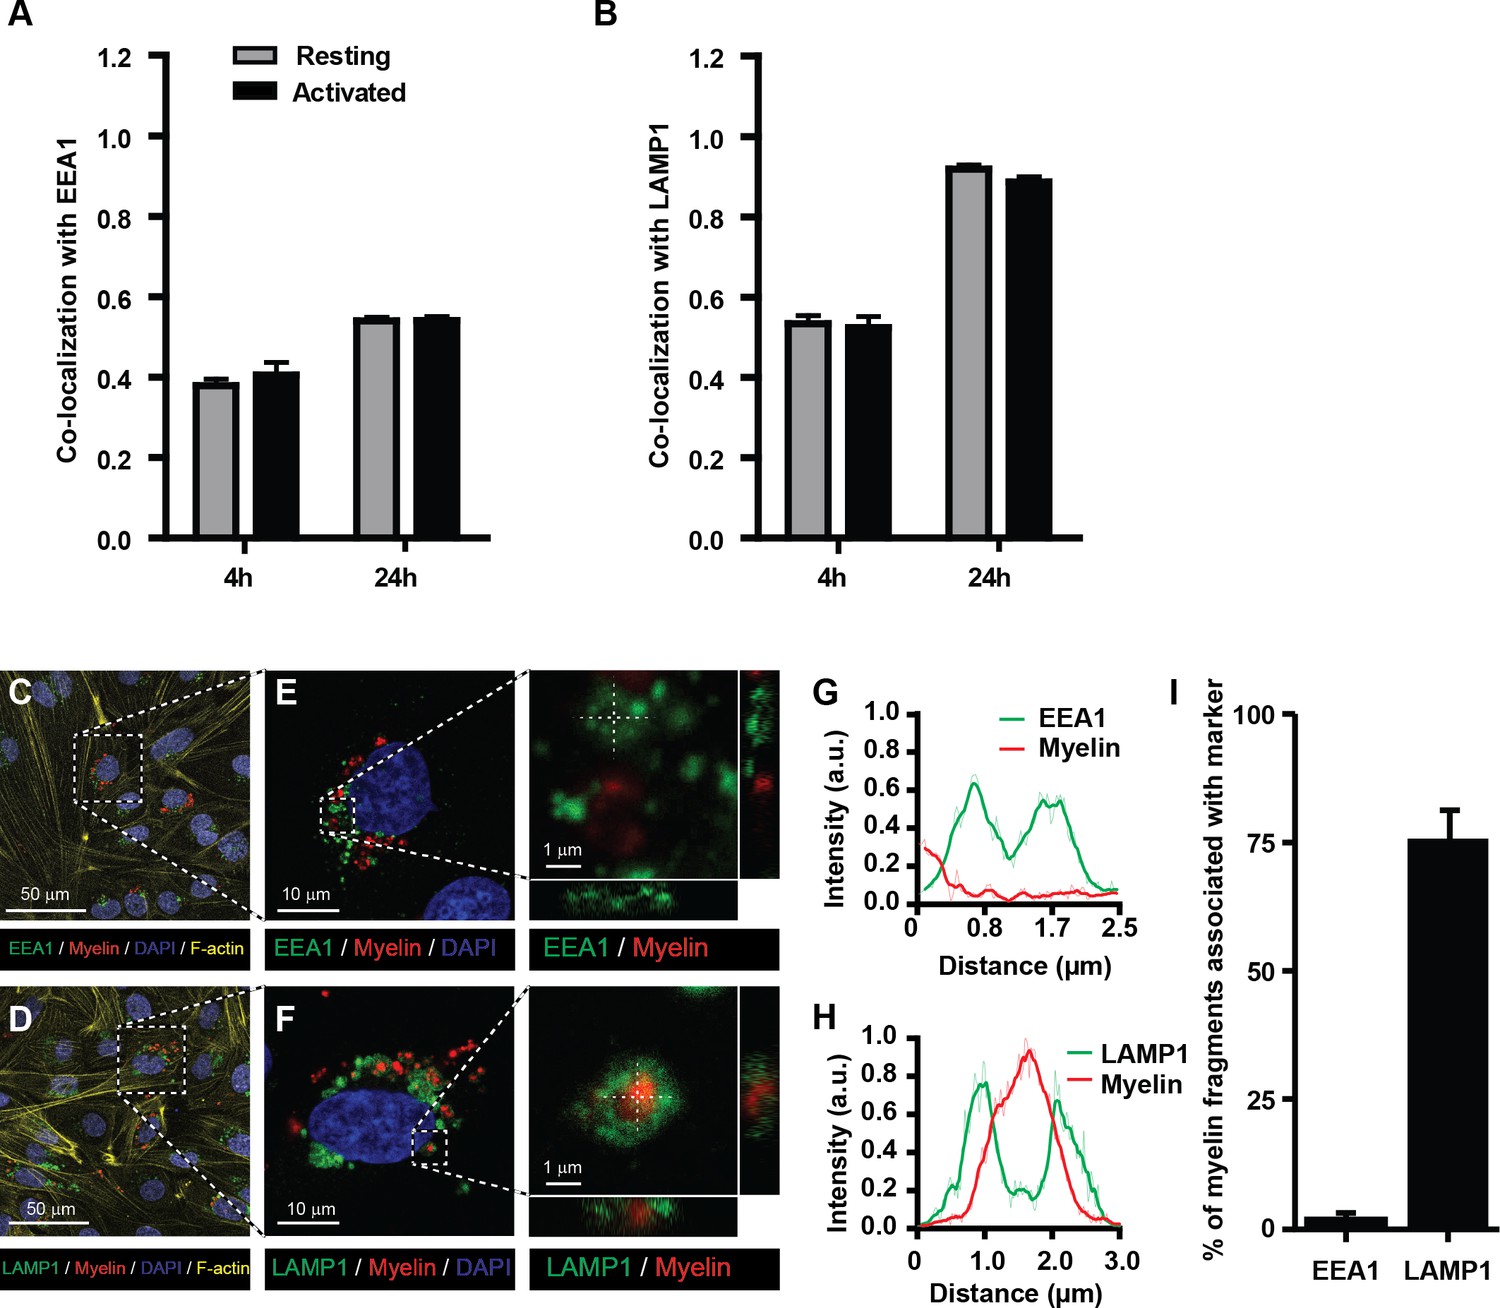
Myelin particles are preferably routed to the endo-lysosomes.
Resting or activated BECs were loaded with Atto-633 labeled myelin for 4 hr or 24 hr. Uptake of myelin particles and their co-localization with early endosomal (EEA1) or endosomal/lysosomal (LAMP1) compartments was analyzed by imaging flow cytometry and quantified using the brightfield similarity R3 feature (see methods for details). Myelin particles co-localized with (A) EEA1 and (B) LAMP1 in both resting (grey bars) and activated (black bars) BECs. Graphs represent the mean of triplicate values ± SEM of n = 3 independent experiments. (C–G) Adherent BECs were loaded with Atto−633-labeled myelin and 24 hr later, co-localization of myelin (in red) with EEA1 (in green, upper panels) or LAMP1 (in green, lower panels) was analyzed using CSLM. Nuclei were visualized with Hoechst (in blue) and the cytoskeletal F-actin bundles are shown in yellow. Representative images of adherent brain endothelial cells with subcellular localization of myelin with EEA1 (C,E) or LAMP1 (D,F). A magnification of indicated areas is shown in E–F. A cross-sectional study focusing in an myelin-rich area demonstrates the presence of the antigen surrounded by LAMP1 staining, indicating its presence within lysosomes. (G–H) Histograms were created for a selected area (indicated by a line) using ImageJ software (NIH, USA). Histograms were created from each fluorochrome and overlays were made by the program. (I) Quantification of myelin positive early-endosomal and lysosomal compartments. Percentage of myelin fragments associated with each marker was determined using ImageJ software (N = 6).
Figure 3
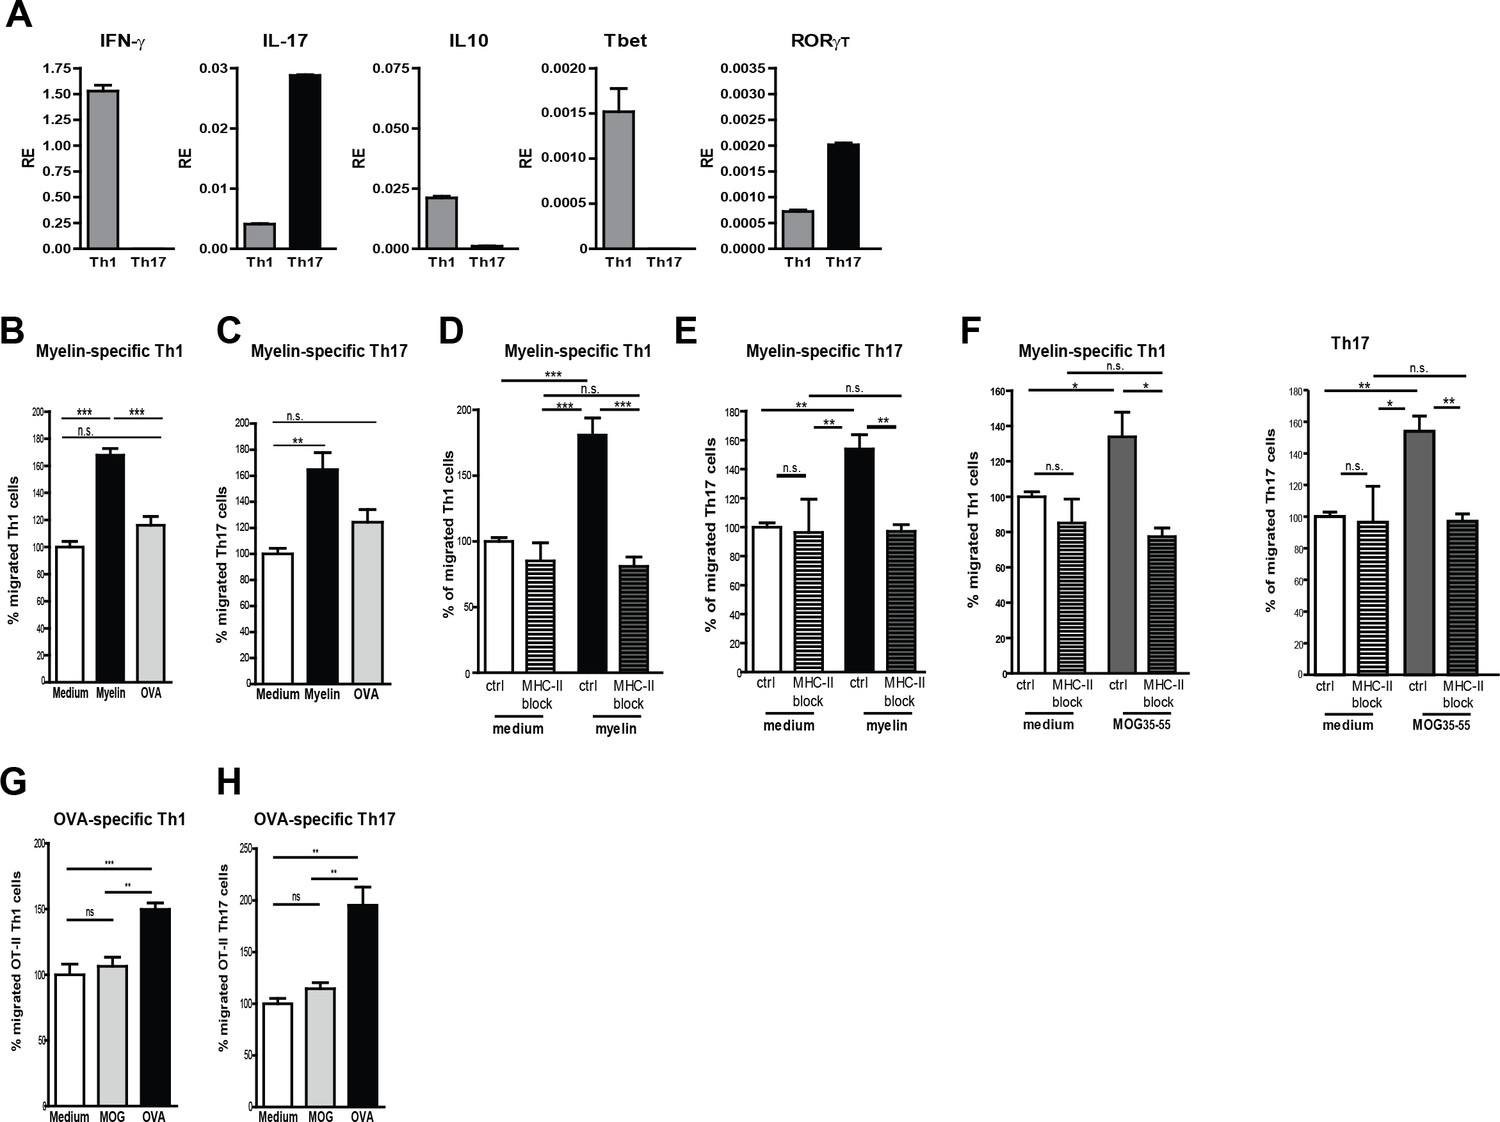
Migration of myelin-specific T-cells depends on presentation of myelin-antigens in MHC-II by BECs.
(A) Th1 and Th17 subsets were generated in-vitro from naive CD4+CD62Lhigh 2D2 T cells. Expression of IFN-γ, Il−17, IL−10, T-bet and RORγT was determined using qRT-PCR. Data are the means of triplicate values ± SEM of three independent experiments. (B) mBECs were seeded onto trans-wells, activated with TNFα and loaded with myelin for 24 hr. As a control, BECs loaded with the CNS-unrelated antigen OVA or unloaded BECs were used. (B) Th1 or (C) Th17 2D2 T-cells were added to the upper compartment and T-cell migration was quantified by flow cytometry 3 hr later using fluorescent labelled beads as reference. To block antigen recognition by T-cells, an MHC-II blocking antibody was added to mBECs one hour prior addition of the (D) Th1 or (E) Th17 cells. The MHC-II blocking antibody was present during the 3 hr incubation with the T-cells. (F) Transmigration of Th1 and Th17 cells over a monolayer of MOG35-55 pulse-loaded activated mBECs was analyzed using Transwells. Migration was assessed in the presence of an MHC-II blocking antibody or control antibody. *p<0.05, **p<0.01, ***p<0.001 (ANOVA with Bonferroni correction). The average frequency of T cells that transmigrated in the control setting are 10.8% ± 1.2 for 2D2 Th1 and 11.6% ± 0.4 for 2D2 Th17. (G,H) Th1 and Th17 subsets were generated in-vitro from naive CD4+CD62Lhigh OT-II T cells. mBECs were seeded onto trans-wells, activated with TNF and loaded with OVA for 24 hr. As a control, BECs loaded with MOG35-55 or unloaded BECs were used. Th1 (G) or Th17 (H) OT-II T-cells were added to the upper compartment and T-cell migration was quantified by flow cytometry 3 hr later using fluorescent labelled beads as reference. Average frequency of OT-II Th1 and OT-II Th17 that transmigrated in the control settings are 7.9% ± 1.9 and 12.5% ± 1.4, respectively.**p<0.01, ***p<0.001 (ANOVA with Bonferroni correction).
Author response image 1

Confluent human brain endothelial cells form an impermeable barrier.
The human brain endothelial cells (cell line hCMEC/D3) were cultured on Ibidi-slides. After reaching confluence, cells were washed, fixated with 4% formaldehyde and stained with FITC-labeled antibodies specific for A. the tight junction protein Claudin-5 (green). Nuclei were visualized using Hoechst (blue) or B. the adherens junction protein VE-Cadherin (green) and subsequently cells were analyzed by confocal laser scanning microscopy. From the images it is clear that both Claudin-5 and VE-Cadherin are highly present at cell-cell contacts, indicative of tight barrier formation by the brain endothelial cells.
Author response image 2
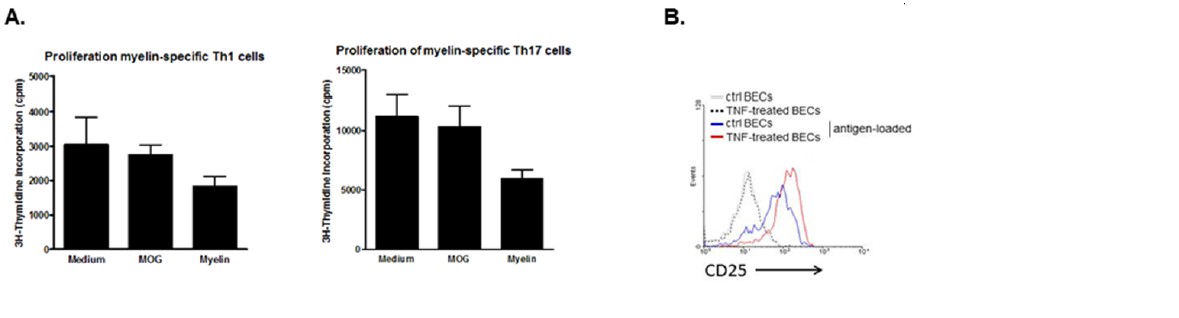
Induction of T cell activation but not proliferation by brain endothelial cells.
(A) Brain endothelial cells were loaded with myelin or MOG35-55 in the presence of TNF and subsequently co-cultured with in vitro generated myelin-specific Th1 or Th17 cells. As a control, none antigen loaded TNF activated brain endothelial cells were used. Proliferation of T cells was determined by incorporation of 3H-Thymidine, which was present during the last 18h of a three day culture period. (B) Activation of T cells was determined by analyzing expression of CD25 after 24 hr co-culture with brain endothelial cells that were pulsed with antigen in the presence or absence of TNF prior. Controls included brain endothelial cells that were treated with TNF or medium. Expression of CD25 on T cells was determined using flow cytometry.
Author response image 3
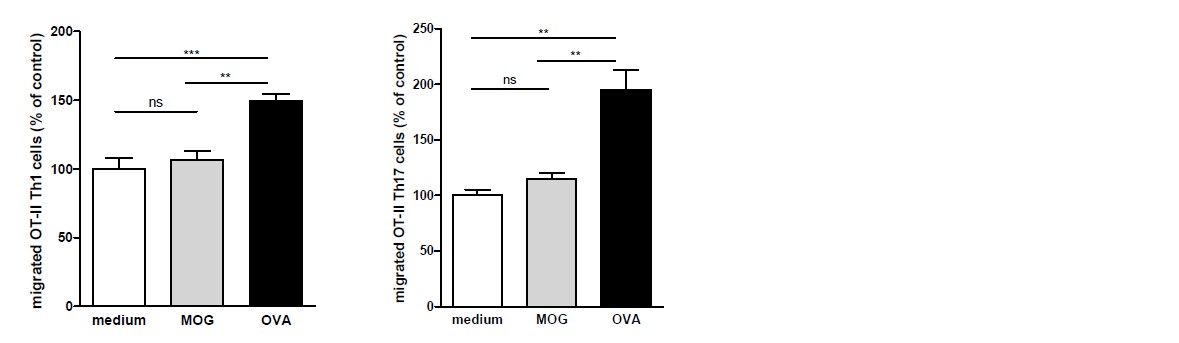
OVA-specific T-cells only transmigrate upon encounter of BECs presenting OVA-antigens in MHC-II.
Th1 and Th17 subsets were generated in-vitro from naive CD4+CD62Lhigh OT-II T cells. mBECs were seeded onto trans-wells, activated with TNF and loaded with OVA for 24h. As a control, BECs loaded with MOG35-55 or unloaded BECs were used. Th1 (left graph) or Th17 (right graph) OT-II T-cells were added to the upper compartment and T cell migration was quantified by flow cytometry 3h later, using fluorescent labelled beads as reference. **p<0.01, ***p<0.001 (ANOVA with Bonferroni correction).
Author response image 4
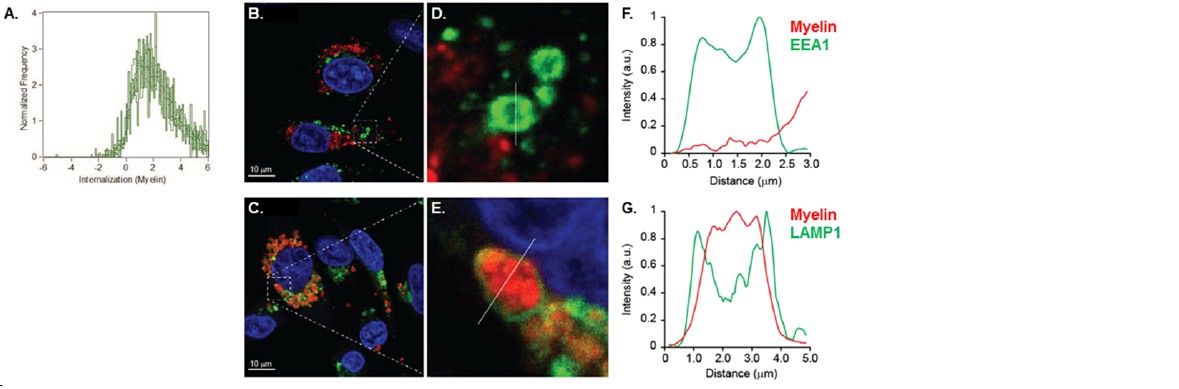
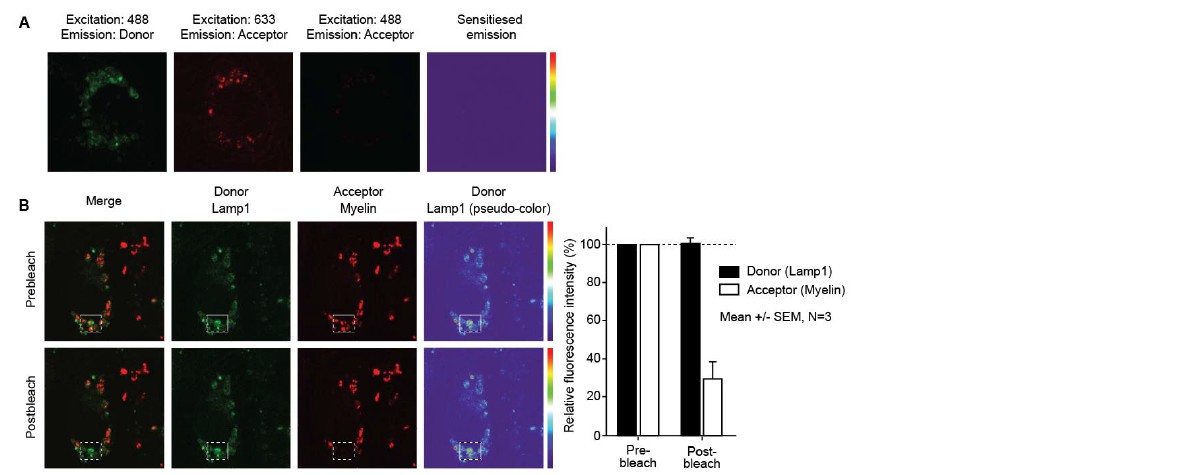
Myelin is internalized and routed to lysosomal compartments by brain endothelial cells.
(A) BECs were loaded with Atto 633-labeled human myelin for 24h and internalization of myelin particles was assessed by imaging flow cytometry. To determine internalization scores, a mask was designed based on the surface of BECs in the brightfield image. This mask was then eroded to exclude the cell membrane. The resulting mask was applied to the fluorescence channel. The internalization score, interpreted as a ratio of the intensity of the intracellular space versus the intensity of the whole cell, was calculated on this mask using the internalization feature of the Ideas v6.0 software (AMNIS Merck Millipore). Cells that have internalized antigens have positive scores, as depicted here for BECs. (B-G) Adherent brain endothelial cells were incubated with Atto-633-labeled myelin and 24h later, co-localization of myelin (Red) with early endosomal (EEA1, Green, upper panels) or endosomal/lysosomal (LAMP1, Green, lower panels) compartments was analyzed using CSLM. Nuclei were visualized with Hoechst (blue). Representative images of adherent brain endothelial cells with subcellular localization of Myelin with EEA1 (or LAMP1 (C). A magnification of indicated areas is shown in D B)+E. F+G. Histograms were created for a selected area (indicated by a line) using ImageJ software (NIH, USA). Histograms were created from each fluorochrome and overlays were made by the program. Histograms clearly show the lack of association of myelin with early endosomes but the enclosure of myelin within LAMP1 positive vesicles.
Author response image 5
Human brain endothelial cells increase MHC and costimulatory molecule expression upon activation by IFN-γ.
Confluent monolayers of brain endothelial cells (BECs) were stimulated with 10 ng/ml IFN-γ for 24 hr. Expression of MHC-I, MHC-II, CD40 and VCAM-1 was determined by flow cytometry. Histograms depict expression of indicated markers in resting (orange line) and activated (green line) BECs. Red and blue lines indicate isotype controls.
Author response image 6
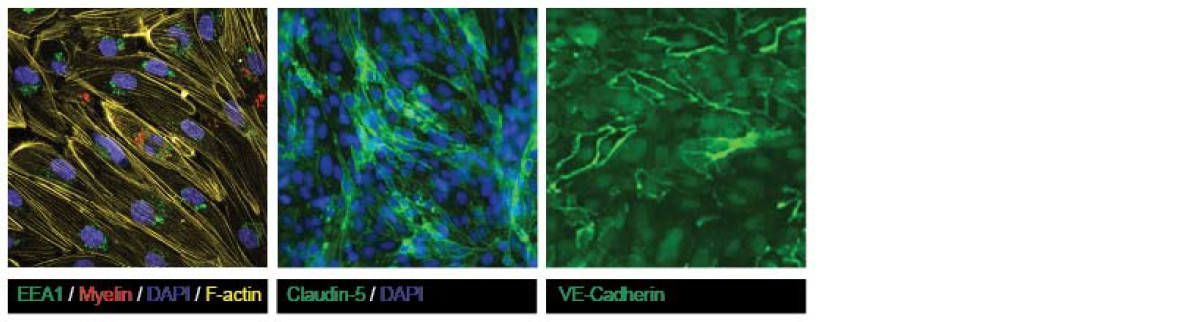
Confluency of cultured brain endothelial cells shown using F-actin, Claudin-5 and VE-Cadherin staining on samples shown in Figure 2 of the manuscript.
https://doi.org/10.7554/eLife.13149.013
Author response image 7
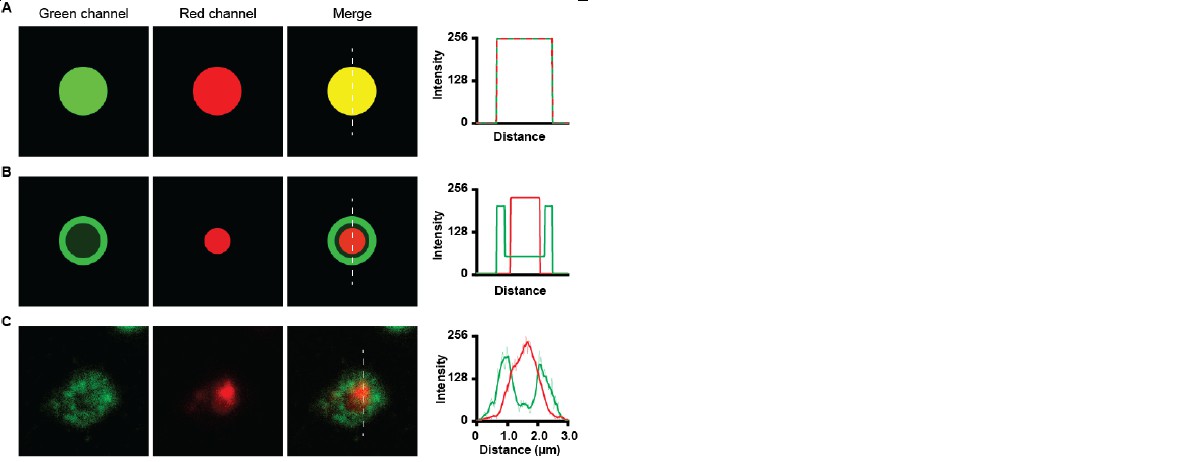
Co-localization of green and red channels.
(A) co-localization of high intensity green and high intensity red image shows a yellow merge image. Histogram shows overlap of intensities. (B) Co-localization of low intensity green dot with bright green ring with a high intensity red dot, Merge image does not show yellow colour. Histogram shows high intensity of green channel at the ring and high intensity of red channel at the inside. (C) Green LAMP1 positive lysosome shows high intensity border and lower intensity lumen together with high intensity myelin in red. The merge image does not appear yellow.
Author response image 8
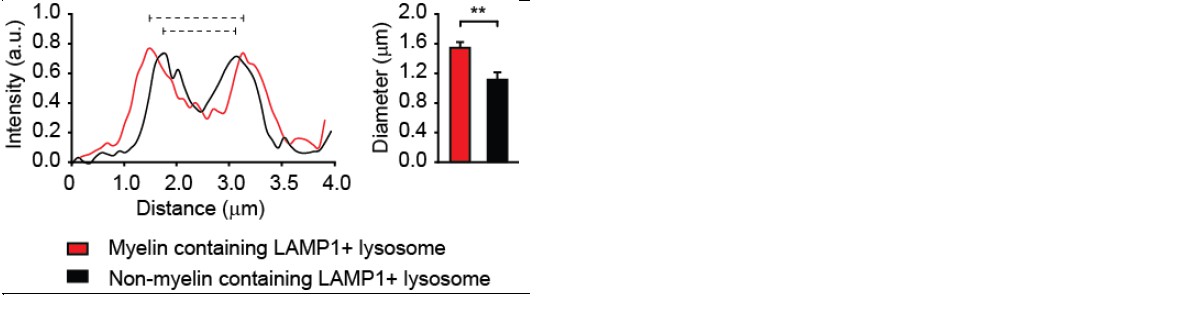
Average size of lysosomes in myelin-loaded brain endothelial cells.
The diameter of lysosomes was determined using ImageJ software and shown as histograms. The average size of 5 lysosomes per cell of a total of 10 cells that contain myelin is compared with that of none myelin containing lysosomes and represented in the bar graph.
Download links
A two-part list of links to download the article, or parts of the article, in various formats.
Downloads (link to download the article as PDF)
Open citations (links to open the citations from this article in various online reference manager services)
Cite this article (links to download the citations from this article in formats compatible with various reference manager tools)
Internalization and presentation of myelin antigens by the brain endothelium guides antigen-specific T cell migration
eLife 5:e13149.
https://doi.org/10.7554/eLife.13149


