Temporal modulation of collective cell behavior controls vascular network topology
- Harvard Medical School, United States
- University of Sao Paulo, Brazil
Figures
Figure 1

Calibrated computational model predicts delayed tip cell selection in the absence of Sema3E-Plexin-D1 signaling.
(A) Whole-mount vascular staining (Isolectin B4) of retinas from Sema3e-/- and wildtype littermates at P4. The mutant vasculature exhibits a reduced number of tip cells and branching points (asterisks) and an uneven growth front (arrows and arrowheads). Scale bar: 500 μm. (B) Feedback between the VEGF/Notch and Sema3E-Plexin-D1 signaling pathways included in the extended agent-based computational model of tip cell selection. D1-D4: transcriptional delays. r1-r3: recovery delays representing degradation. δ, s, σ: change in expression levels in response to receptor activation. (C) Simulated tip cell selection. Colors represent Dll4 levels on a continuum from purple (low) to green (high). The red boxes highlight a time frame in which a salt and pepper pattern has formed in the control vessel, while in the absence of Sema3E-Plexin-D1 signaling, only few early tip cells have been selected. (D) Average number of selected tip cells in simulated vessels. At a timepoint where the simulated control vessel (black line) already exhibits an alternating pattern of tip and stalk cells, the simulated vessel lacking Sema3E-Plexin-D1 signaling (blue line, for a given set of parameter values: δ =5, s=3) shows a 50% reduction in tip cells. Thin lines: standard deviation. n=50. (E) In silico Dll4 levels in single endothelial cells during simulated tip cell selection. In the control situation (top), Dll4 levels quickly stabilize. In the absence of Sema3E-Plexin-D1 signaling (bottom) Dll4 levels fluctuate in near synchrony before they finally stabilize.
Figure 2
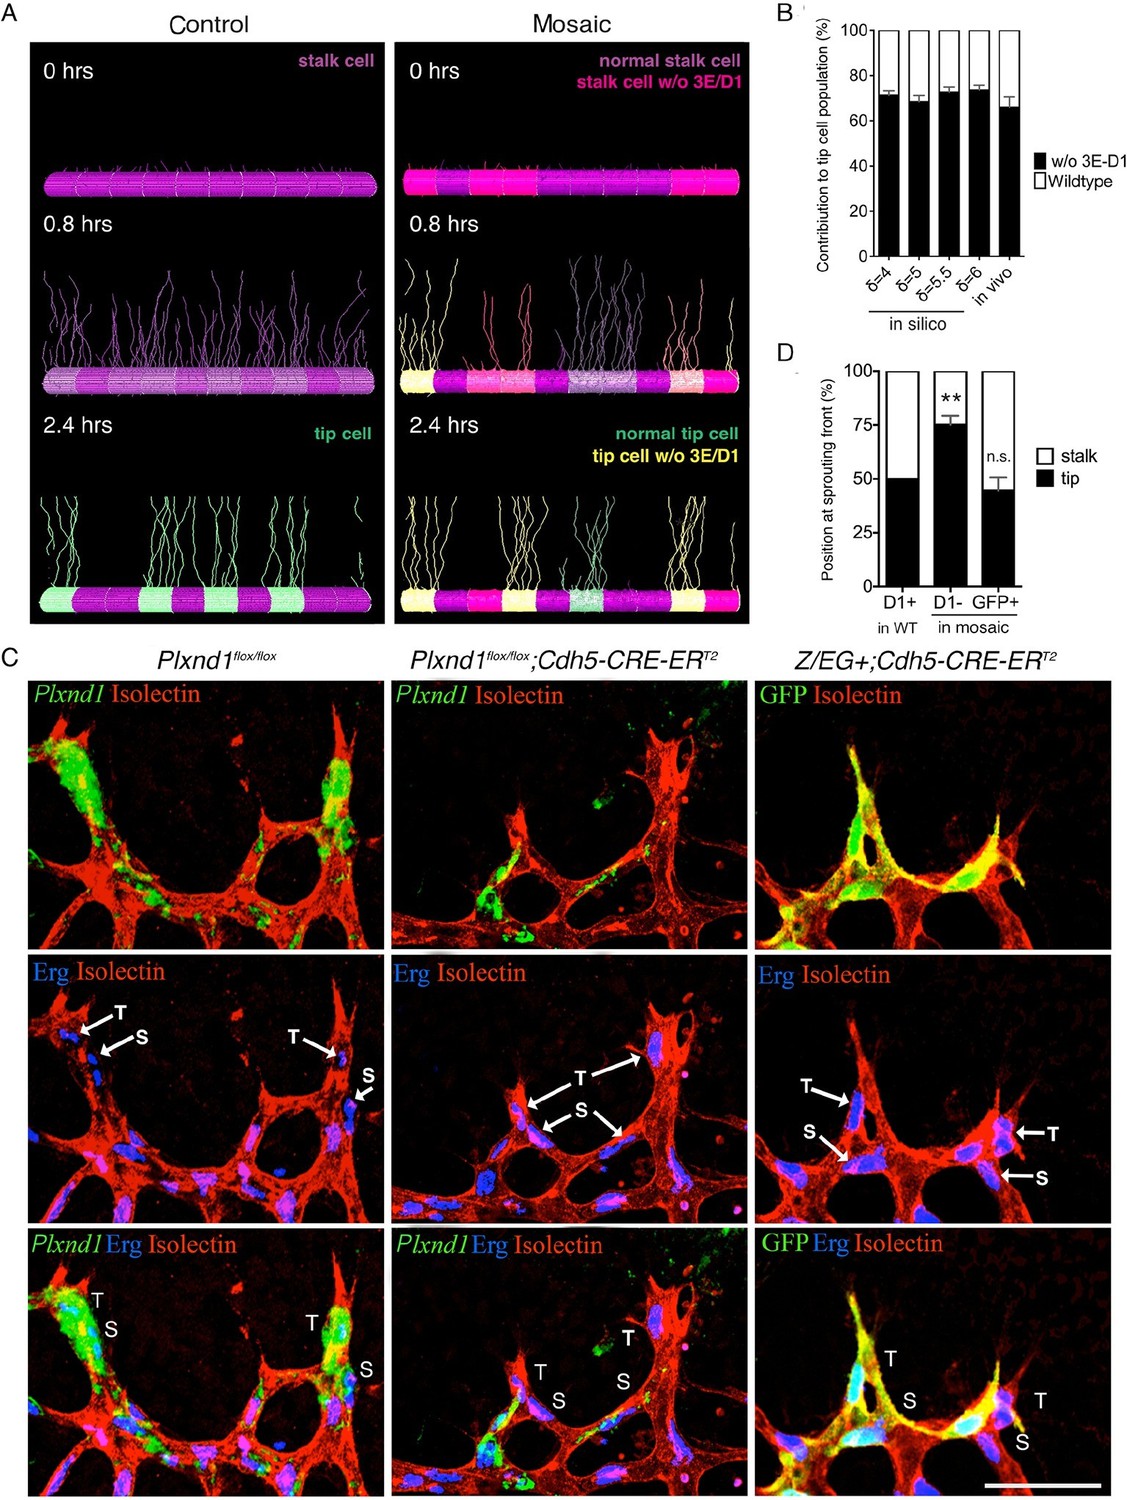
Sema3E-PlexinD1 signaling is cell-autonomously required to suppress tip cell identity.
(A) Simulated tip cell selection in a mosaic vessel with 50% mutant cells placed randomly. Cells without Sema3E-Plexin-D1 signaling are indicated by bright pink color, which turns to yellow if Dll4 levels increase. For wildtype cells: purple = low Dll4, pink = high Dll4. (B) Comparison of simulated and in vivo contribution to the tip cell population by cells lacking Sema3E-Plexin-D1 signaling at 45% mosaicism. A range of δ values simulates different strengths of loss of Sema3E-Plexin-D1 signaling. Simulations, n=50, in vivo, n=6. Data is represented as mean +/- SEM. (C) Analysis of the occupation of tip or stalk cell position by Plxnd1 expressing wildtype cells in control retina (left), and Plxnd1-/- cells (middle) or GFP+ cells (right) in mosaic retinas at P5. Red: vascular membrane staining (Isolectin B4), blue: vascular nuclear staining (α-ERG), green: in situhybridization (left, middle), α-GFP staining (right). (D) Quantification of c. n.s.= not significant, **p=0.0033. WT retinas, n=6; Plxnd1-/- mosaic retinas, n=6; GFP+ mosaic retinas, n=4. Scale bar: 50 μm. Data is represented as mean +/- SEM.
Figure 3
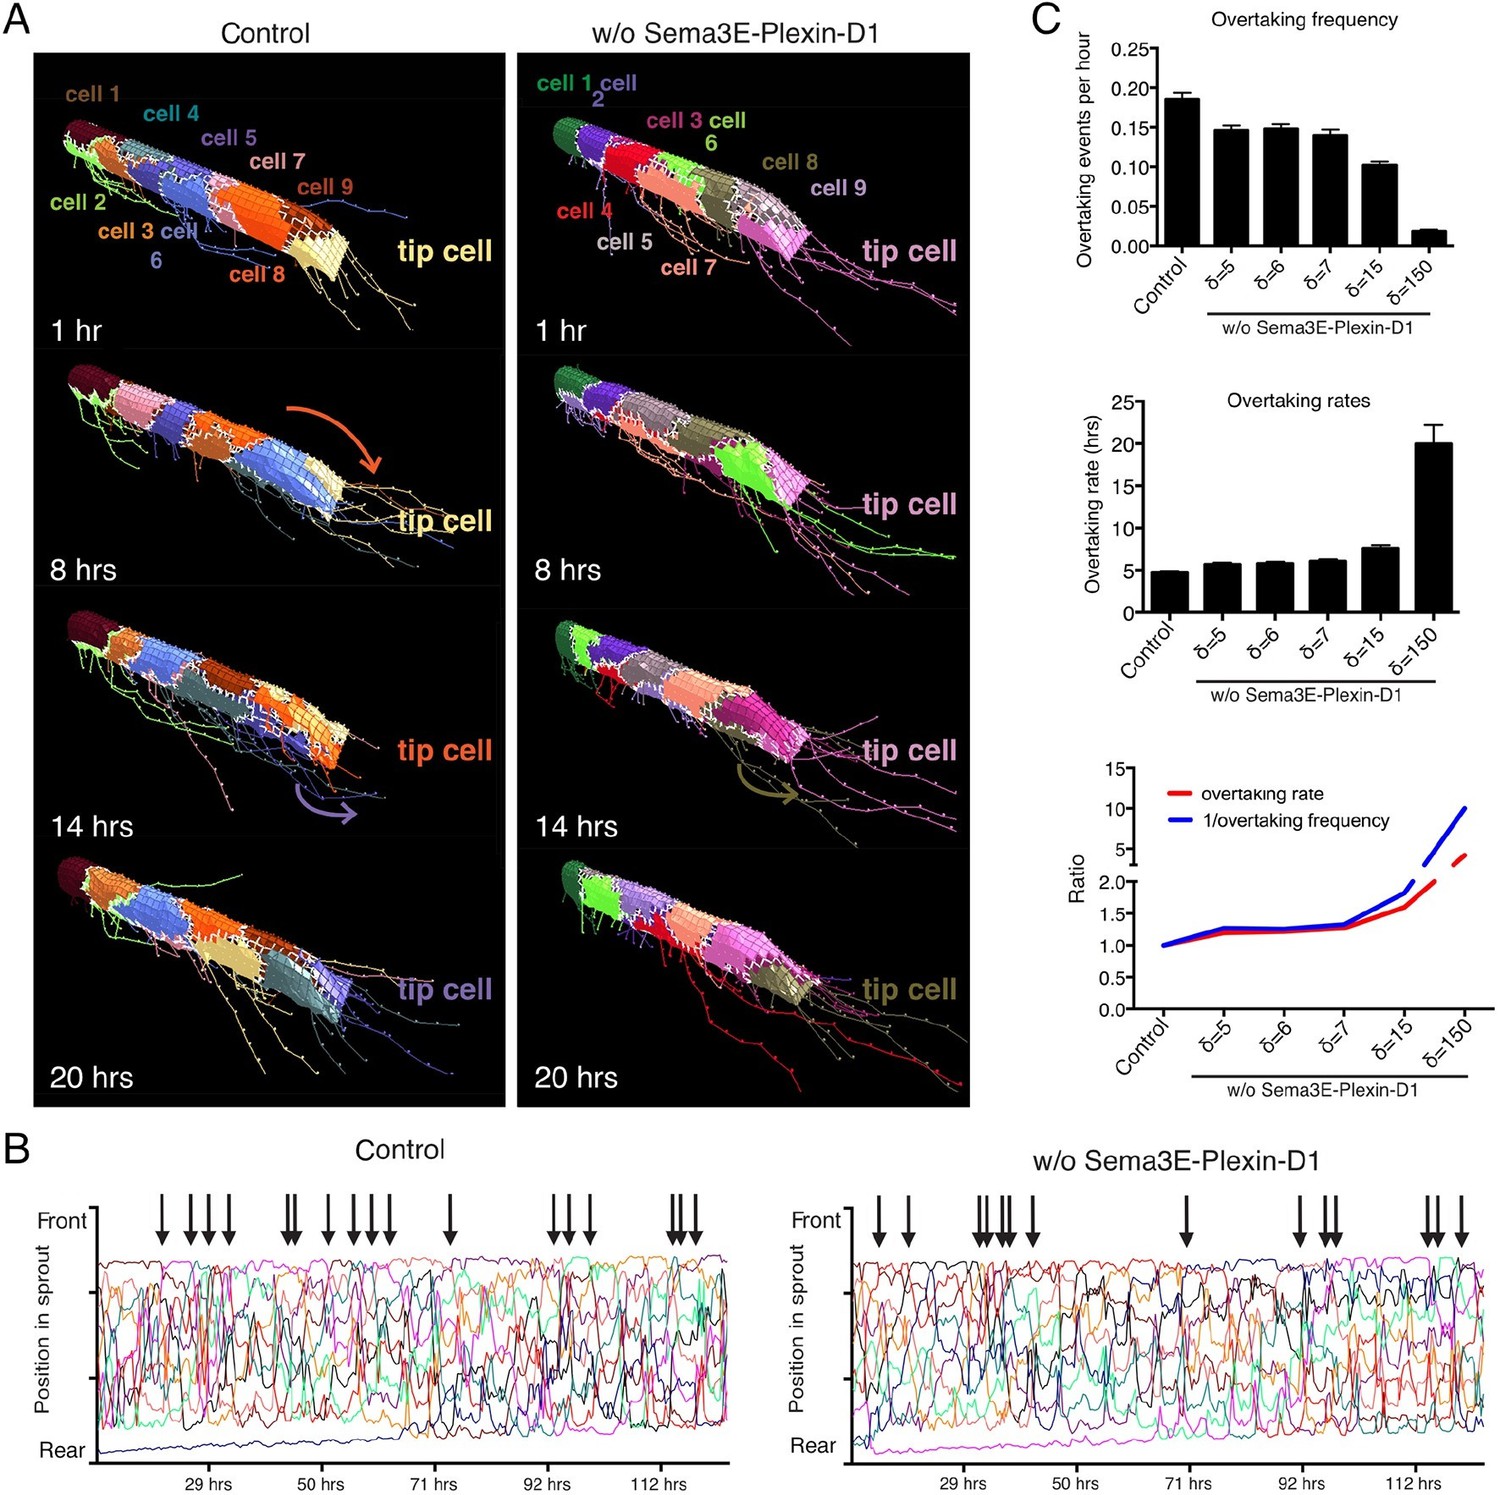
Computational simulation predicts that lack of Sema3E-Plexin-D1 signaling leads to prolonged tip cell occupancy and reduced tip cell overtaking frequency.
(A) Single frames of cell rearrangements in simulated sprouts of 10 cells. VEGF gradient extends in direction of vessel. (B) Kymograph plots of cell rearrangements in simulated sprouts. Each line represents one endothelial cell. Arrows indicate overtaking events at the tip cell position in a and b. (C) Quantification of overtaking events at the tip cell position in the presence and absence of Sema3E-Plexin-D1 signaling. A range of δ values simulates different strengths of loss of Sema3E-Plexin-D1 signaling. The setting δ=5, which matched loss of Sema3E-Plexin-D1 signaling in other conditions in the paper exhibits a 1.26 slower tip cell overtaking frequency (events/hour.) As δ increases there is a clear trend towards slower tip cell overtaking across δ values. Data is presented as mean +/- SD, n=50.
Figure 4 with 3 supplements
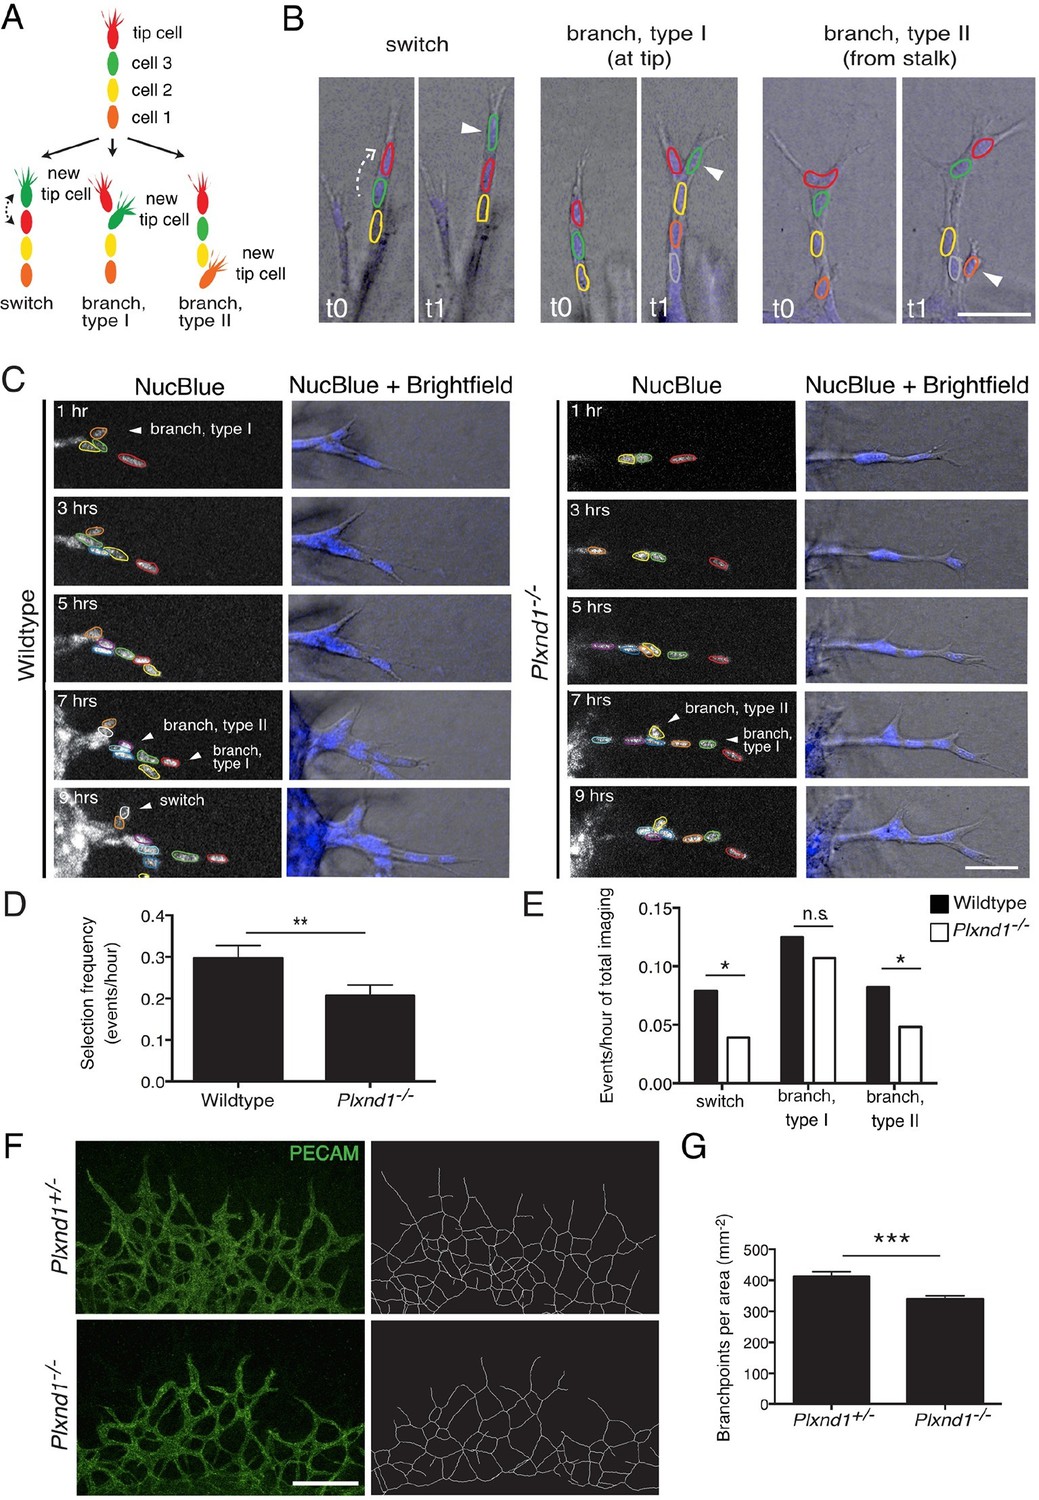
Endothelial cell live tracking in ex vivo lung explants reveals a reduction in tip cell selection frequency and a less branched lung vascular network in the absence of Sema3E-Plexin-D1 signaling.
(A) Different types of tip cell selection events observed during live imaging. (B) Single frames from live imaging experiments illustrating the different types of tip cell selection events. Arrowheads point out the newly selected tip cells. Nuclei: blue. Scale bar: 50 μm. (C) Long-term live imaging experiments of vascular sprouts from wildtype and Plxnd1-/- lung explants. Single planes from z-stacks are shown. Arrowheads indicate a tip cell selection event. Nuclei: blue (top and middle), white (bottom). Individual nuclei are outlined by different colors in the middle panel. (D) Quantification of tip cell selection frequency calculated as events per hour. Tip cell selection frequency is reduced by factor 1.5 in sprouts from Plxnd1-/- explants. WT, n=24 sprouts from 12 explants. Plxnd1-/-, n=30 sprouts from 11 explants. Data is represented as mean +/- SEM. (E) Quantification of tip cell selection frequency calculated as incidence of events in each category as illustrated in (A) during total imaging time. **p=0.013 (D), *p=0.029 (e ‘switch’), 0.041 (e ‘branch, type II’), permutation test with shuffled genotypes. (F) Vascular sprouts originating from Plxnd1+/- and Plxnd1-/- lung explants on day 3. Left: whole-mount vascular staining (green, PECAM), right: reconstructed/skeletonized network, Scale bar: 250 μm. (G) Quantification of branching points per area. The number of branching points is significantly reduced in Plxnd1-/- lung explants. Data is represented as mean +/- SEM. Plxnd1+/-, n=7 explants; Plxnd1-/-, n=6 explants. ***p=0.0005, permutation test with shuffled genotypes.
Figure 4—figure supplement 1
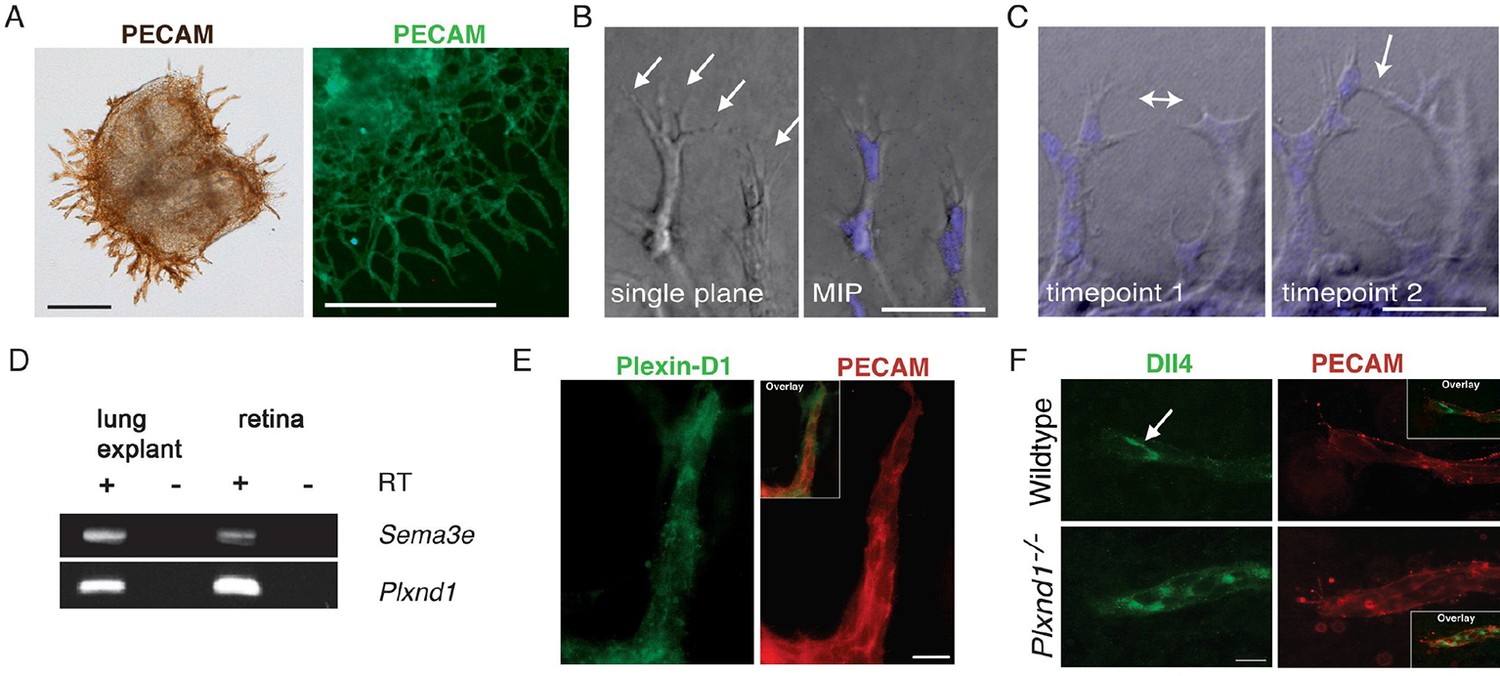
The ex vivo sprouting assay.
(A) Sprouts originating from the lung explant express endothelial specific marker PECAM. Explants at day 1 (left) and day 3 (right) are shown. Scale bar: 300 μm. (B) Tip cells extend filopodia (arrows) into the collagen matrix. Scale bar: 50 μm. (C) Anastomosis: a new connection (arrow) is formed between neighboring sprouts. Scale bar: 50 μm (D) Sema3e and Plxnd1 are expressed by embryonic lung explants as shown by RT PCR. (E) Sprouting endothelial cells express Plexin-D1 (green). PECAM staining shown in red. Scale bar: 10 µm. (F) In wildtype endothelial sprout Dll4 (green) localized in the tip cells (arrow). Dll4-positive area is increased in Plxnd1-/- explants. Scale bar: 10 µm.
Figure 4—figure supplement 2

Computational method used for vascular network analysis.
The region of interest (ROI) was defined as the vascular network originating from the lung explants. Vasculature inside the lung tissue was excluded from the analysis. Stacks of confocal images were binarized and then skeletonized by thinning. Branching points were identified as skeleton pixels with at least three neighbors and quantified to characterize the vascular network. The 2D images shown are the maximum intensity z-projections of the original 3D stacks, except for the binary image, which is an intensity sum z-projection.
Figure 4—figure supplement 3
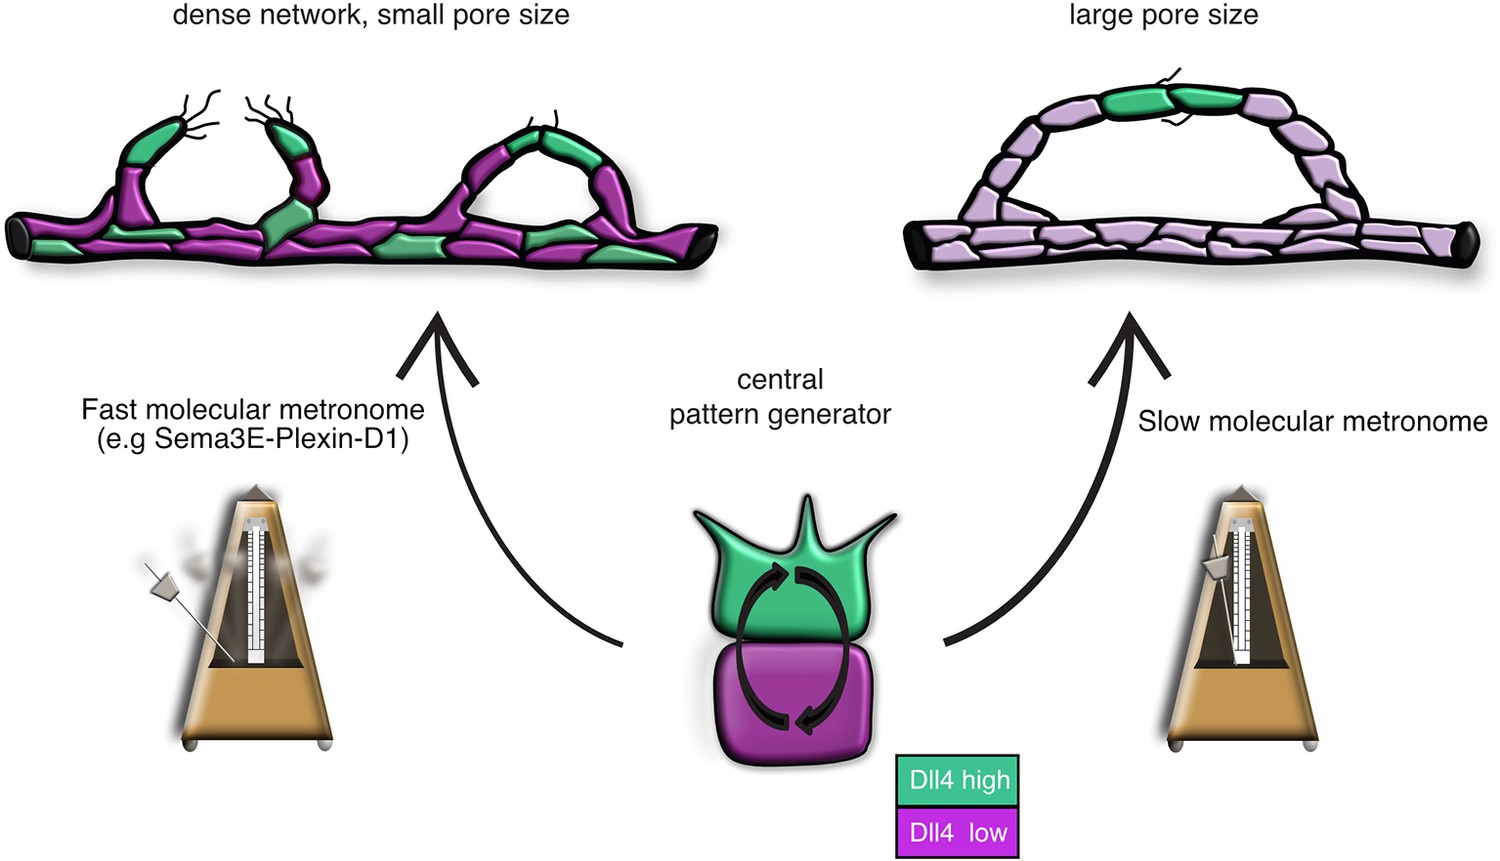
Model: Modifications of the central pattern generator lead to the formation of diverse vascular topologies.
The unique topologies of organ-specific vascular networks are dependent on the tight temporal control of the tip cell selection process. The VEGF-Notch lateral inhibition pathway is the central pattern generator of tip cell selection. We suggest that in different tissues, specific target-derived signals functioning as 'molecular metronomes' regulate the pace of the pattern generator to ensure the formation of networks that cater each tissue’s specific need. A 'fast molecular metronome' (e.g. Sema3E-Plexin-D1 signaling) will speed up the Dll4/Notch feedback loop and increase the frequency of tip cell selection, leading to the formation of a dense network with a small pore size, while a 'slow molecular metronome' will slow down the Dll4/Notch feedback loop and decrease the tip cell selection frequency, resulting in a network with larger pore sizes.
Videos
Video 1
Calibration of time delay parameters (induction of Plexin-D1, reduction of Dll4 levels).
Simulation of tip cell selection with Sema3E-Plexin-D1 related regulatory time delays equal to the time it takes for pVEGFR-2 to up-regulate Dll4 (D3+D4=D1). Color indicates cell Dll4 levels (green = high, purple = low).
Video 2
Calibration of time delay parameters (induction of Plexin-D1, reduction of Dll4 levels).
Simulation of tip cell selection with Sema3E-Plexin-D1 related regulatory time delays slightly slower than the time it takes for pVEGFR-2 to up-regulate Dll4 (D3+D4=D1+1). Dll4 levels flash irregularly between very high and very low with no stable selection possible. Color indicates cell Dll4 levels (green = high, purple = low).
Video 3
Calibration of time delay parameters (induction of Plexin-D1, reduction of Dll4 levels).
Simulation of tip cell selection with Sema3E-Plexin-D1 related regulatory time delays slightly faster than the time it takes for pVEGFR-2 to up-regulate Dll4 (D3+D4=D1-1). Dll4 levels flash irregularly between very high and very low with no stable selection possible. Color indicates cell Dll4 levels (green = high, purple = low).
Video 4
Calibration of Plexin-D1 degradation rate.
Simulation of tip cell selection with slowed degradation of Plexin-D1 allowing it to affect transcription of Dll4 for one timestep (12 s) longer. Dll4 levels flash irregularly between very high and very low with no stable selection possible. Color indicates cell Dll4 levels (green = high, purple = low).
Video 5
Calibration of Plexin-D1 degradation rate.
Simulation of tip cell selection with slowed degradation of Plexin-D1 allowing it to affect transcription of Dll4 for two timesteps (30 s) longer. Dll4 levels flash irregularly between very high and very low with no stable selection possible. Color indicates cell Dll4 levels (green = high, purple = low).
Video 6
Simulation of a vessel with 20 endothelial cells in the absence of Sema3E-Plexin-D1 signaling.
Extended regions occur with no sprouting as cells battle for longer undergoing fluctuations as the Dll4 up-regulation is higher. These eventually resolve and tip cells are selected across the whole region.
Video 7
Simulation of a wildtype vessel for comparison with Video 6.
The selection occurs much faster and more regularly than in the vessel without Sema3E-Plexin-D1 signaling.
Video 8
Simulated mosaic vessel with 50% mutant cells placed randomly.
Cells without Sema3E-Plexin-D1 signaling are indicated by bright pink color, which turns to yellow if Dll4 levels increase. For wildtype cells: purple = low Dll4, pink = high Dll4 as before. This chimera achieves a 75% contribution of mutant cells to the tip.
Video 9
Simulation of normal cell rearrangement and tip cell overtaking in a sprout consisting of ten cells, two per vessel cross section.
VEGF gradient extends in the direction of the sprout. Each cell indicated by a different color.
Video 10
Simulation of cell rearrangement in a sprout, in the absence of Sema3E-Plexin-D1, consisting of ten cells, two per vessel cross-section.
VEGF gradient extends in the direction of the sprout. Each cell indicated by a different color.
Video 11
Wildtype sprout in ex vivo endothelial cell tracking assay.
The movie represents 9 hr of live imaging and corresponds to Figure 4C, left panel. Merge of fluorescent channel (nuclear live stain) and brightfield channel. Arrows indicate newly selected tip cells that give rise to a new sprout. Arrowhead indicates a switching event. Single planes from z-stacks are shown.
Video 12
Plxnd1-/- sprout in ex vivo endothelial cell tracking assay.
The movie represents 9 hr of live imaging and corresponds to Figure 4C, right panel. Merge of fluorescent channel (nuclear live stain) and brightfield channel. Arrows indicate newly selected tip cells that give rise to a new sprout. Single planes from z-stacks are shown.
Download links
A two-part list of links to download the article, or parts of the article, in various formats.
Downloads (link to download the article as PDF)
Open citations (links to open the citations from this article in various online reference manager services)
Cite this article (links to download the citations from this article in formats compatible with various reference manager tools)
Temporal modulation of collective cell behavior controls vascular network topology
eLife 5:e13212.
https://doi.org/10.7554/eLife.13212


