Bicoid gradient formation and function in the Drosophila pre-syncytial blastoderm
- University of California, San Francisco, United States
Figures
Figure 1 with 2 supplements

In situ detection of Kr transcipts in pre-cellular embryos.
In situ hybridization detected Kr RNA (red) in nuclear cycle 7–13 embryos that were produced by females with two (left two columns) and six (right two columns) bcd gene copies. Embryos are prophase stage, dorsal up and anterior left. Embryo images are projection composites from serial optical sections; high magnification images show nuclei with red fluorescent dots. The number of nuclei with red dots and the dot brightness increases with each successive cycle. Two dots are visible in most nuclei; some have only one but none have three. Yellow dots in nuclear cycle 7–9 embryos indicate dots that were too faint to be visible at low magnification. The width of the band of Kr-expressing nuclei was approximately the same in the two genotypes; its position shifted more posteriorly in the embryos with excess Bcd.
Figure 1—figure supplement 1

Methods of in situ hybridization compared.
In situ hybridization was carried out with bcd and Kr probes to nuclear cycle 4 and 12 embryos as indicated. Method for DIG was as described in Materials and Methods; for FISH using multiple antisense DNA probes marked with fluorescent tags according to the Stellaris protocol (Little et al., 2013; 2011), and QuantiGene ViewRNA Probes according to the Affymetrix protocol. Images were obtained under identical conditions except for laser intensities, which were 33% for DIG, 75% for FISH, and 55% for QuantiGene.
Figure 1—figure supplement 2
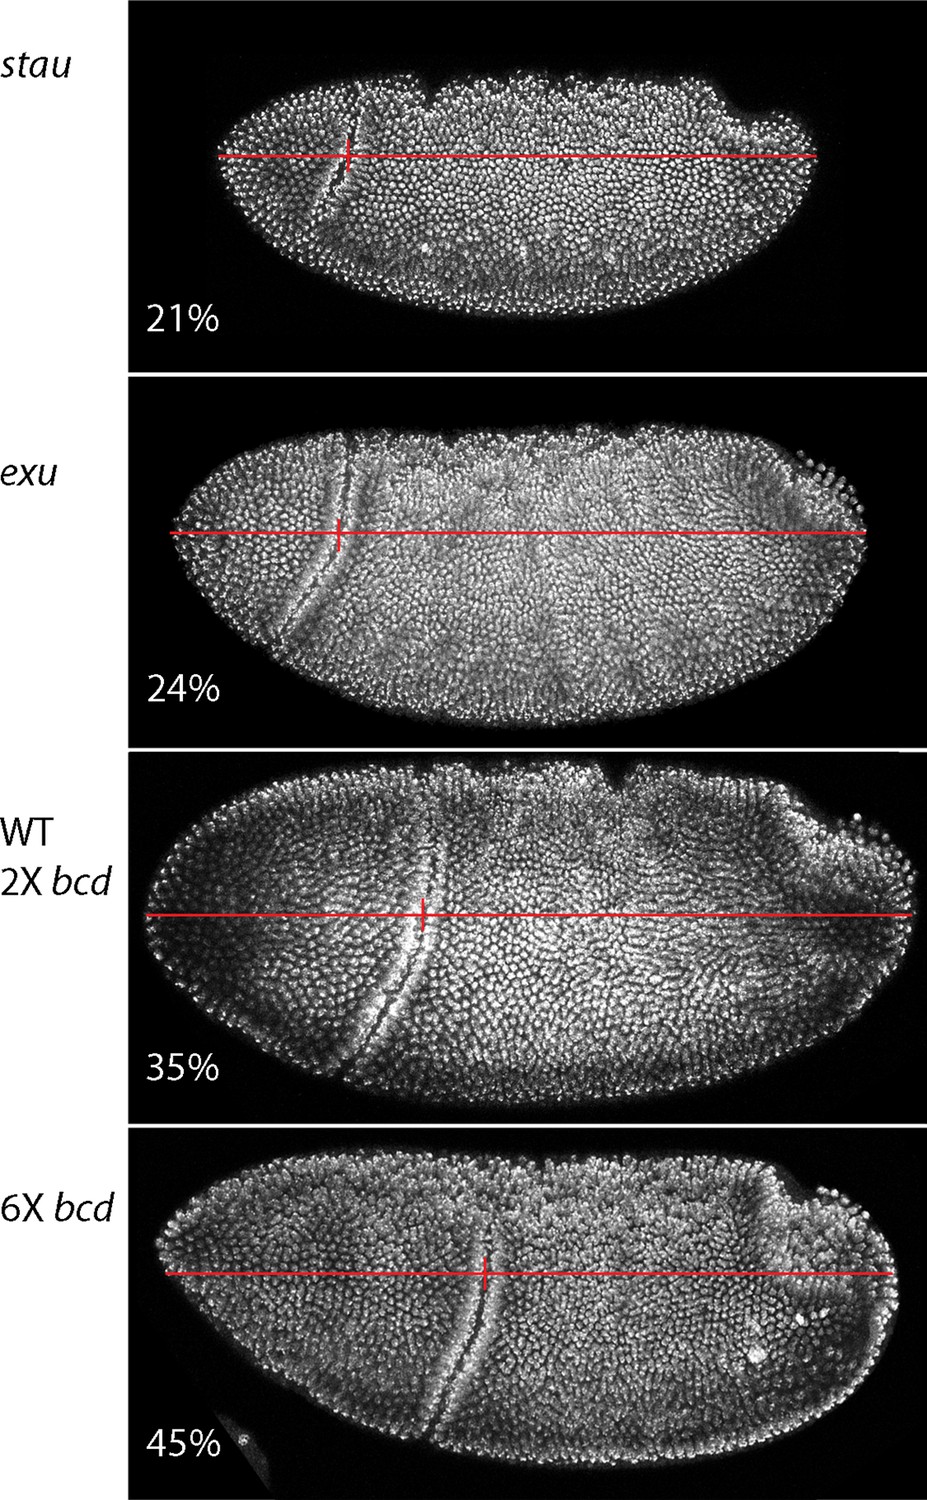
Dependence of gastrula morphology on maternal genotype.
Gastrula stage embryos from females with the indicated genotypes were fixed and stained with DAPI and the relative distance from the anterior end to the cephalic furrow (vertical red line) was calculated from the images of embryos (oriented anterior left, dorsal top).
Figure 2
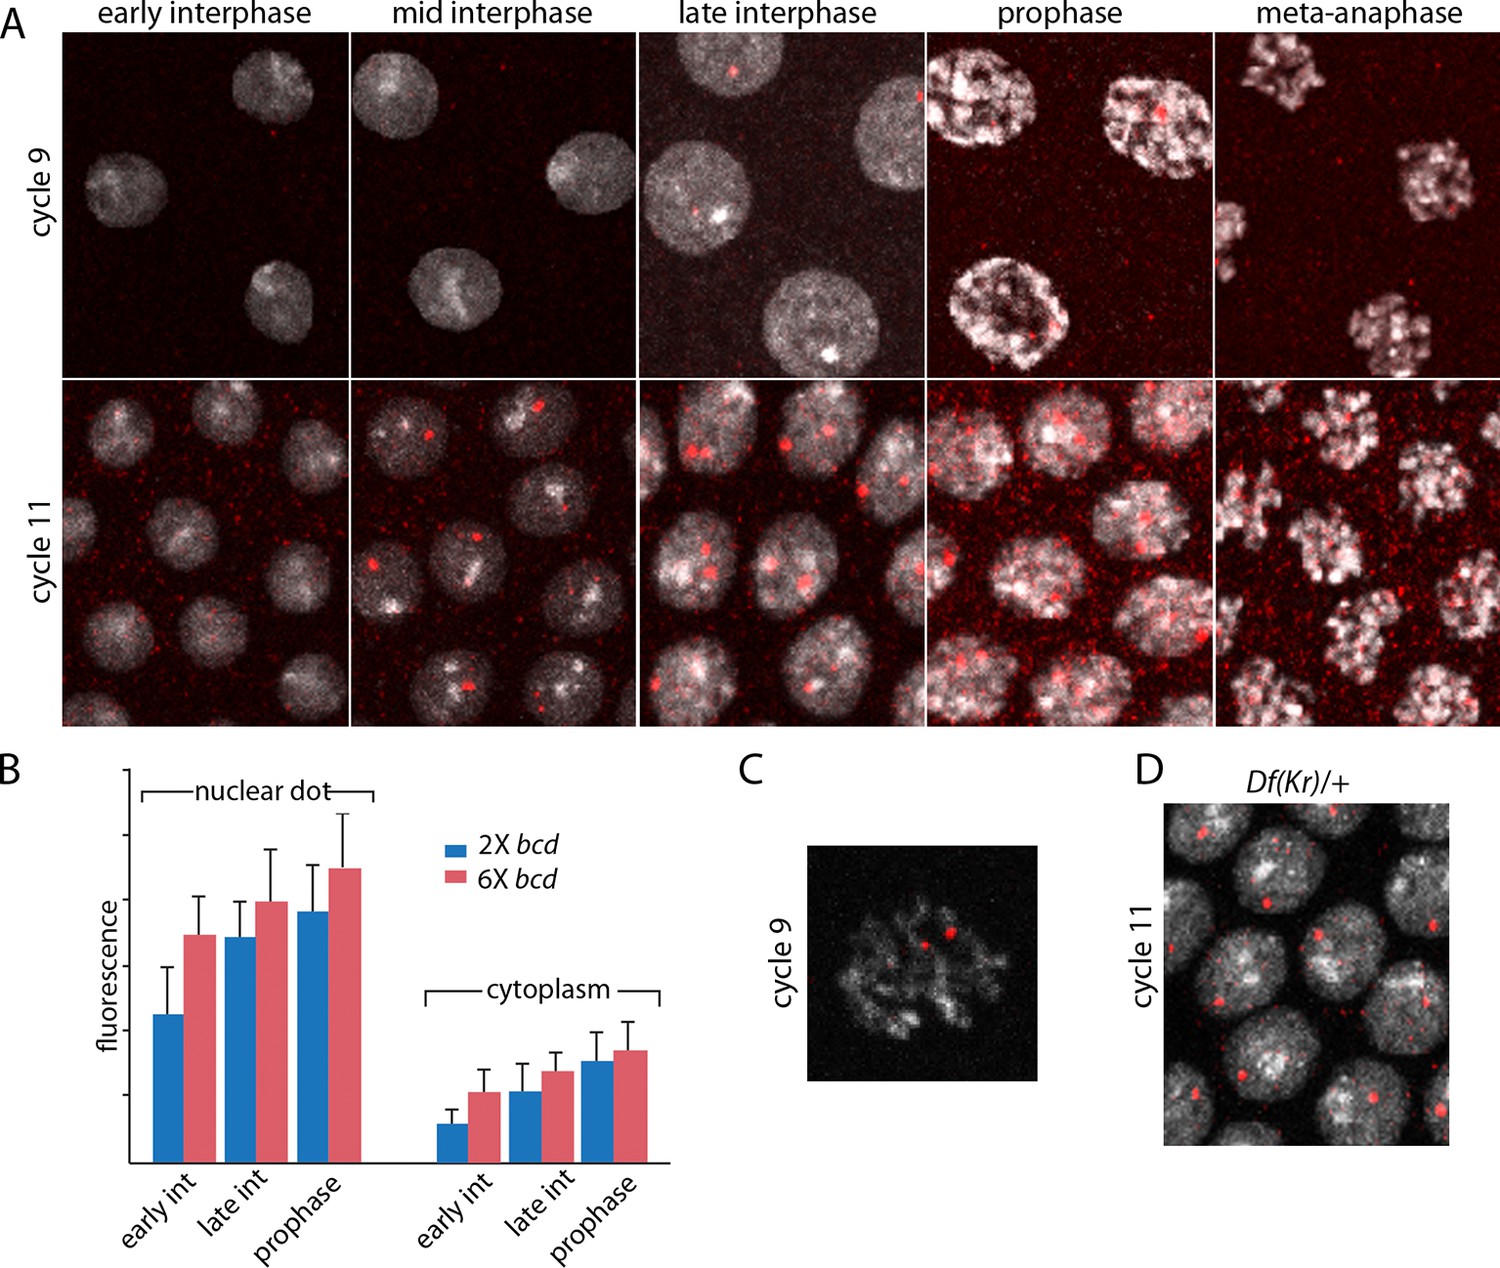
Characterization of Kr transcripts detected in situ.
(A) In situ hybridization detected Kr transcripts in mid-interphase to late prophase nuclei as discrete red fluorescent dots in nuclear cycle 9 and 11 embryos. (B) Bar graphs depicting measures of red fluorescence nuclear dots in nc11 nuclei and in a boxed area of adjacent cytoplasm quantify the dependence on nuclear cycle stage and Bcd level in embryos from mothers with two and six bcd genes. n=10 for nuclear dots, n=4 for cytoplasm. Differences between 2x and 6x are significant for nuclear dots (two-tailed value <0.0001 and t-test <E-08) and for early interphase cytoplasm (two-tailed value <0.0001 and t-test 3E-07). (C) High magnification image of a cycle 9 pro-metaphase nucleus revealing the apparent association of two red fluorescent dots with chromosome arms. (D) Nuclear cycle 11 nuclei in Kr/+ embryos have only one red fluorescent dot.
-
Figure 2—source data 1
Source data for 2B.
Fluorescence intensity of dots in nuclei and cytoplasm of projections images were measured in ImageJ by placing a square of constant dimension centered over each dot of interest. Embryos from mothers with either two or six copies were analyzed at the indicated stages.
- https://doi.org/10.7554/eLife.13222.007
Figure 3
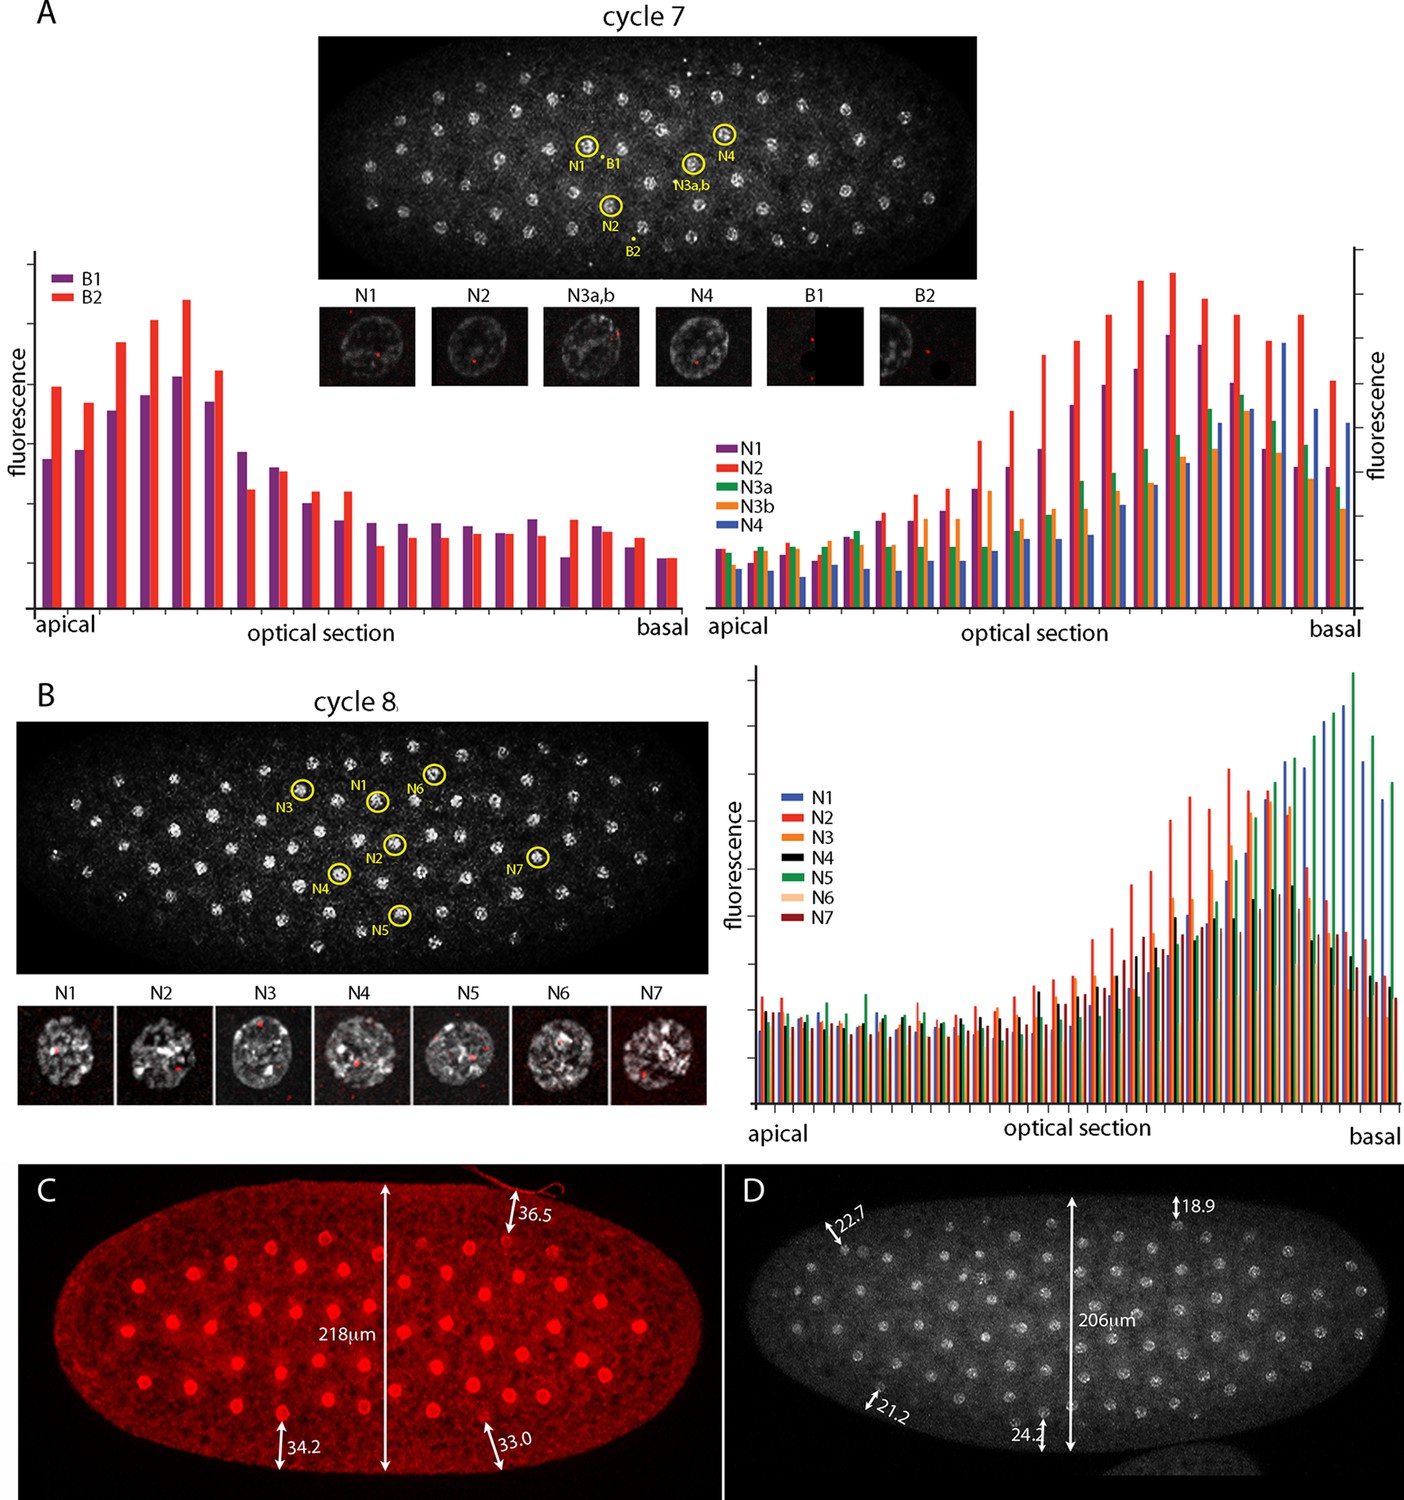
Intranuclear localization of Kr transcripts in pre-syncytial blastoderm nuclei.
(A,B) In situ hybridization detected Kr transcripts (red fluorescence) in nuclear cycle 7 and 8 embryos; prophase, dorsal up, anterior left. Yellow circles indicate dots whose red fluorescence was measured in successive optical planes and that are depicted in the bar graphs. (A) Two fluorescent non-nuclear dots (B1, B2) that were near nuclei with red dots were analyzed in the nuclear cycle 7 embryo (left graph); four fluorescent dots (N1-4) were analyzed (right graph). (B) Seven red nuclear dots were analyzed in the nuclear cycle 8 embryo. (C,D) Nuclei imaged with anti-nuclear lamin (C) and DAPI (D) show the placement of nuclei at nuclear cycle 7 (C) and nuclear cycle 8 (D) and the measured distances (μm) between nuclei and the cortex.
-
Figure 3—source data 1
Source data for 3A,B.
Fluorescence intensity of dots in nuclei and cytoplasm in optical sections, ordered apical to basal, were measured in ImageJ by placing a square of constant dimension centered of each dot of interest.
- https://doi.org/10.7554/eLife.13222.009
Figure 4 with 2 supplements

Bcd protein distributions in pre-cellular embryos.
Anti-Bcd antibody detected Bcd protein (red fluorescence) in nuclear cycle 4–14 WT, exu and stau embryos. Embryos are prophase, dorsal up and anterior left. Images are projection composites from serial optical sections (46–50 per embryo, spanning from the dorsal to ventral surface). Fluorescence is brightest at the anterior end and in the mutant embryos it is brighter and extends more posteriorly than in the WT. Fluorescence is apparent concentrated in nuclei of nuclear cycle 6–14 embryos.
-
Figure 4—source data 1
Source data for Figure 4—figure supplement 1.
PCR amplification cycle number for bcd RNA isolated from embryos that had developed to the indicated nuclear cycle.
- https://doi.org/10.7554/eLife.13222.011
Figure 4—figure supplement 1
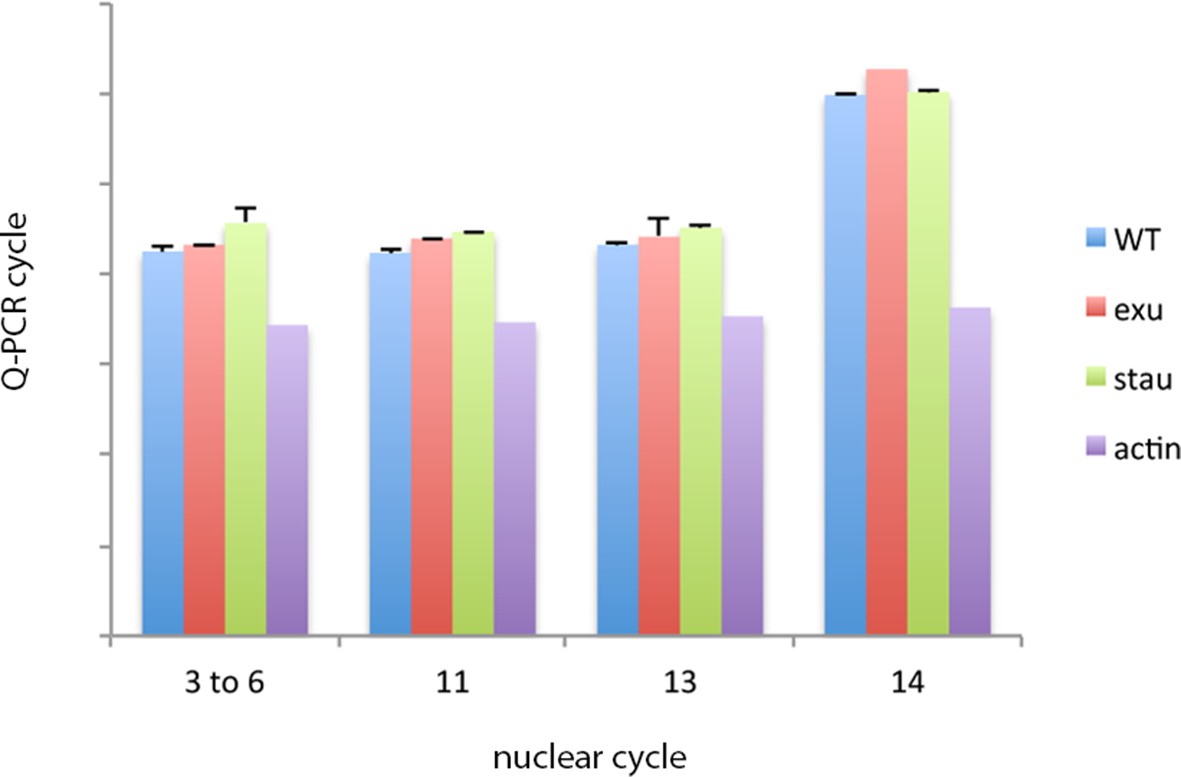
bcd RNA levels in pre-cellular WT and exu and stau mutant embryos.
Q-PCR analysis of RNA isolated from stage-selected embryos does not detect differences in bcd RNA levels between WT, exu or stau mutant embryos. bcd RNA levels decline in nuclear cycle 14 embryos.
Figure 4—figure supplement 2
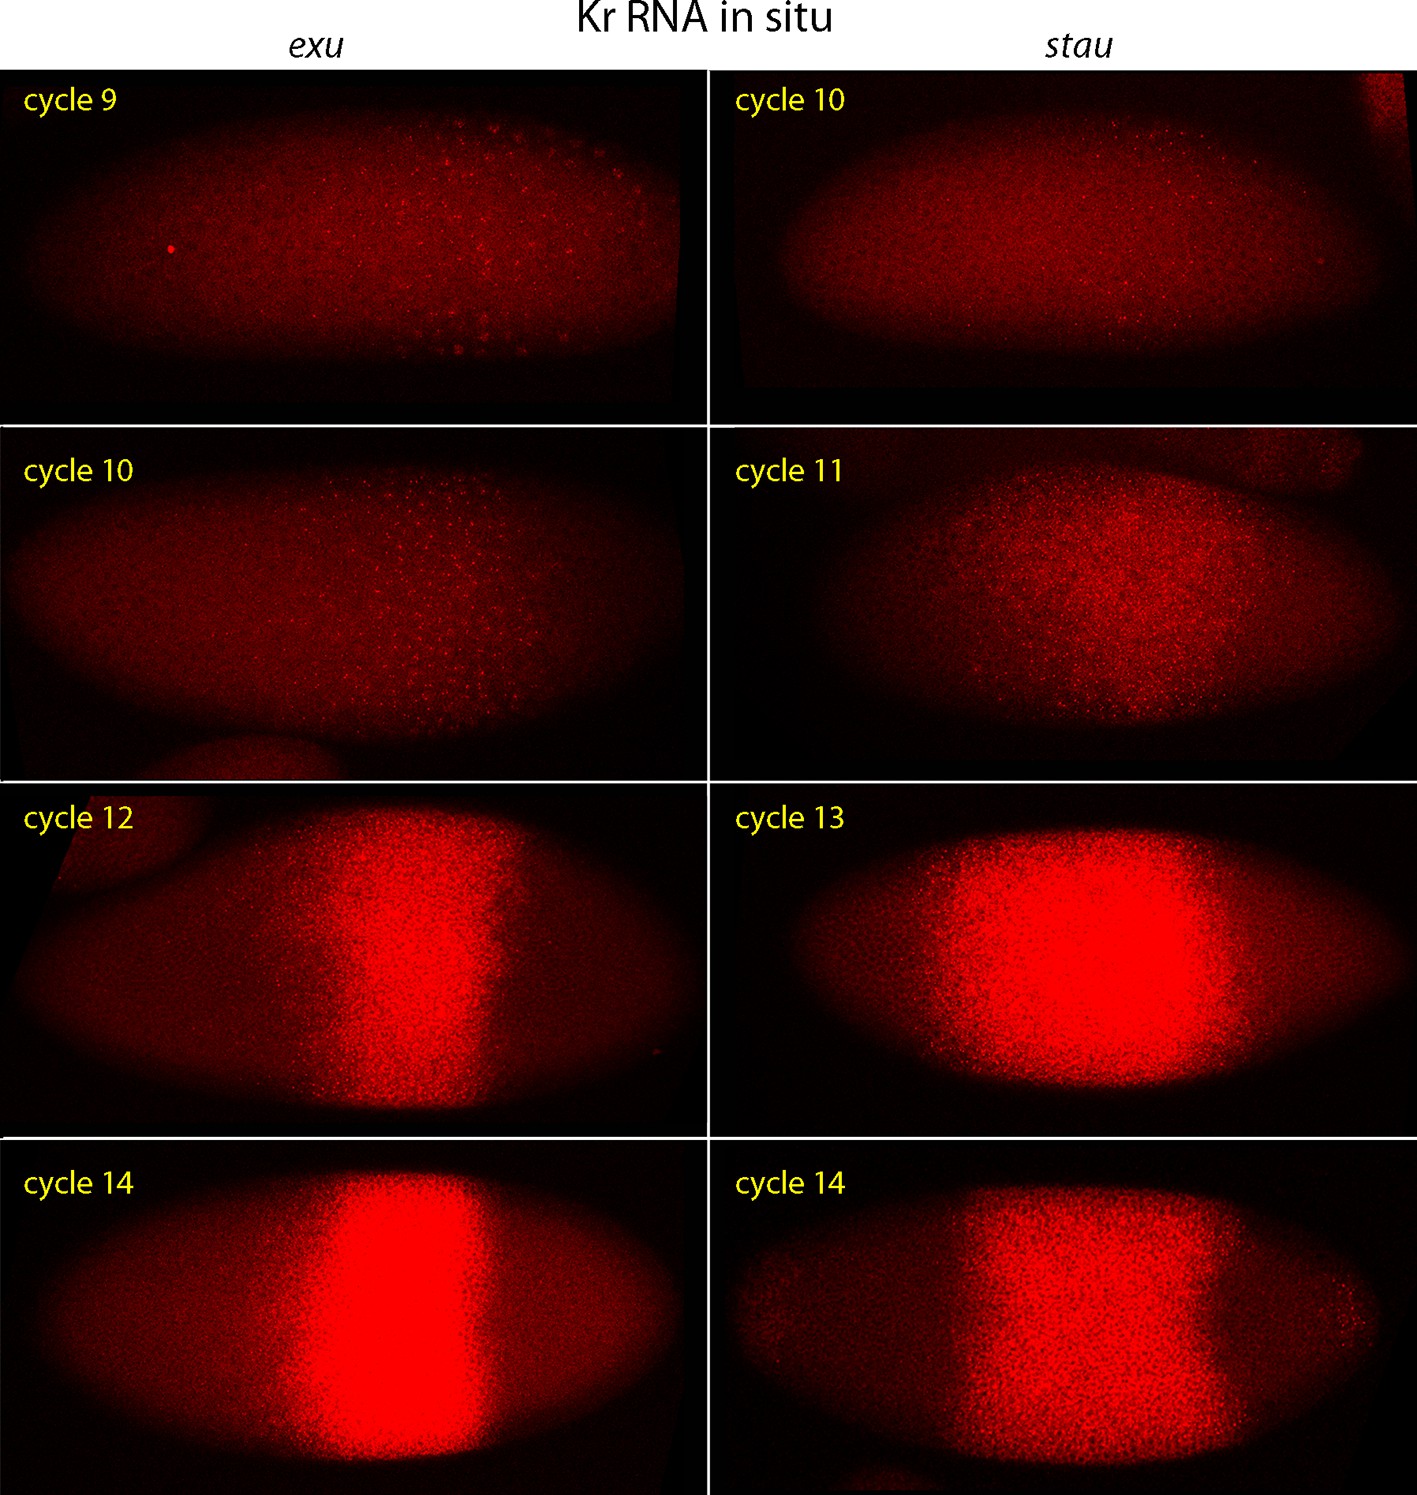
Kr expression in exu and stau mutant embryos.
In situ hybridization detected Kr transcripts (red fluorescence) in exu and stau nuclear cycle 9, 10, 12 and 14 embryos. Embryos are late interphase/prophase, dorsal up, and anterior left. Images are projection composites from serial optical sections. Regions with Kr transcripts are expanded and displaced relative to WT.
Figure 5
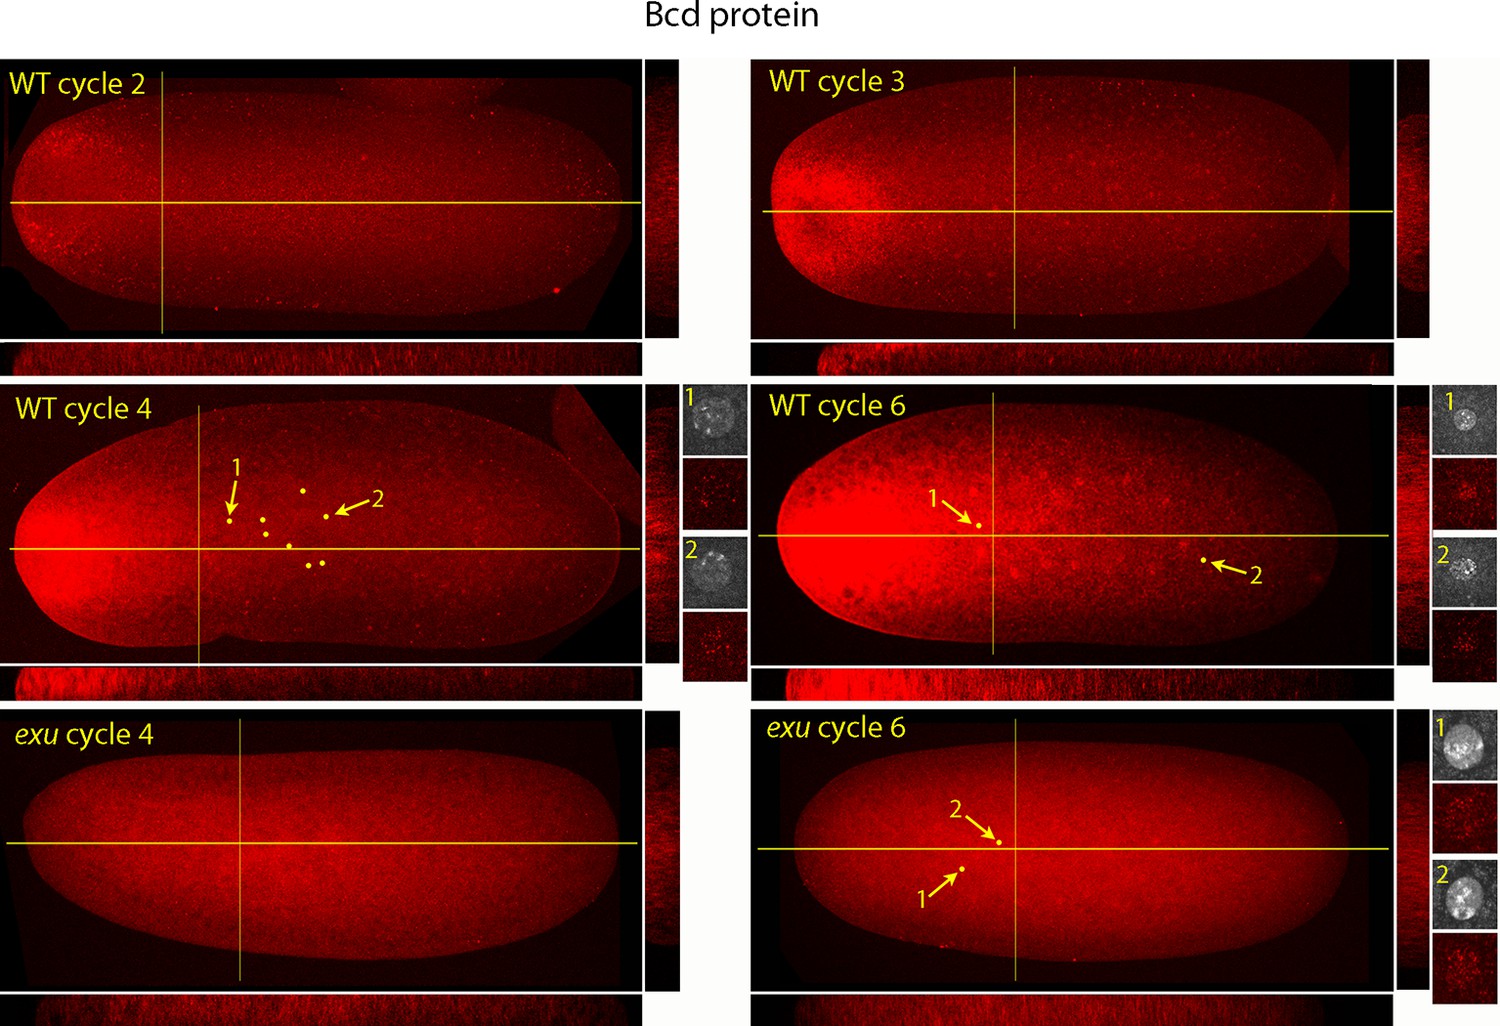
Bcd protein distributions in nuclear cycle 2 to 6 embryos.
Anti-Bcd antibody detected Bcd protein (red fluorescence) in nuclear cycle 2 to 6 WT and exu embryos. Embryos are prophase, dorsal up and anterior left. Images are projection composites from serial optical sections. Yellow lines indicate the position of mid embryo sagittal and transverse optical sections that are shown below and to the right, respectively, of each embryo. The anterior to posterior fluorescence gradient is apparent in the sagittal sections of WT but not the exu embryos; internal embryo fluorescence is apparent in the transverse sections of both WT and mutant embryos. Nuclei in the WT nuclear cycle 4 (indicated by yellow dots), nuclear cycle 6 and exu nuclear cycle 6 embryos concentrate red fluorescence; high magnification images of the indicated nuclei show DAPI fluorescence and resolve spots of red fluorescence in both WT and exu nuclei.
Figure 6
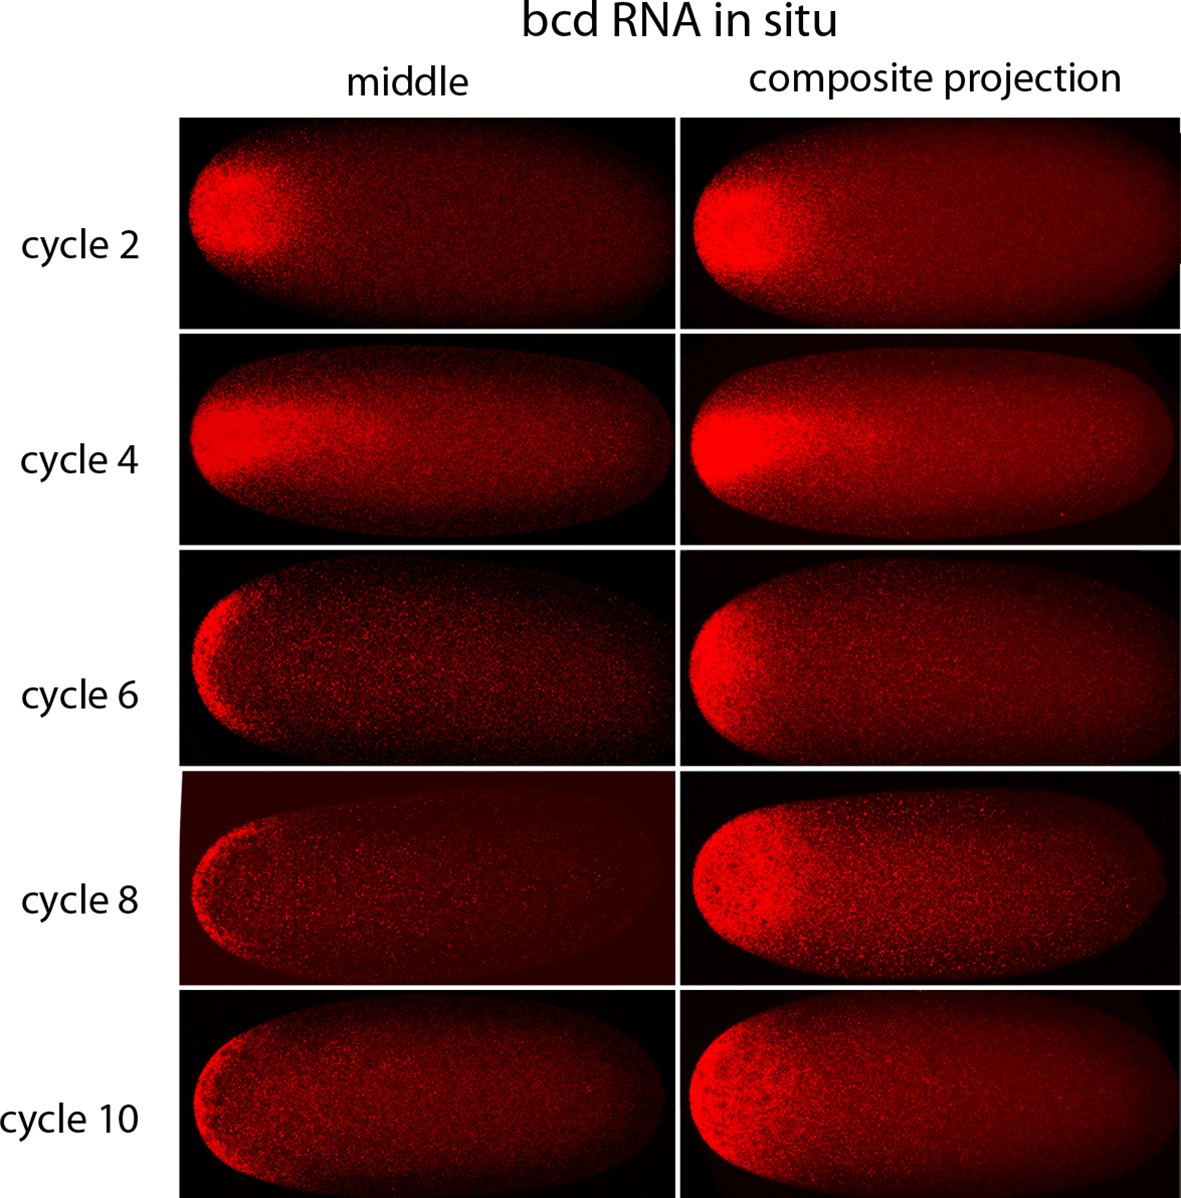
In situ detection of bcd transcripts in pre-cellular embryos.
In situ hybridization detected bcd transcripts (red fluorescence) in nuclear cycle 2, 4, 6, 8 and 10 embryos. Embryos are dorsal up and anterior left. Images are mid-embryo optical sections (left) and projection composites from serial optical sections (right).
Figure 7

In situ detection of bcd transcripts in nuclear cycle 1, 3 and 5 embryos.
In situ hybridization detected bcd transcripts (red fluorescence) in nuclear cycle 1, 3, and 5 embryos. Embryos are dorsal up and anterior left. Left panels are projection composites from serial optical sections and panels to their right are successive dorsal to ventral optical sections. DAPI-stained image of nucleus shown for the nuclear cycle 1 embryo.
Figure 8 with 1 supplement

bcd expression in stage 14 oocytes.
α-Bcd antibody detects Bcd protein in nuclear cycle 1 embryos (A) and in unfertilized eggs (B). Stage 14 oocytes (stained with DAPI) are covered with follicle cells initially and the dorsal appendages are juxtaposed (stage 14a; (C)); the nuclei of the follicle cells elongate and the follicle cells migrate anteriorly (stage 14b; (D)), form an anterior ring stage 14c; (E) that extrudes distally from the dorsal appendages, which separate from each other stage 14d; (F). High magnification images of DAPI-stained nuclei in (C,D,F) show the oocytes to be at prophase (14a) and true metaphase (14b, 14d) (Gilliland et al., 2009). In situ hybridization detects bcd RNA at all stage 14 oocytes (G,I,K); antibody staining detects Bcd protein in stage 14d oocytes (L) but not in younger stages (H,J). Orientation anterior left.
Figure 8—figure supplement 1

In situ detection of bcd transcripts in stage 12 oocyte.
In situ hybridization detected bcd transcripts (red) in nurse cells and in the anterior cytoplasm of the stage 12 oocyte.
Figure 9
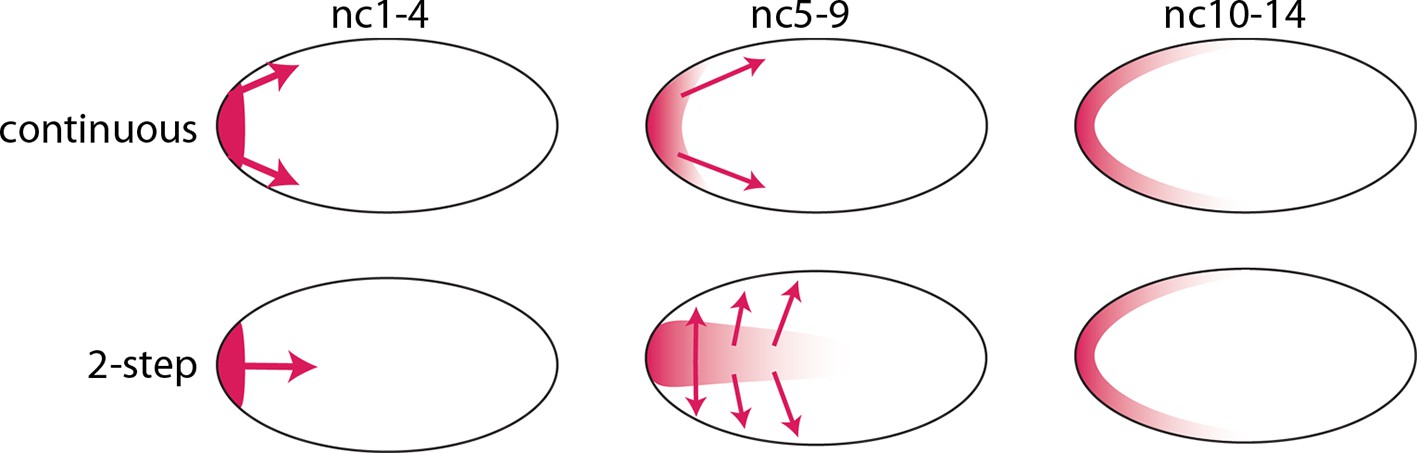
Models of Bcd gradient formation.
Two contrasting models of Bcd gradient formation are depicted as viewed from a sagittal section in the middle of pre-cellular embryos, oriented anterior left. A model that assumes a continuous redistribution of bcd RNA and Bcd protein (red) from the anterior pole (upper row) contrasts with the two-step model (lower row) in which the bcd products generate a plume in the middle of the embryo during the first four nuclear cycles and then generate a second gradient at the cortex in the syncytial blastoderm stages (nc9-14).
Download links
A two-part list of links to download the article, or parts of the article, in various formats.
Downloads (link to download the article as PDF)
Open citations (links to open the citations from this article in various online reference manager services)
Cite this article (links to download the citations from this article in formats compatible with various reference manager tools)
Bicoid gradient formation and function in the Drosophila pre-syncytial blastoderm
eLife 5:e13222.
https://doi.org/10.7554/eLife.13222


