Gap junction networks in mushroom bodies participate in visual learning and memory in Drosophila
Figures
Figure 1 with 3 supplements
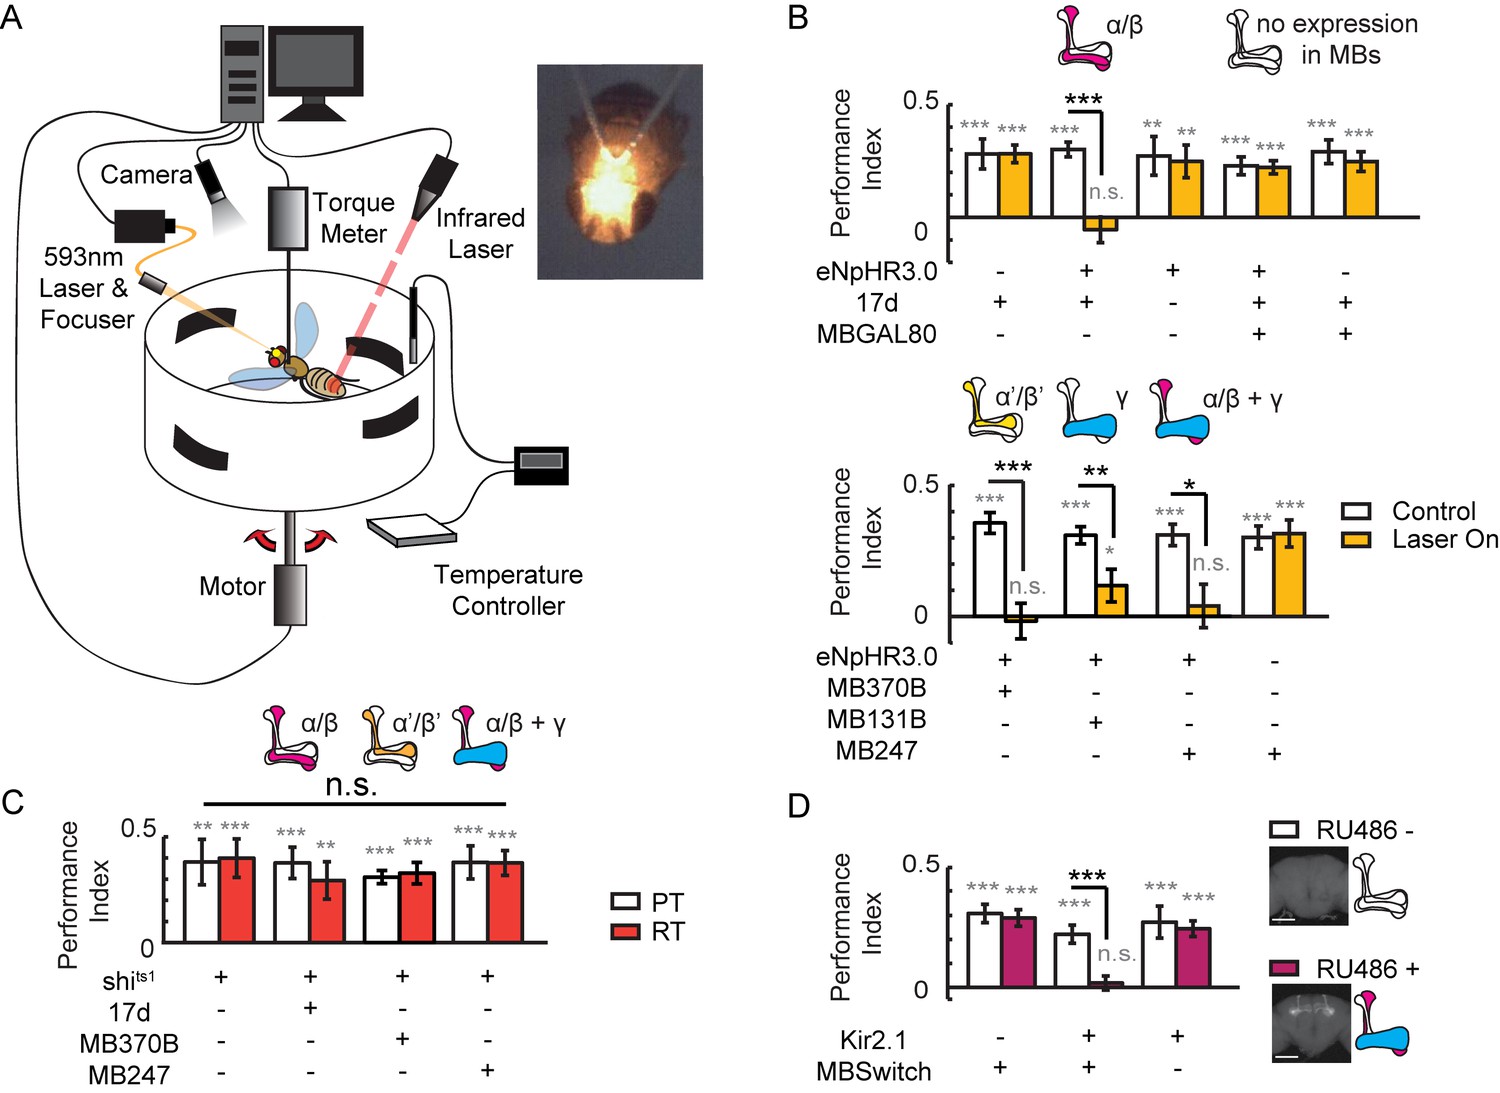
Visual learning and memory is abolished upon hyperpolarization of KCs.
(A) Setup of the optogenetic flight simulator system. A 593 nm laser was used to activate halorhodopsin. To avoid influencing the visual perception of the flies, a focuser was used to focus the laser into a Gaussian light spot and to direct it in between the two compound eyes (diameter, ~0.3 mm). (B) Visual learning and memory was impaired when UAS-eNpHR3.0-YFP was used to hyperpolarize KCs labeled with 17d-GAL4, MB370B-GAL4, MB131B-GAL4 and MB247-GAL4. The expression pattern of these GAL4 lines are illustrated above the bars. MB247-GAL80 restored memory impaired by17d-GAL4. The laser was off in the control groups (Control) and applied throughout the 24min assay (at 0.1 mW/mm2) in the test groups (Laser On). (C) Blocking the chemical synaptic output of KCs labeled with 17d-GAL4, MB370B-GAL4 and MB247-GAL4 did not affect visual learning and memory. The temperature was unchanged throughout the 24 min assay. The permissive temperature (PT) was 24 ± 1°C, and the restrictive temperature (RT) was 30 ± 0.5°C. (D) Hyperpolarizing KCs labeled with MB247-GeneSwitch impaired visual learning and memory. For 3 days prior to start of the experiment, the flies in the “RU486+” group were fed with RU486 (50 mM dissolved in EtOH, 1:100 mixed with food), and the flies in the “RU486–” group were fed with 1% EtOH in food. Scale bar, 100 μm. The expression pattern of each driver is illustrated. N=15 to 20 for each data point. All data represent the mean ± SEM. Asterisks in grey indicate the level of statistical significance of the performance indices compared against chance level. Asterisks in black indicate the level of statistical significance of the performance indices between groups. (*p<0.05; **p<0.01; ***p<0.001).
Figure 1—figure supplement 1
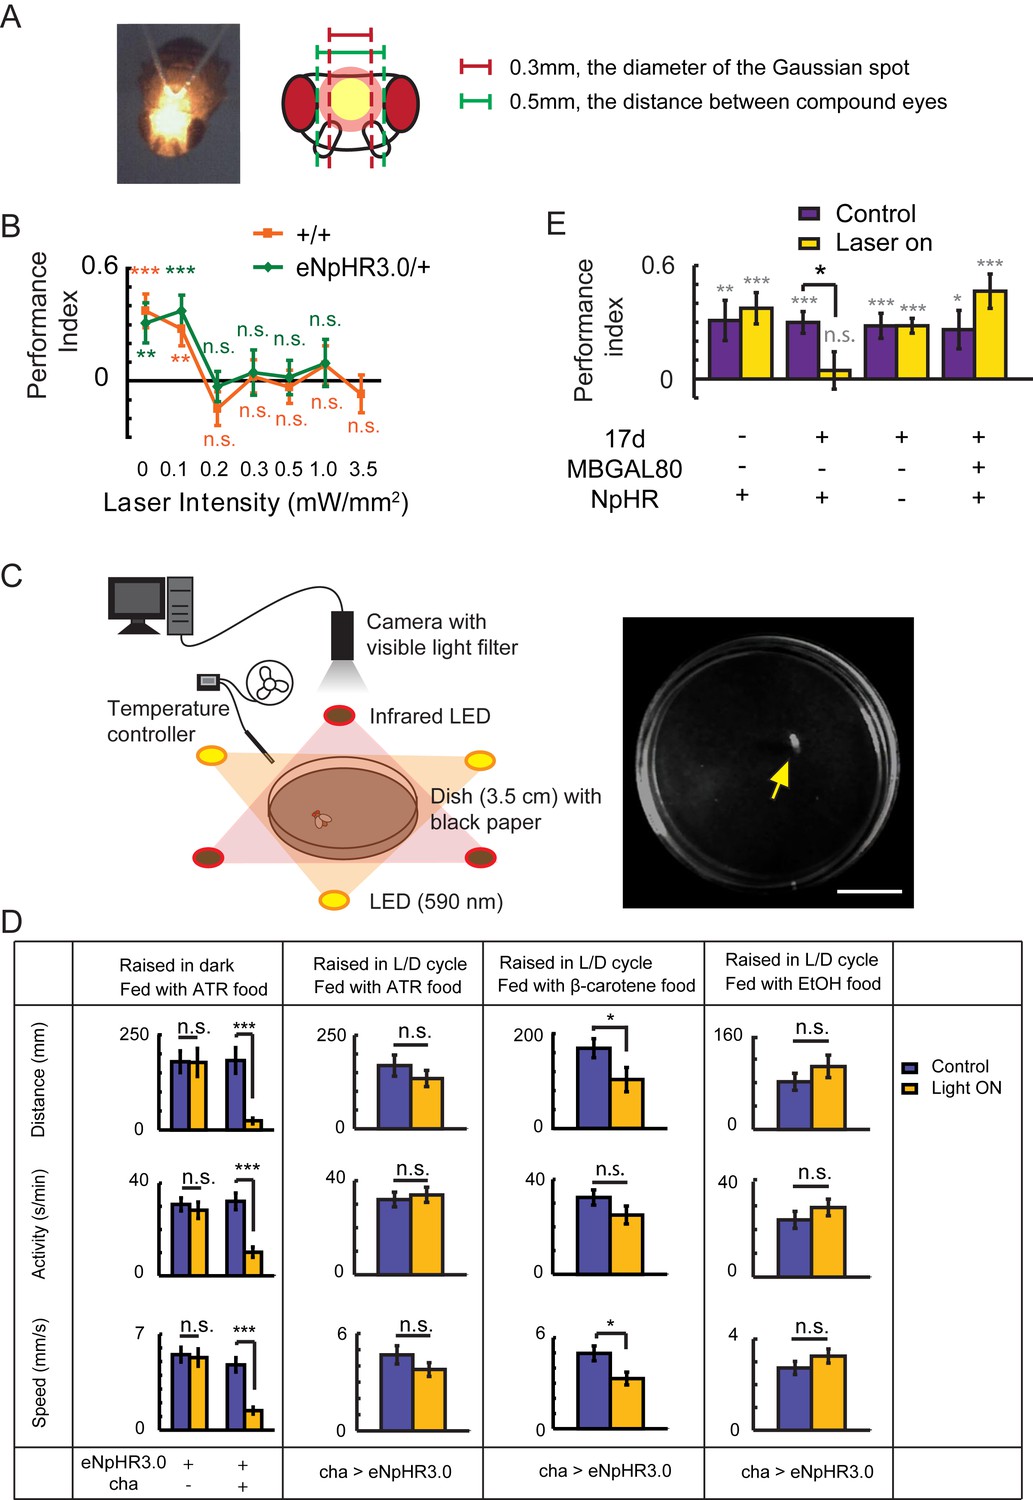
Establishing the optogenetic flight simulator system.
Two difficulties have restricted the application of optogenetics to the study of Drosophila visual cognition. First, the excitation light can disturb visual perception; second, Drosophila need to take in all-trans retinal (ATR) in order to use optogenetics. However, ATR is light-sensitive and must be protected from light (Suh et al., 2007), while light deprivation leads to abnormal development of the visual system (Barth and Heisenberg, 1997). (A) To solve the first problem, we focused the laser light into a small Gaussian spot (593 nm, diameter 0.3 mm) and directed it between the two compound eyes of Drosophila. (B) Visual learning and memory under different laser intensities were tested in wild type CS and eNpHR3.0/+ flies. A laser strength of greater than 0.1 mW/mm2 impaired visual learning and memory. (C, D) To address the second problem, an optogenetic locomotor system was established. (C) Flies were individually placed into a 3.5 cm dish. The fly’s locomotor behavior was recorded by a camera with a visible light filter. Illumination was supplied by three infrared LEDs. In the test groups, three yellow LEDs supplied yellow light (590 nm, 0.06–0.1 mW/mm2). Temperature was controlled at 25 ± 1°C. Yellow arrow, recorded fly. Scale bar, 1 cm. (D) Locomotor behavior of cha-GAL4 > UAS-eNpHR3.0 and UAS-eNpHR3.0/+ flies raised in different conditions; this behavior reflects the activation of halorhodopsin. For each fly, the distance moved, time spent moving (activity) and speed were calculated. If the flies raised in a 12 hr L/D cycle were fed with ATR (changed every night), halorhodopsin would be disabled. The β-carotene has been reported to be transformed into ATR in Drosophila and is more stable in light (Wang et al., 2007; Yang and O'Tousa, 2007). Feeding flies β-carotene for 3 days after eclosion could partially rescue the halorhodopsin inactivation. Thus, β-carotene could be used in place of ATR for optogenetics. N = 18 to 20 for each data point. All data represent the mean ± SEM. (E) Hyperpolarization of KCs labeled with 17d-GAL4 with UAS-NpHR-YFP (raised with a 12 hr L/D cycle, fed with β-carotene food) also impaired visual learning and memory. Asterisks in grey and color indicate the level of statistical significance of the performance indices compared against chance level. Asterisks in black indicate the level of statistical significance of the performance indices between groups. (*p<0.05; **p<0.01; ***p<0.001). No laser was used in the control group (Control). In the test group (Laser on), the laser was focused into a 0.3 mm diameter light spot (593 nm, 0.1 mW/mm2). N = 15 to 20 for each data point. All data represent the mean ± SEM.
Figure 1—figure supplement 2
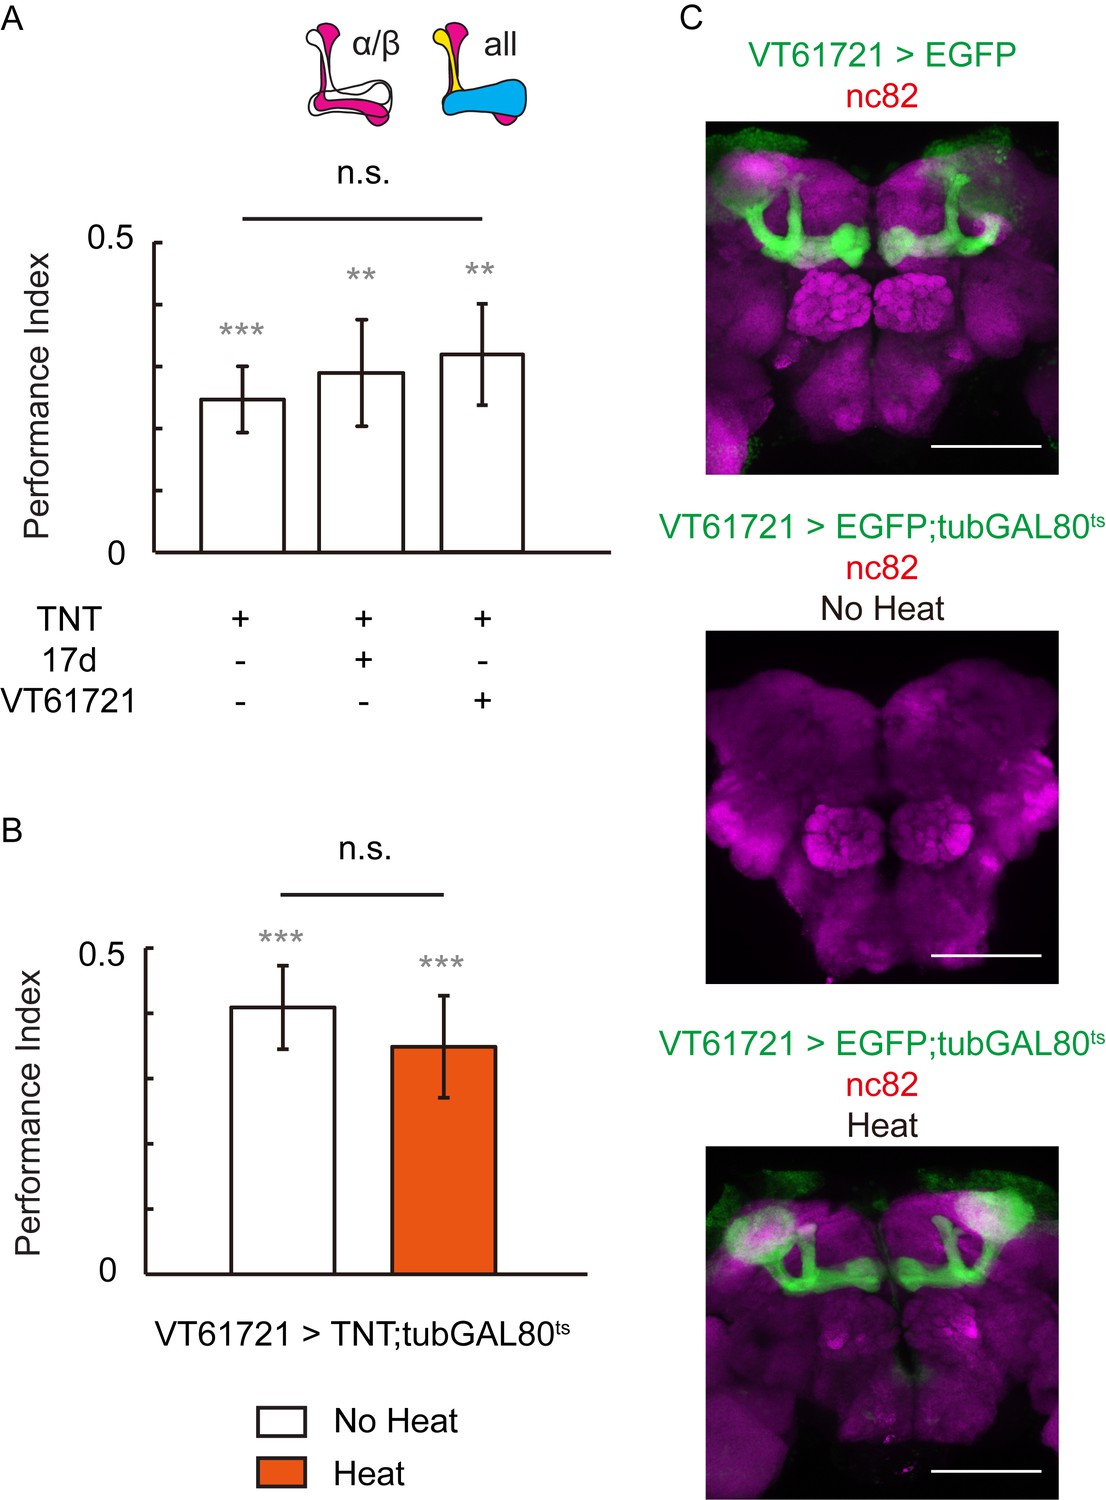
Blocking the chemical synaptic output of KCs did not impair visual learning and memory.
Visual learning and memory remained intact when chemical synaptic output of KCs labeled with 17d-GAL4 or VT61721-GAL4 was blocked all the lifetime (A) or only post-development (B) by tetanus-toxin expression. N = 10 to 16 for each data point. (C) The expression pattern of VT61721-GAL4. Scale bar, 100 μm.
Figure 1—figure supplement 3
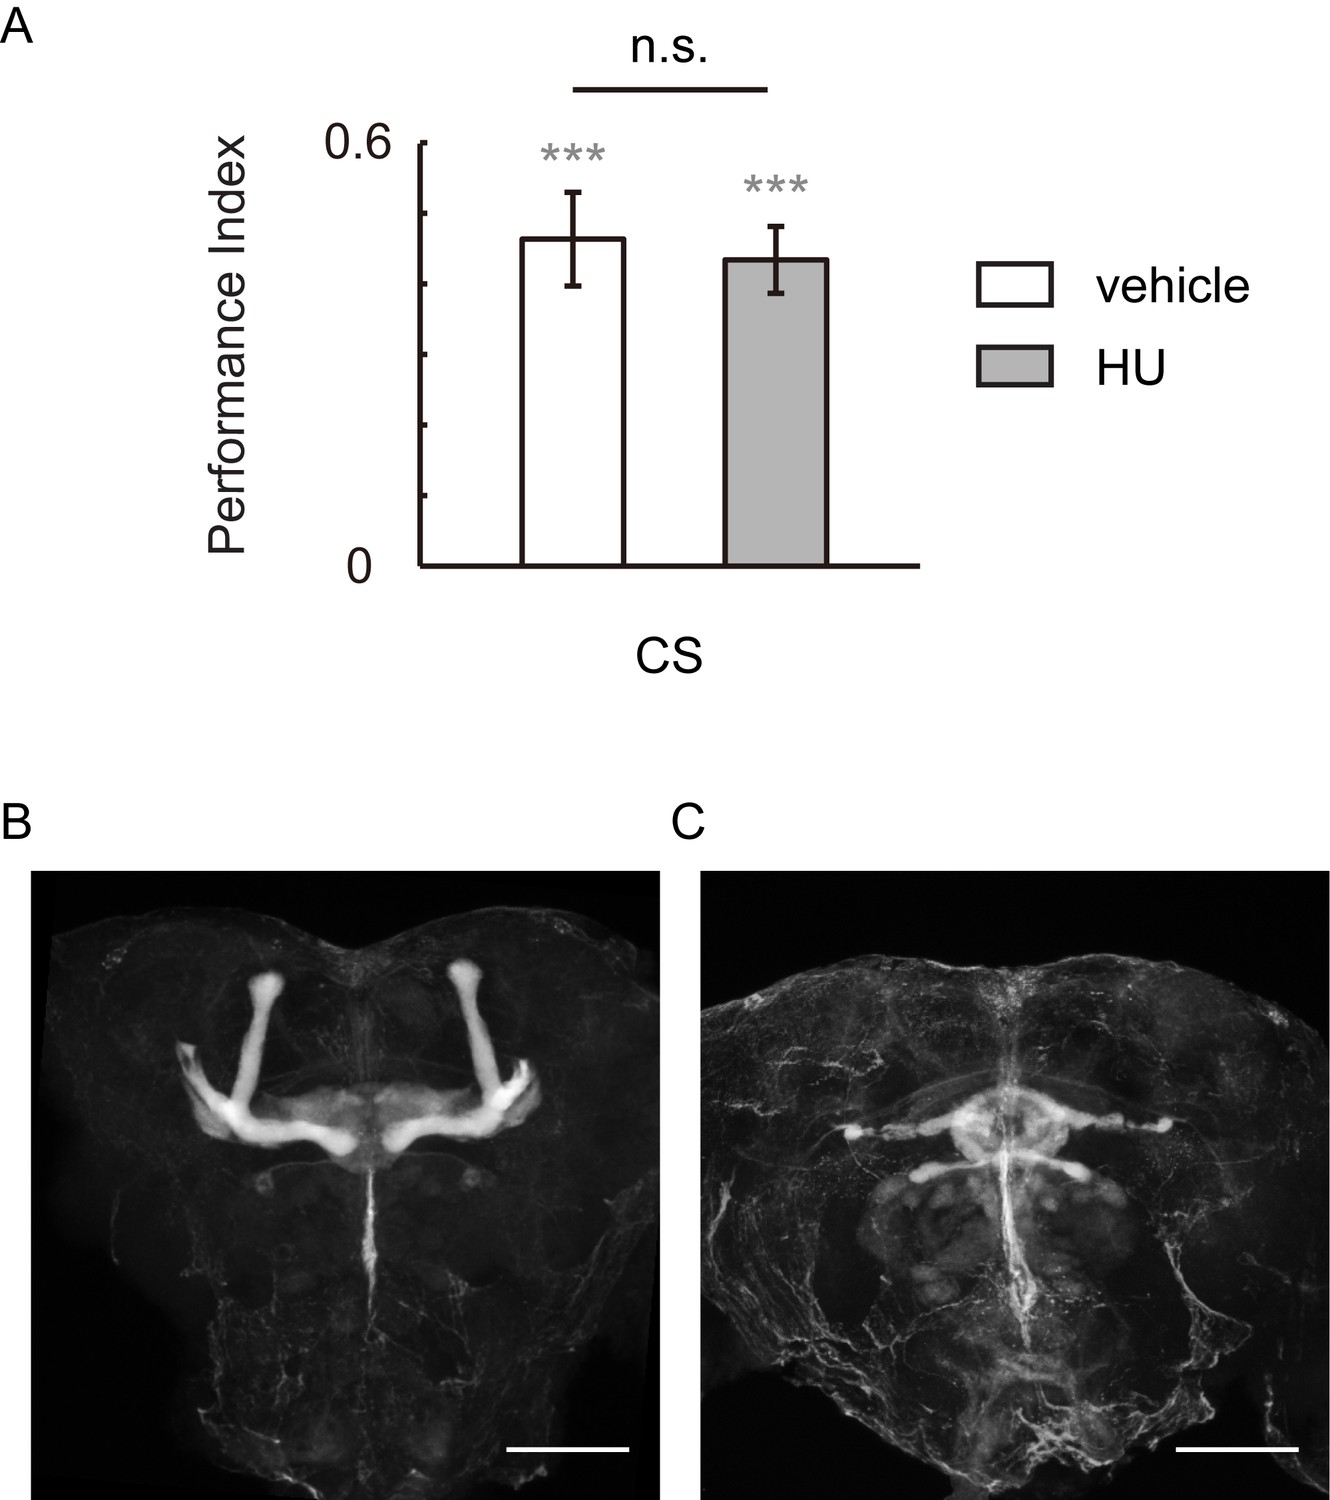
HU-ablation of MBs did not impair visual learning and memory.
(A) Flies of which MBs were ablated by HU demonstrated regular performance. (B, C) HU treatment ablated the MBs. The anti-Fasciclin II labelled brain without (B) or with (C) HU treatment. N = 12 for vehicle group, n = 11 for HU group. Scale bar, 100 μm.
Figure 2 with 1 supplement
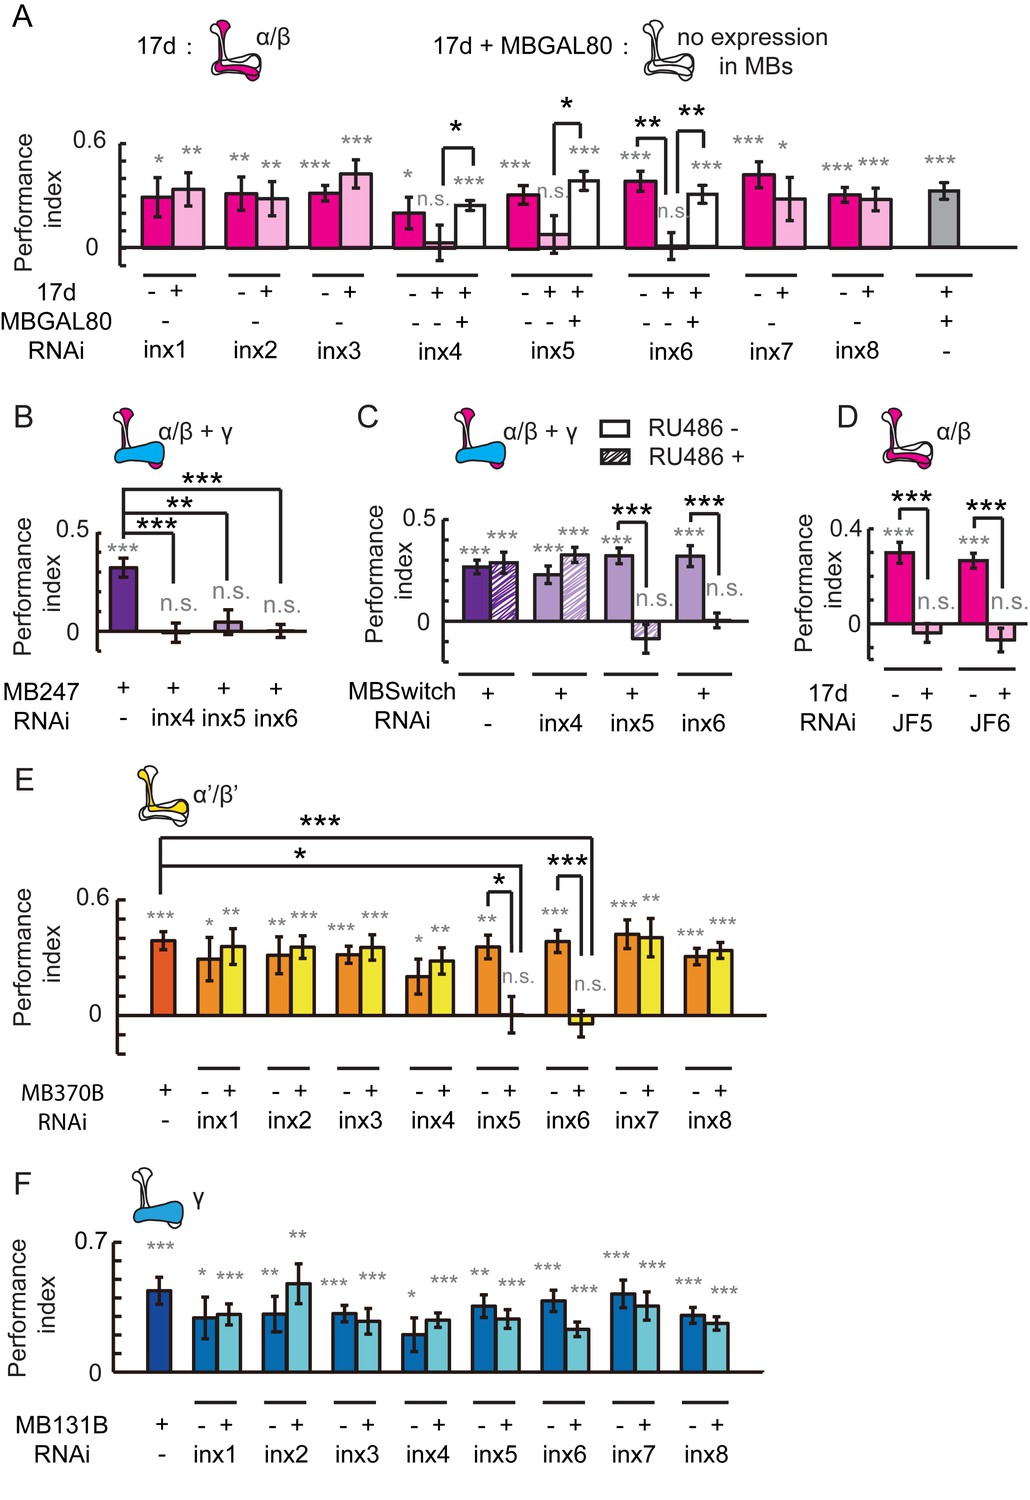
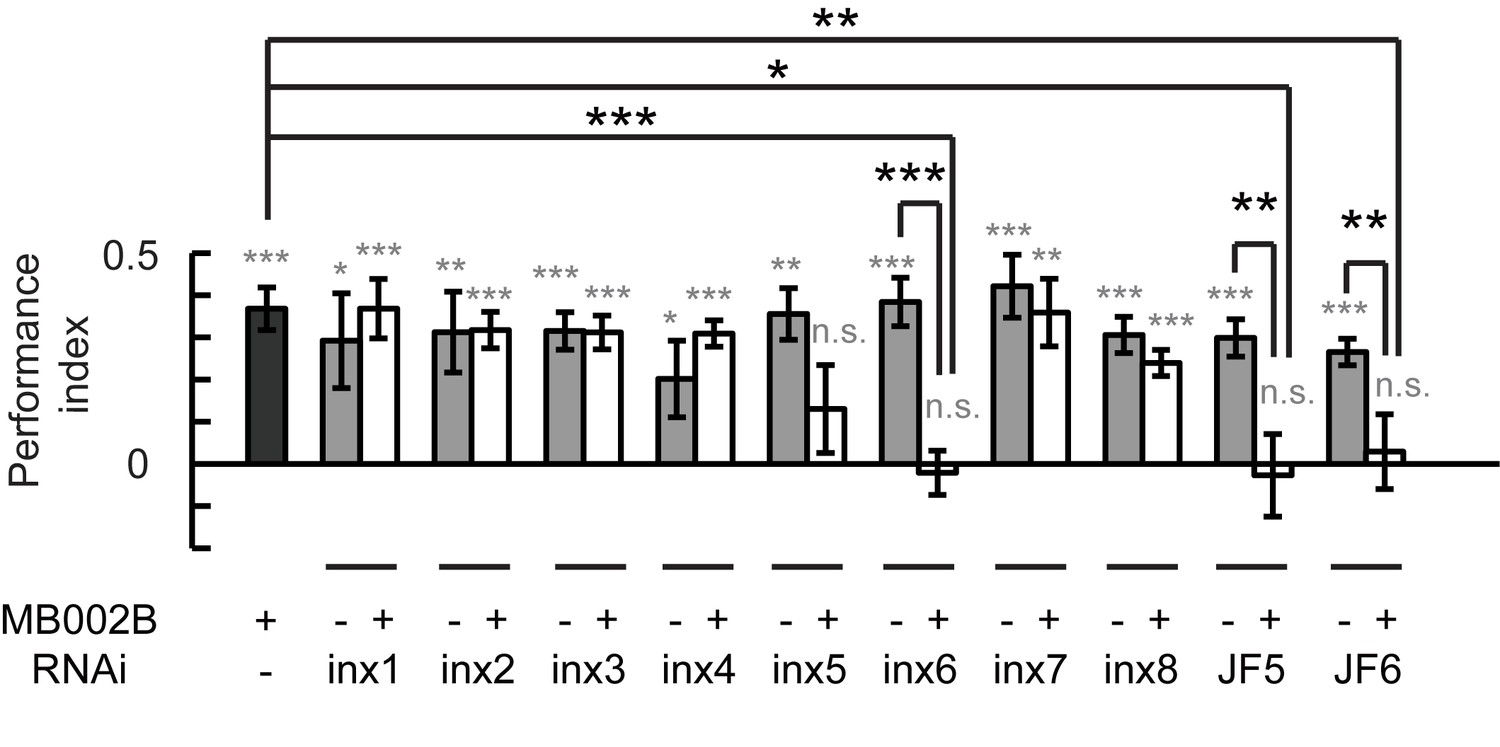
Gap junctions in MBs are necessary for visual learning and memory.
(A) Knockdown of inx6 in KCs labeled with 17d-GAL4 impaired visual learning and memory. Knockdown of inx4 or inx5 eliminate the significance of the difference between the performance indices and zero. The effect of inx4, inx5 or inx6 knockdown was rescued by MBGAL80. (B, C) Knocking down inx4, inx5 or inx6 in KCs from an early development stage impaired visual learning and memory (B), while knockdown of inx4 in KCs after eclosion showed no effect (C). For 3 days before the experiment, the flies in the RU486+ group were fed with RU486 (50 mM stock dissolved in EtOH, 1:100 mixed with food), and the flies in the RU486– group were fed with 1% EtOH in food. (D) Knockdown of inx5 or inx6 in KCs labeled with 17d-GAL4 with another type of RNAi also impaired visual learning and memory. (E) Knockdown of inx5 or inx6 in MB370B split-GAL4-labeled α’/β’ neurons impaired visual learning and memory. (F) Knockdown of each of the inx genes in MB131B split-GAL4-labeled γ neurons had no effect on visual learning and memory. The expression pattern of each driver is illustrated. The experiments in (C, D) were performed as blind experiments. The following RNAi lines were used: inx1: v103816; inx2: v102194; inx3: v39094; inx4: v33277; inx5: v102814; inx6: v8638; inx7: v103256; inx8: v26801; JF5: TRiP. JF02877; and JF6: TRiP. JF02168. The specificity and target sequences of RNAi are shown in Supplementary file 1. N = 15 to 20 for each data point. All data represent the mean ± SEM. Asterisks in grey indicate the level of statistical significance of the performance indices compared against chance level. Asterisks in black indicate the level of statistical significance of the performance indices between groups. (*p<0.05; **p<0.01; ***p<0.001).
Figure 2—figure supplement 1
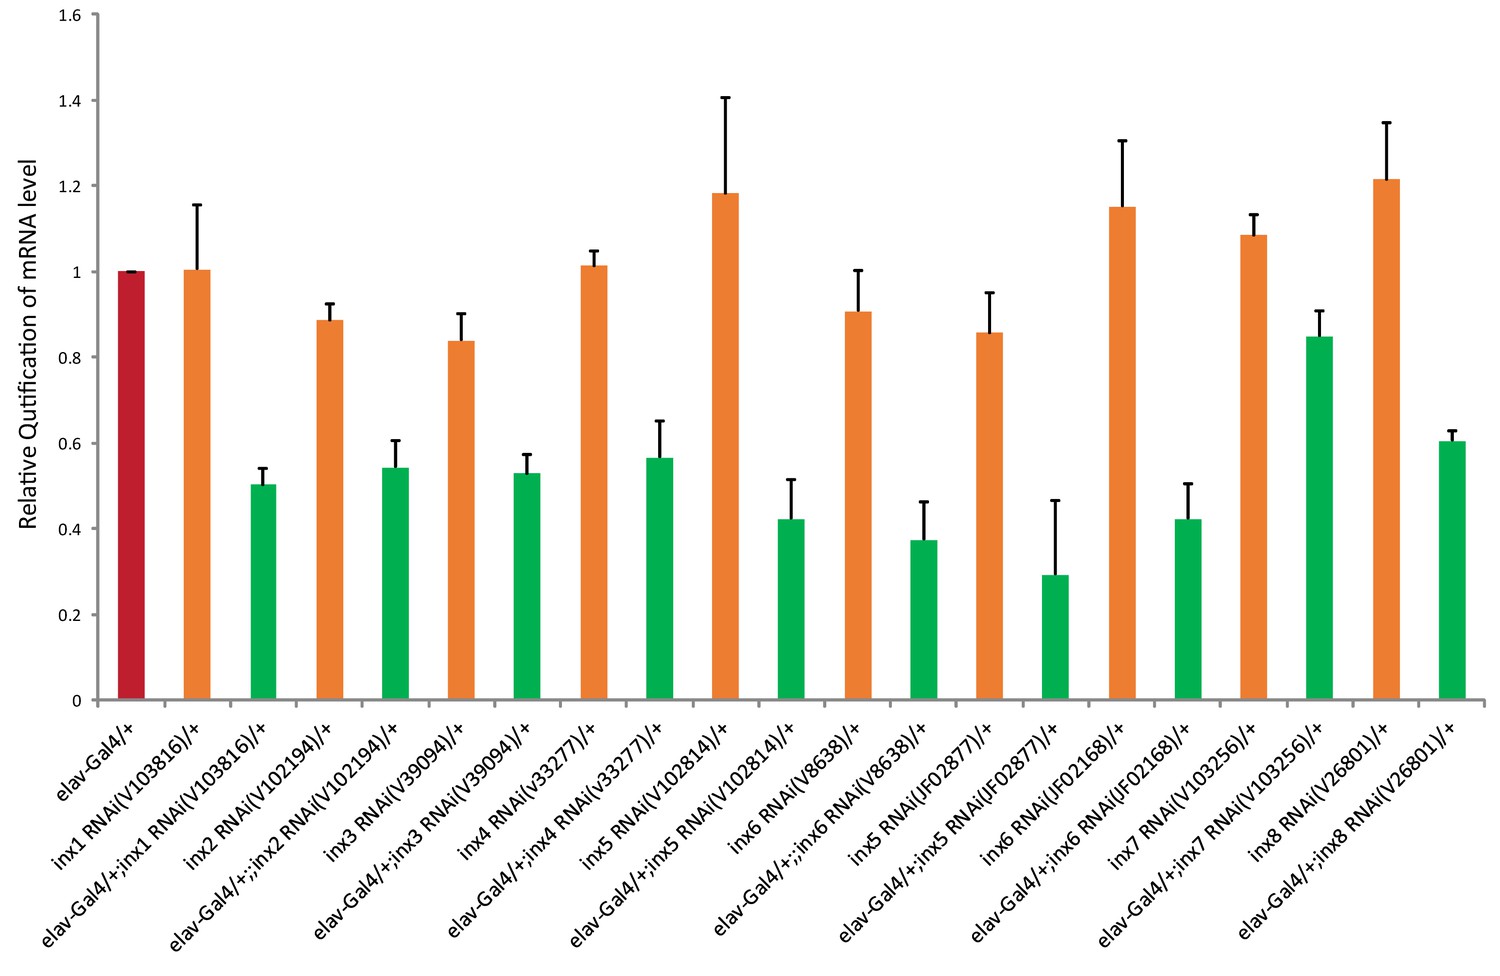
Effectiveness of inx RNAi lines.
Relative amount of innexin mRNA in the manipulated flies (elav-GAL4 > UAS-inx RNAi) comparing to the control flies (elav-GAL4/+ and UAS-inx RNAi/+) is shown. The results were normalized to the relative amount of ribosomal protein 49 (Rp49). The following primers were used (forward and reverse, respectively):
Inx1: 5'-GCATCAACATTATCGTGCAGAT-3' and 5'-ACACATAGACCATGGGATCCA-3'
Inx2: 5'-ATTGTATTGTGGACGAGATCCC-3' and 5'-TTGTGGTACTTCACCTCGTCC-3'
Inx3: 5'-GATCCTCAAGTATTTCGTGAACAGT-3' and 5'-ACATCCGTACCGTAGGACATG-3'
Inx4: 5'-TGCTGCCCCTGAATATACTGA-3' and 5'-GAAGCAACTGAAGACGCATTC-3'
Inx5: 5'-GATGTCCGGTTTGAACCTTCT-3' and 5'-GTTTGGTCATGAAACGCAACT-3'
Inx6: 5'-CTGCAGATGCTCACCAGGTAT-3' and 5'-CTGATGAACACATTGAGCAGCT-3'
Inx7: 5'-ATCAAGCGGCATGCATACTAC-3' and 5'-GTTAGACCCACCATTCGAAGG-3'
Inx8: 5'-TACAATTTGCACAACTTGCCC-3' and 5'-AGTTGTCGGTATTTTCTTTTGCC-3'
Rp49: 5'-CCAAGGACTTCATCCGCCACC-3' and 5'-GCGGGTGCGCTTGTTCGATCC-3'
Figure 3 with 3 supplements
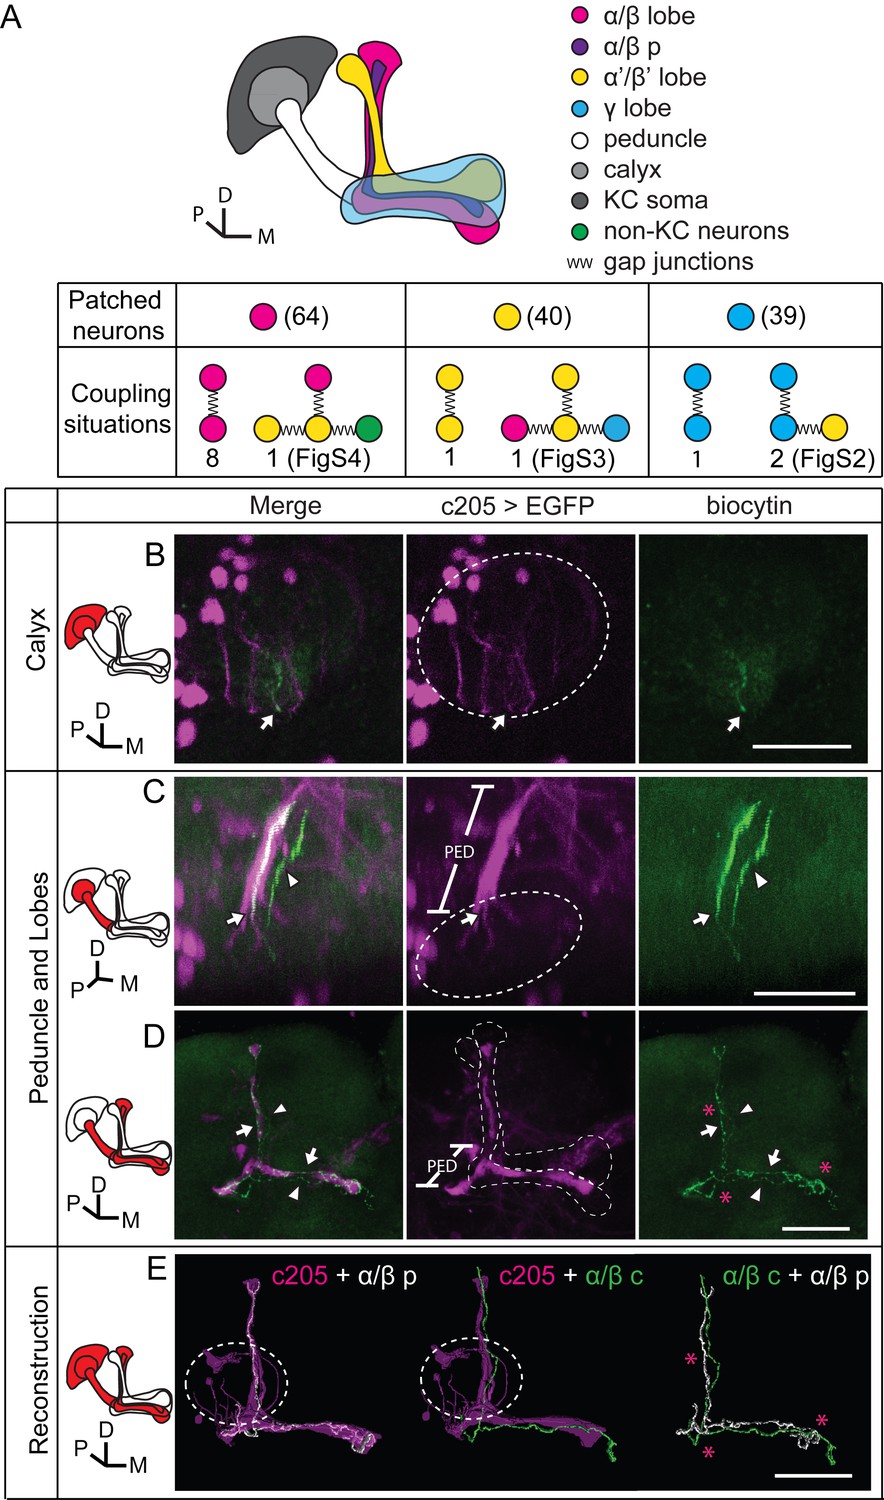
Dye coupling reveals presence of gap junctions in KCs.
(A) Schematic representation of MB and summary of dye coupling results. (B–D) One example in which biocytin was loaded into one KC, labeling more than one KC. Magenta, fluorescence of UAS-mCD8::EGFP (EGFP)-labeled α/β p stratum (driven by c205-GAL4); green, biocytin-filled neurites. (B) Z stack of the calyx and somas. One biocytin-filled fiber was observed. Arrow, the biocytin-filled fiber of the patched neuron; dotted circle, the boundaries of the calyx. (C) Z stack of the peduncle and lobes. Arrowhead, second biocytin-filled fiber. PED, peduncle. (D) Z stack of the peduncle and lobes in MBs. “*”, points to the overlap between the two biocytin–filled fibers. Dotted lines show the boundaries of the α/β lobe and the α’/β’ lobe. (E) Reconstructed morphology of the MB. Left, one neurite (white) was coincident with the α/β p stratum and presumed to be an α/β p neurite; middle, the other neurite (green) was not coincident with the α/β p stratum and was presumed to be an α/β core (α/β c) neurite; Right, the 2 neurites. D, dorsal; M, medial; P, posterior. Scale bar, 30 μm.
Figure 3—figure supplement 1
Dye coupling between two γ neurons and one α’/β’ neuron.
(A) Z stack of the soma layer of the MB. One dye-filled fiber is visible (arrowhead). (B) Z stack of the soma, calyx and peduncle (PED) of the MB. Two biocytin-filled long fibers (arrowhead) in peduncle are seen. (C) The dye–filled fibers shown in (A, B) was traced with TrackEM2. The two γ fibers are indicated in green and orange. The fibers that could belong to either of the two γ neurons or to other neurons are shown in purple. (D) The traced fibers, shown at the same angle of view as in (B). (E) Z stack of the lobes of the MB. Two γ fibers (arrowheads) and one α’ fiber (double arrowhead) were filled with dye. Magenta, the fluorescence of UAS-mCD8::EGFP (EGFP, driven by OK107-GAL4 and labeling the whole MB); green, the Alexa Fluor 568-filled neurites. Arrowhead, the dye–filled γ fibers; double arrowhead, the dye–filled α’ fiber; arrow, the loaded soma (removed with the electrode and represented by a small dotted circle). Large dotted circle, the boundary of the calyx; dotted lines, the boundaries of the α’/β’ lobe (white) and the γ lobe (blue). PED, peduncle. (F) Schematic diagram of the brain. “*”, intersection point of dye–filled fibers. Scale bar, 30 μm.
Figure 3—figure supplement 2
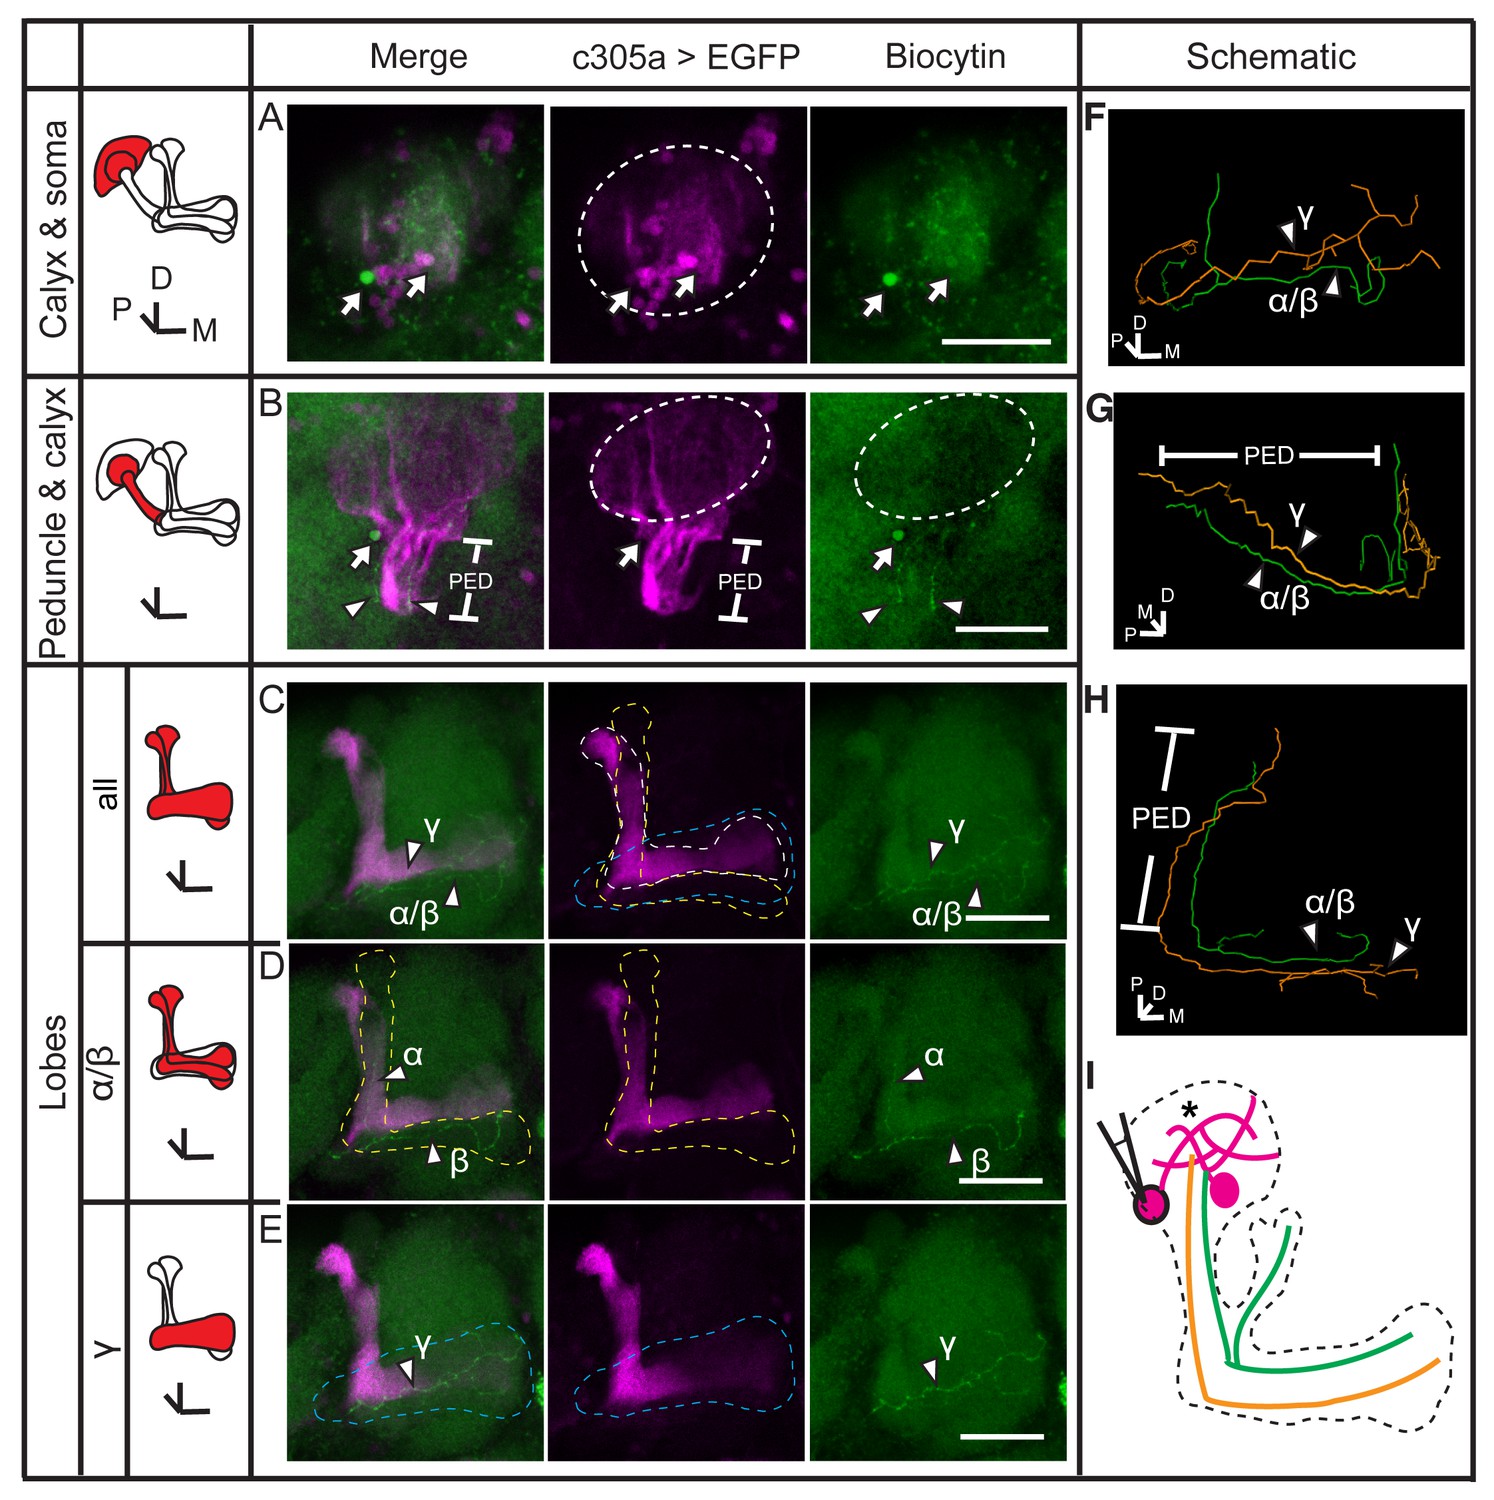
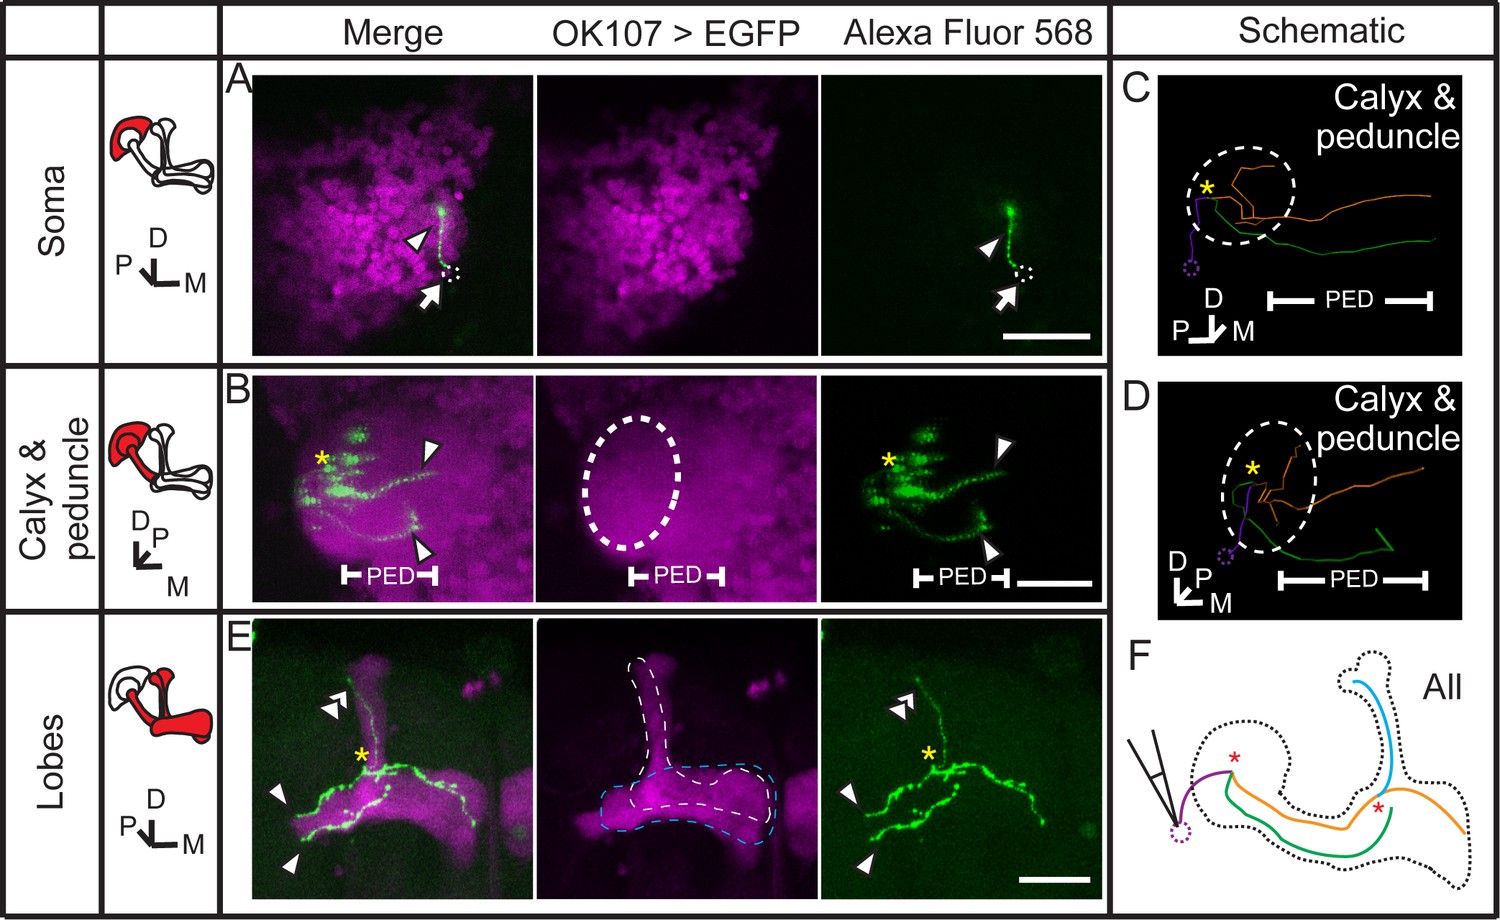
Dye coupling between α/β, α’/β’ and γ neurons.
(A) Z stack of the soma and calyx layers of the MB. Two fluorescence-labeled somas were filled with dye (arrow). The one on the left was bright and was presumed to be the one that was loaded. This soma is also shown in (B) (arrow). (B) Z stack of the calyx and peduncle (PED) of the MB. Two biocytin-filled fibers were observed (arrowhead). (C) The lobes of the brain. Two dye-filled fibers are visible (arrowhead, α/β and γ). (D, E) The layers of the lobe were divided into 2 parts from anterior to posterior and stacked. The two biocytin-filled fibers in (C) are shown separately (arrowhead, α/β and γ). Magenta, the fluorescence of UAS-mCD8::EGFP (EGFP, driven by c305a-GAL4, labelling the α’/β’ lobe of the MB); green, biocytin-filled fibers. Arrowhead, the biocytin-filled fibers; arrow, the biocytin-filled somas; dotted circle, the boundary of the calyx; dotted lines, the boundaries of the α’/β’ lobe (white), the α/β lobe (yellow) and the γ lobe (blue). PED, peduncle. Scale bar, 30 μm. (F–H) The biocytin-filled fibers were traced with TrackEM2 and are shown from different perspectives. The α/β fibers are shown in green and the γ fiber in orange. (I) Schematic diagram of the brain. Magenta, α’/β’ somas and presumed fibers; green, the biocytin-filled α/β fiber; orange, the dye-filled γ fiber. “*”, the points where dye coupling likely occurred.
Figure 3—figure supplement 3
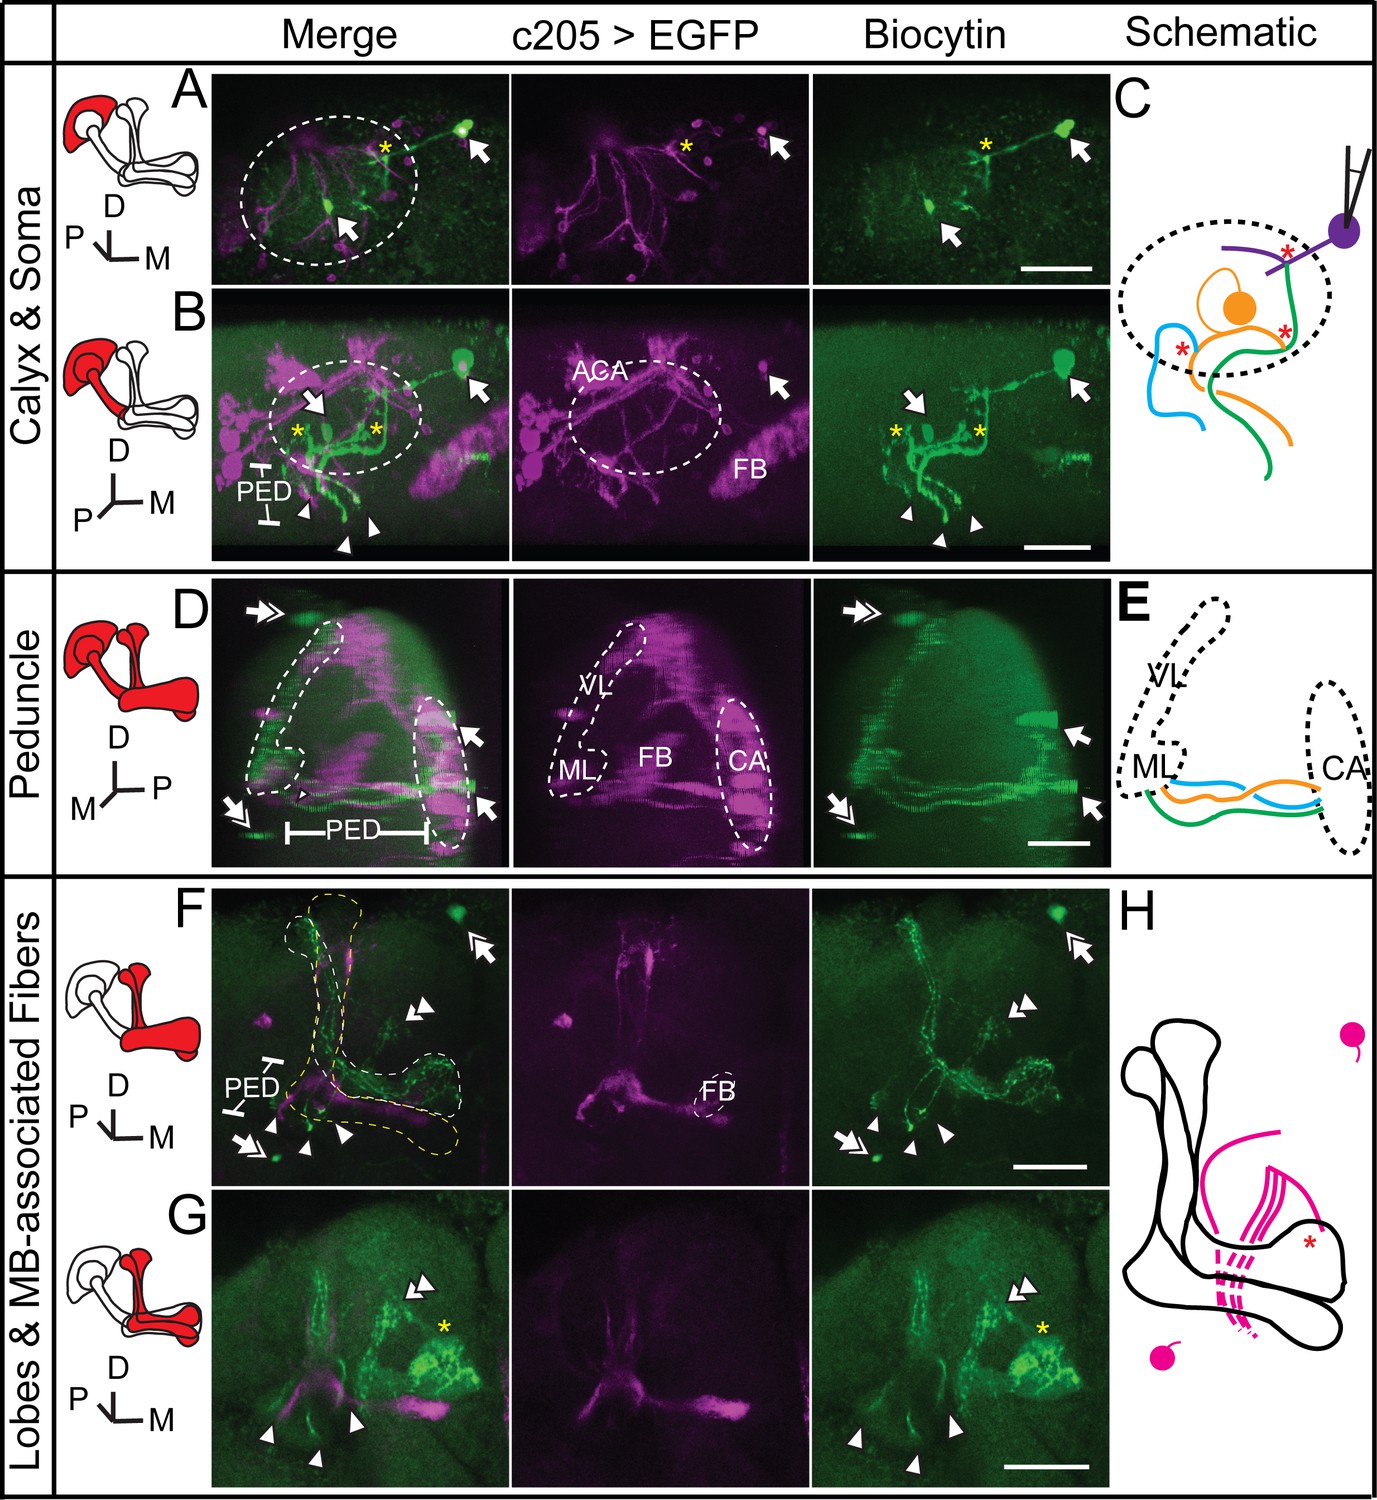
Dye coupling between α/β, α’/β’ and non-KC fibers.
(A) Z stack of the soma layer of the MB. Two biocytin-filled somas were observed (arrow). The soma on the right was bright and abnormal in shape and was presumed to be the one that was loaded. (B) Z stack of the soma layer, calyx layer and half of the peduncle layer of the MB, shown from a different angle. Three biocytin-filled fibers are clearly visible (arrowheads). (C) Schematic diagram of the biocytin-filled soma and fibers in the calyx shown in (A, B), presented in different colors. (D) Sagittal view of the brain, showing the three biocytin-filled fibers in the peduncle (arrowheads). Two dye-filled somas are observed (double arrow) on the anterior surface of the brain. (E) Schematic diagram of the biocytin-filled fibers in the peduncle shown in (D). (F) Z stack of the lobes of the MB. Three fibers are visible in the α’/β’ lobe. Two dye-filled somas are observed (double arrow) on the anterior surface of the brain. (G) The biocytin-filled non-KC fibers are shown (double arrowhead). (H) Schematic diagram of the biocytin-filled non-KC fibers shown in (F, G). Magenta, the fluorescence of UAS-mCD8::EGFP (EGFP, driven by c205-GAL4 and labelling the α/β p stratum of the MB and FB); green, the biocytin-filled fibers. Arrowhead, the biocytin-filled fibers; double arrowhead, the biocytin-filled non-KC fibers; arrow, the biocytin-filled KC somas; double arrow, the biocytin-filled non-KC soma. Dotted circle, the boundary of the calyx; dotted lines, the boundaries of the α’/β’ lobe (white), the α/β lobe (yellow) and the γ lobe (blue). “*”, the presumed points of dye coupling. PED, peduncle; VL, vertical lobes; ML, medial lobes; FB, fan-shaped body; CA, calyx; ACA, accessory calyx. Scale bar, 30 μm.
Figure 4 with 2 supplements
Electrical coupling reveals presence of gap junctions between KCs andβ’2mp neurons.
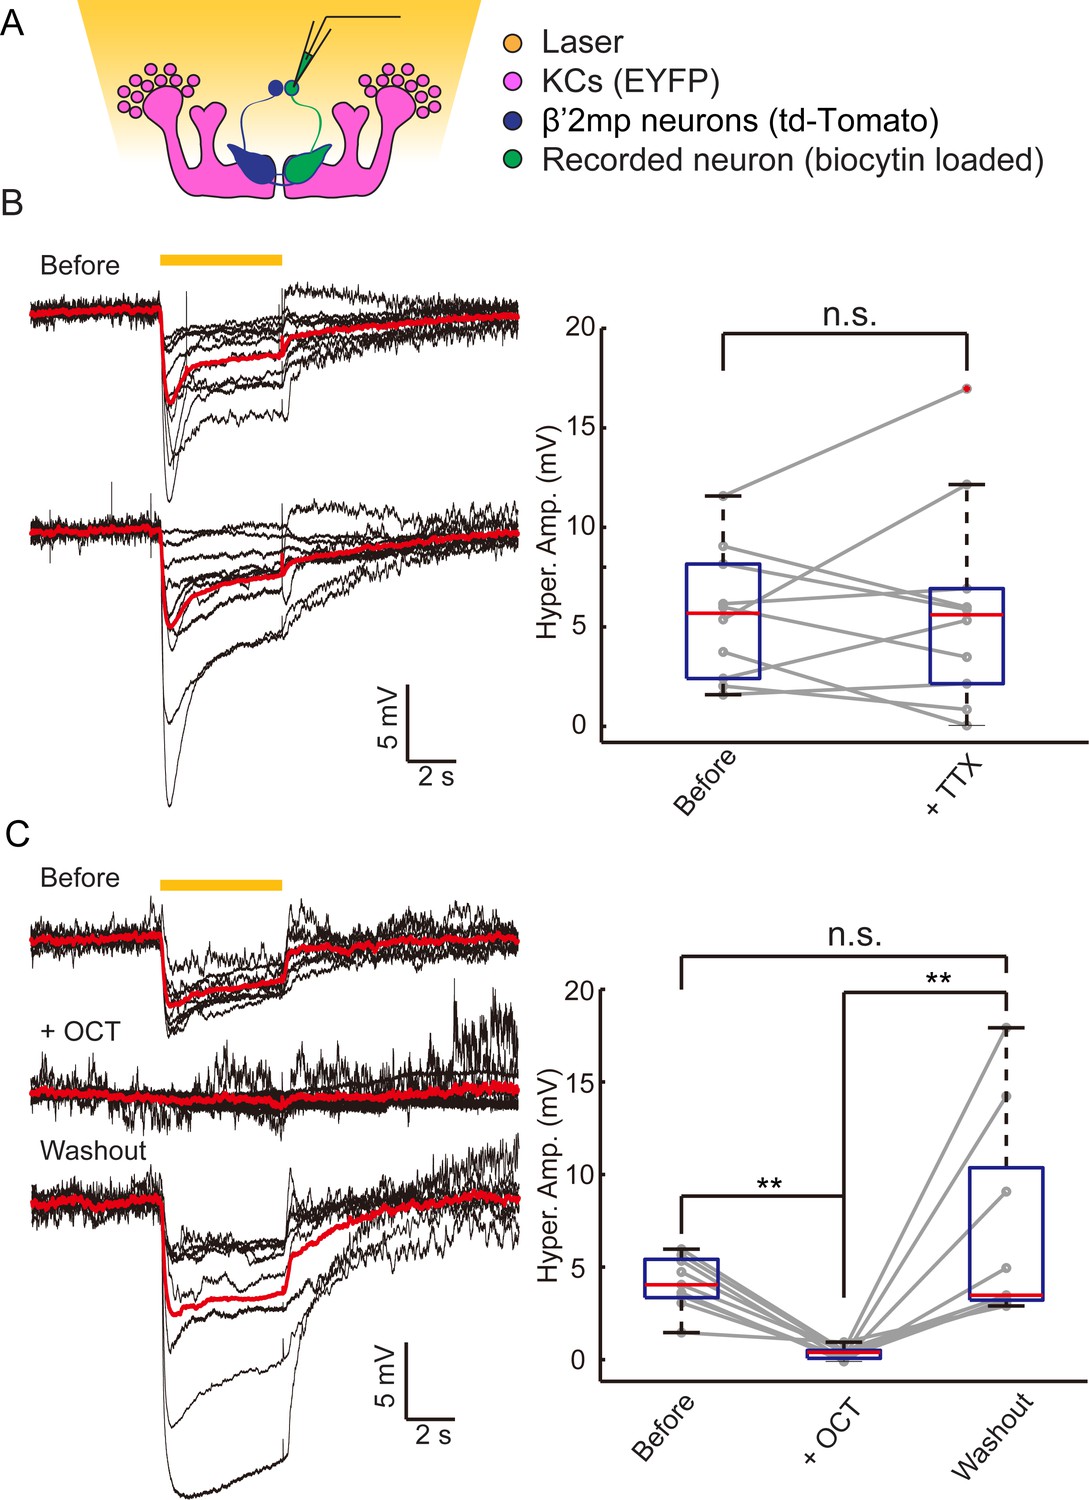
(A) Strategy used to detect electrical coupling between MBONs and KCs. Membrane potentials of MBON somata were recorded during hyperpolarization of KCs using optogenetics. The recorded soma was loaded with biocytin for later identification. (B) Whole-cell recordings were performed on MBON-β’2mp neurons while KCs were hyperpolarized using laser light with emission at 593 nm (yellow bar). Hyperpolarization was observed in the recorded β’2mp neurons. TTX delivery did not affect hyperpolarization. Black traces, average of the membrane-potential traces for each recorded β’2mp neurons (n = 10). Red traces, average of the black traces. Box plots show the peaks of the hyperpolarization amplitudes (Hyper. Amp.) before and after TTX delivery. (C) MBON β’2mp neurons were recorded as in (B). Hyperpolarization was eliminated after the application of the gap junction blocker 2-OCT and recovered after washout of 2-OCT (n=9). Box plots show the hyperpolarization amplitudes. Performance indices represent the mean ± SEM.
Figure 4—figure supplement 1

No difference observed between NpHR- and Arch-mediated hyperpolarization of KCs.
(A) Scheme for detecting KC hyperpolarization. (B) Current-clamp traces showing hyperpolarization evoked in KCs using laser light with emission at 593 nm. The KCs expressed eArch3.0 (upper, n = 5) or eNpHR3.0 (lower, n = 13). Black traces, average of the membrane-potential traces for each recorded KCs. Red traces, average of the black traces. (C) Box plots show the peaks of the hyperpolarization amplitudes of KCs expressing eNpHR3.0 or eArch3.0. (D) Hyperpolarization evoked in a KC expressed eArch3.0 (left) or eNpHR3.0 (right) before and after 2-OCT delivery. Gray traces, the membrane potential of the recorded KC. Black traces, the average of the gray traces.
Figure 4—figure supplement 2
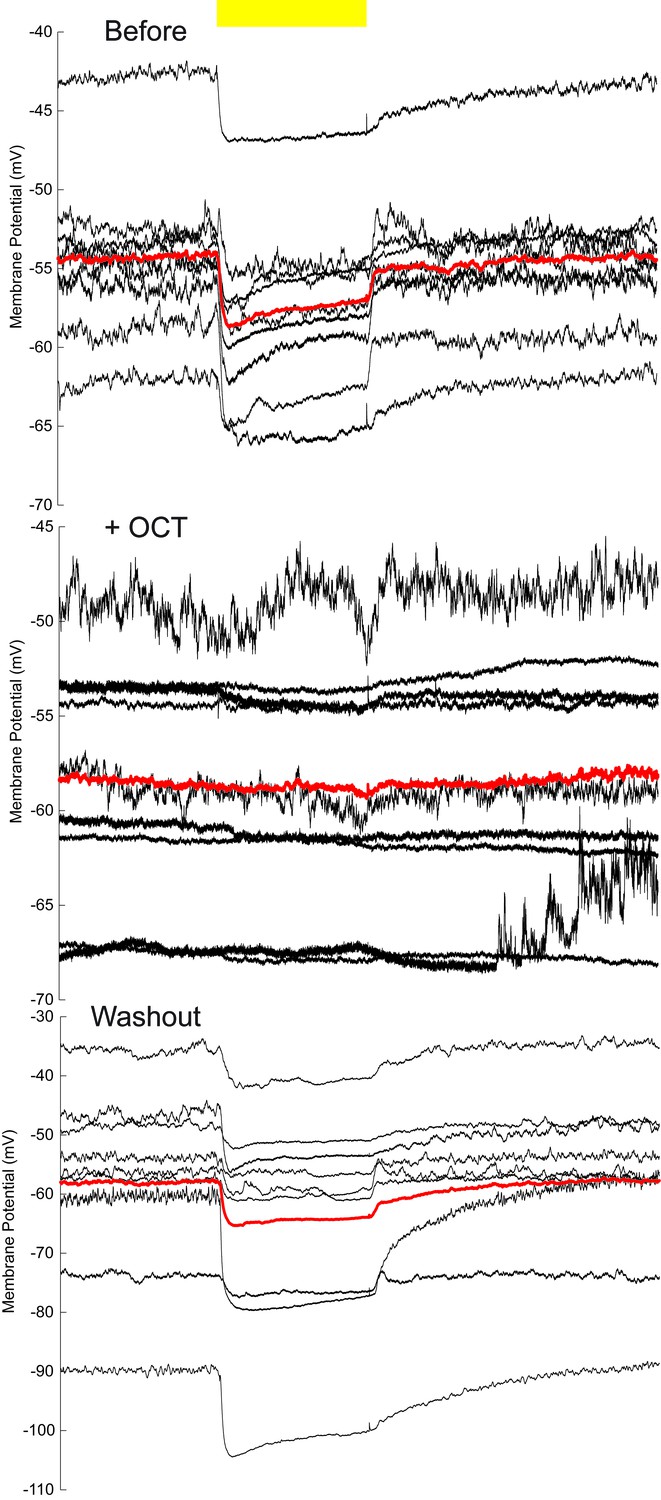
Membrane-potential traces of MBON-β’2mp neurons in the OCT experiments.
The same data shown in Figure 4C, without baseline calibration. Yellow bar, 593 nm laser. Black traces, average of the membrane-potential traces for each recorded β’2mp neurons. Red traces, average of the black traces.
Figure 5

Dye coupling between KCs and β’2mp neurons.
(A) Z stack of MB lobes and half of the peduncle. Biocytin-filled neurites (arrowhead) are observed within the boundary of the α’/β’ lobe (dotted line) and peduncle (PED). (B–D) The lobe layers were divided into 3 parts from anterior to posterior and then stacked. In each stack, biocytin-filled neurites are visible within the boundaries of theα’/β’ lobe and peduncle. (E) Z stack of KC somas, the calyx and half of the peduncle. One biocytin-filled fiber is seen Green, biocytin-loaded neurites; magenta, the fluorescence of YFP-labeled KCs (driven by MB247-lexA); blue, the fluorescence of td-Tomato-labeled MBONs (driven by MB011B-GAL4). Arrow, arborizations of β’2mp neurons projecting to the tip of the β’ lobe; arrowhead, the biocytin-filled KC fibers; dotted line, the boundary of the α’/β’ lobe. PED, peduncle. Scale bar, 30 μm. (F) Schematic diagram of the brain. White, the α’/β’ neuron that was dye-coupled with the β’2mp neurons. “*”, the presumed points of gap junctions.
Figure 6
Gap junctions between KCs and β’2mp neurons are necessary for visual learning and memory.
Knockdown of inx5 or inx6 in β’2mp neurons results in impaired visual learning and memory. The following RNAi lines were used: inx1: v103816; inx2: v102194; inx3: v39094; inx4: v33277; inx5: v102814; inx6: v8638; inx7: v103256; inx8: v26801; JF5: TRiP. JF02877; and JF6: TRiP. JF02168. N=17 to 20 for each data point. Asterisks in grey indicate the level of statistical significance of the performance indices compared against chance level. Asterisks in black indicate the level of statistical significance of the performance indices between groups. (*p<0.05; **p<0.01; ***p<0.001).
Videos
Video 1
Raw stack of the brain in Figure 3.
https://doi.org/10.7554/eLife.13238.012
Video 2
Rotated stack of the brain in Figure 3—figure supplement 1.
https://doi.org/10.7554/eLife.13238.013
Video 3
Raw stack of the brain in Figure 3—figure supplement 2.
https://doi.org/10.7554/eLife.13238.014
Video 4
Raw stack of the brain in Figure 3—figure supplement 3.
https://doi.org/10.7554/eLife.13238.015
Video 5
Raw stack of the anterior half of the brain in Figure 5.
https://doi.org/10.7554/eLife.13238.020
Video 6
Raw stack of the brain in Figure 5.
https://doi.org/10.7554/eLife.13238.021Tables
Table 1
Dye coupling in wild type and inx5/6 knockdown flies.
| WT | INX 5&6 KD | ||
|---|---|---|---|
| Loaded neurons | αβ | 21 | 27 |
| α’β’ | 9 | 10 | |
| γ | 8 | 15 | |
| Dye coupling | 5 | 0 | |
Additional files
-
Supplementary file 1
The specificity and target sequences of RNAi for innexin 1~8.
THU, Tsinghua University.
- https://doi.org/10.7554/eLife.13238.024
Download links
A two-part list of links to download the article, or parts of the article, in various formats.
Downloads (link to download the article as PDF)
Open citations (links to open the citations from this article in various online reference manager services)
Cite this article (links to download the citations from this article in formats compatible with various reference manager tools)
Gap junction networks in mushroom bodies participate in visual learning and memory in Drosophila
eLife 5:e13238.
https://doi.org/10.7554/eLife.13238


