Regulation of cell protrusions by small GTPases during fusion of the neural folds
- University College London, United Kingdom
Figures
Figure 1

Schematic representation of the final events of neurulation in the spinal region of the mouse embryo.
The apposing neural folds exhibit cell protrusions from their tips (left), the neural folds then undergo fusion (middle), and the two epithelia remodel to generate a closed neural tube covered by SE (right).
Figure 2 with 3 supplements
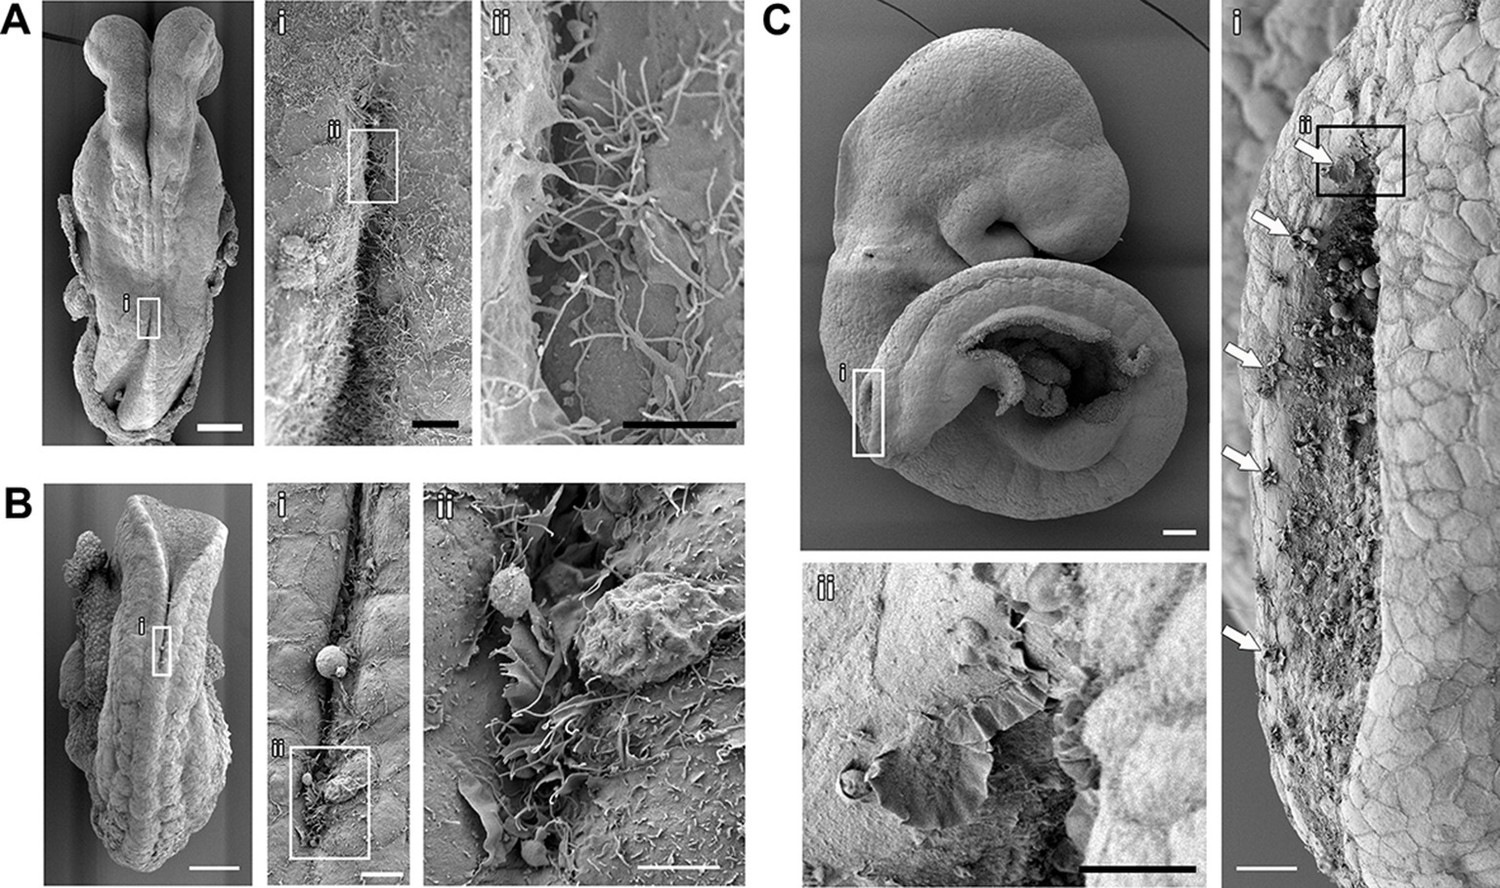
Cell protrusions emanate from the interface between the NE and the SE of apposing neural folds during spinal neurulation.
(A–C) SEMs of ss7 (A), ss12 (B), and ss24 (C) embryos. The point of spinal neural fold apposition exhibits filopodia at ss7, filopodia and ruffles at ss12 and membrane ruffles at ss24. Note the presence of ruffles at intervals along the edges of the PNP neural folds (Ci, arrows). At least 10 different embryos were analysed. Scale bars: 100 µm (A, B, C), 20 µm (Ai, Ci), 10 µm (Aii, Bi, Cii), and 5 µm (Bii).
Figure 2—figure supplement 1
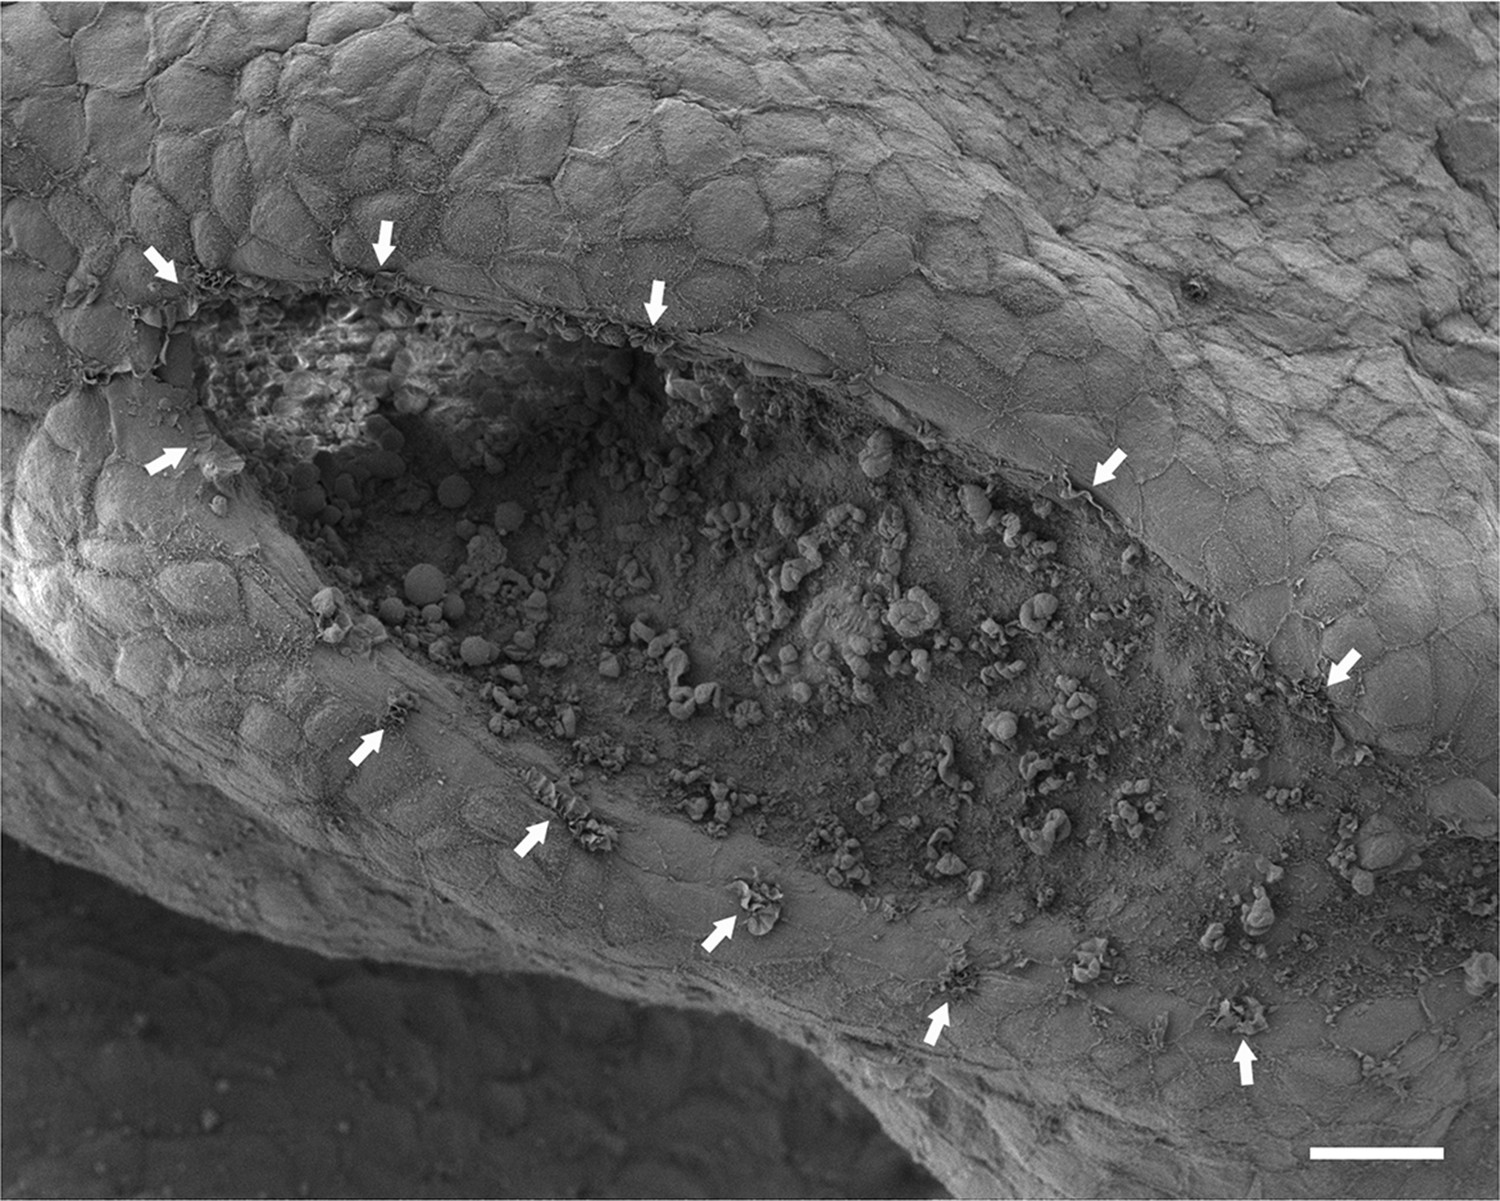
Protrusions are present on the tips of both neural folds.
Dorsal view of the PNP of the same embryo depicted in Figure 2C, showing membrane ruffles (arrows) on the edges of both neural folds. Anterior is top left, posterior is bottom right. Note also membrane blebs present on the apical surface of the NE, as described (Waterman, 1976). Scale bar: 20 µm.
Figure 2—figure supplement 2
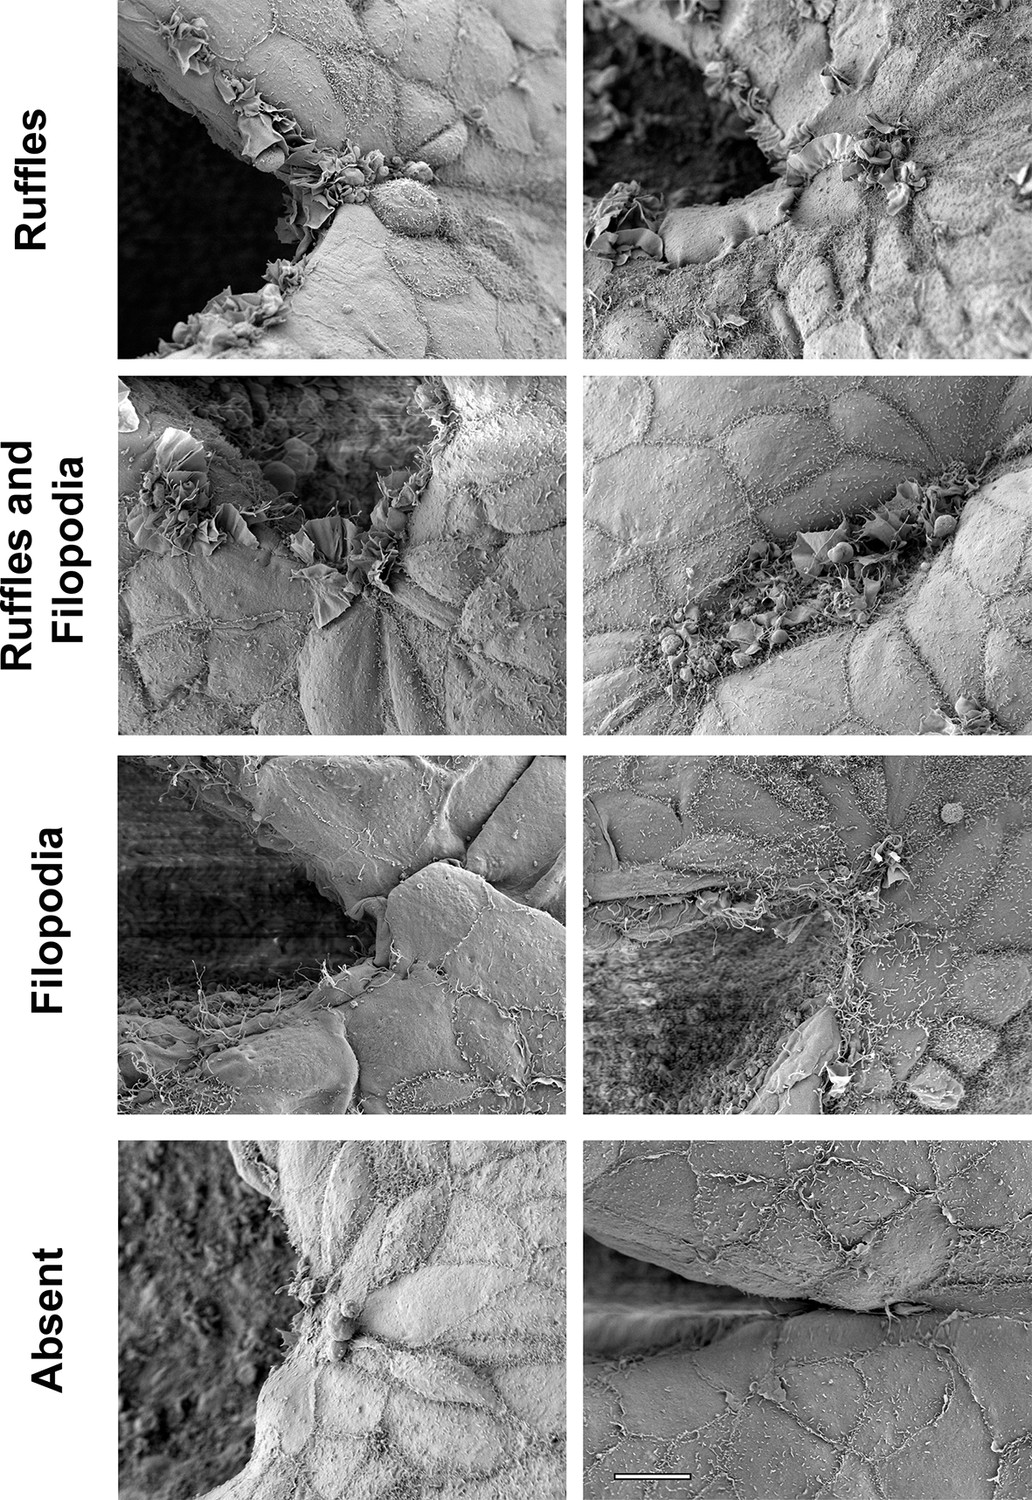
Examples of different types of protrusions visualized by SEM at the PNP point of fusion.
Ruffles, in which membrane ruffles without any filopodia protruding from them are the main or predominant type of protrusion observed. Ruffles and Filopodia, in which a mixture of the two types of protrusions are observed, sometimes with filopodia or microspikes emanating from the edges of ruffles. Filopodia, in which filopodia are the main or predominant type of protrusion observed. Absent, in which no or very few incipient protrusions are observed. Scale bar: 10 µm.
Figure 2—figure supplement 3
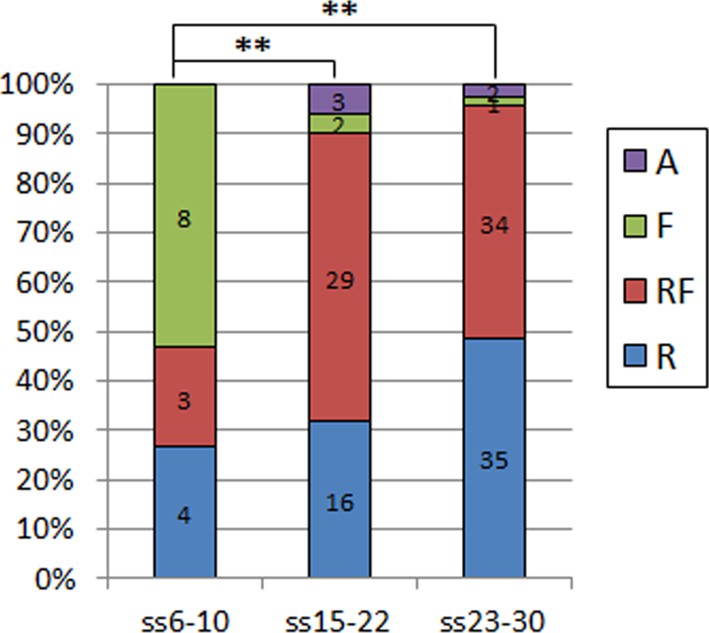
Quantification of the types of protrusion observed in all control embryos used in the different crosses in this study.
There is a significant difference between embryos at the onset of spinal neurulation (ss6-10), with filopodia being predominant here, and in later stages embryos being replaced by ruffles only or ruffles and filopodia (**p=0.00011 and p=0.00000 for comparison with ss15-22 and ss23-30, respectively). The percentage of embryos displaying ruffles only increases further at the end of spinal neurulation (ss23-30), but this difference is not statistically significant when compared to ss15-22 embryos (p=0.21169). A – Absent or incipient protrusions, F – Filopodia only (or predominantly), RF – mixture of Ruffles and Filopodia (or filopodia emanating from ruffles), R – Ruffles only (or predominantly).
Figure 3 with 5 supplements
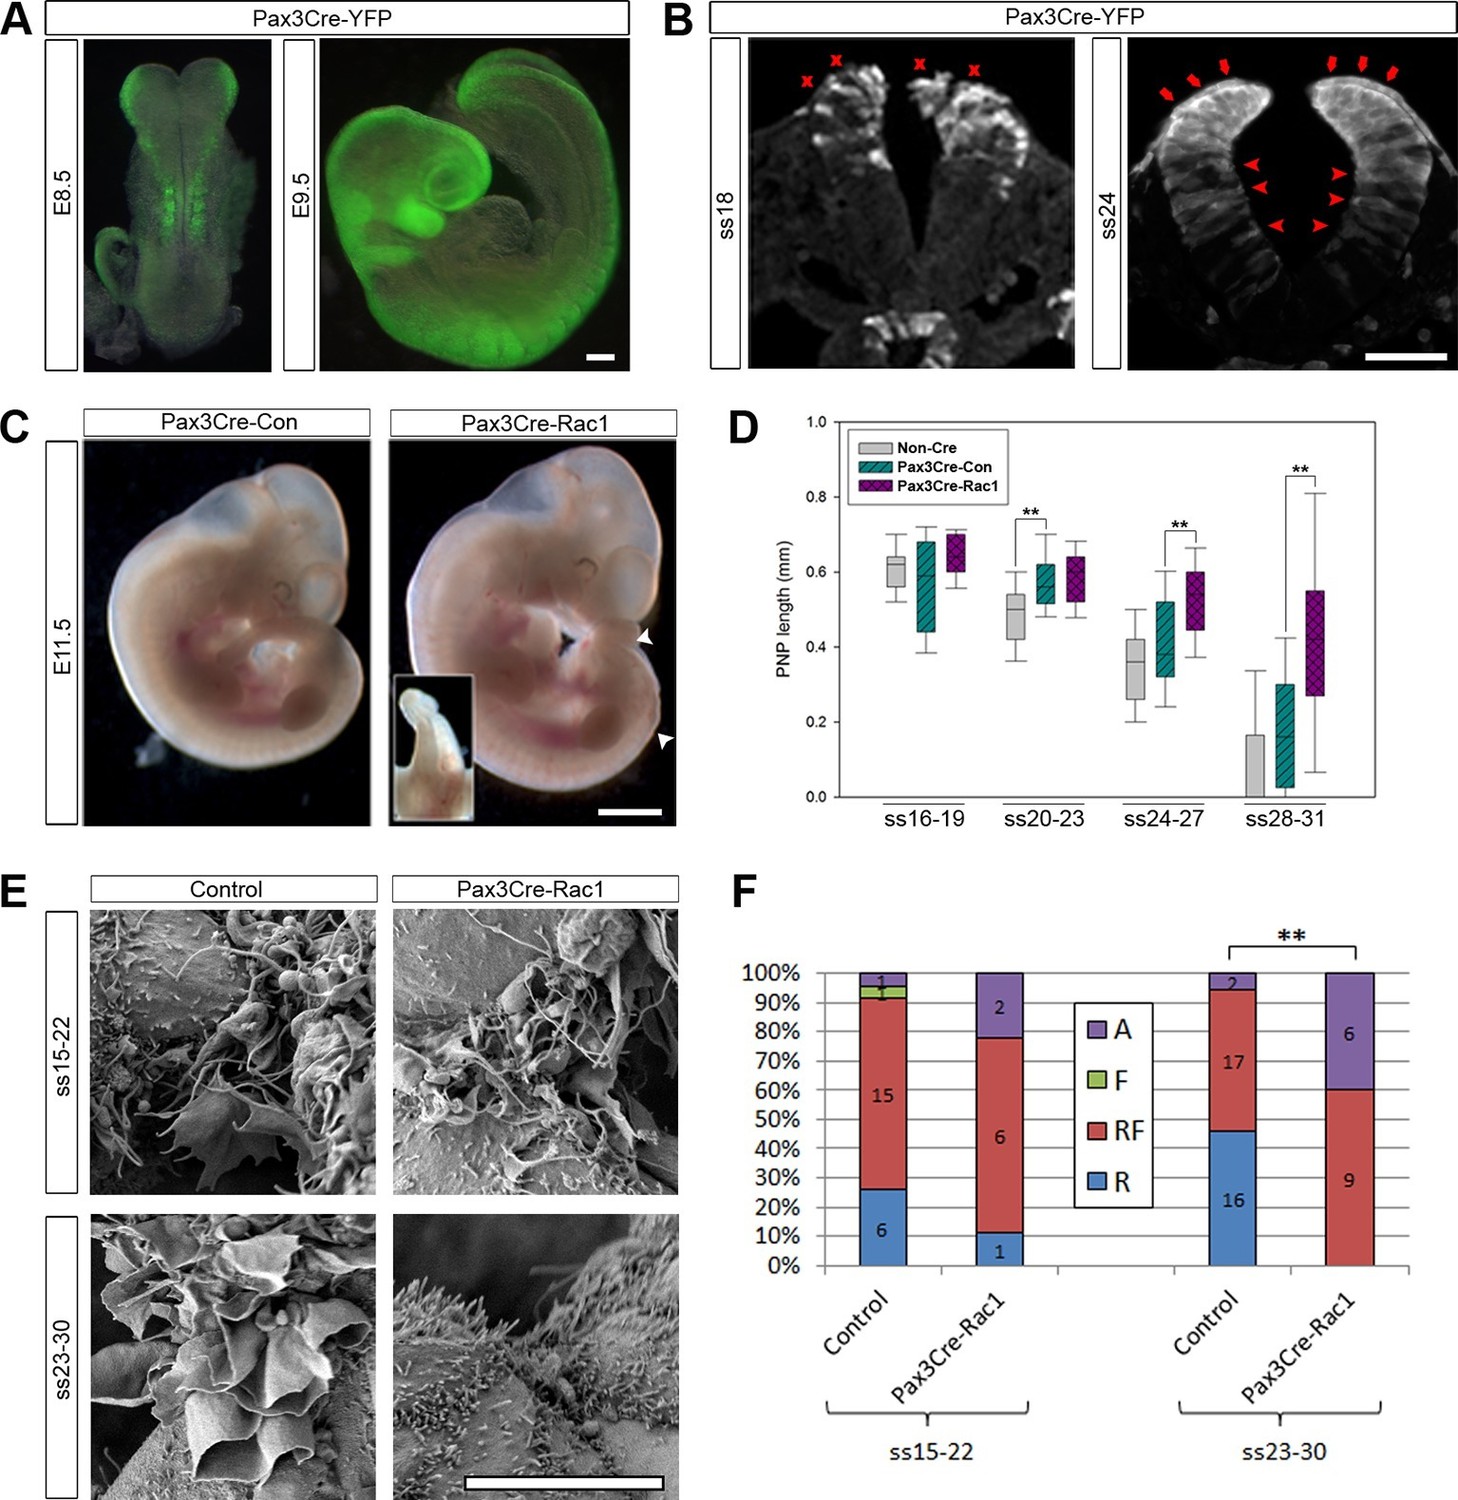
Pax3Cre-Rac1 mutants display late failure of PNP closure, with absence of ruffles.
(A, B) Pax3Cre-driven recombination in the dorsal neural folds and neural tube, detected from E8.5 by direct YFP-reporter expression (A), and by immunofluorescence in transverse sections of the closing neural tube at E9.5 (B). After ss20, recombination is also detected in the dorsal SE (red arrows), but not at earlier stages (red crosses). Note also recombination in cells of the ventral NE (red arrowheads; see also Figure 3—figure supplement 1). At least three different embryos were analysed for each stage. (C, D) Pax3Cre-Rac1 mutants display open spina bifida at E11.5 (C, white arrowheads and inset, quantified in Table 1) and delayed PNP closure from ss24-27 onwards (D, **p<0.001 – see Figure 3—source data 1 for raw values and statistical details). (E, F) SEMs of the PNP fusion point of control embryos show predominantly ruffles and filopodia at ss15-22 and ruffles at ss23-30, whereas Pax3Cre-Rac1 mutants show ruffles and filopodia at ss15-22 and absent protrusions at ss23-30 (E, quantified in F, p=0.29604 for ss15-22 and **p=0.0002 for ss23-30). A – Absent or incipient protrusions, F – Filopodia only (or predominantly), RF – mixture of Ruffles and Filopodia (or filopodia emanating from ruffles), R – Ruffles only (or predominantly). Scale bars: 100 µm (A and B), 1 mm (C) and 10 µm (E).
-
Figure 3—source data 1
Source data and statistical analysis for Figure 3D.
- https://doi.org/10.7554/eLife.13273.009
Figure 3—figure supplement 1
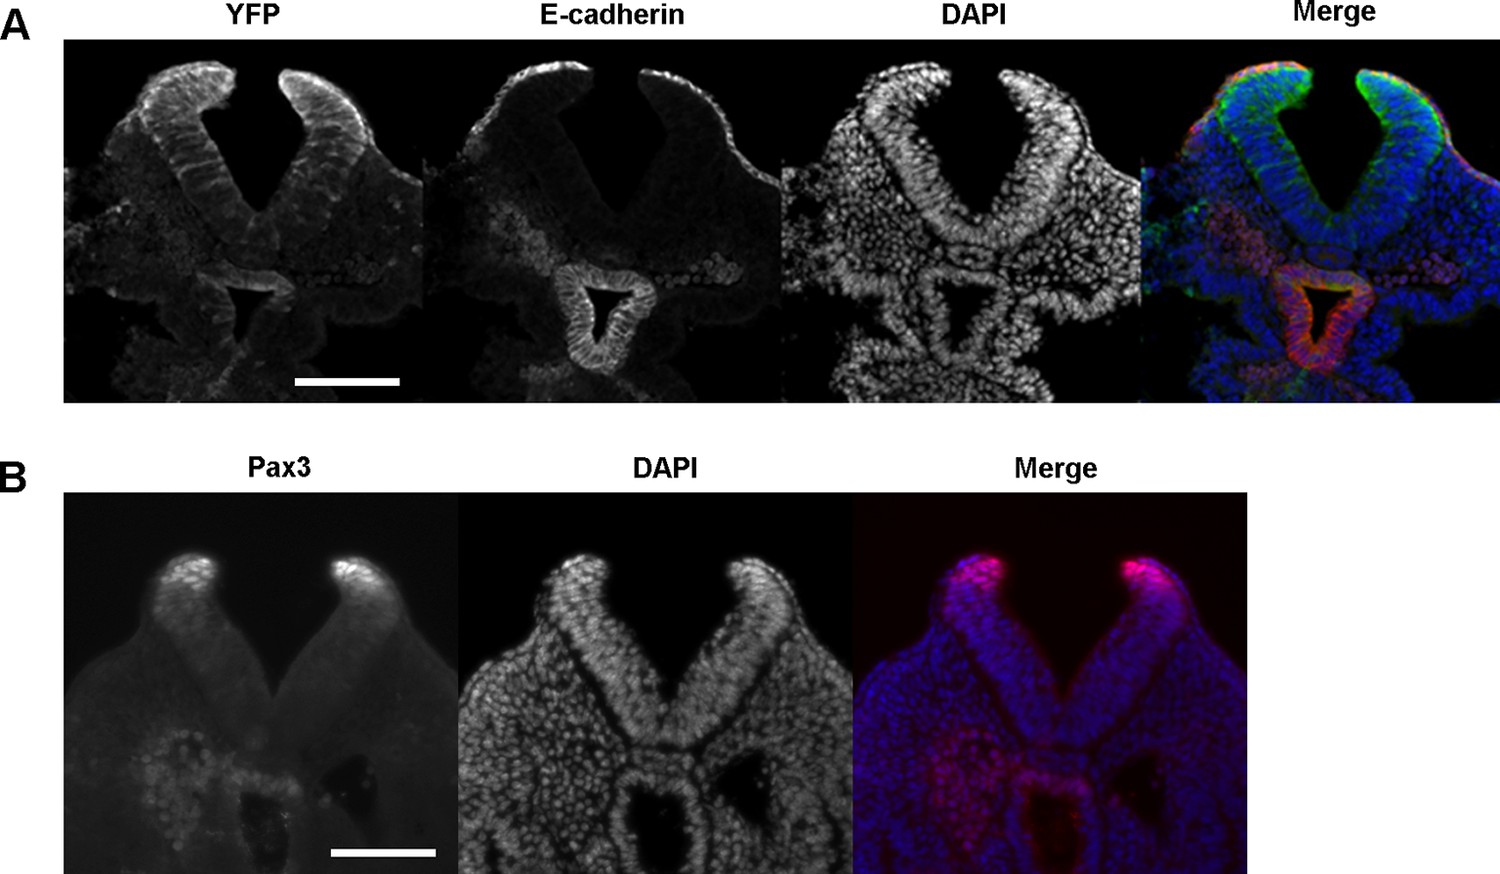
Pax3Cre drives recombination in a domain of cells that includes the dorsal SE, in addition to dorsal NE.
(A, B) Transverse sections through the E9.5 PNP (>ss20) of Pax3Cre-YFP embryos showing immunolocalisation of YFP and E-cadherin (A) and Pax3 protein (B). Note co-localisation of E-cadherin and YFP in (A). The YFP expression domain, which includes SE, dorsal NE, and scattered ventral NE cells, appears more extensive than the Pax3 expression domain, which is confined to dorsal NE (B). Minimum of three embryos analysed. See also Figure 3B. Scale bars: 100 µm.
Figure 3—figure supplement 2
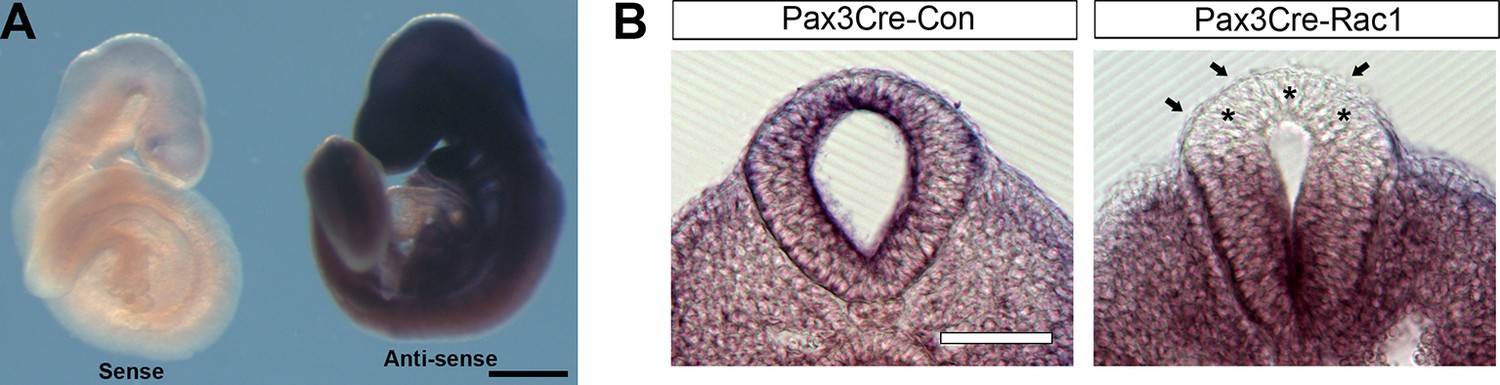
Pax3Cre-Rac1 conditional mutants show tissue-targeted deletion of Rac1.
(A) Whole-mount in situ hybridisation with sense and antisense RNA probes against mouse Rac1 exons 4 and 5 show specificity of the antisense probe used. (B) Pax3Cre-Rac1 mutants show Rac1 depletion in the dorsal NE (asterisks) and SE (arrows), consistent with the findings of reporter expression using the Pax3Cre line (Figure 3B). Scale bars: 500 µm (A) and 200 µm (B).
Figure 3—figure supplement 3

Pax3Cre-Rac1 mutants show normal bending of the neural plate.
Transverse sections, stained with haematoxylin and eosin, through the PNP of E9.5 embryos. Pax3Cre-Rac1 conditional mutants form dorsolateral hinge points (arrowheads) during spinal neurulation, similar to Pax3Cre-Con embryos (n = 3 for each group), suggesting that faulty neural fold bending is unlikely to account for the neural tube defects in these mutant embryos. Scale bar: 100 µm.
Figure 3—figure supplement 4
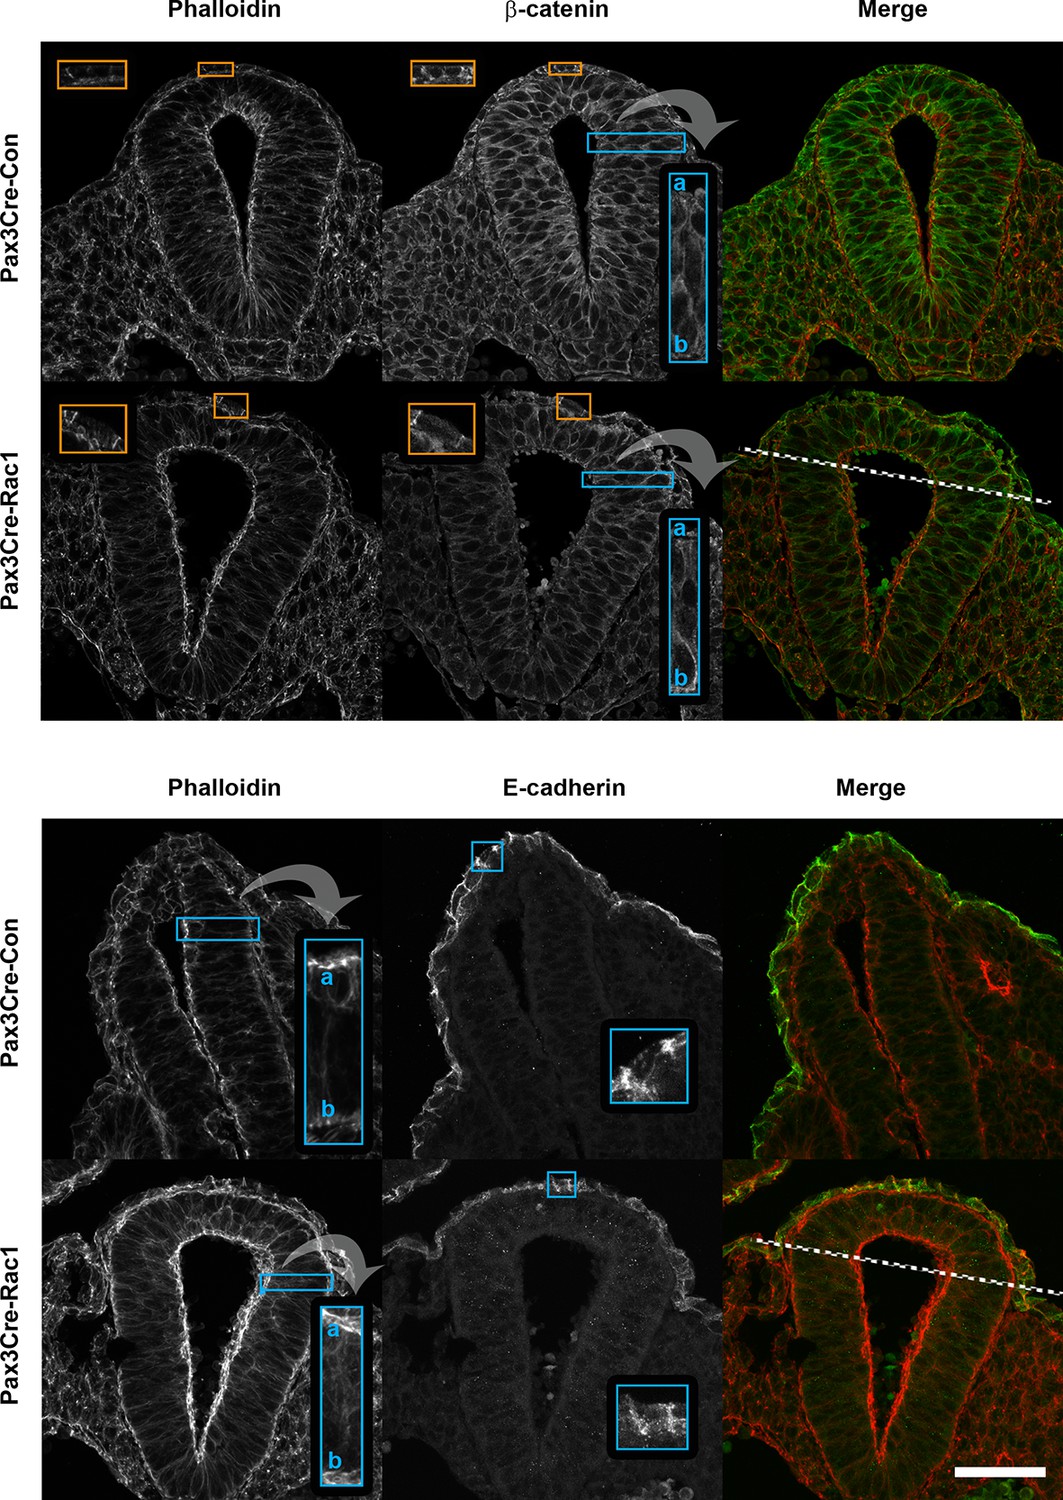
Pax3Cre-Rac1 mutants show normal F-actin and adherens junction components distribution.
Transverse sections through the recently closed neural tube of E9.5 embryos showing actin (phalloidin staining), and β-catenin and E-cadherin immunolocalisation. Pax3Cre-Rac1 conditional mutants show a closely similar distribution of all these proteins (see insets) in both the targeted areas (dorsal NE and dorsal midline SE; above dashed lines) and non-targeted areas (below dashed lines). This includes apical actin accumulation in the NE (top and bottom panels; n = 3 for phalloidin) β-catenin in both NE and SE (top panel; n = 3), and E-cadherin in SE (bottom panel; n = 2). Scale bar: 50 µm.
Figure 3—figure supplement 5
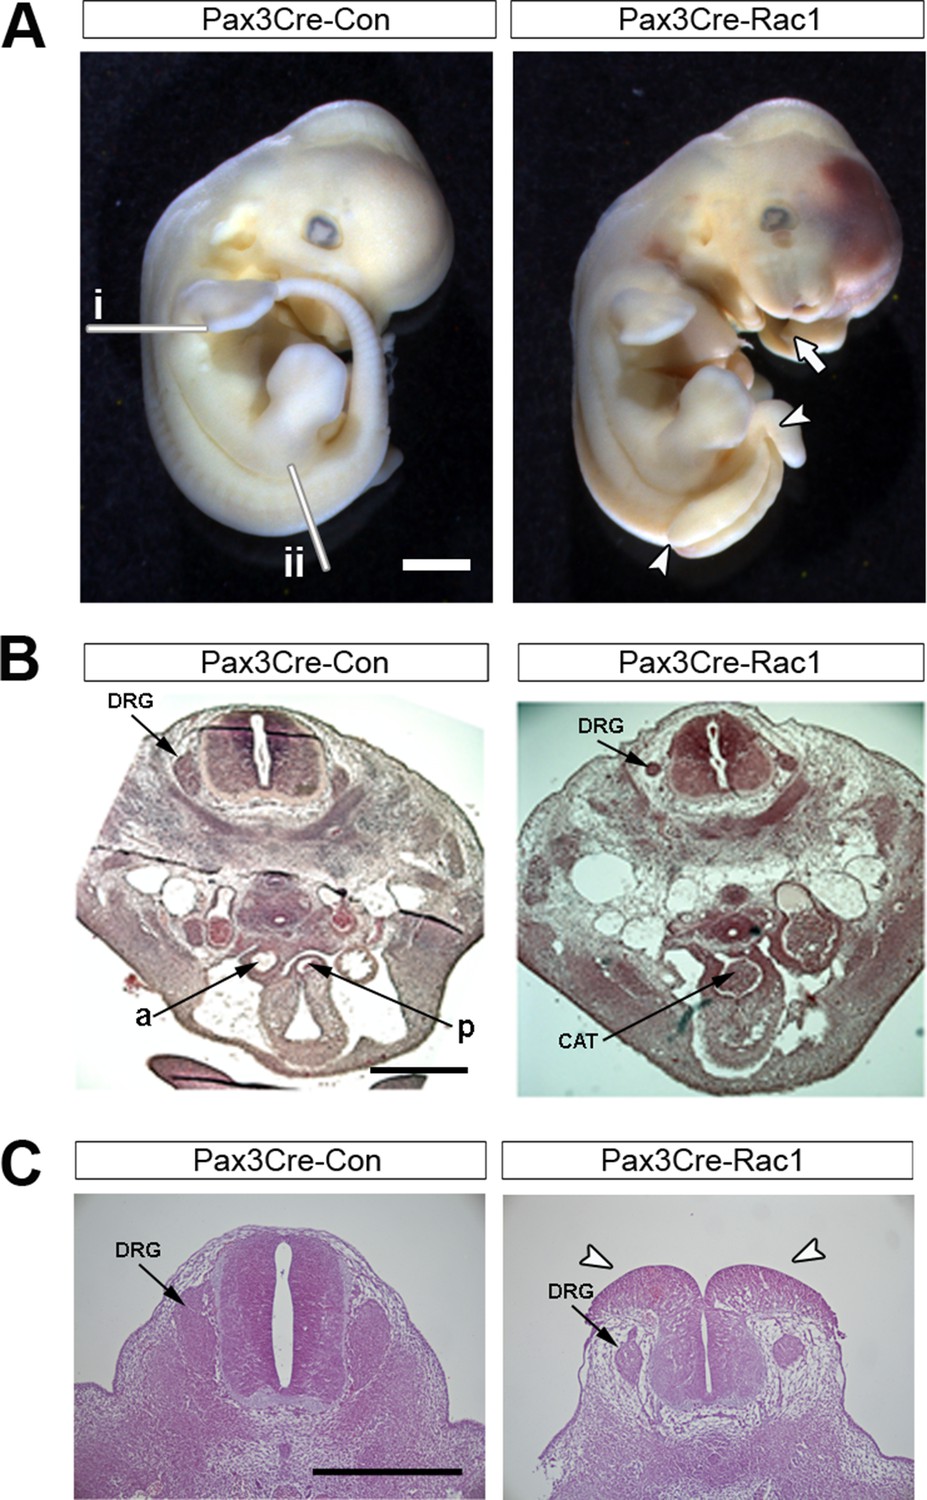
Pax3Cre-Rac1 mutants show defects in neural crest-derived structures.
(A) Pax3Cre-Rac1 mutant embryo at E12.5 showing split face (arrows), pools of blood indicating circulation defects, spina bifida (arrowheads), and general embryo discolouration indicating imminent death (quantified in Table 1). Lines in (A) show the approximate levels of the sections shown in (B) (i) and (C) (ii). (B) Histological transverse sections through the trunk at heart level of Pax3Cre-Con and Pax3Cre-Rac1 mutant embryos at E12.5. The mutant embryo has formed a common arterial trunk (CAT) rather than displaying normal outflow tract septation with separate aortic (a) and pulmonary (p) trunks, and displays dorsal root ganglia (DRG) of reduced size (2 embryos analysed per group). (C) Histological transverse sections through the spinal cord at hindlimb bud level of Pax3Cre-Con and Pax3Cre-Rac1 mutant embryos at E12.5. The mutant embryo exhibits dorsal root ganglia (DRG) of reduced size, and an open spinal cord at this level (arrowheads) (two embryos analysed per group). Scale bars: 1 mm (A), 500 µm (B), and 200 µm (C).
Figure 4 with 1 supplement

Failure of PNP closure does not cause defective protrusive activity.
(A) SEMs of E9.5 curly tail embryos showing examples of small and large PNPs (double arrows). (B, C) SEMs of the PNP fusion point of curly tail embryos show either membrane ruffles or ruffles and filopodia at ss23-30 (B, quantified in C). There is no difference in protrusion type or frequency between embryos with small and large PNPs (p=0.71782). Definition of protrusion types as in Figure 3. Scale bars: 100 µm (A) and 10 µm (B).
Figure 4—figure supplement 1
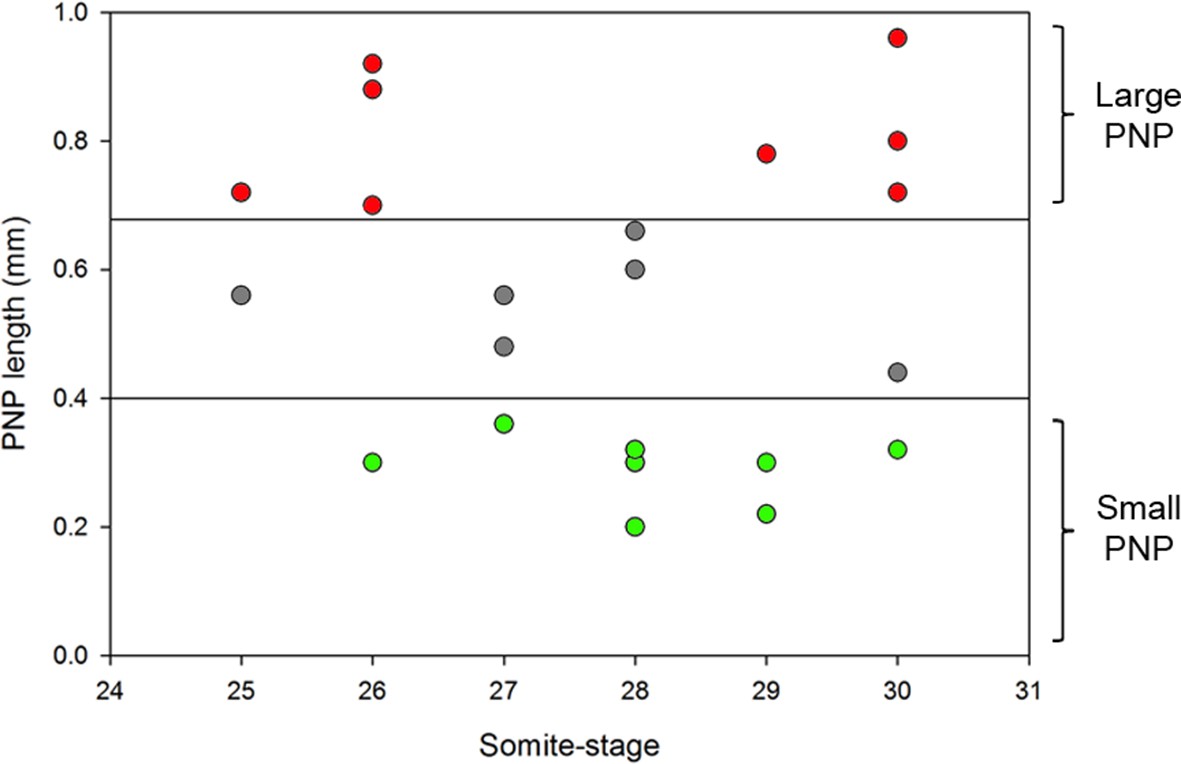
Size range of PNPs of curly tail embryos collected at E9.5 and their grouping according to PNP length.
https://doi.org/10.7554/eLife.13273.017
Figure 5 with 1 supplement
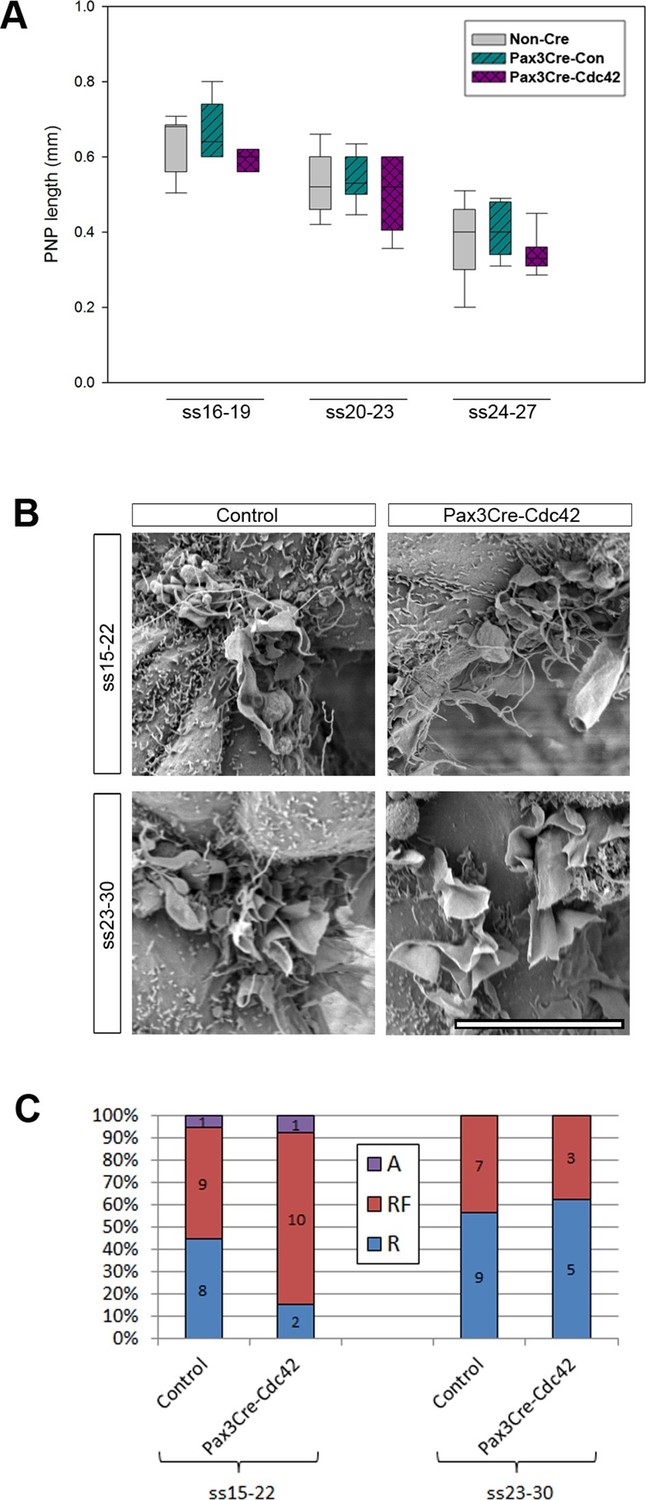
Pax3Cre-Cdc42 mutants do not show defects in neural tube closure or protrusive activity.
(A) Pax3Cre-Cdc42 mutants show a normal rate of PNP closure from ss16-27 (see Figure 5—source data 1 for raw values and statistical details). (B, C) SEMs of the PNP fusion point of control and Pax3Cre-Cdc42 embryos show no difference in the types of protrusions formed at ss15-22 and ss23-30 (B, quantified in C –p=0.0.1533 and p=0.36722 for ss15-22 and ss23-30, respectively). This is consistent with the lack of spina bifida seen in Pax3Cre-Cdc42 mutants (see Table 1). Definition of protrusion types as in Figure 3. Scale bar: 10 µm (B).
-
Figure 5—source data 1
Source data and statistical analysis for Figure 5A.
- https://doi.org/10.7554/eLife.13273.019
Figure 5—figure supplement 1
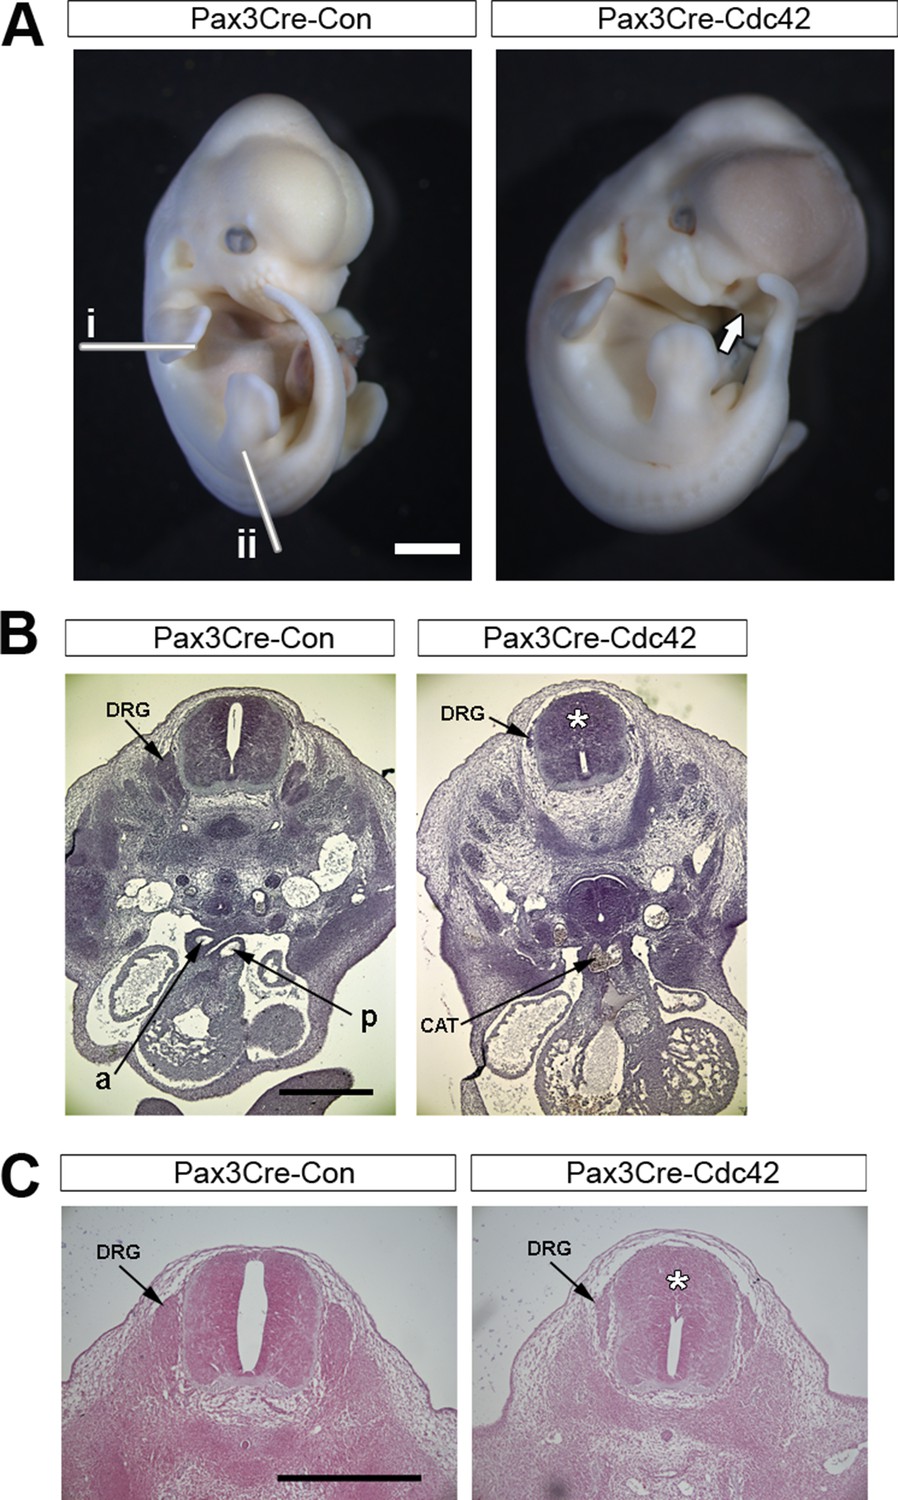
Pax3Cre-dc42 mutants show defects in neural crest-derived structures.
(A) Pax3Cre-Cdc42 mutant embryo at E12.5 showing split face (arrows), pools of blood indicating circulation defects, and general embryo discoloration indicating imminent death (quantified in Table 1). Lines in (A) show the approximate levels of the sections shown in (B) (i) and (C) (ii). (B) Histological transverse sections through the trunk at heart level of Pax3Cre-Con and Pax3Cre-Cdc42 mutant embryos at E12.5. The mutant embryo has formed a common arterial trunk (CAT) rather than displaying normal outflow tract septation with separate aortic (a) and pulmonary (p) trunks, exhibits dorsal root ganglia (DRG) of reduced size and occlusion of the dorsal part of the neural tube lumen (*) (two embryos analysed per group). (C) Histological transverse sections through the spinal cord at hindlimb bud level of Pax3Cre-Con and Pax3Cre-Cdc42 embryos at E12.5. The mutant embryo exhibits dorsal root ganglia (DRG) of reduced size and occlusion of the dorsal part of the neural tube lumen (*). Pax3Cre-Rac1 mutants show an open spinal cord at this level (arrowheads) (two embryos analysed per group). Scale bars: 1 mm (A), 500 µm (B), and 200 µm (C).
Figure 6 with 2 supplements
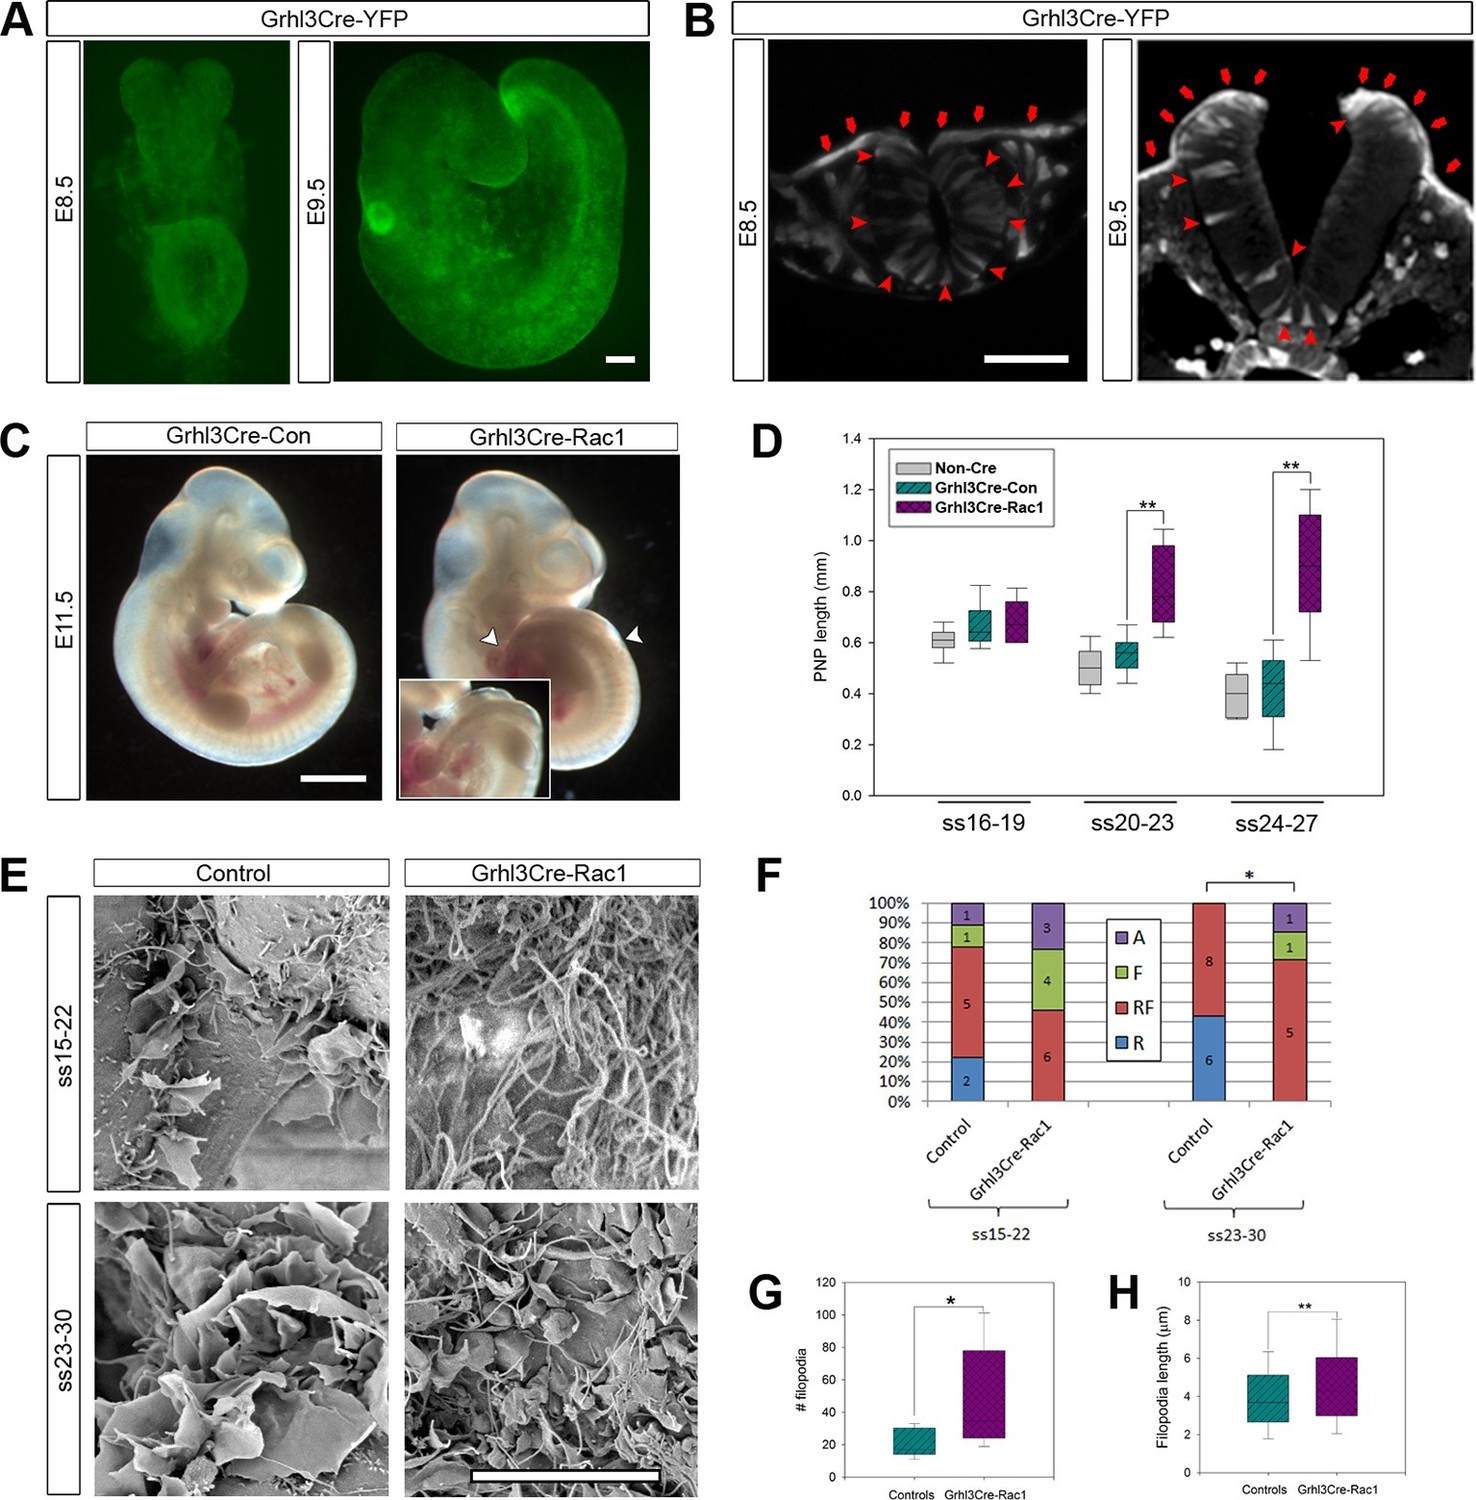
Grhl3Cre-Rac1 mutants show failure of PNP closure from ss20-23, accompanied by abnormal protrusive activity.
(A, B) Grhl3Cre-driven recombination in the SE is detected from E8.5 by direct YFP-reporter expression (A), as well as by immunofluorescence in transverse sections of the closing neural tube (B, red arrows). Note additional recombination in randomly scattered cells in the NE (B, red arrowheads) and other tissues. At least three different embryos were analysed for each stage. (C, D) Grhl3Cre-Rac1 mutants display open spina bifida at E11.5 (C, between white arrowheads and inset, quantified in Table 1) and delayed PNP closure from ss20-23 (D, **p<0.001 – see Figure 6—source data 1 for raw values and statistical details). (E–H) SEMs of the PNP fusion point of Grhl3Cre-Rac1 embryos show protrusive activity that differs from control embryos. Filopodia without ruffles are observed in Grhl3Cre-Rac1 embryos, especially at ss15-22, and membrane ruffles without filopodia are never detected (E, quantified in F, p=0.27024 for ss15-22 and *p=0.02735 for ss23-30). Definition of protrusion types as in Figure 3. In the cases where filopodia where present (RF and F categories), these were present in higher number (G) and were longer (H) in Grhl3Cre-Rac1 embryos when compared to Controls (*p<0.05, **p<0.001, see Figure 6—source data 2 for raw values and statistical details). Scale bars: 100 µm (A and B), 1 mm (C) and 10 µm (E).
-
Figure 6—source data 1
Source data and statistical analysis for Figure 6D.
- https://doi.org/10.7554/eLife.13273.022
-
Figure 6—source data 2
Source data and statistical analysis for Figure 6G,H.
- https://doi.org/10.7554/eLife.13273.023
Figure 6—figure supplement 1
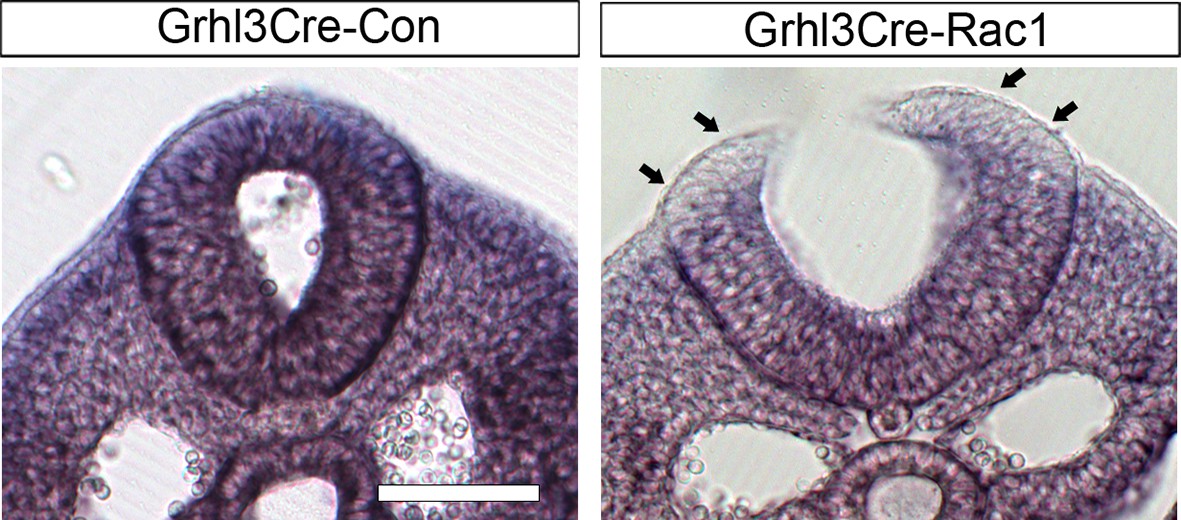
Grhl3Cre-Rac1 conditional mutants show tissue-targeted deletion of Rac1.
Grhl3Cre-Rac1 mutants show Rac1 depletion in the SE (arrows), as well as a generalised reduction in signal, consistent with the findings of reporter expression using these Cre lines (Figure 6A,B). Scale bar: 200 µm.
Figure 6—figure supplement 2
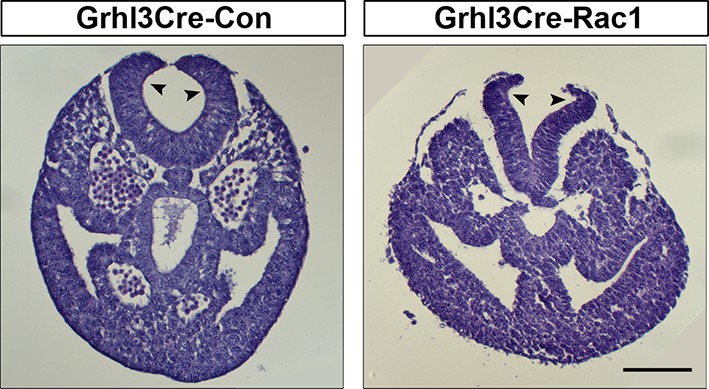
Grhl3Cre-Rac1 mutants show normal bending of the neural plate.
Transverse sections, stained with haematoxylin and eosin, through the PNP of E9.5 embryos. Grhl3Cre-Rac1 conditional mutants form dorsolateral hinge points (arrowheads) during spinal neurulation, similar to Grhl3Cre-Con embryos (n = 3 for each group), suggesting that faulty neural fold bending is unlikely to account for the neural tube defects in these mutant embryos. Scale bars: 100 µm.
Figure 7
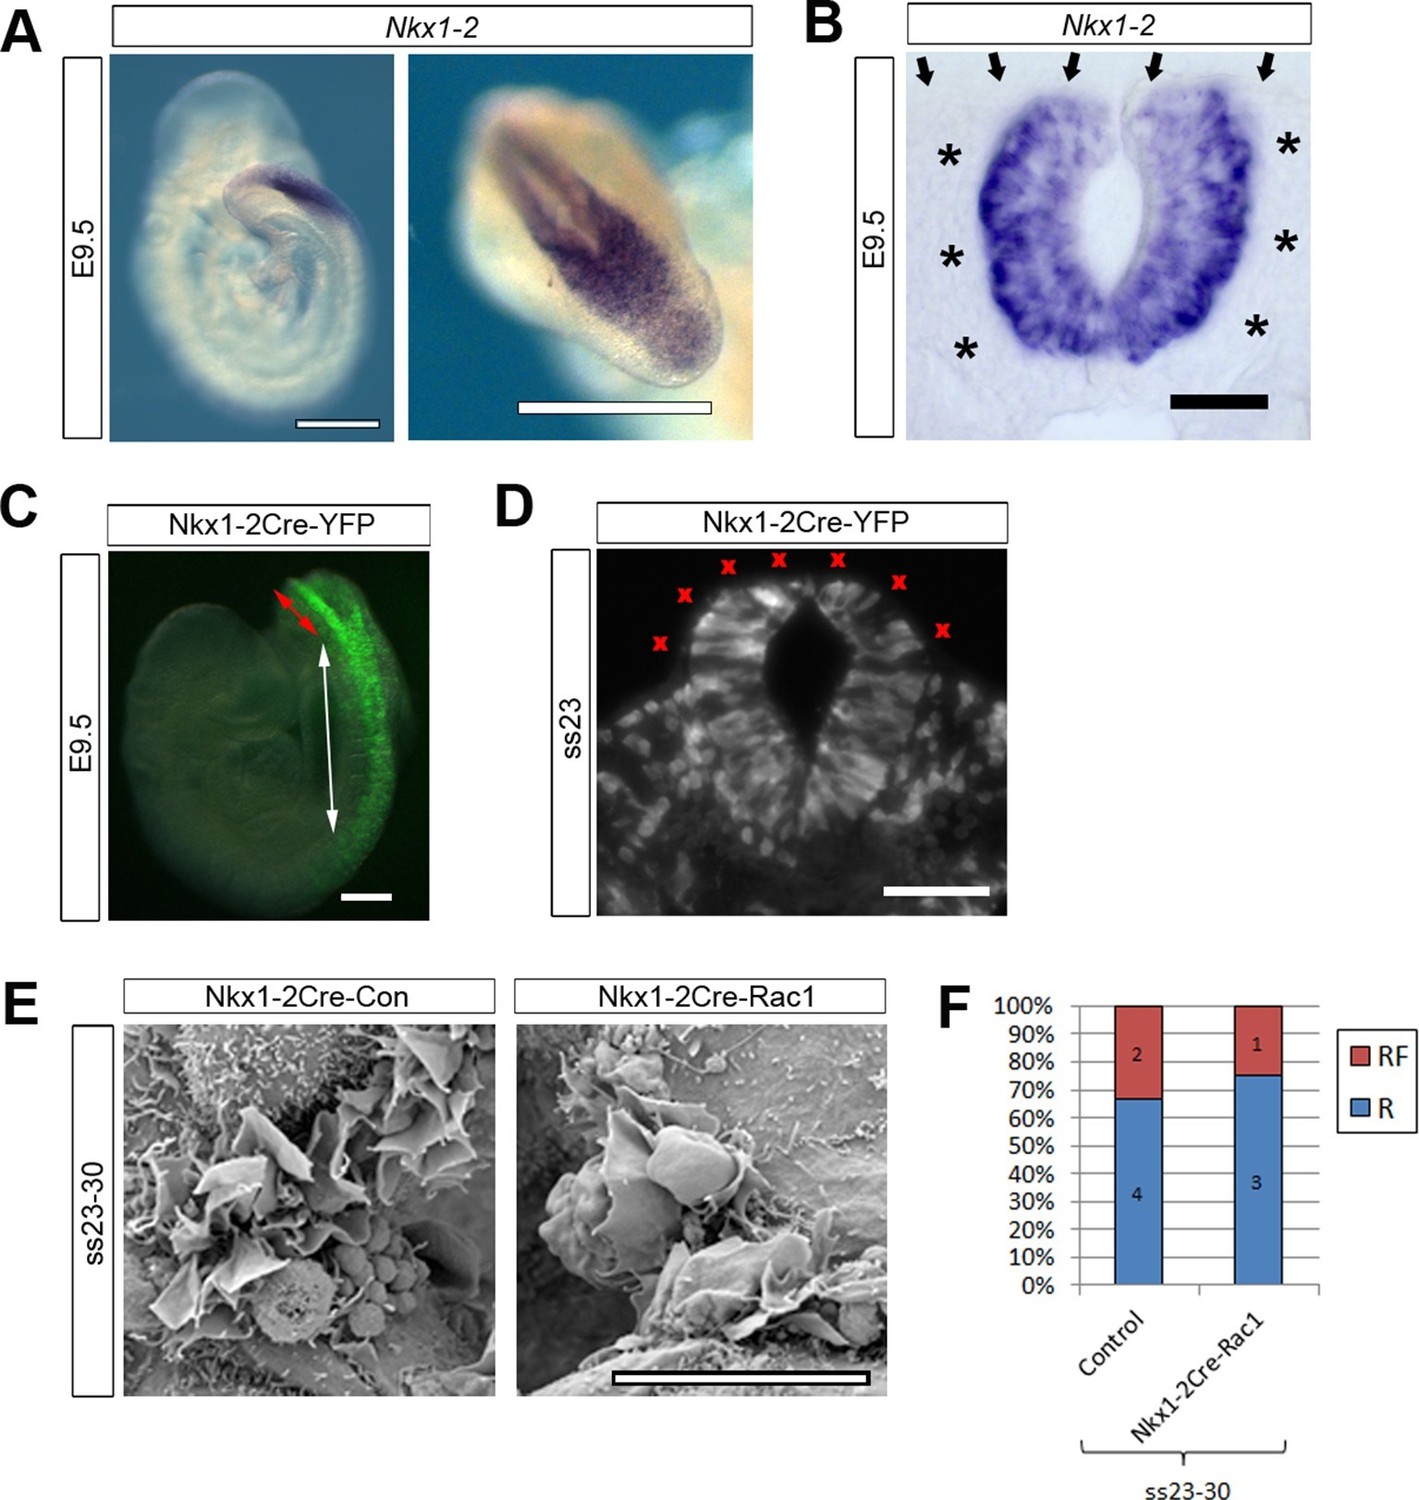
Nkx1-2Cre is expressed in NE and Nkx1-2Cre-Rac1 mutants display normal cellular protrusions.
(A, B) In situ hybridisation for Nkx1-2 in whole mount E9.5 embryos. (A) Left: lateral view; right: dorsal view of the PNP. Nkx1-2 transcripts are confined to the neural plate and very recently closed neural tube. A transverse vibratome section at the level of the closing PNP (B) reveals Nkx1-2 expression solely in the NE, and not in adjacent mesoderm (asterisks) nor overlying SE (arrows). (C, D) Nkx1-2Cre-driven recombination in the closing neural tube detected by immuno-fluorescence of YFP-reporter expression at E9.5. Note the presence of YFP in the NE of the closing PNP (red double-arrow) and previously-closed neural tube (white double-arrow) (C), but not in the SE lateral to the NE. A transverse section through the closing neural tube at E9.5 (D) shows the complete absence of YFP from the SE (red crosses; 10 embryos analysed). (E, F) Nkx1-2Cre Rac1 mutants have no neurulation defects (see Table 1) and SEMs of their PNP fusion point at ss24-30 show predominantly membrane ruffles, similar to control embryos (E, quantified in F, p=0.75). Definition of protrusion types as in Figure 3. Scale bars: 500 µm (A), 50 µm (B), 100 µm (C, D), and 10 µm (E).
Figure 8
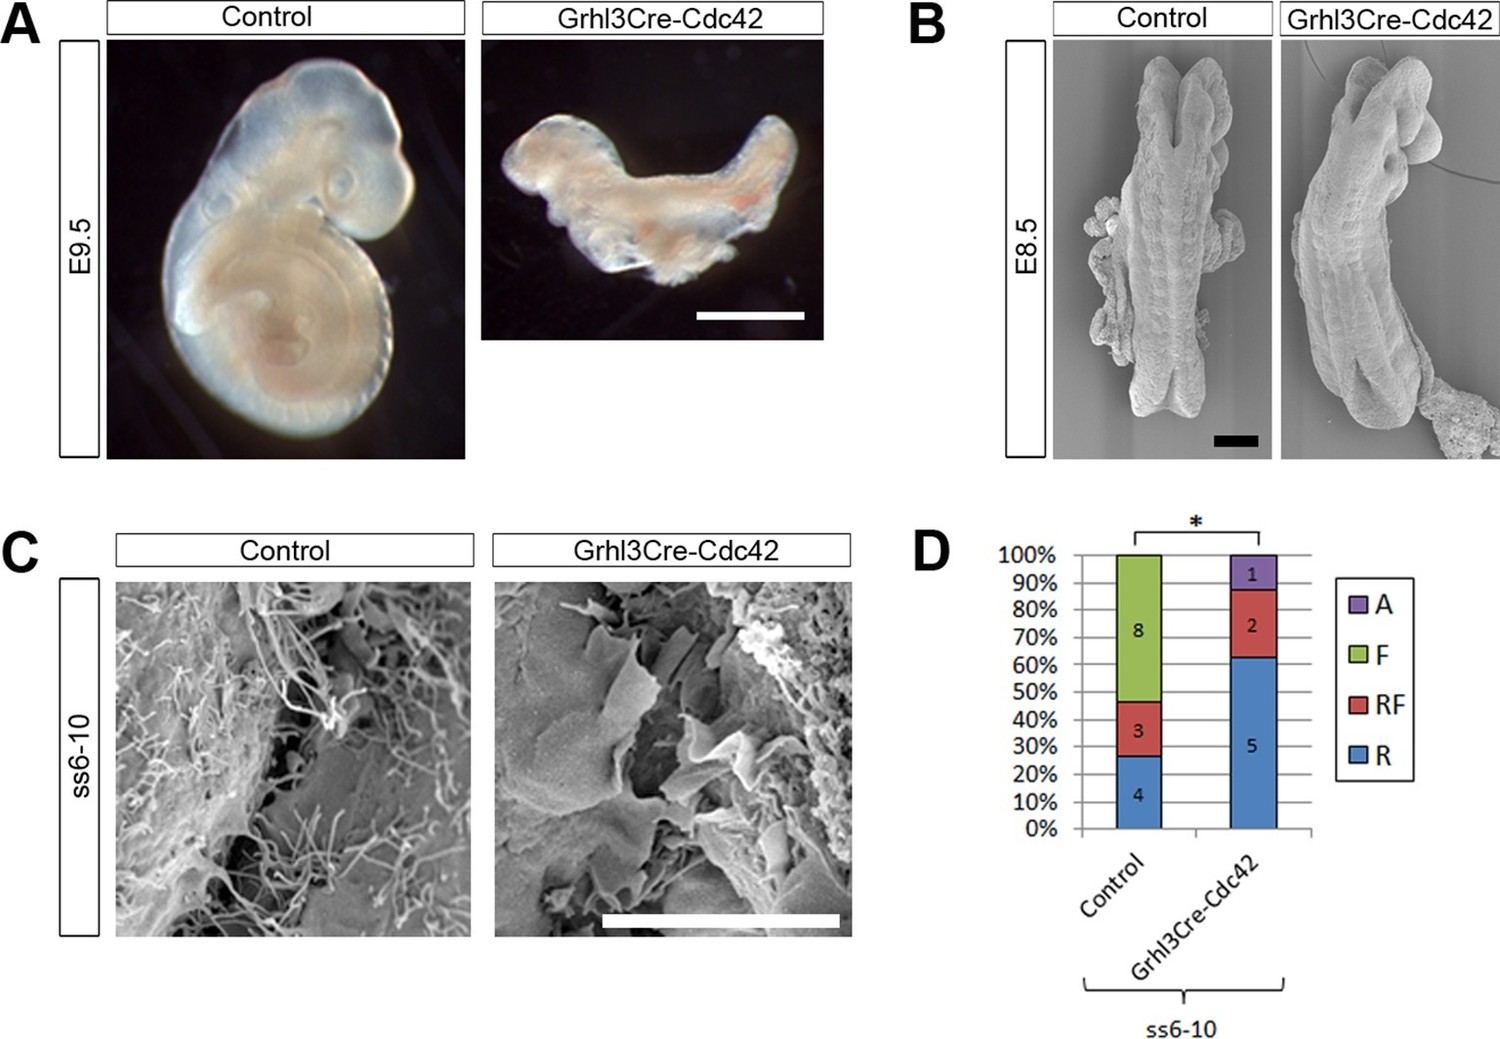
Grhl3Cre-Cdc42 embryos show altered protrusive activity.
(A) Grhl3Cre-Cdc42 mutants have an embryonic lethal phenotype, with E9.5 embryos displaying reduced size and failure of axial rotation (quantified in Table 1). (B) SEMs of E8.5 embryos with fewer than 11 somites. At this stage, Grhl3Cre-Cdc42 mutants are indistinguishable in overall morphology from control littermates. (C, D) SEMs of the PNP fusion point of Grhl3Cre-Cdc42 mutants at ss6-10 show a predominance of membrane ruffles, in contrast to the filopodia seen in control embryos at this stage (C, quantified in D, *p<0.05). Definition of protrusion types as in Figure 3. Scale bars: 1 mm (A), 100 µm (B) and 10 µm (C).
Figure 9
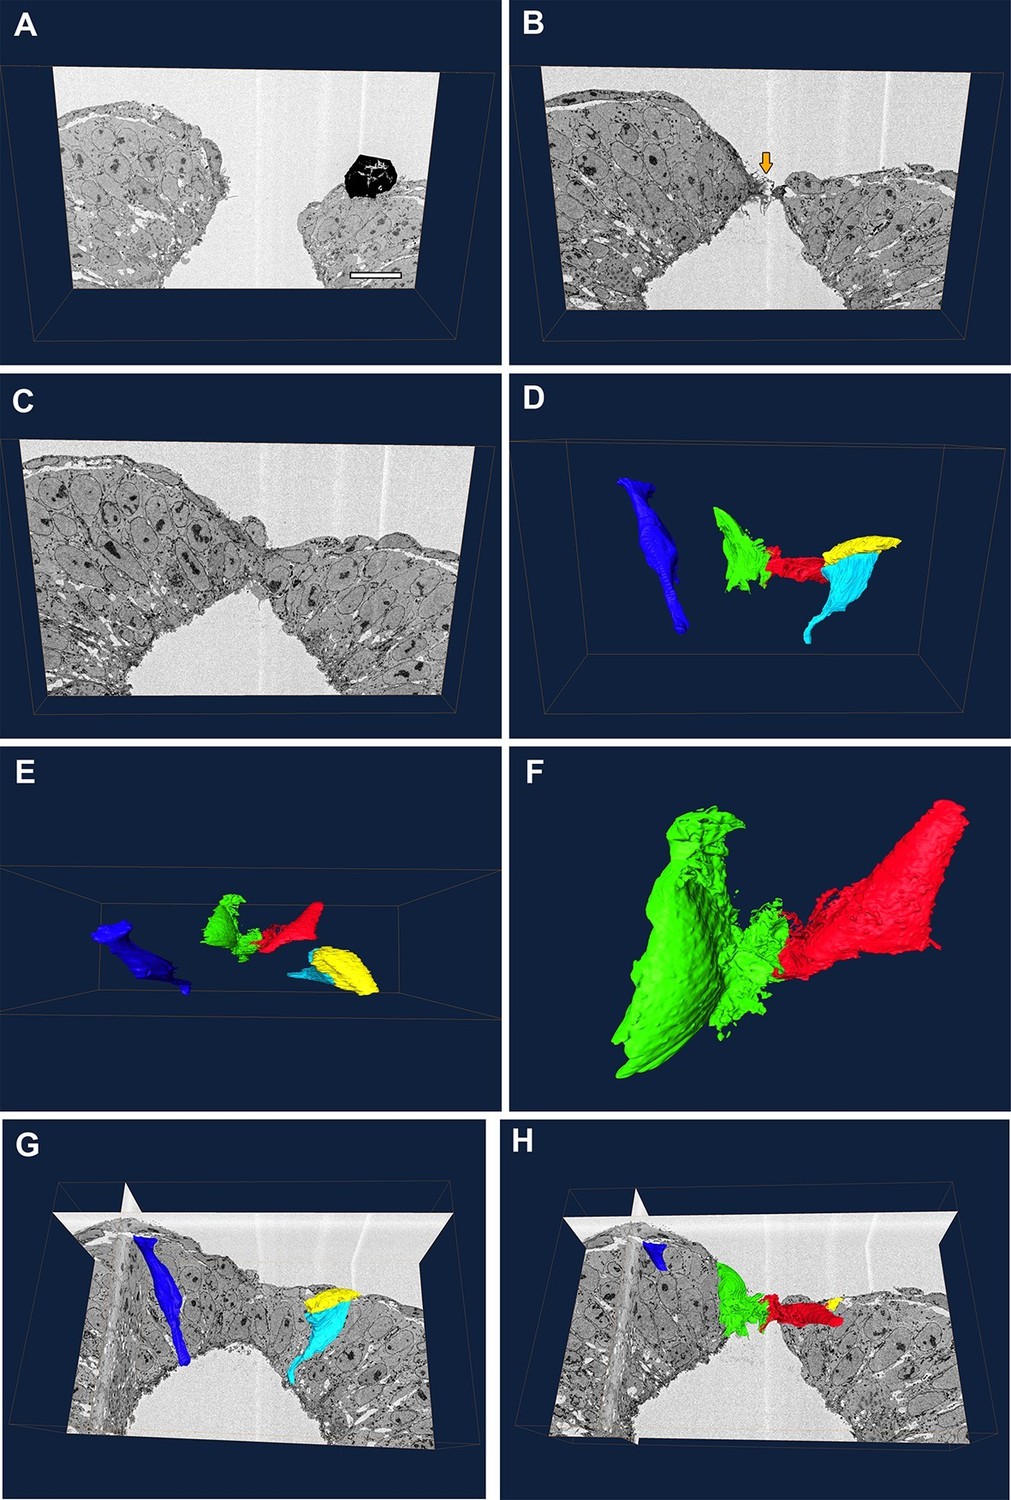
Protrusive cells have a SE-like morphology.
(A–F) Still images from Video 1. (A–C) A series of transverse section images obtained through serial block-face SEM imaging of the closure point of the PNP at E9.5. Protrusions are visible at the tips of the neural folds (orange arrow in B). Black object in (A) is an artefact. (D–F) Three-dimensional reconstructions of different cell types from the same section-stack. Examples are shown of typical morphologies of pseudostratified NE cells (dark blue: spindle shaped cell; cyan: wedge shaped cell) and of a squamous SE cell (yellow). A single pair of cells are extending protrusions, one from each neural fold (green and red), and these have a squamous-type cell morphology, similar to SE cells. Relative to the sections in A–C, the reconstructed cell volumes are shown in the same orientation (D), rotated 90° forward (E) or rotated 90° forward with zoom (F). (G, H) Orthoslices from the analysed stack with superimposed three-dimensional reconstructions of the cells described above. Three different embryos were analysed at ss20-26, with similar results. Scale bar: 100 µm (A).
Videos
Video 1
Serial block-face SEM reveals that protrusive cells have a SE-like morphology.
Animation showing a series of transverse images of the spinal neural tube closure point at E9.5, with superimposed three-dimensional reconstructions of NE cells (dark blue and cyan), a SE cell (yellow), and protrusive cells at the tips of the neural folds (green and red). See Figure 9 legend.
Tables
Table 1
Conditional genetic analysis of the roles of Rac1 and Cdc42.
| Cross | Genotype | Abbreviated genotype | Embryonic Day | |||
|---|---|---|---|---|---|---|
| Pax3Cre/+;Rac1f/+ X Rac1f/- | Total | Exencephaly | Spina bifida and/or curly tail | |||
| Pax3+/+;Rac1f/f, f/+. f/- or +/- | Non-Cre | 10.5 – 13.5 | 80 | 1 (1%) | 1 (1%) | |
| Pax3Cre/+;Rac1f/+ or +/- | Pax3Cre-Con | 10.5 – 13.5 | 39 | 3 (8%) | 2 (5%) | |
| Pax3Cre/+;Rac1f/f or f/- | Pax3Cre-Rac1 | 10.5 – 13.5 | 49 | 4 (8%) | 37 (76%)** | |
| Total | Dead or dying | Split face | ||||
| Pax3+/+;Rac1f/f, f/+. f/- or +/- | Non-Cre | 13.5 | 43 | 0 | 0 | |
| Pax3Cre/+;Rac1f/+ or +/- | Pax3Cre-Con | 13.5 | 17 | 0 | 0 | |
| Pax3Cre/+;Rac1f/f or f/- | Pax3Cre-Rac1 | 13.5 | 21 | 18 (86%)** | 21 (100%)** | |
| Pax3Cre/+;Cdc42f/+ X Cdc42f/- | Total | Exencephaly | Spina bifida and/or curly tail | |||
| Pax3+/+;Cdc42f/f, f/+. f/- or +/- | Non-Cre | 10.5 – 13.5 | 52 | 0 | 0 | |
| Pax3Cre/+;Cdc42f/+ or +/- | Pax3Cre-Con | 10.5 – 13.5 | 17 | 0 | 0 | |
| Pax3Cre/+;Cdc42f/f or f/- | Pax3Cre-Cdc42 | 10.5 – 13.5 | 23 | 0 | 0 | |
| Total | Dead or dying | Split face | ||||
| Pax3+/+;Cdc42f/f, f/+. f/- or +/- | Non-Cre | 13.5 | 26 | 1 (4%) | 0 | |
| Pax3Cre/+;Cdc42f/+ or +/- | Pax3Cre-Con | 13.5 | 6 | 0 | 0 | |
| Pax3Cre/+;Cdc42f/f or f/- | Pax3Cre-Cdc42 | 13.5 | 11 | 10 (91%)** | 11 (100%)** | |
| Grhl3Cre/+;Rac1f/+ X Rac1f/f or f/- | Total | Exencephaly | Spina bifida and/or curly tail | |||
| Grhl3+/+;Rac1f/f, f/+. f/- or +/- | Non-Cre | 10.5 – 13.5 | 141 | 0 | 1 (<1%) | |
| Grhl3Cre/+;Rac1f/+ or +/- | Grhl3Cre-Con | 10.5 – 13.5 | 73 | 1 (1%) | 0 | |
| Grhl3Cre/+;Rac1f/f or f/- | Grhl3Cre-Rac1 | 10.5 – 13.5 | 44 | 11 (25%)** | 39 (89%)** | |
| Total | Unattached allantois | |||||
| Grhl3+/+;Rac1f/f, f/+. f/- or +/- | Non-Cre | 9.5 | 134 | 1 (<1%) | ||
| Grhl3Cre/+;Rac1f/+ or +/- | Grhl3Cre-Con | 9.5 | 86 | 0 | ||
| Grhl3Cre/+;Rac1f/f or f/- | Grhl3Cre-Rac1 | 9.5 | 69 | 21 (30%)** | ||
| Grhl3Cre/+;Cdc42f/+ X Cdc42f/f | Total | Dead or underdeveloped | ||||
| Grhl3+/+;Cdc42f/+ | Non-Cre | 9.5 – 10.5 | 16 | 0 | ||
| Grhl3Cre/+;Cdc42f/f or f/- | Grhl3Cre-Cdc42 | 9.5 – 10.5 | 12 | 12 (100%)** | ||
| Nkx1-2CreERT2/+;Rac1f/+ X Rac1f/- | Total | Exencephaly | Spina bifida and/or curly tail | |||
| Nkx1-2+/+;Rac1f/f, f/+. f/- or +/- | Non-Cre | 10.5 – 13.5 | 51 | 0 | 0 | |
| Nkx1-2CreERT2/+;Rac1f/+ or +/- | Nkx1-2Cre-Con | 10.5 – 13.5 | 16 | 0 | 0 | |
| Nkx1-2CreERT2/+;Rac1f/f or f/- | Nkx1-2Cre-Rac1 | 10.5 – 13.5 | 17 | 0 | 0 | |
-
**p<0.001 when compared to either Non-Cre or DriverCre-Con.
Download links
A two-part list of links to download the article, or parts of the article, in various formats.
Downloads (link to download the article as PDF)
Open citations (links to open the citations from this article in various online reference manager services)
Cite this article (links to download the citations from this article in formats compatible with various reference manager tools)
Regulation of cell protrusions by small GTPases during fusion of the neural folds
eLife 5:e13273.
https://doi.org/10.7554/eLife.13273


