Constitutive auxin response in Physcomitrella reveals complex interactions between Aux/IAA and ARF proteins
- Howard Hughes Medical Institute, University of California, San Diego, United States
Figures
Figure 1 with 2 supplements
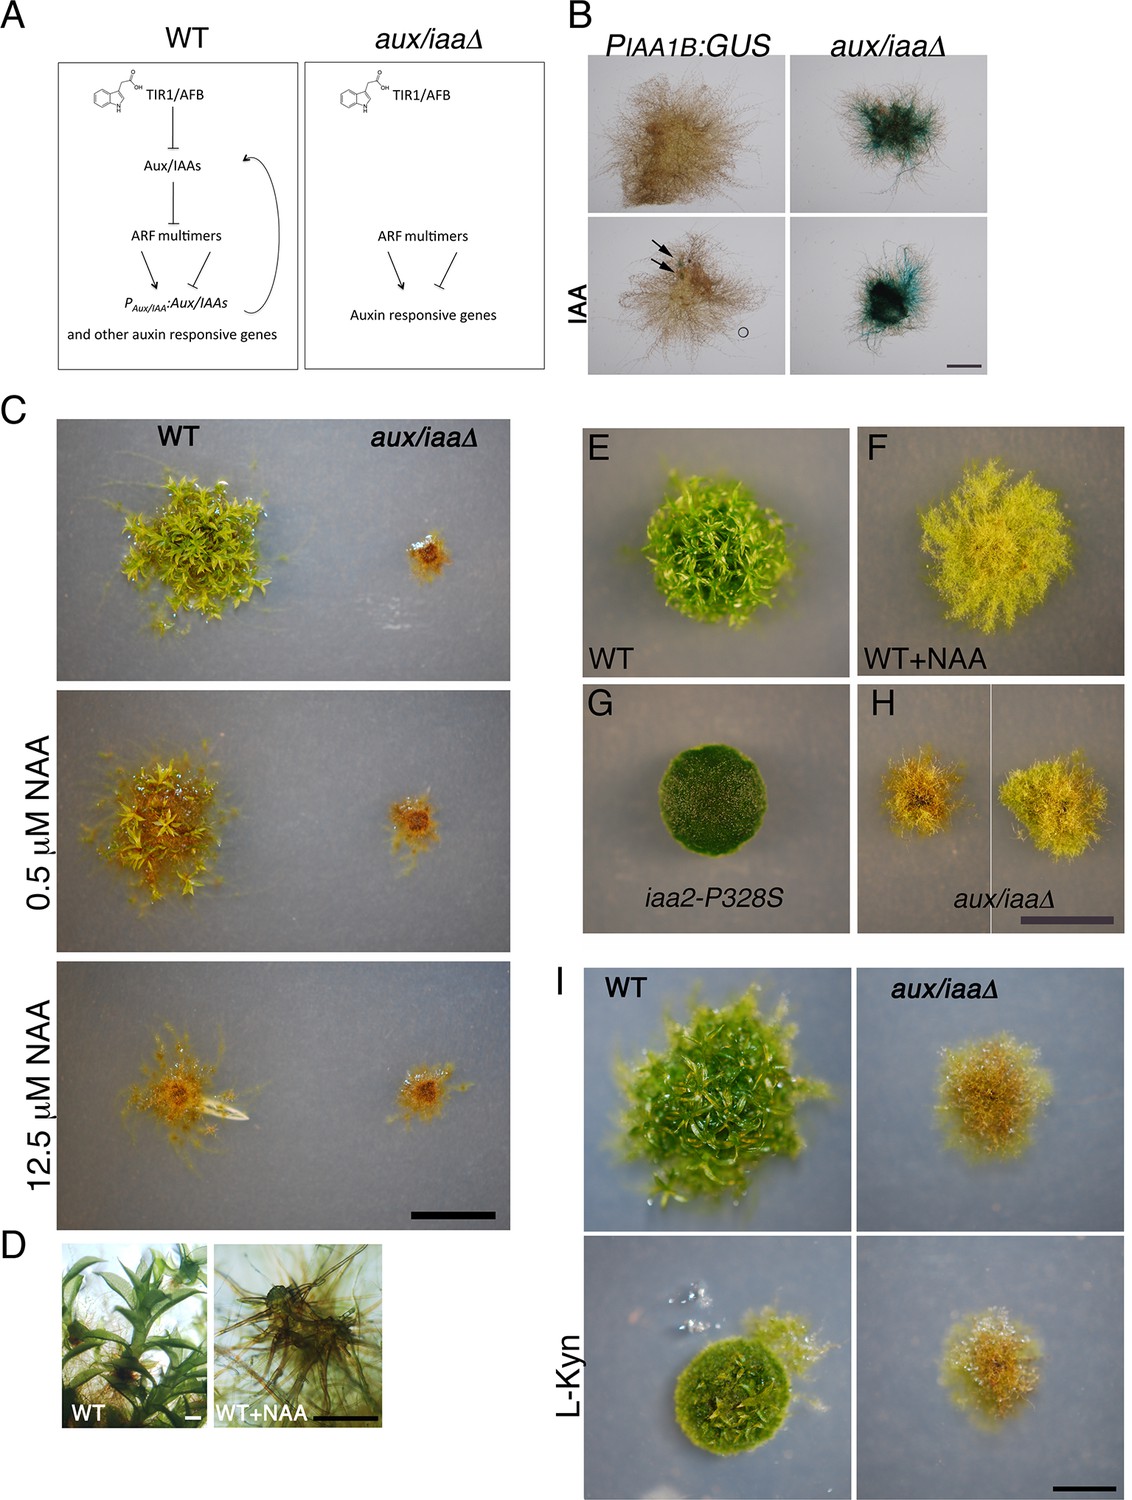
The aux/iaaΔ mutant displays a severe phenotype.
(A) Scheme representing the auxin-signaling pathway in WT plants (left panel) and in the aux/iaaΔ mutant (right panel). (B) GUS expression in PIAA1B:GUS and aux/iaaΔ plants carrying the PIAA1B:GUS reporter. Arrows denote GUS expression. (C) WT and the aux/iaaΔ mutant grown for one month on BCD medium, stimulating gametophore development without auxin or with different concentrations of 1-naphthalene-acetic acid (NAA). (D) Microscopic enlargement of WT gametophores: left panel- leafy gametophores grown without exogenous auxin. Right panel-ectopic rhizoids emerging from a gametophore grown on 12.5 μM NAA. (E–H) Plants grown for one month on BCDAT medium to promote filamentous growth. (E, F) WT plant grown without auxin or with 12.5 μM NAA, respectively. (G) iaa2-P328S degron-motif mutant. (H) The aux/iaaΔ mutant has a variable phenotype. (I) WT and aux/iaaΔ mutant grown for one month on BCDAT or BCDAT supplemented with 10 μM L-Kyn. Scale bars: 1 mm (B), 0.5 cm (C, H, I), the scale bar in H also corresponds to E–G, 0.5 mm (D).
Figure 1—figure supplement 1

The aux/iaaΔ is a null mutant that displays constitutive auxin response.
(A) PCR validating the absence of the genomic sequence of IAA1A, IAA1B, and IAA2 after CRE recombination. Primer pairs used: PML 749, 751 (IAA1A), PML 750, 751 (IAA1B), PML753, 754 (IAA2). (B) qPCR validating that IAA1A, IAA1B, and IAA2 are not expressed. The expression of the housekeeping gene EF1α is normal in the mutant and is used as a control.
Figure 1—figure supplement 2
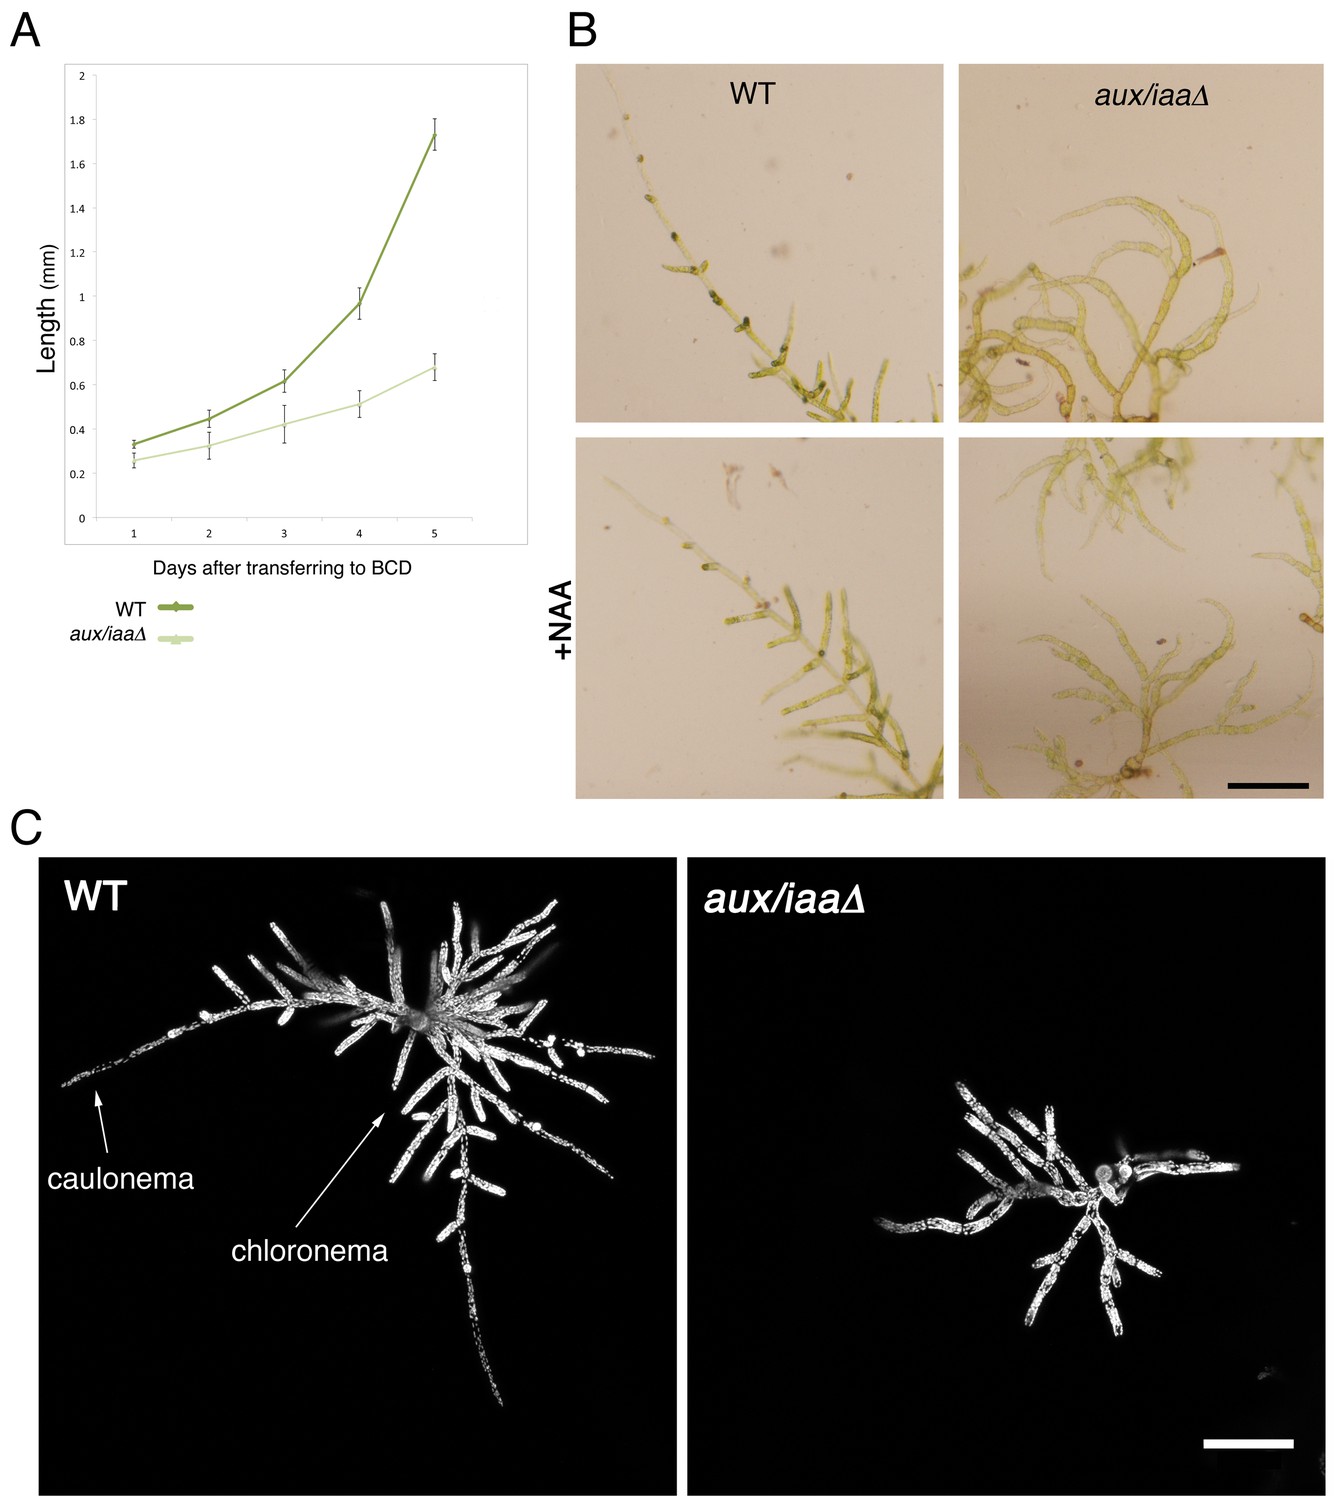
Early stages of filamentous growth of WT and aux/iaaΔ mutant.
(A) Six WT and aux/iaaΔ mutant plants were transferred to BCD medium four days after protoplast recovery and measured for 5 days. Error bars represent s.e.m. (B) Protonemal filaments of WT and aux/iaaΔ plants grown on BCD for two weeks following protoplast recovery without auxin or with 0.5 μm NAA. (C) Confocal images visualizing chloroplasts in WT and aux/iaaΔ plants seven days after protoplast recovery. Chloroplasts are visualized in white. Scale bars: 0.25 mm (B), 200 μm (C).
Figure 2 with 3 supplements

Loss of the Aux/IAA genes results in dramatic changes in gene expression at the filamentous developmental stage.
(A) Confocal images of WT and aux/iaaΔ mutant protonemata seven days after tissue homogenization (Left panels-chloroplasts are visualized in green. Right panels-cell structures are visualized with DIC). Scale bar: 200 μm. (B) Average length and width (μm) of WT chloronemal cells and aux/iaaΔ mutant cells proximal to branch points. Error bars represent s.e.m. **p<0.001 (t-test), n=30. (C) Total chlorophyll concentration in WT and aux/iaaΔ protonemata seven days after tissue homogenization. Error bars represent s.e.m. *p<0.05 (t-test), n=3. (B) Venn diagram showing the overlap between the four data sets of differentially expressed genes (padj <0.01, fold change ≥1.5). (D) Hierarchical clustering of genes displaying differential expression between auxin treated and untreated WT plant samples with fold change ≥2 compared to their expression levels in the aux/iaaΔ mutant.
Figure 2—figure supplement 1
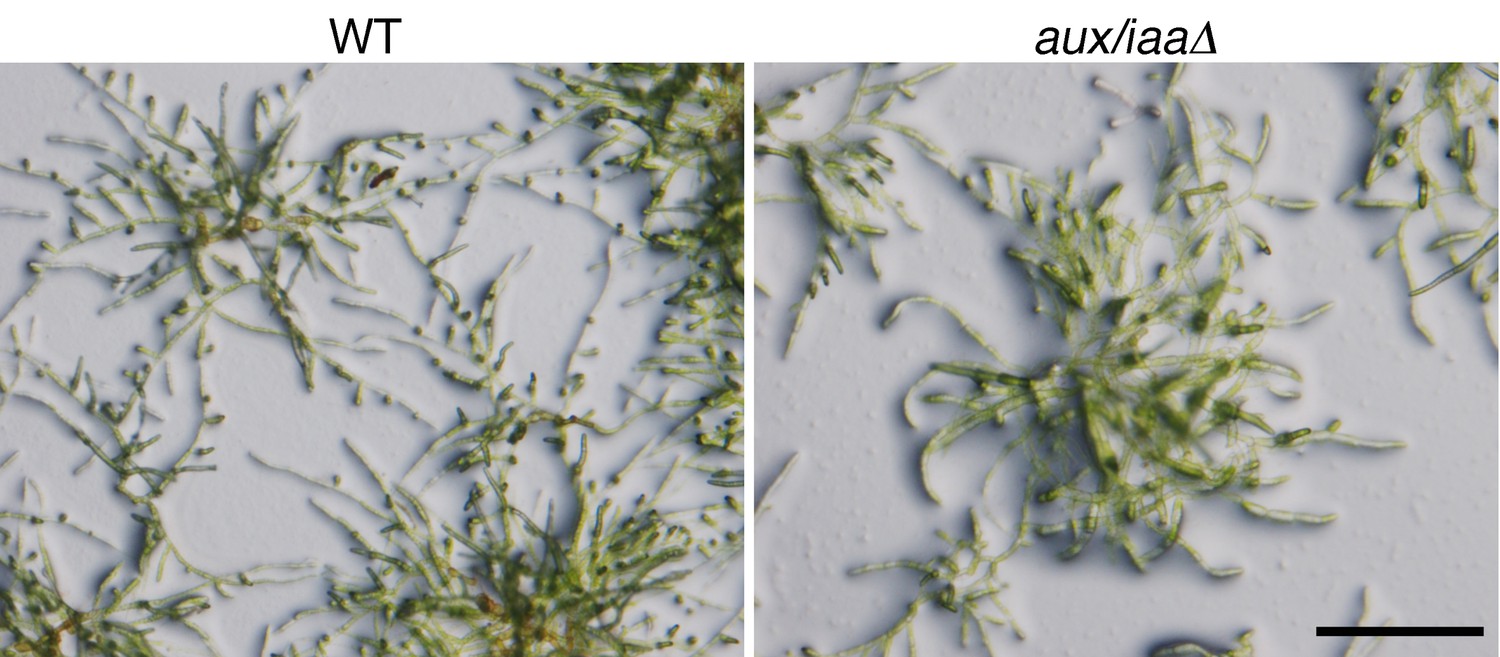
Protonemal tissue grown under the growth conditions used for the RNAseq experiment.
WT and aux/iaaΔ grown on BCDAT plates with cellophane overlays for seven days after tissue homogenization. Scale bar: 0.5 cm.
Figure 2—figure supplement 2
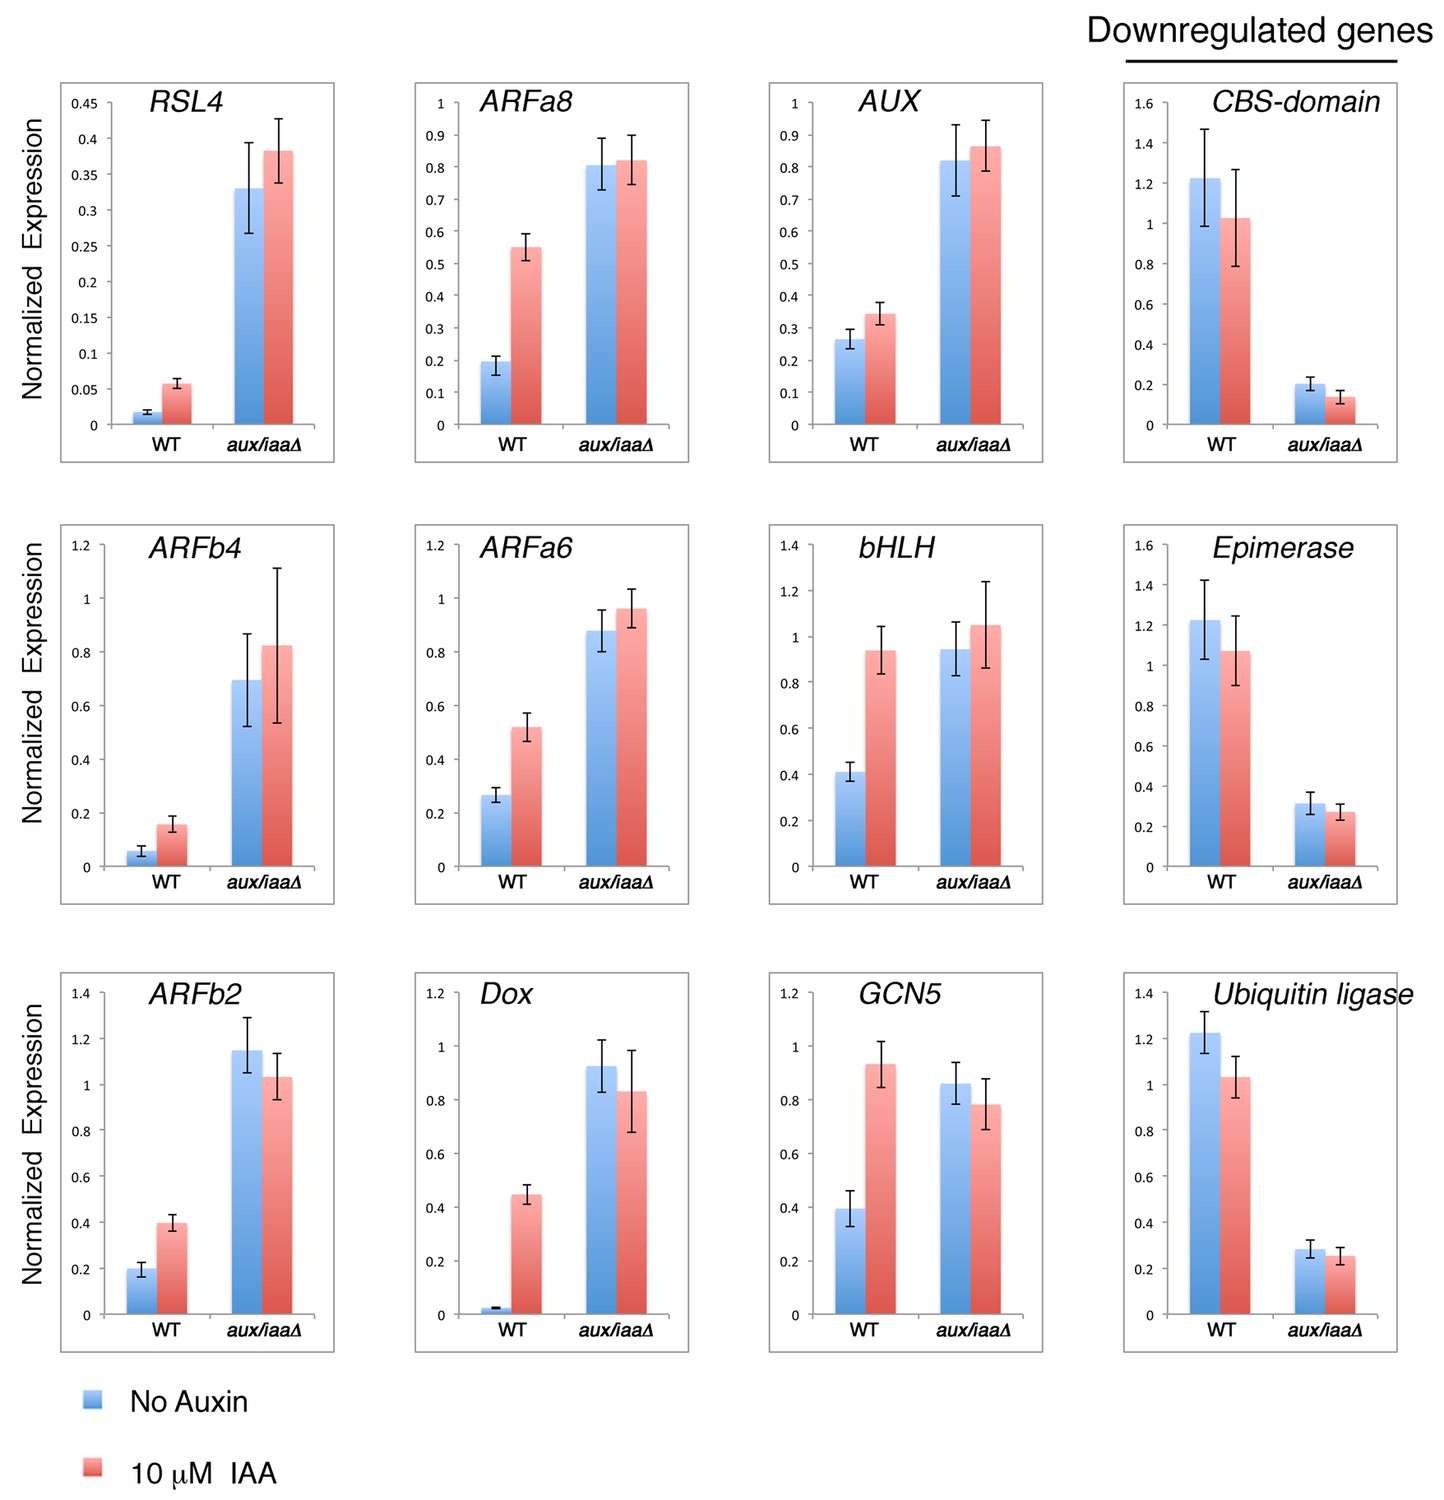
qPCR showing the expression levels of auxin responsive genes in WT plant and aux/iaaΔ mutant in mock- or 10 μM IAA-treatment for one hour.
https://doi.org/10.7554/eLife.13325.008
Figure 2—figure supplement 3

Graphical representation of enriched cellular components associated with auxin-responsive genes.
Colors of cells represent significance levels. The significance values are designated within each cell. Green arrows represent negative regulation.
Figure 3 with 2 supplements
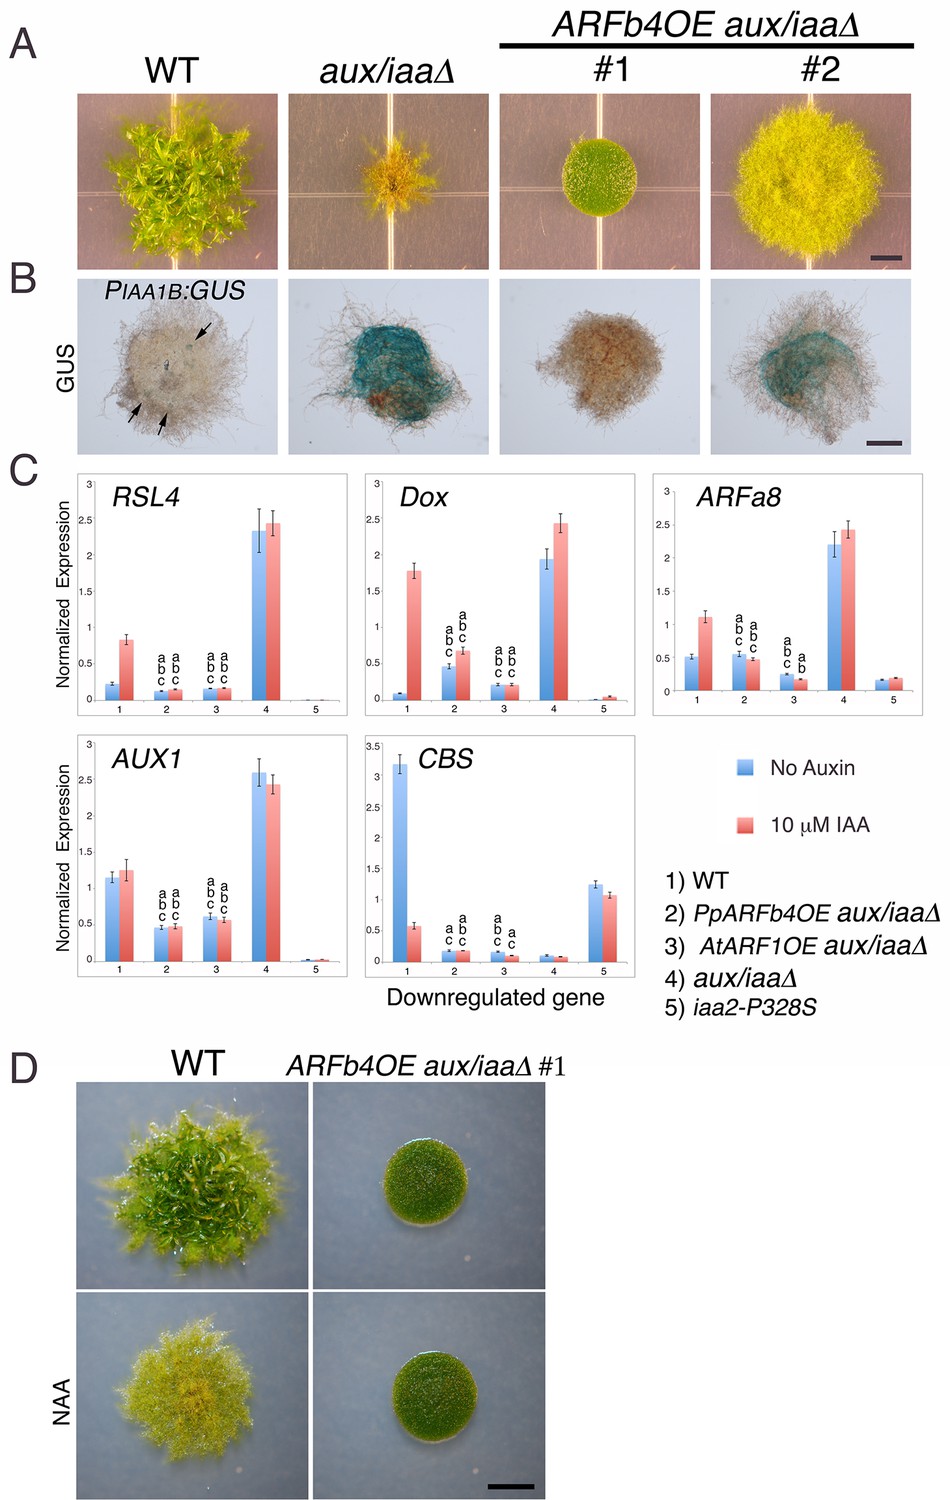
Repressing ARFs target auxin-induced genes.
(A) WT, aux/iaaΔ and two aux/iaaΔ lines overexpressing ARFb4 (ARFb4OE_aux/iaaΔ) grown for one month on BCDAT. (B) GUS expression in aux/iaaΔ and two ARFb4OE_aux/iaaΔ lines carrying the PIAA1B:GUS reporter. Arrows denote GUS expression. (C) qPCR showing the expression levels of auxin responsive genes in WT, ARFb4OE_aux/iaaΔ (line #1), AtARF1_aux/iaaΔ, aux/iaaΔ, and iaa2-P328S in presence of 10 μM IAA-treated for five hours or mock. Error bars represent s.e.m. a/b/c=P<0.05 (t-test), n=3. a=t-test comparing the lines to WT, b= t-test comparing the lines to aux/iaaΔ. c=t-test comparing the lines to iaa2-P328S. (D) WT and ARFb4OE_aux/iaaΔ #1 grown on BCDAT without auxin or with 12.5 μM NAA for one month. Scale bars: 0.5 cm (A), 0.5 mm (B), 0.5 cm (D)
Figure 3—figure supplement 1
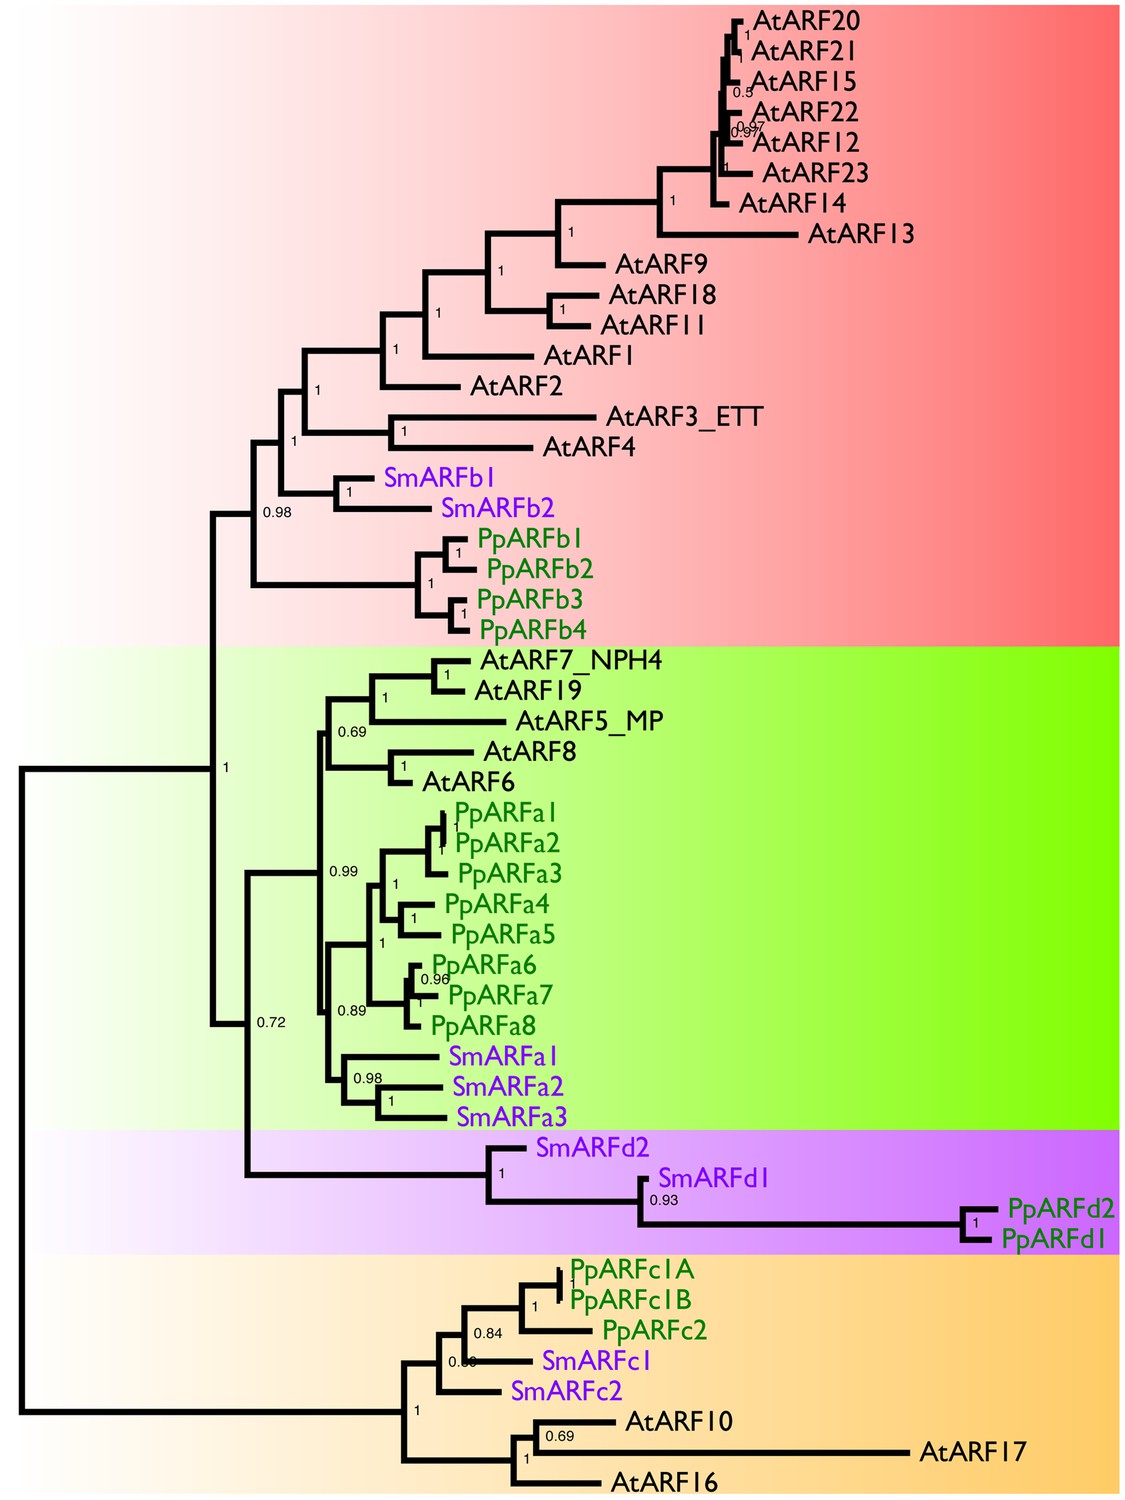
Phylogeny of Land Plant ARFs.
The relationships between land plant ARFs were inferred using an alignment of amino-acid sequences and the MrBayes 3.2.2 program. The text colors indicate the plant whose genome encodes the protein: black, Arabidopsis thaliana; purple, Selaginella moellendorffii; and green, Physcomitrella patens. Numbers inside the nodes indicate posterior probabilities. Distinct clades of ARF genes are highlighted by background shading.
Figure 3—figure supplement 2
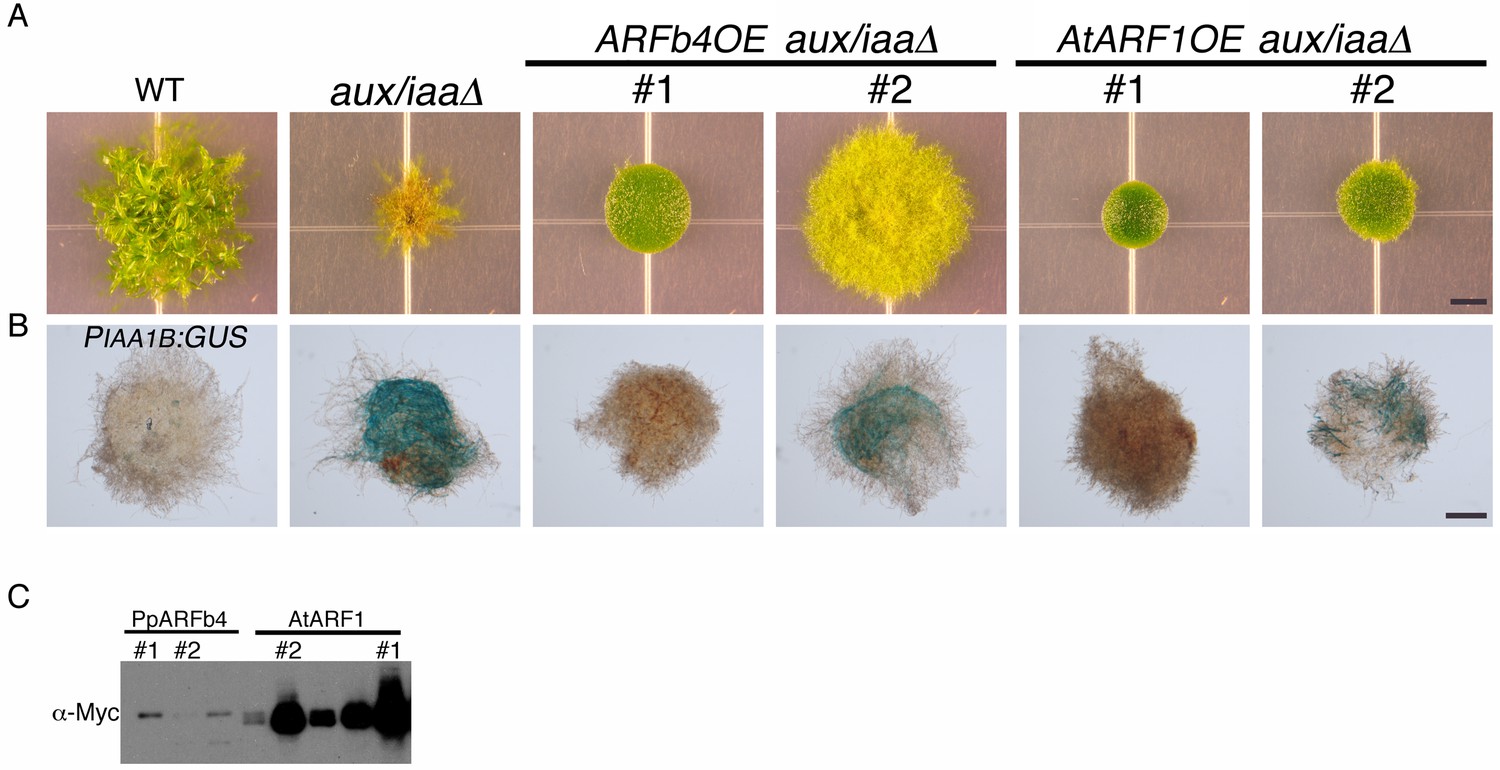
The Arabidopsis repressing ARF1 has similar effects on plant growth as ARFb4.
This figure is an extension of Figure 3A,B and includes two independent AtARF1 overexpression lines in aux/iaaΔ mutant background. (A) WT, aux/iaaΔ and two ARFb4 overexpression in aux/iaaΔ (as shown in Figure 3A) and two Arabidopsis ARF1 overexpression in aux/iaaΔ grown for one month on BCDAT. (B) GUS expression of IAA1B transcriptional fusion line, aux/iaaΔ mutant, and two ARFb4 and AtARF1 overexpression lines in aux/iaaΔ mutant background. (C) Immunoblot of total protein extract from plants overexpressing PpARFb4 and AtARF1, detected with a c-Myc antibody. The line numbers #1 and #2 refer to plants in panel A and B. Scale bars: 0.5 cm (A), 0.5 mm (B).
Figure 4
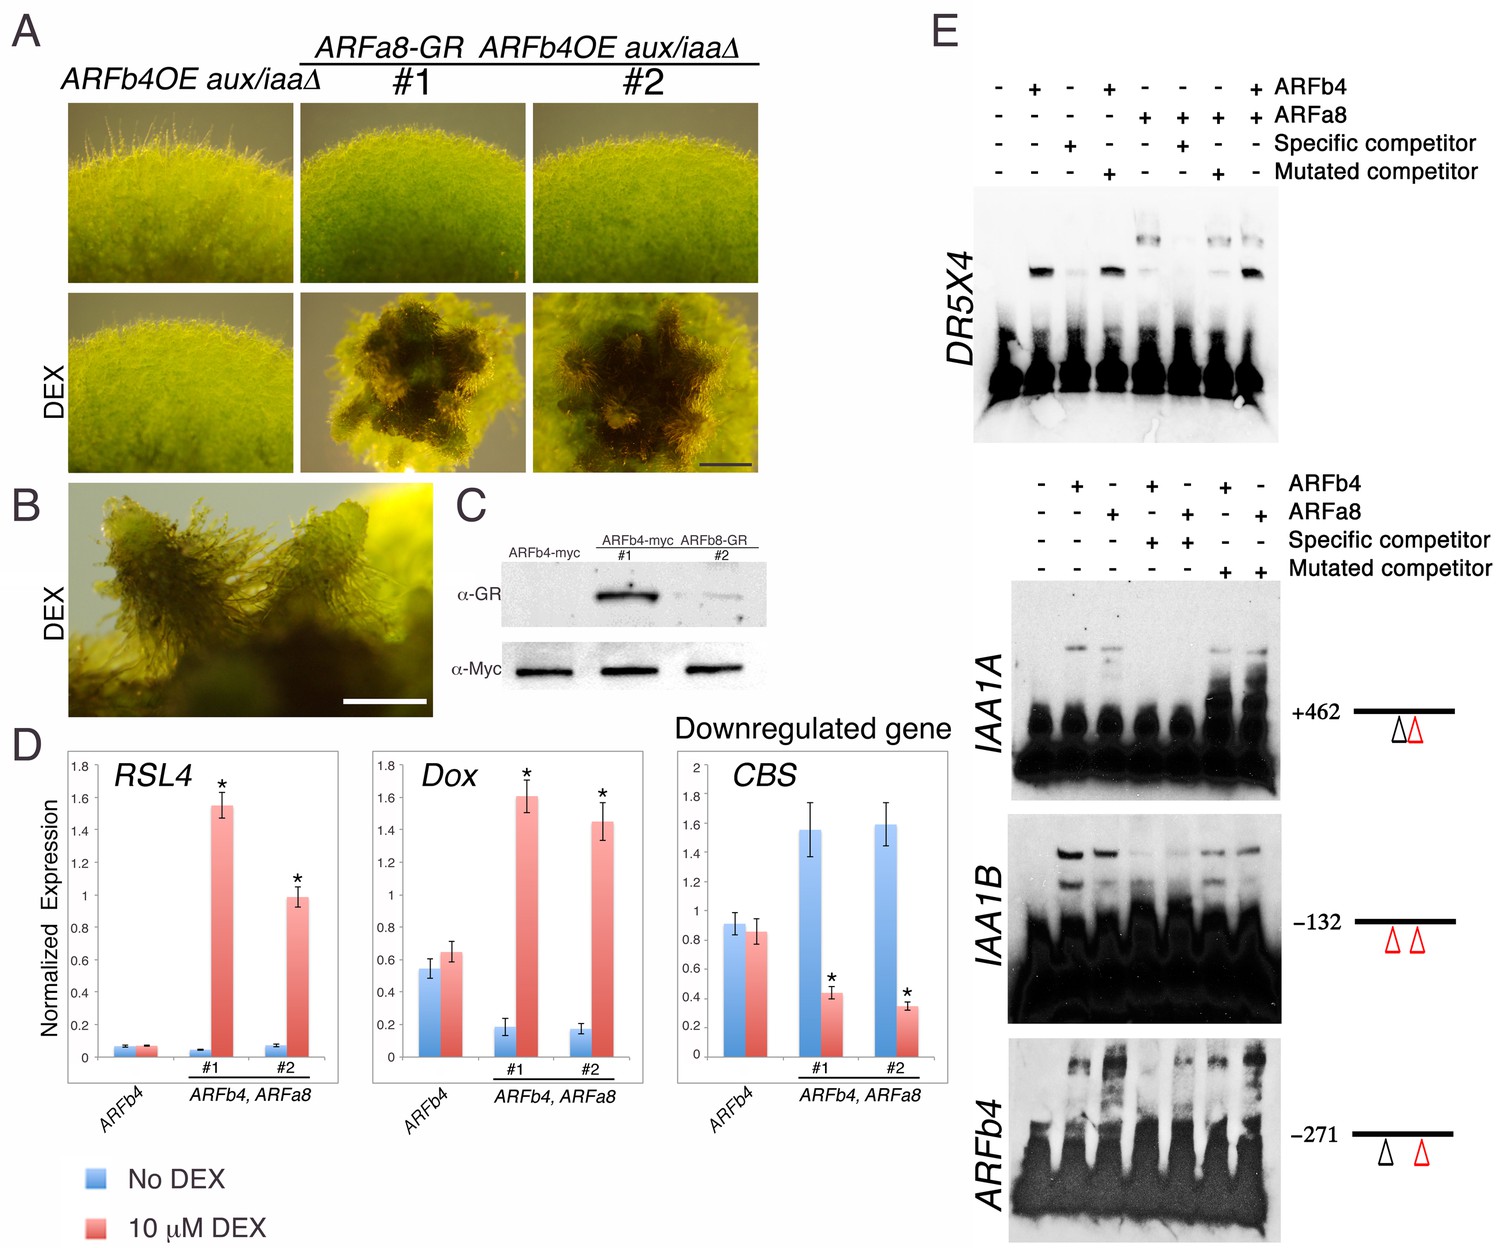
Repressing and activating ARFs display opposite effects on the same target genes.
(A) ARFb4OE_aux/iaaΔ (line #1 in Figure 3A), and two ARFa8-GR ARFb4OE_aux/iaaΔ lines grown on BCDAT or BCDAT supplemented with 10 μM DEX for a month. Scale bar: 0.5 mm. (B) Enlargement of gametophores of line #1. Scale bar: 0.5 mm. (C) Immunoblot of total protein extracts from plants shown in E, detected with GR and c-Myc antibodies. (D) qPCR showing the expression levels of auxin responsive genes in the transgenic lines shown in A, ARFb4OE_aux/iaaΔ (ARFb4) and ARFa8-GR ARFb4OE_aux/iaaΔ (ARFb4, ARFa8) mock- or 10 μM DEX-treated for overnight. Error bars represent s.e.m. *p<0.05 (t-test comparing DEX-induced- to uninduced gene expression levels in ARFb4, ARFa8 lines), n=3. (E) Electrophoretic mobility shift assay with GST-ARFb4 DBD and GST-ARFa8 DBD (ARFb4, ARFa8) with biotin-labeled DNA probes from DR5, IAA1A, IAA1B, and ARFb4 promoters. + and – signs denote the presence or the absence of ARF proteins, and unlabeled specific or mutant competitor DNA sequences. Black line and numbers represent the probe locations respectively to the gene transcription start sites. Red triangles: canonical TGTCTC AuxREs. Black triangles: core TGTC AuxREs.
Figure 5 with 3 supplements
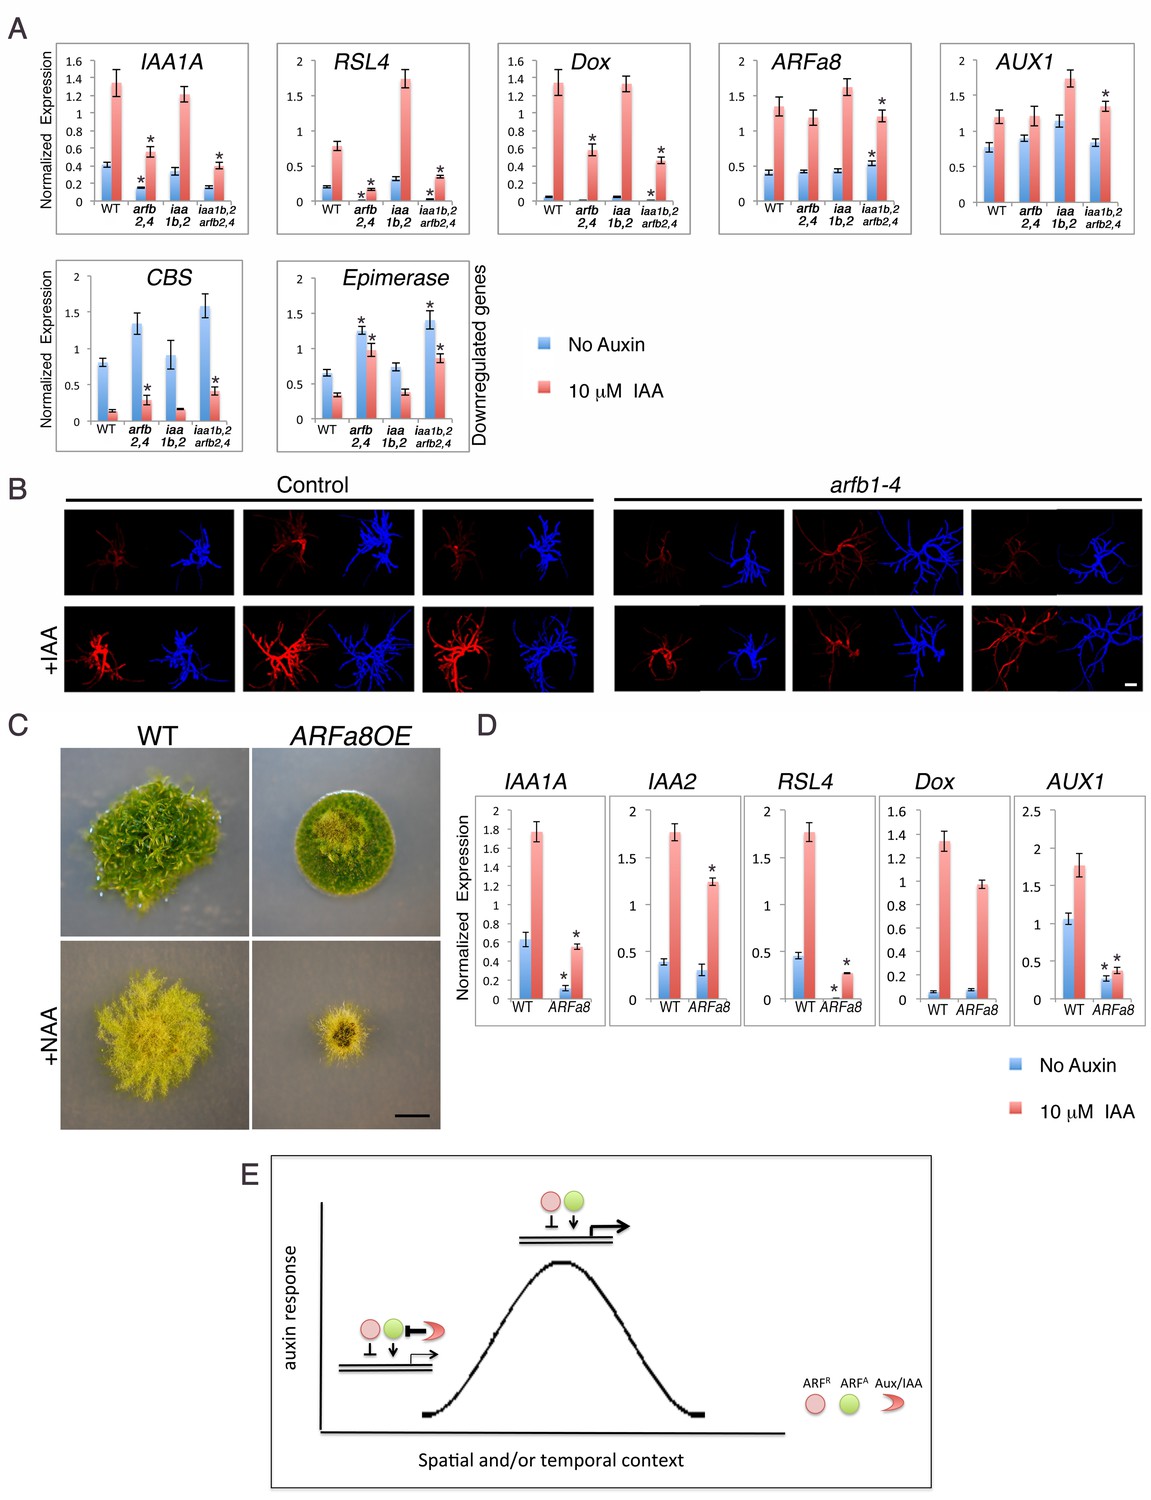
Both repressing and activating ARFs affect auxin response in the same direction in the presence of the Aux/IAAs.
(A) qPCR showing the expression levels of auxin responsive genes in WT, arfb2 arfb4Δ (arfb2,4), iaa1b iaa2Δ (iaa1b,2), and arfb2 arfb4 iaa1b iaa2Δ (iaa1b,2 arfb2,4), mock- or 10 μM IAA-treated for five hours. Error bars represent s.e.m. *p<0.05 (t-test comparing the arfb2 arfb4Δ, and arfb2 arfb4 iaa1b iaa2Δ lines to either WT or iaa1b iaa2Δ, respectively), n=3. (B) Three independent arfb1-4 RNAi and control lines mock- or 10 μM IAA-treated. Each line is presented by two images (DsRED fluorescence (red), chlorophyll auto-florescence (blue). Each image is from projection stacks of multiple confocal sections. Scale bar: 100 μm. (C) WT and an ARFa8 overexpression line (ARFa8OE) grown for one month on BCDAT without auxin or with 12.5 μM NAA. Scale bar: 0.5 cm. (D) qPCR showing the expression levels of auxin responsive genes in WT and ARFa8OE mock- or 10 μM IAA-treated for five hours. Error bars represent s.e.m. *p<0.05 (t-test comparing the ARFa8OE line to WT), n=3. (E) Model for auxin regulation of transcription. The expression level of an auxin responsive gene is determined by the interplay between the Aux/IAAs, the repressing ARFs, and the activating ARFs. At low auxin levels the Aux/IAAs provide stringent repression. At high auxin levels, the Aux/IAAs are degraded resulting in increased transcription through the action of the activating ARFs. The repressing ARFs act to buffer gene expression by attenuating the activity of the activating ARFs. The interplay between the three protein groups results in a wide range of gene expression levels that contribute to a dynamic and context specific auxin response.
Figure 5—figure supplement 1
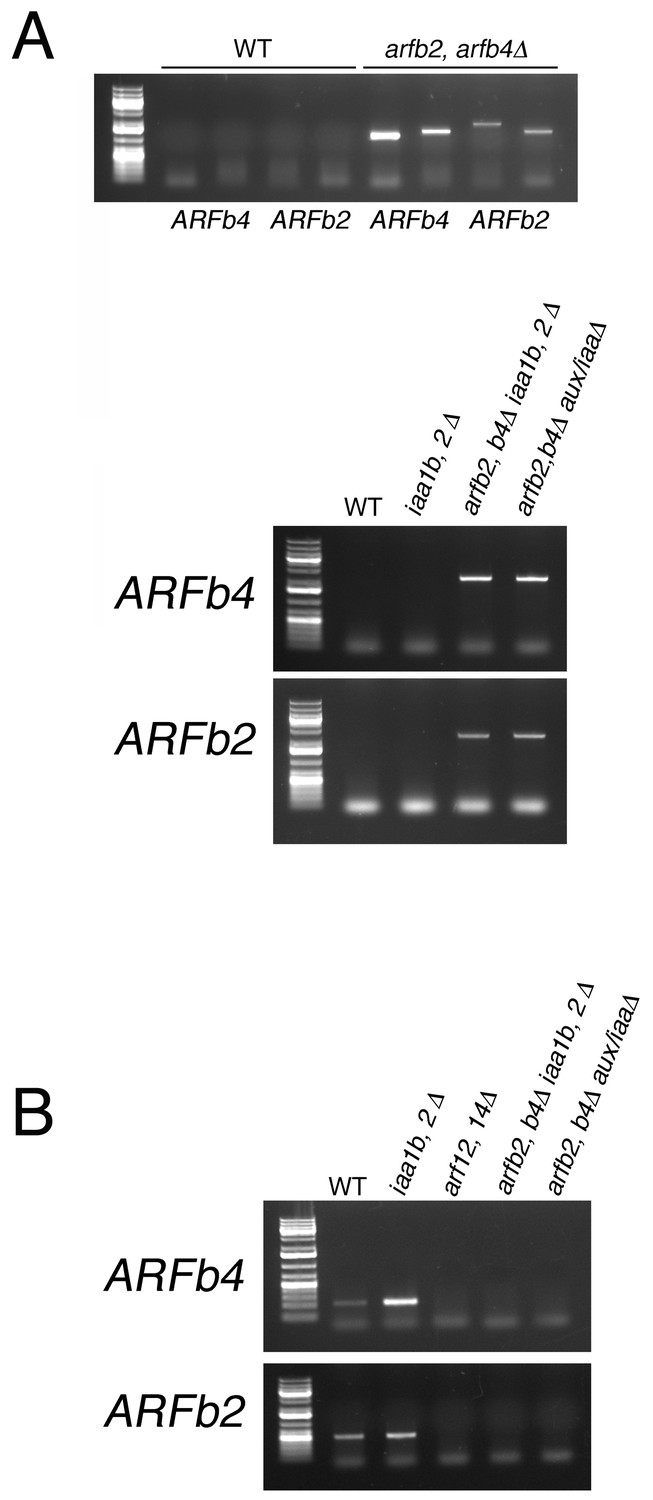
PCR detecting the insertion position of different arfb2 arfb4Δ mutants.
(A) Validating the absence of the genomic sequence of ARFb2 and ARFb4PCR. Upper panel: validating the transgene integration in arfb2 arfb4Δ mutant. Primer pairs used to confirm the presence of either up or downstream transgene-endogenous sequence junctions, respectively: ARFb2 (PML703, 722; PML267, 704), ARFb4 (PML195, 675; PML197, 676). Lower panel: validating the transgene integration in arfb2 arfb4Δ iaa1b iaa2Δ and arfb2 arfb4Δ aux/iaaΔ mutants after CRE/lox recombination. Primer pairs used to confirm the absence of the endogenous sequences: ARFb2 (PML703, 704), ARFb4 (PML675, 676). WT sequences were not amplified using these endogenous primers since the resulting fragments are too long and cannot be amplified under the PCR conditions used. (B) Validating the absence of the coding region of ARFb2 and ARFb4 in cDNA samples by RT-PCR. Primer pairs used: ARFb2 (PML551, 612) ARFb4 (PML512, 513).
Figure 5—figure supplement 2
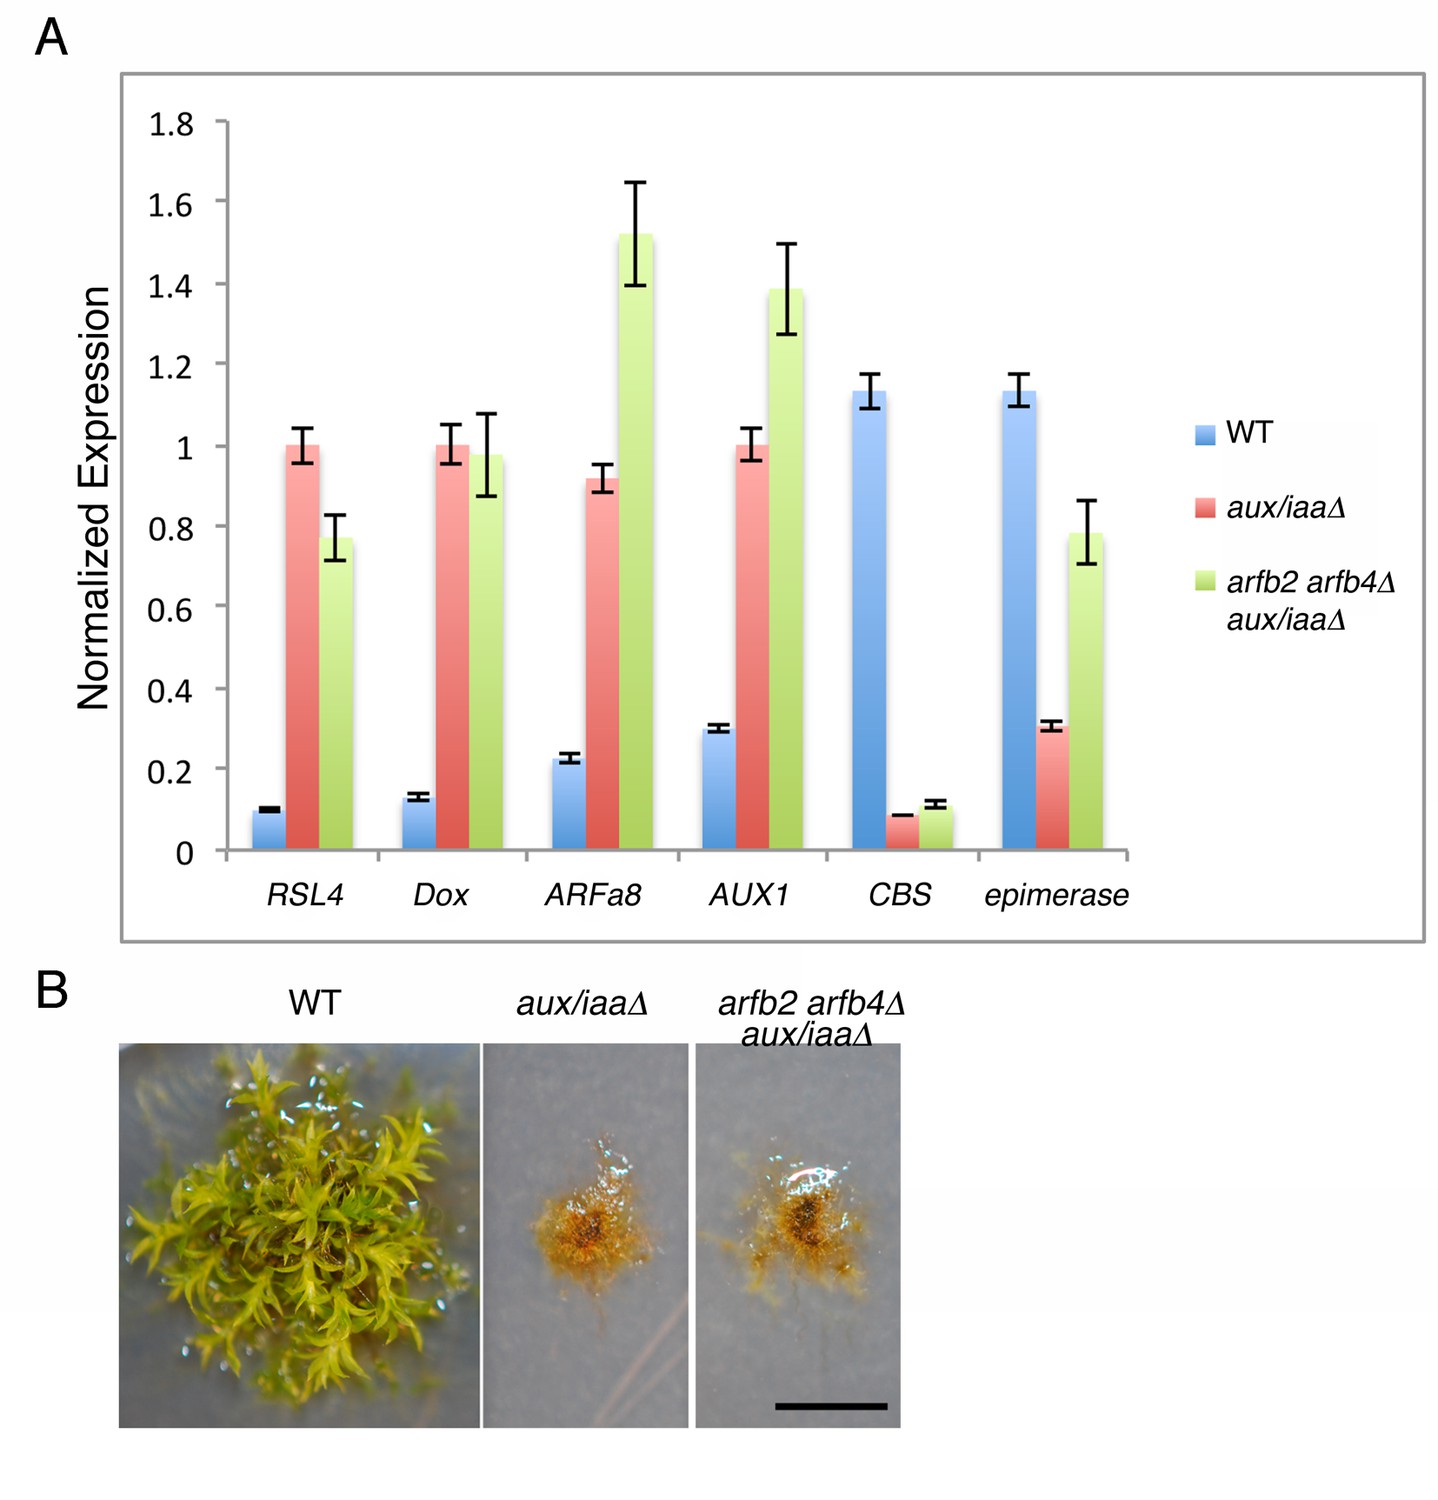
Arfb2 and arfb4 Knockout in aux/iaaΔ mutant background (arfb2 arfb4Δ aux/iaaΔ) does not result in phenotypes comparable to reduced auxin sensitivity.
(A) qPCR showing the expression levels of auxin responsive genes in WT, aux/iaaΔ, and arfb2 arfb4Δ aux/iaaΔ. (B) arfb2 arfb4Δ aux/iaaΔ and aux/iaaΔ mutants grown for one month on BCD. Scale bar: 0.5 cm.
Figure 5—figure supplement 3
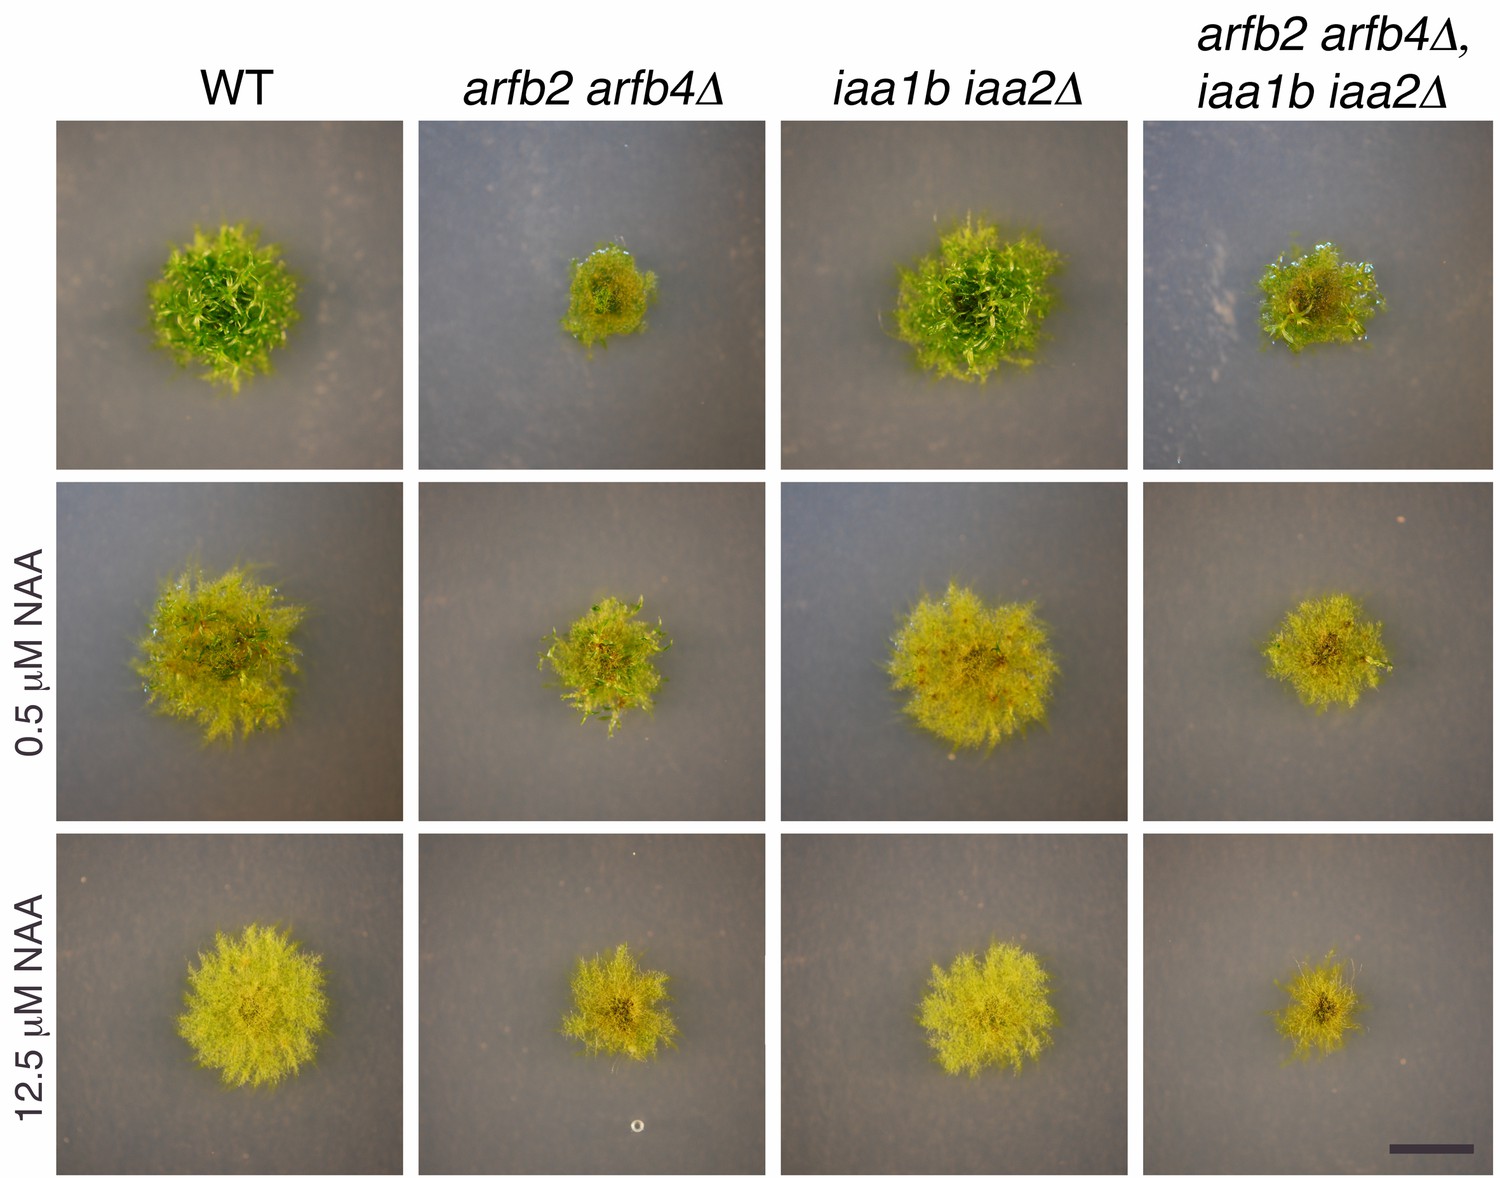
Phenotypic analysis of arfb2 arfb4Δ in WT and iaa1b iaa2Δ mutant background.
WT, arfb2 arfb4Δ, iaa1b iaa2Δ, and arfb2 arfb4Δ iaa1b iaa2Δ lines grown for one month on BCDAT medium without auxin or with different NAA concentrations. Scale bar: 0.5 cm.
Additional files
-
Supplementary file 1
(A) Differentially expressed genes between mock- and IAA treated WT protonemata, (fold change ≥1.5; padj <0.01). (B) Differentially expressed genes between mock treated WT protonemata and the aux/iaaΔ mutant (fold change ≥1.5; padj <0.01). (C) Differentially expressed genes between IAA treated WT protonemata, and the aux/iaaΔ mutant (fold change ≥1.5; padj <0.01). (D) Differentially expressed genes between mock- and IAA treated aux/iaaΔ mutant (padj <0.05).
- https://doi.org/10.7554/eLife.13325.018
-
Supplementary file 2
(A) GO terms of biological processes (P), molecular function (F), and cellular component (C) associated with auxin-regulated genes. (B) GO terms of biological processes (P), molecular function (F), and cellular component (C) associated with genes regulated between WT and the aux/iaaΔ mutant.
- https://doi.org/10.7554/eLife.13325.019
-
Supplementary file 3
Primer sequences used in this study.
- https://doi.org/10.7554/eLife.13325.020
-
Supplementary file 4
Backbone vectors used in this study.
- https://doi.org/10.7554/eLife.13325.021
Download links
A two-part list of links to download the article, or parts of the article, in various formats.
Downloads (link to download the article as PDF)
Open citations (links to open the citations from this article in various online reference manager services)
Cite this article (links to download the citations from this article in formats compatible with various reference manager tools)
Constitutive auxin response in Physcomitrella reveals complex interactions between Aux/IAA and ARF proteins
eLife 5:e13325.
https://doi.org/10.7554/eLife.13325


