Atypical calcium regulation of the PKD2-L1 polycystin ion channel
- Howard Hughes Medical Institute, Boston Children's Hospital, United States
- Harvard Medical School, United States
Figures
Figure 1 with 1 supplement
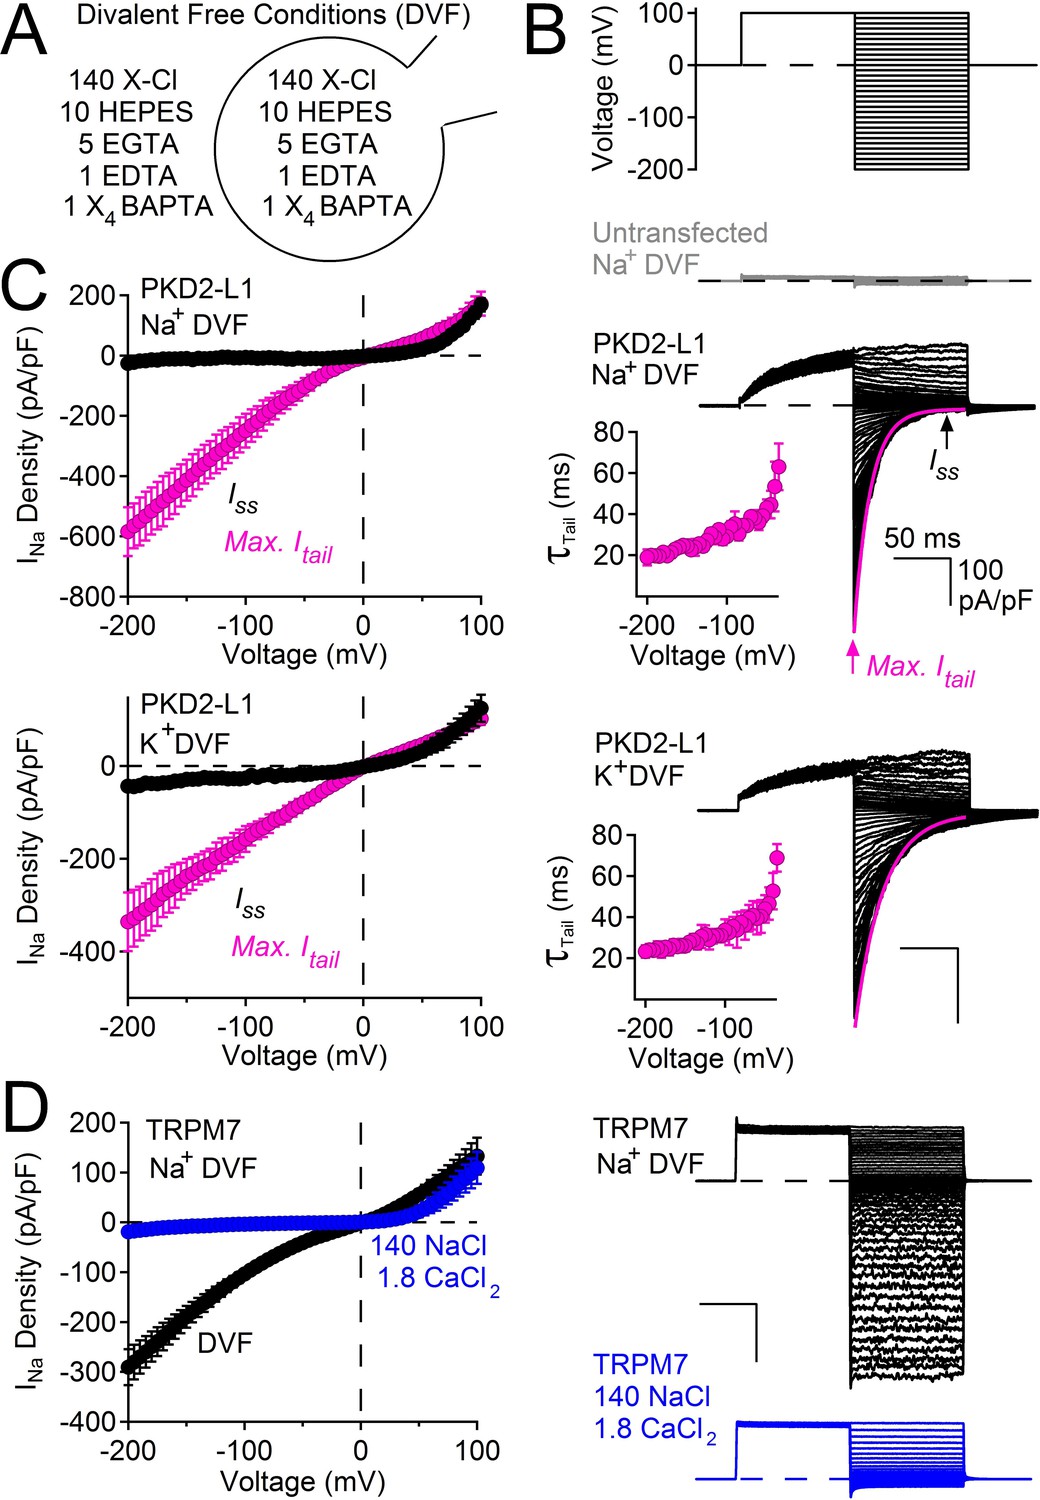
PKD2-L1 channel deactivation is voltage-dependent.
(A) Diagram depicting symmetrical divalent free (DVF) conditions. (B) Top, voltage protocol used to generate tail currents. Representative currents from untransfected HEK cells (gray traces) and those expressing PKD2-L1 channels (black traces). Tail currents were fit to a single exponential (magenta trace), averaged and plotted relative to voltage (Inset, Error ± SEM, N = 4–7 cells). (C) Sodium current density-voltage relationships measured at the maximum of the tail current and at steady state. Results from repeated trials of the voltage protocol are indicated (Error ± SEM, N = 4–7 cells). (D) Right, Representative TRPM7 DVF Na+ currents recorded under (black traces) and after the addition of 1.8 mM CaCl2 (blue traces). Left, Resulting TRPM7 current density-voltage relationships (Error ± SEM, N = 8 cells).
Figure 1—figure supplement 1
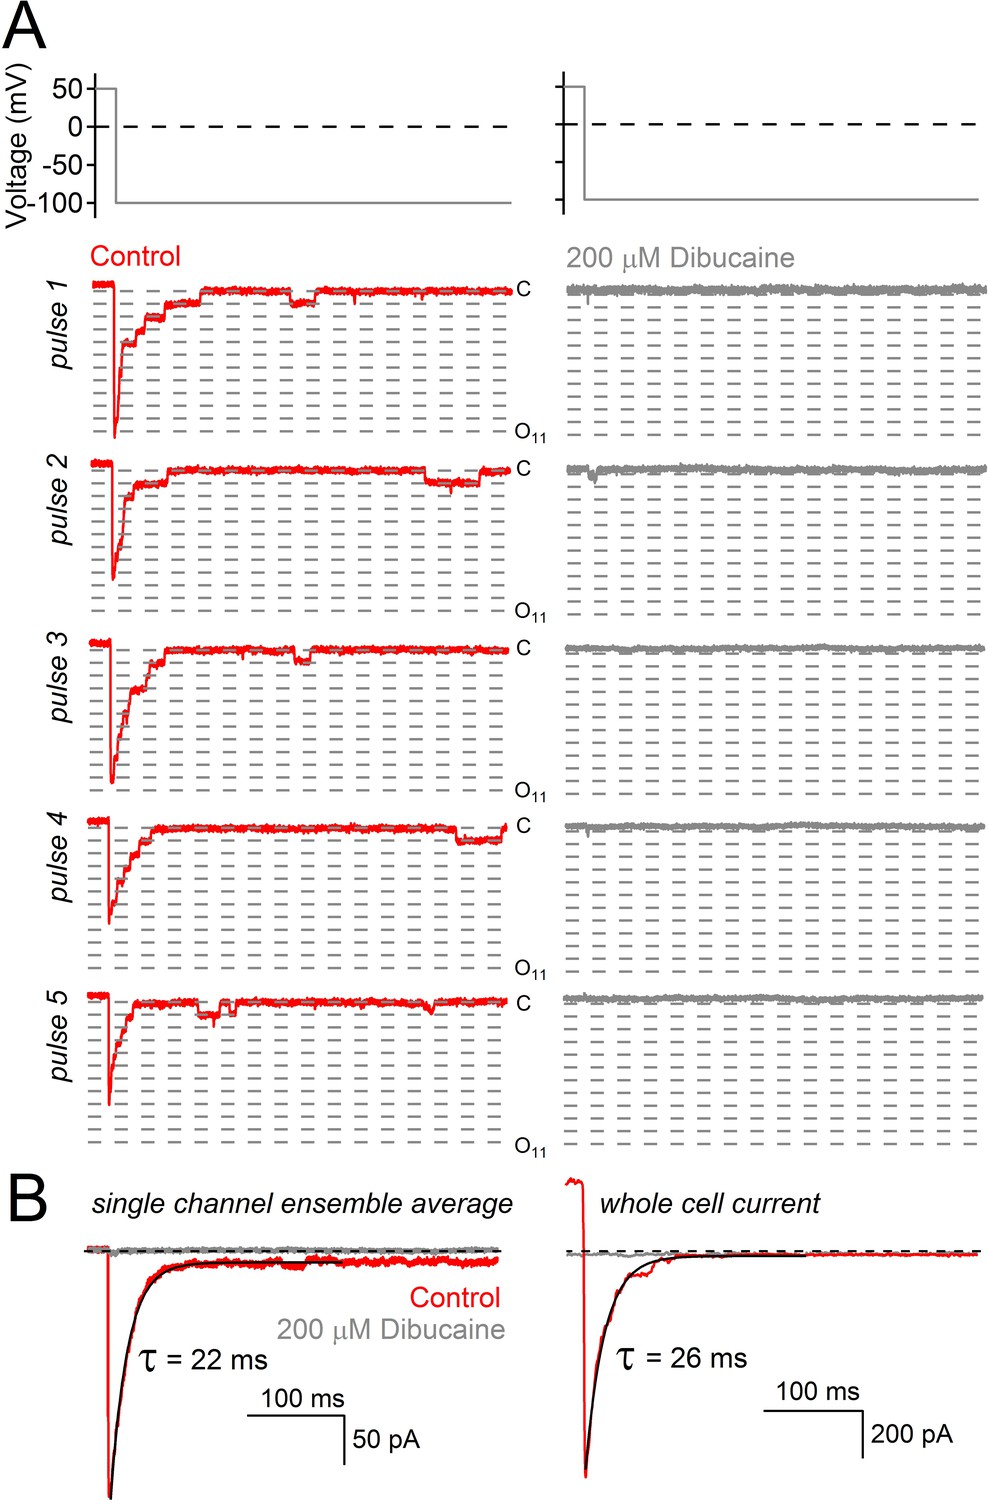
Decay of hyperpolarization-induced tail currents from PKD2-L1 channels.
(A) Single channel current events triggered by five hyperpolarization steps (top) in control conditions and after treatment with dibucaine. Dashed lines are 12.1 pA increments that separate multiple open channel events (inward, 121 ± 3 pS). Level ‘C’ indicates the level at which all PKD2-L1 channels are closed. Open channel levels ‘O’ are subscripted with the number of simultaneous open events (up to 11). (B) Ensemble average of single channel records from 20 hyperpolarizing pulses reveals the time course of tail current decay (black trace). (C) Tail current decay measured in the whole-cell configuration. Note that all current traces are graphed on the same time scale and are activated by the same voltage protocol shown at the top of panel A.
Figure 2 with 1 supplement
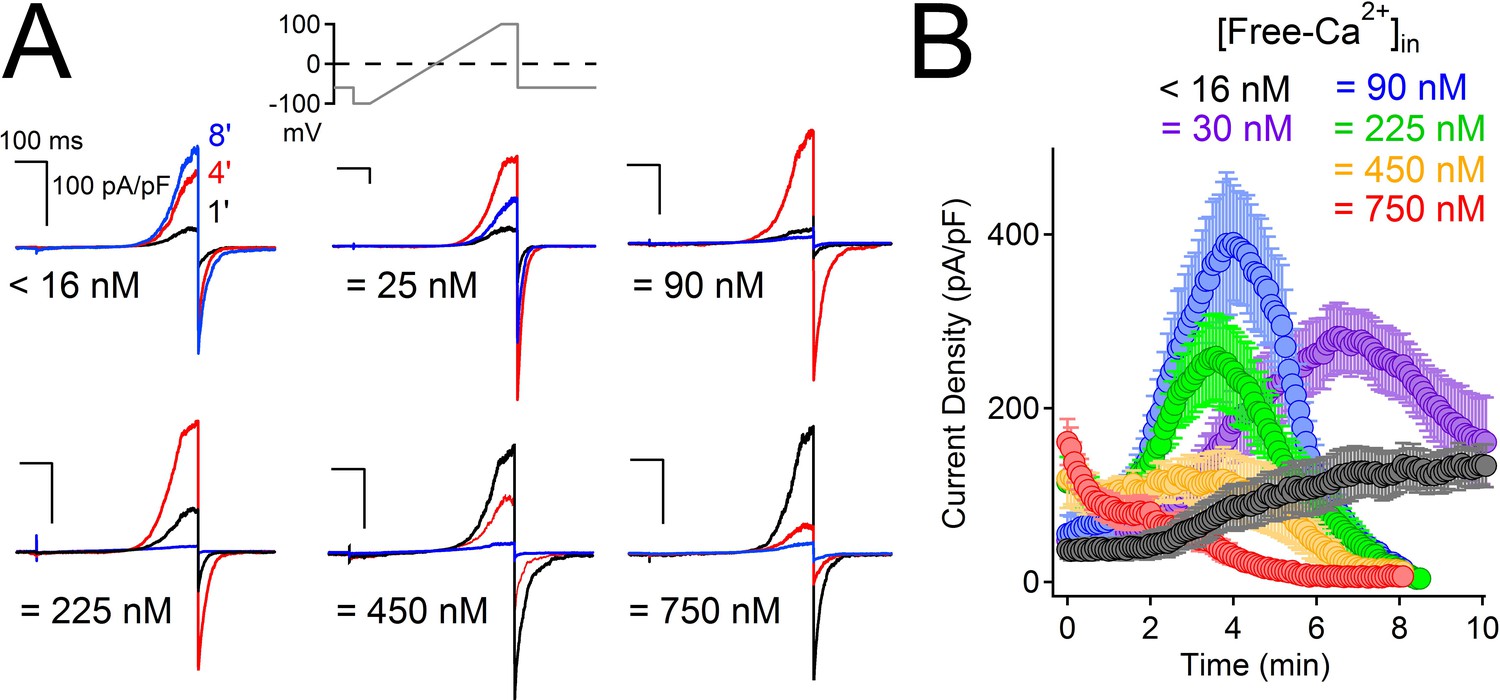
High intracellular Ca2+ irreversibly inactivates PKD2-L1.
(A) Representative PKD2-L1 currents captured at 1, 4 and 8 min time points recorded with the indicated buffered [free- Ca2+]; 2 mM Ca2+ in the external solution. (B) Time course of outward peak current density recorded under the indicated conditions (Error ± SEM, N = 7–10 cells).
Figure 2—figure supplement 1
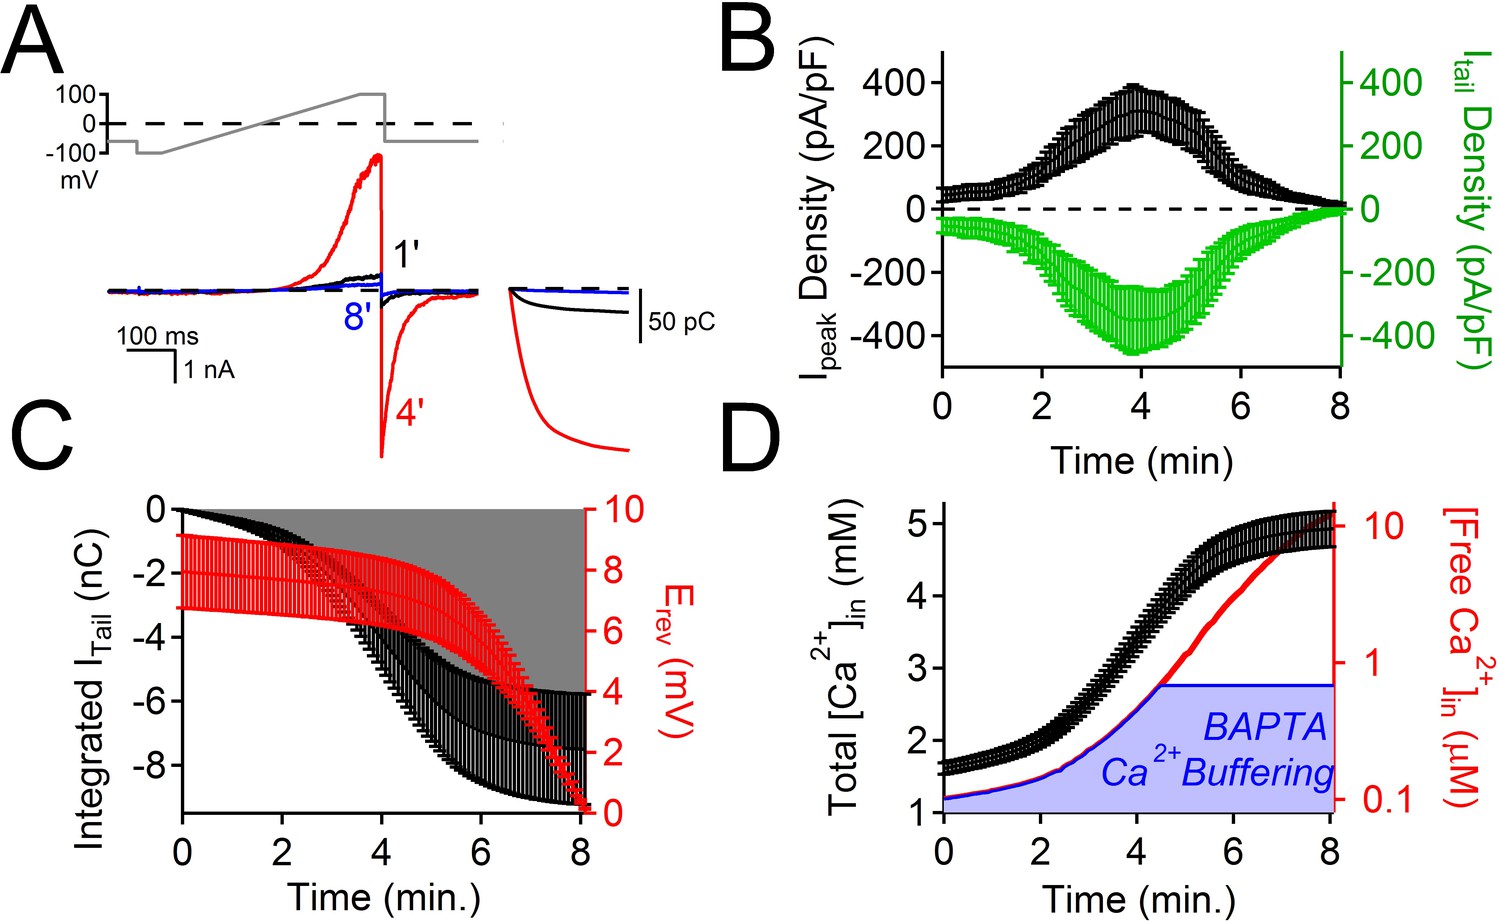
The time course of PKD2-L1 inactivation correlates with internal Ca2+ accumulation.
(A) Top, Voltage ramp applied at 0.5 Hz to activate PKD2-L1 currents expressed in HEK 293T cells. Bottom, Representative PKD2-L1 currents captured at 1, 4, and 8 min time points in physiological [Ca2+] (2 mM [Ca2+] external, initial 100 nM [free Ca2+] internal). Inset right, corresponding integrated tail currents elicited by repolarization to -60 mV. B) Plot of the average Ipeak (measured at 100 mV) and Itail density (measured at -60 mV) over an 8 min time course. (C) Relationships between the cumulative integrated Itail currents and the change in measured reversal potential (Erev) over time. (D) Time course of the estimated total internal [Ca2+] accumulation and [free Ca2+] using 5 mM BAPTA-buffered intracellular solution (see Materials and methods, N= 9 cells, Error ± SEM). The blue area under the free Ca2+ curve is the ‘good buffering’ range (0.68–683 μM) for BAPTA (kD = 216 μM) (Ben-Johny et al., 2015); the calculated free [Ca2+] above this range is thus less accurate.
Figure 3
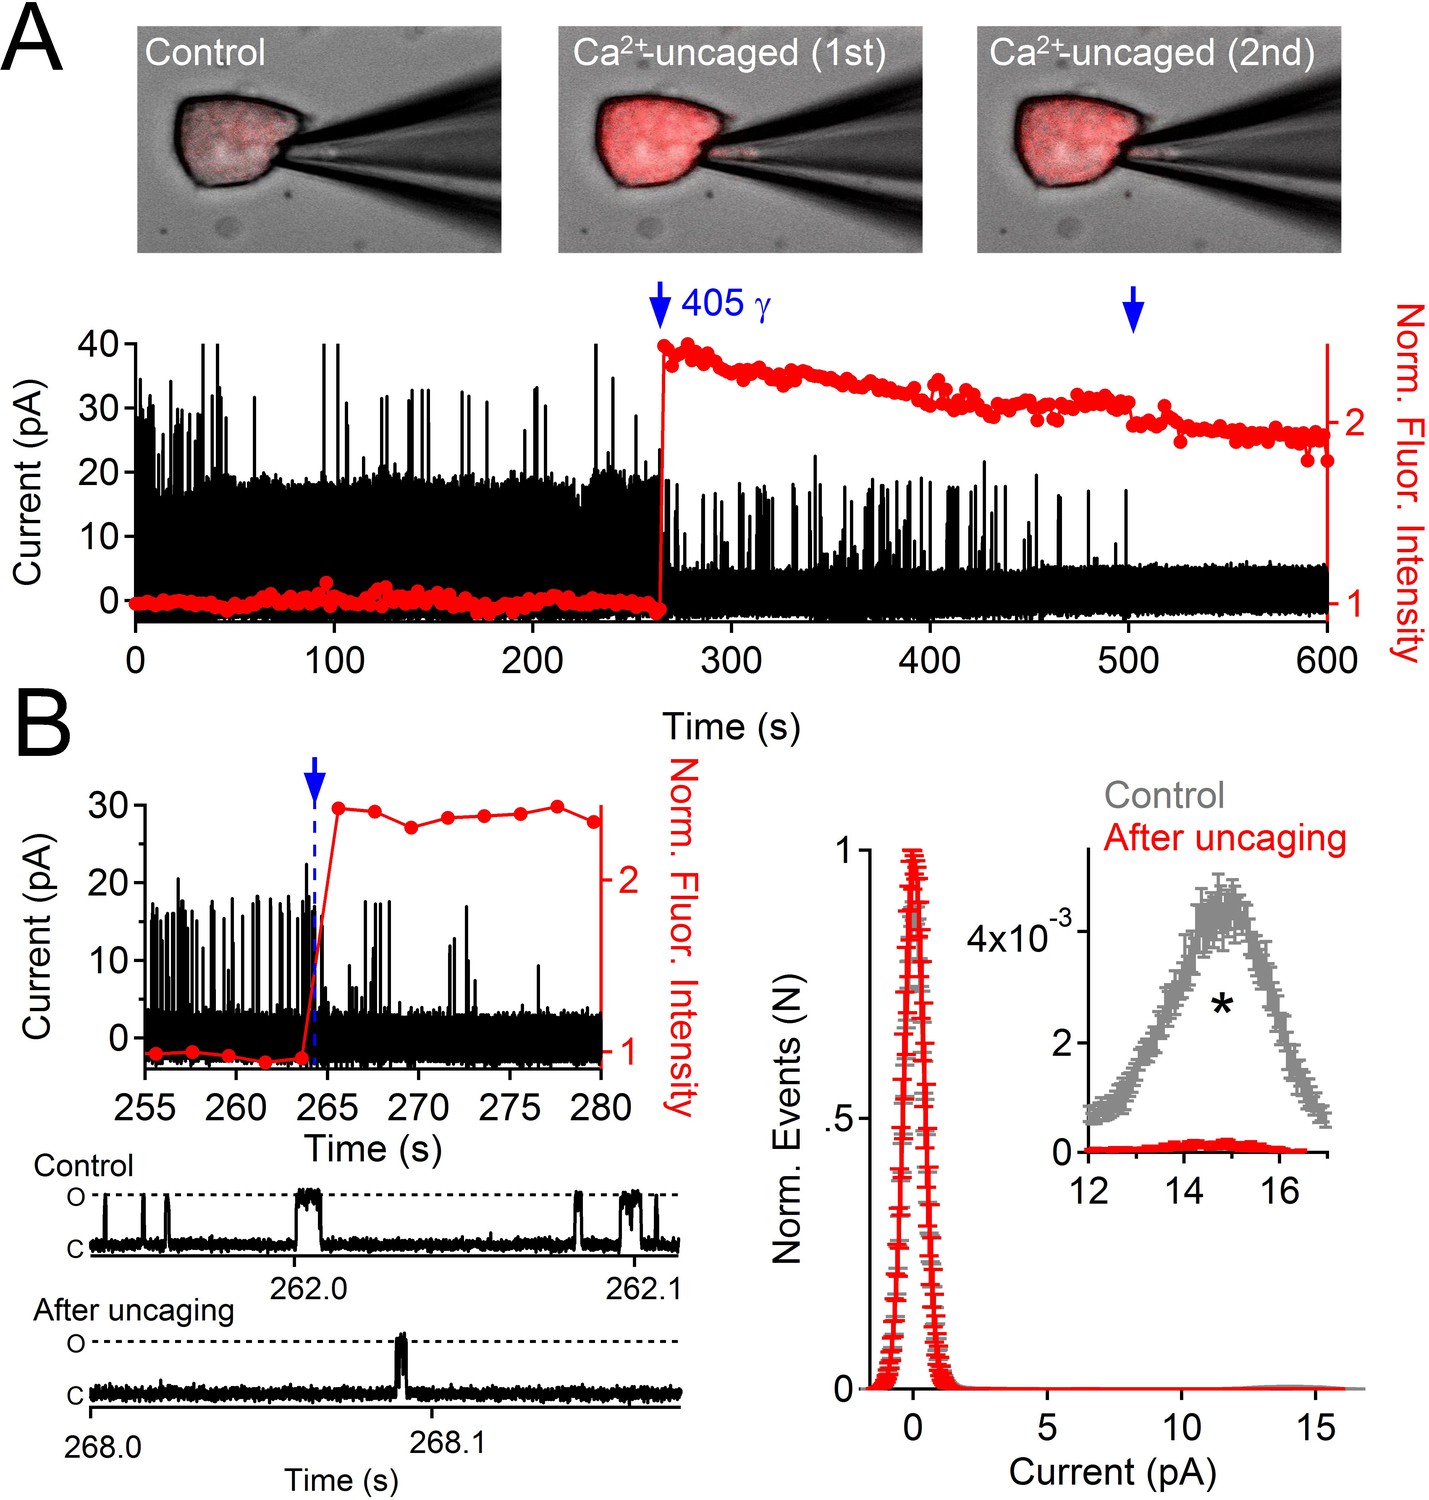
Uncaging internal Ca2+ blocks outward single channel openings.
(A) Outward PKD2-L1 single channel events measured in the on-cell configuration; holding potential = 80 mV. Ca2+ dependent fluorescence was measured using Fluo-3; internal Ca2+ was caged with NP-EGTA. Blue arrows indicate the time points at which Ca2+ was uncaged using a 1 s 405 nm UV pulse. Images before and after uncaging are shown above the single channel record. (B) Expanded time scales of the record in A, illustrating the rapidity of current block. Right, Normalized open probability histograms measured in control (gray) and after uncaging cytosolic Ca2+ (red). The open probability (Po) of PKD2-L1 was significantly reduced after the UV pulse (N= 4 cells, Error ± SEM; asterisk indicates p<0.005; Prior to UV pulse, Po = 0.0057 ± 0.001; after UV pulse Po = 0.0002 ± 0.0002).
Figure 4 with 1 supplement
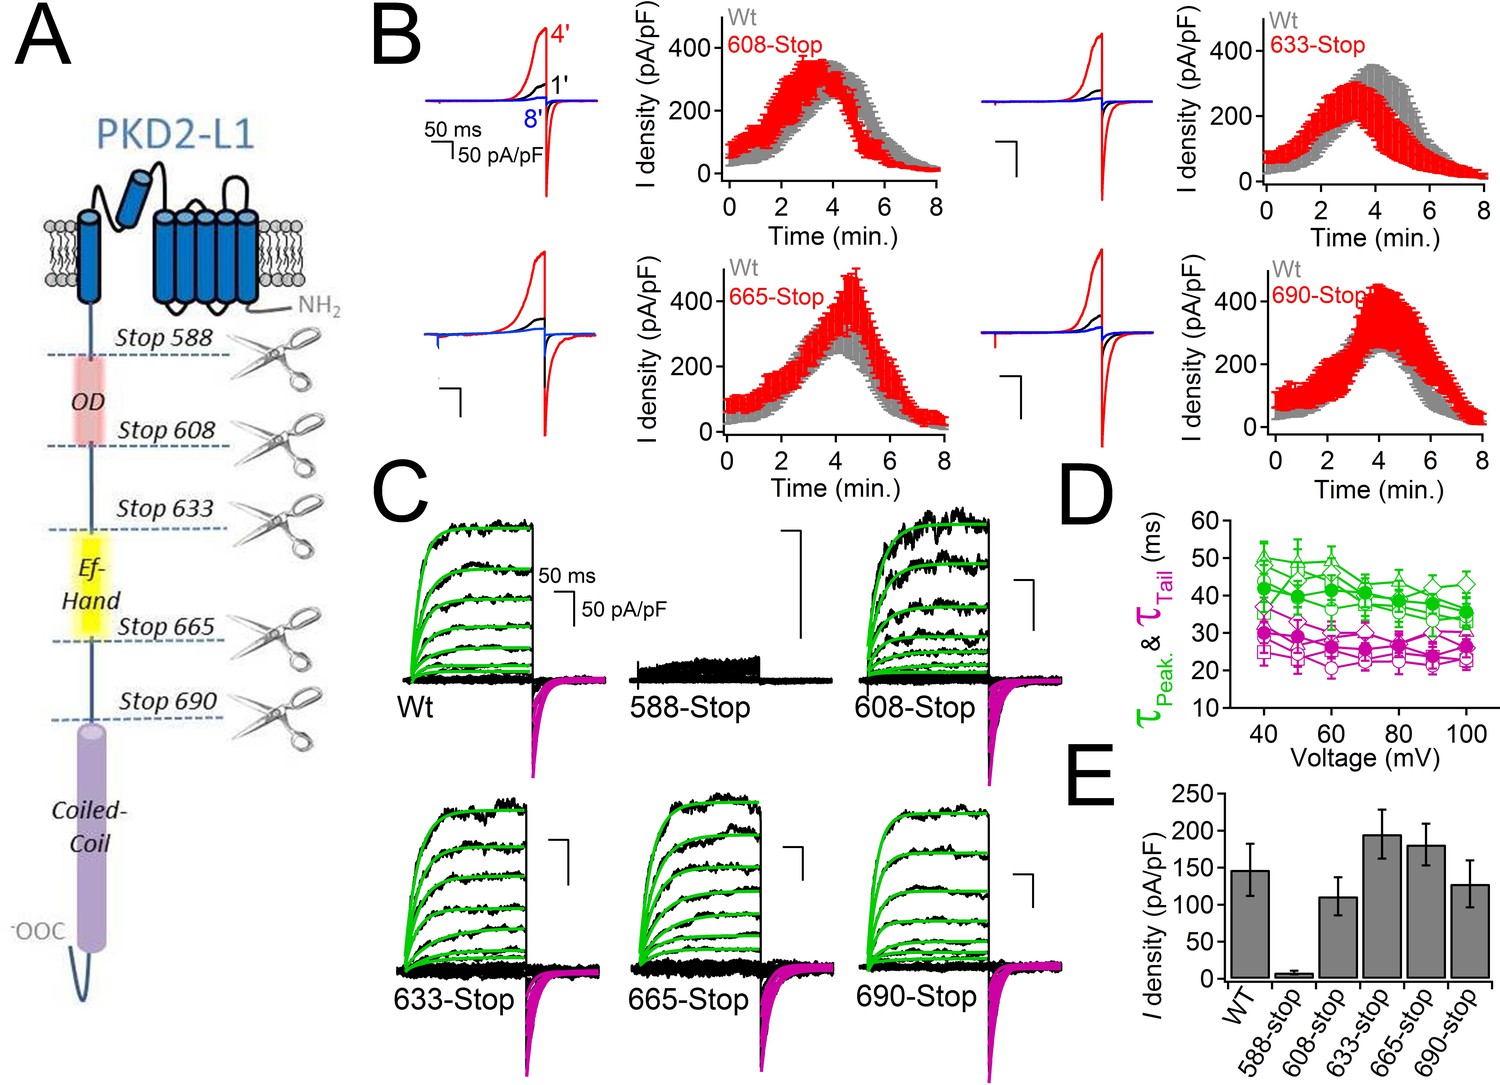
PKD2-L1 channel C-terminal truncations do not alter Ca2+-dependent inactivation.
(A) Cartoon depicting the locations of the C-terminal truncation mutants relative to the putative intracellular motifs. (B) Representative PKD2-L1 currents and the time courses of the potentiation and inactivation for the truncation mutants relative to the Wt channel. Currents were recorded in physiological [Ca2+] (same conditions as described in Figure 2). (C) Representative currents activated by +10 mV voltage steps from -100 to +100 mV from the Wt and truncated PKD2-L1 channel. (D) Corresponding voltage dependence of the kinetics of channel opening (τpeak) and channel closure (τtail). (E) The average PKD2-L1 channel current density measured at +100 mV.
Figure 4—figure supplement 1
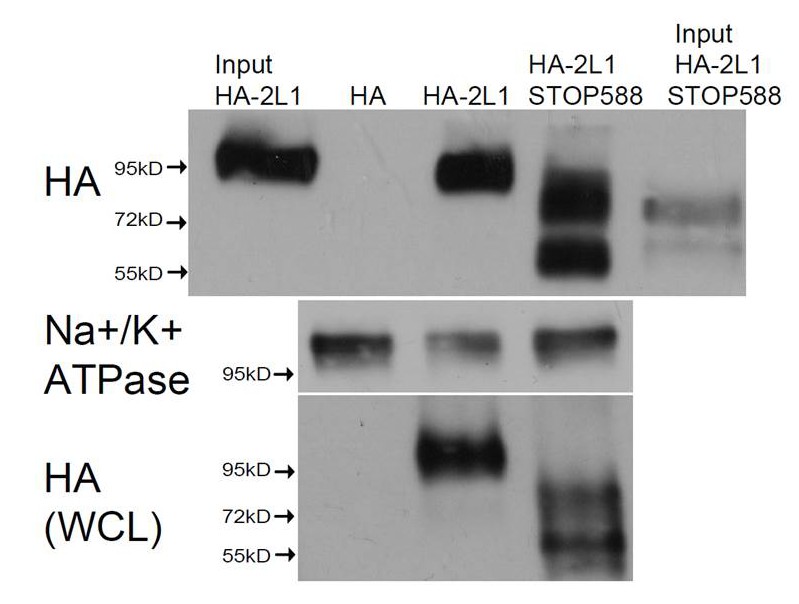
Cell surface expression of the non-functional PKD2-L1 truncation mutants.
Transfected HEK 293T cells expressing N-terminally HA-tagged PKD2-L1 (HA-2L-1) and PKD2-L1 C-terminal truncation (HA-2-L1 Stop-588) were labeled with biotin. Total lysates and streptavidin-precipitated biotinylated proteins were run on a single gel and analyzed by immunoblot with anti-HA (upper panel). Biotinylated protein immunoprecipitated by streptavidin shows that the PKD2-L1 (Stop-588) truncation mutant can be detected on the plasma membrane (fourth lane). Na+/K+-ATPase serves as a positive control for successful membrane biotinylation and streptavidin IP (middle panel). Whole cell lysates (WCL) detected with anti-HA (bottom panel) serve as the loading control.
Figure 5 with 1 supplement
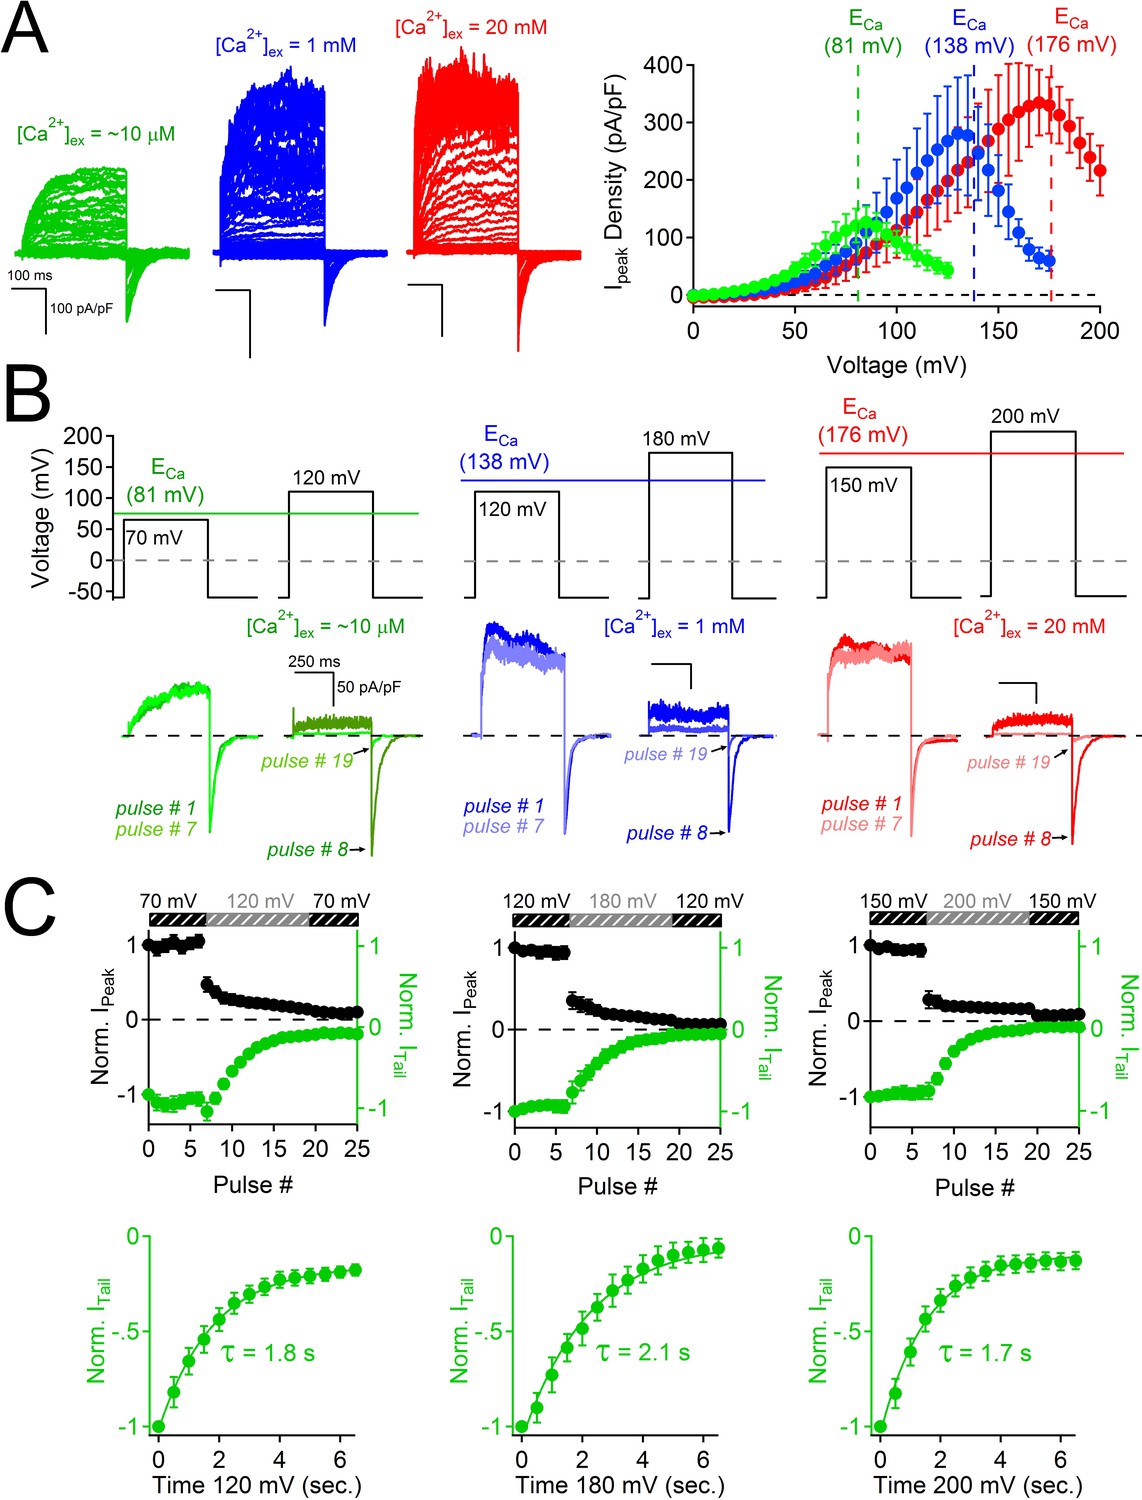
Block of PKD2L-1 by outward Ca2+ triggers channel inactivation.
(A) Left, Exemplar currents measured with the indicated [Ca2+]ex (inset). Right, resulting outward current densities at the indicated ECa (N = 6–7, Error ± SEM). (B) PKD2-L1 currents recorded from separate cells activated in the presence of 10 μM, 1mM and 20 mM [Ca2+]ex by a series of depolarizations (0.2 Hz) hyperpolarized and depolarized relative to ECa. (C) Top, resulting normalized peak and tail currents (Error ± SEM, N =4–5 cells). Bottom, PKD2-L1 inactivation rate in each [Ca2+]ex condition (10 μM, 1 mM and 20 mM) was determined by single exponential fitting of the decay of the tail current amplitude (τinact. = 1.8 ± 0.2 s; 2.1 ± 0.2 s; 1.7 ± 0.2 s, respectively).
Figure 5—figure supplement 1
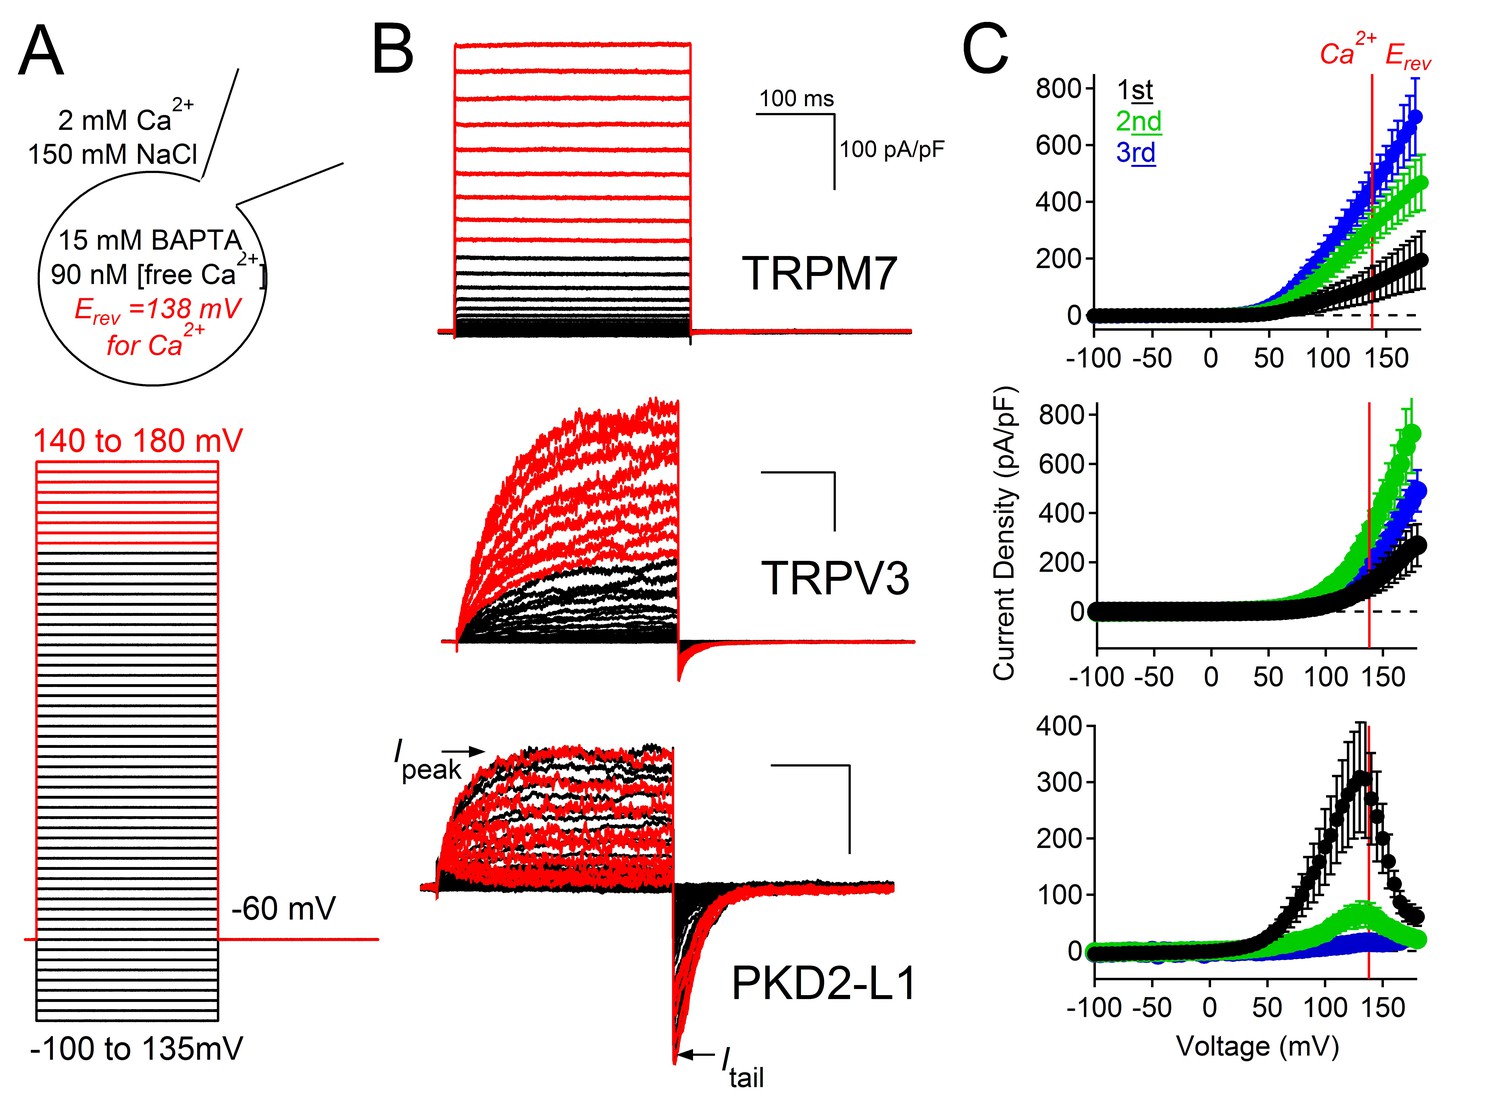
Outward PKD2-L1 current is blocked at membrane potentials positive to ECa.
(A) Left, Scheme depicting the ionic conditions and voltage protocol used to measure the voltage dependence of several TRP channels. Right, Whole-cell currents measured from HEK-293T cells expressing TRPM7, TRPV3 and PKD2-L1. In black are the currents activated by depolarizations negative to ECa. In red are currents activated by depolarizations positive to ECa. All scale bars as for TRPM7. (B) Peak current density-voltage relationship. Results from repeated trials of the voltage protocol are indicated (Error ± SEM, N =4–9 cells).
Figure 6 with 1 supplement
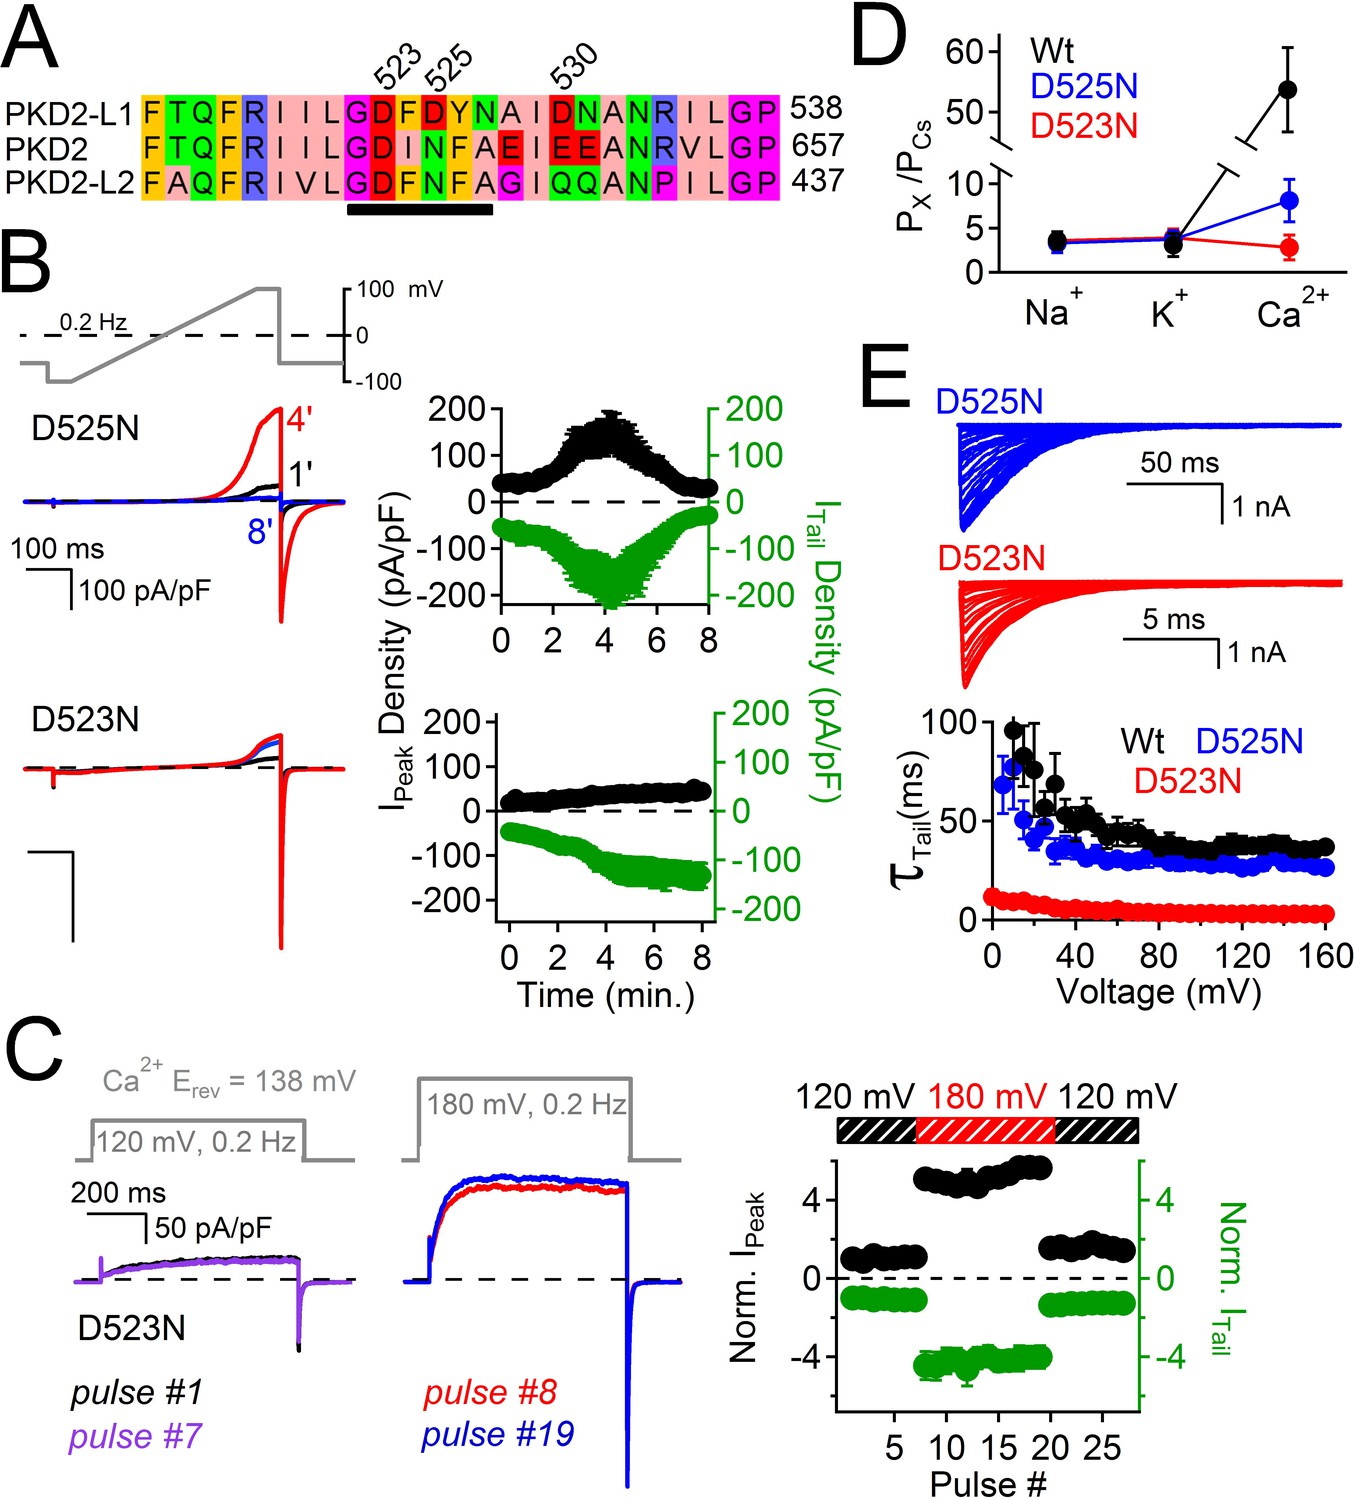
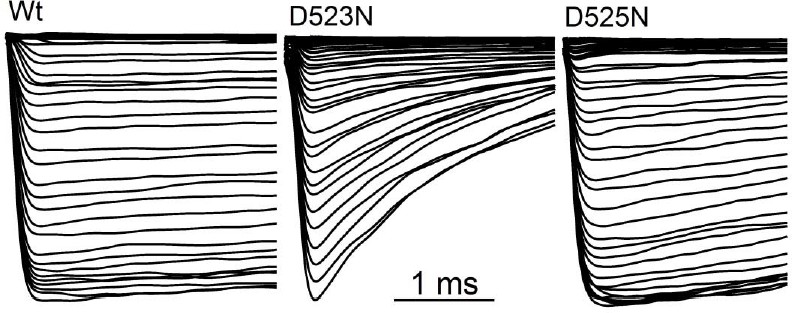
Filter mutant D523N is not blocked by outward Ca2+ and is not inactivated.
(A) Amino acid alignment of the pore regions of PKD2 family members. The black bar indicates the selectivity filter. (B) Representative currents and time course of the average tail and peak current densities for the selectivity filter mutants (Error ± SEM, N =7 cells). (C) Left, representative D523N currents activated by a series of depolarizations (0.2 Hz) negative (+120 mV) and positive (+180 mV) to ECa (138 mV). Right, resulting normalized peak and tail current amplitudes (Error ± SEM, N =5 cells). (D) The relative permeability (Px/PCs) of Na+, K+ and Ca2+ for Wt and mutant channels. These values were calculated using the measured reversal potentials from the steady state voltage-current relationships in Figure 6—figure supplement 1, and tabulated in Figure 6—source data 1). (E) Top, representative tail currents activated by repolarizing -60 mV from the indicated potentials. Bottom, Corresponding voltage dependence of the channel closing (deactivation) kinetics (τtail;Error ± SEM, N=6–8).
-
Figure 6—source data 1
A table listing the relative permeabilities of cations through the PKD2-L1 channels as estimated by the measured reversal potentials (Erev).
Relative permeabilities (Px/PCs) of Na+, K+ and Ca2+ compared to Cs+ were calculated (see Methods) based on the measured reversal potential (N= 4–9, Error ± SEM).
- https://doi.org/10.7554/eLife.13413.013
Figure 6—figure supplement 1
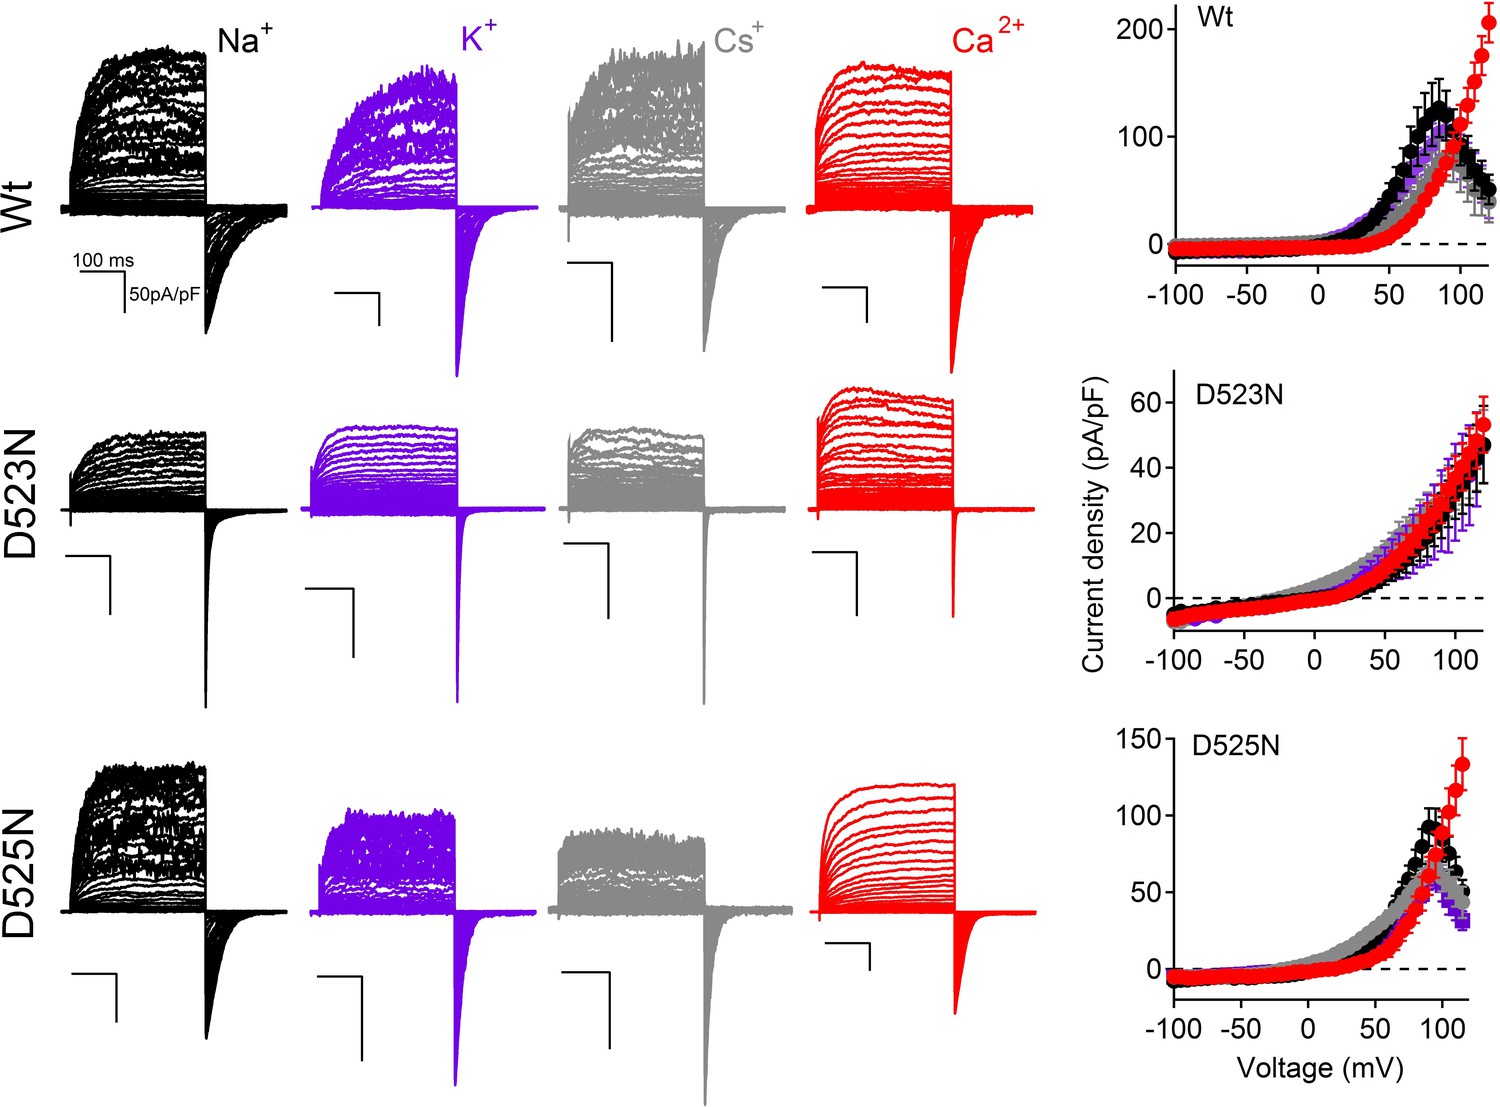
The current-voltage relationships of PKD2-L1 channels in the presence of different extracellular cations.
Left, Representative current traces activated by 300 ms, +5 mV depolarizations from -100 to +100 mV; holding potential = −60 mV; recorded from the indicated PKD2-L1 channel/mutant. The external concentration of each ion was 140 mM (no other cations except those indicated). Right, Corresponding outward Ipeak current densities (N= 4–9, Error ± SEM). Intracellular Mg2+ was omitted. Free [Ca2+] was calculated to be 15 nM (15 mM BAPTA and 5 mM EGTA) to prevent Ca2+ accumulation and inactivation of the PKD2-L1 current. The external free-Ca2+ in the Na+, Cs+ and K+ conditions ≈ 10 μM; ECa = 88 mV.
Figure 7 with 1 supplement

Loss of transition metal block in selectivity filter mutant, D523N.
(A, B) Effects of Zn2+ and Cd2+ on PKD2-L1 currents. Top, Exemplar PKD2-L1 currents activated by voltage ramps at the indicated [Zn2+]. Bottom, Corresponding time courses of the Zn2+ block of the Wt and D525N PKD2-L1 channels. The internal buffer was 15 mM BAPTA and 5 mM EGTA, which prevented Ca2+ accumulation and inactivation of the PKD2-L1 currents. (B) Divalent metal concentration-dependent block of the Wt, D523N and D525N channels (Error ± SEM, N = 4–6 cells). (C–E) Effects of trivalent metal block. Left, Exemplar PKD2-L1 currents activated by voltage ramps in the presence of La3+. Right, Corresponding time courses of the La3+ block of the indicated PKD2-L1 channels. (D) Concentration-dependent block of PKD2-L1 and D525N channels by trivalent ions, and (E) potentiation of the D523N filter mutant channel (Error ± SEM, N = 4–5 cells).
-
Figure 7—source data 1
A table listing the potencies (IC50) of PKD2-L1 current antagonism by dibucaine and transition metals.
Concentration of half current inhibition (IC50) was estimated by fitting the concentration-percent current block relationship using the Hill equation (see Materials and methods).
- https://doi.org/10.7554/eLife.13413.016
Figure 7—figure supplement 1
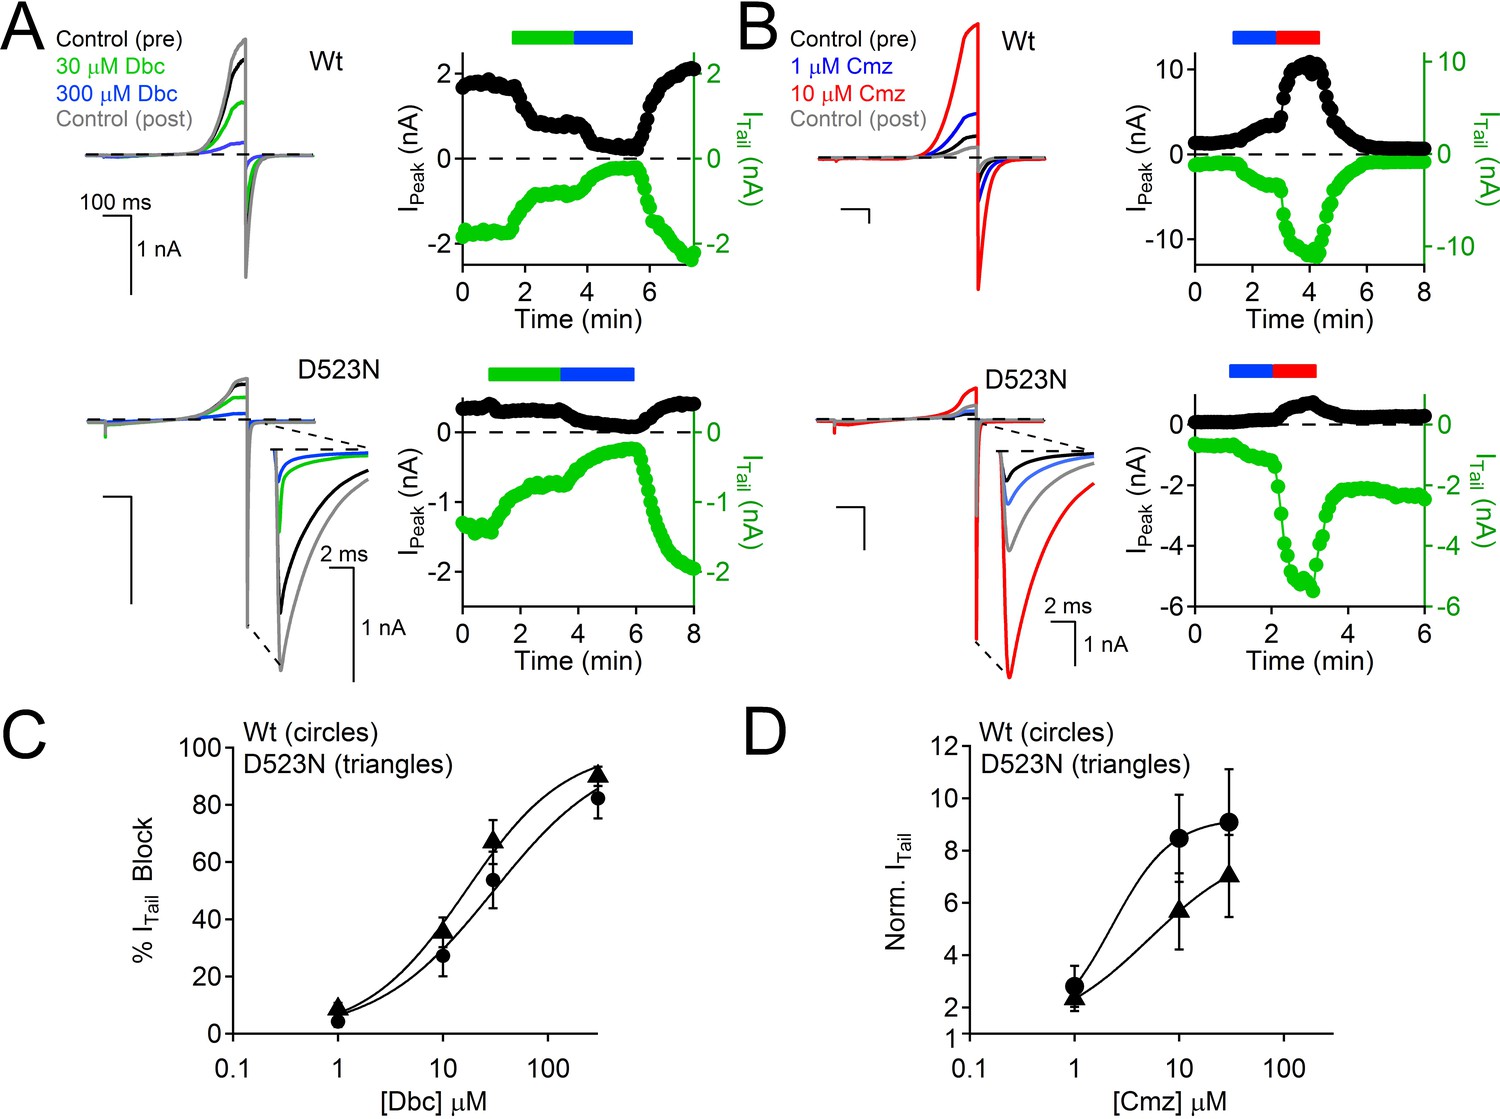
Calmidazolium activation and dibucaine block is preserved in the D523N filter mutant channel.
(A) Left, Exemplar Wt and D523N currents activated by voltage ramps in the presence of two concentrations of the local anesthetic, dibucaine (Dbc). Right, Corresponding time course of current block. (B) Left, Exemplar Wt and D523N currents activated by voltage ramps in the presence of two concentrations of the cell permeable calmodulin antagonist, Calmidazolium (Cmz). Right, Corresponding time course of current potentiation. (C) Dibucaine concentration-dependent block of the Wt and D523N channels (Error ± SEM, N=4–5 cells). (D) Calmidazolium concentration-dependent potentiation of the Wt and D523N filter mutant (Error ± SEM, N = 4–5 cells). Intracellular [Ca2+] was buffered with 15 mM BAPTA and 5 mM EGTA to prevent Ca2+ accumulation and inactivation of the PKD2-L1 currents.
Figure 8
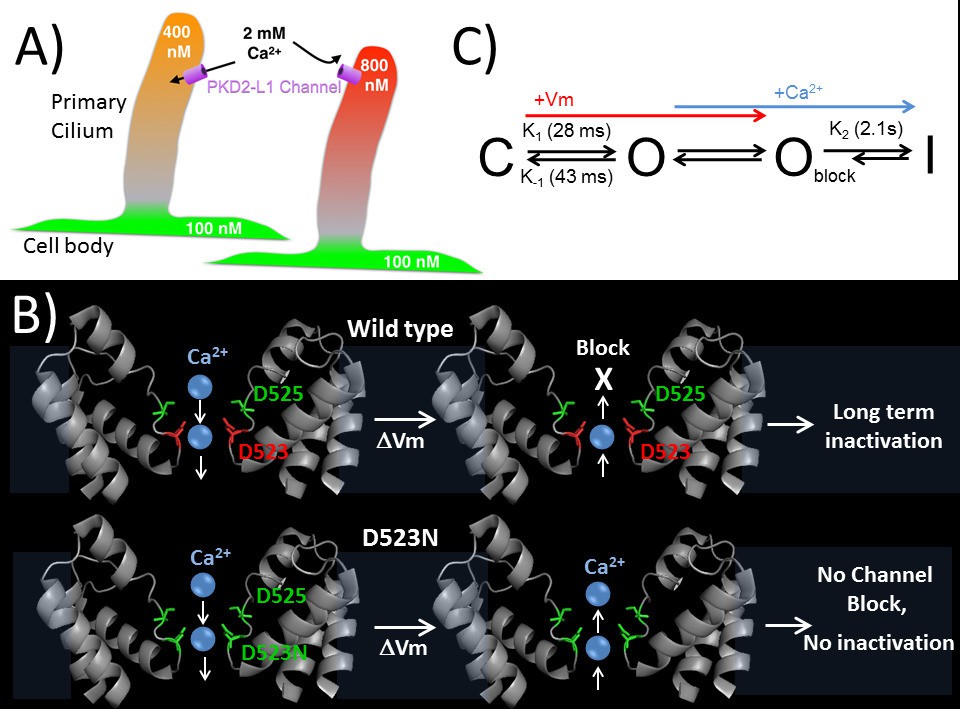
Proposed kinetic scheme of PKD2-L1 channel states and a hypothetical model of Ca2+ coordination sites in the selectivity filter.
(A) Calcium clamp of restricted spaces, such as primary cilia, by PKD2-L1. Resting [Ca2+] ≅ 500–700 nM in primary cilia. PKD2-L1 channels in the cilia membrane are potentiated before inactivation by [Ca2+] < ~500 nM, but simply inactivated at [Ca2+] > ~700 nM. (B) Model of Wt and D523N filters with proposed Ca2+ movement in response to membrane potential. The PKD2-L1 low affinity Ca2+ (D525) and high affinity (D523) binding sites are colored yellow and red, respectively, corresponding to residues N921 and D918 in the TRPA1 structure (PDB: 3J9P) as a substitute for the undetermined PKD2-L1 structure. (C) Proposed four channel state scheme C = closed; O = open; Oblock = open channels blocked by outwardly moving Ca2+ and I = inactivated (long-term). Corresponding rate constants (K) are indicated between the three channel states (K1 = opening, K-1 = closure, K2 = inactivation). The colored arrows indicate the direction of channel state stimulus by either membrane depolarization (+Vm) or outwardly moving calcium ions (Ca2+). The recovery from calcium-dependent inactivation is shown as a shortened arrow since inactivation is irreversible on the time scale of the experiments (<20 min).
Author Response Image 1
Download links
A two-part list of links to download the article, or parts of the article, in various formats.
Downloads (link to download the article as PDF)
Open citations (links to open the citations from this article in various online reference manager services)
Cite this article (links to download the citations from this article in formats compatible with various reference manager tools)
Atypical calcium regulation of the PKD2-L1 polycystin ion channel
eLife 5:e13413.
https://doi.org/10.7554/eLife.13413


