Avoidance of stochastic RNA interactions can be harnessed to control protein expression levels in bacteria and archaea
- University of Canterbury, New Zealand
- University of Melbourne, Australia
Figures
Figure 1 with 2 supplements
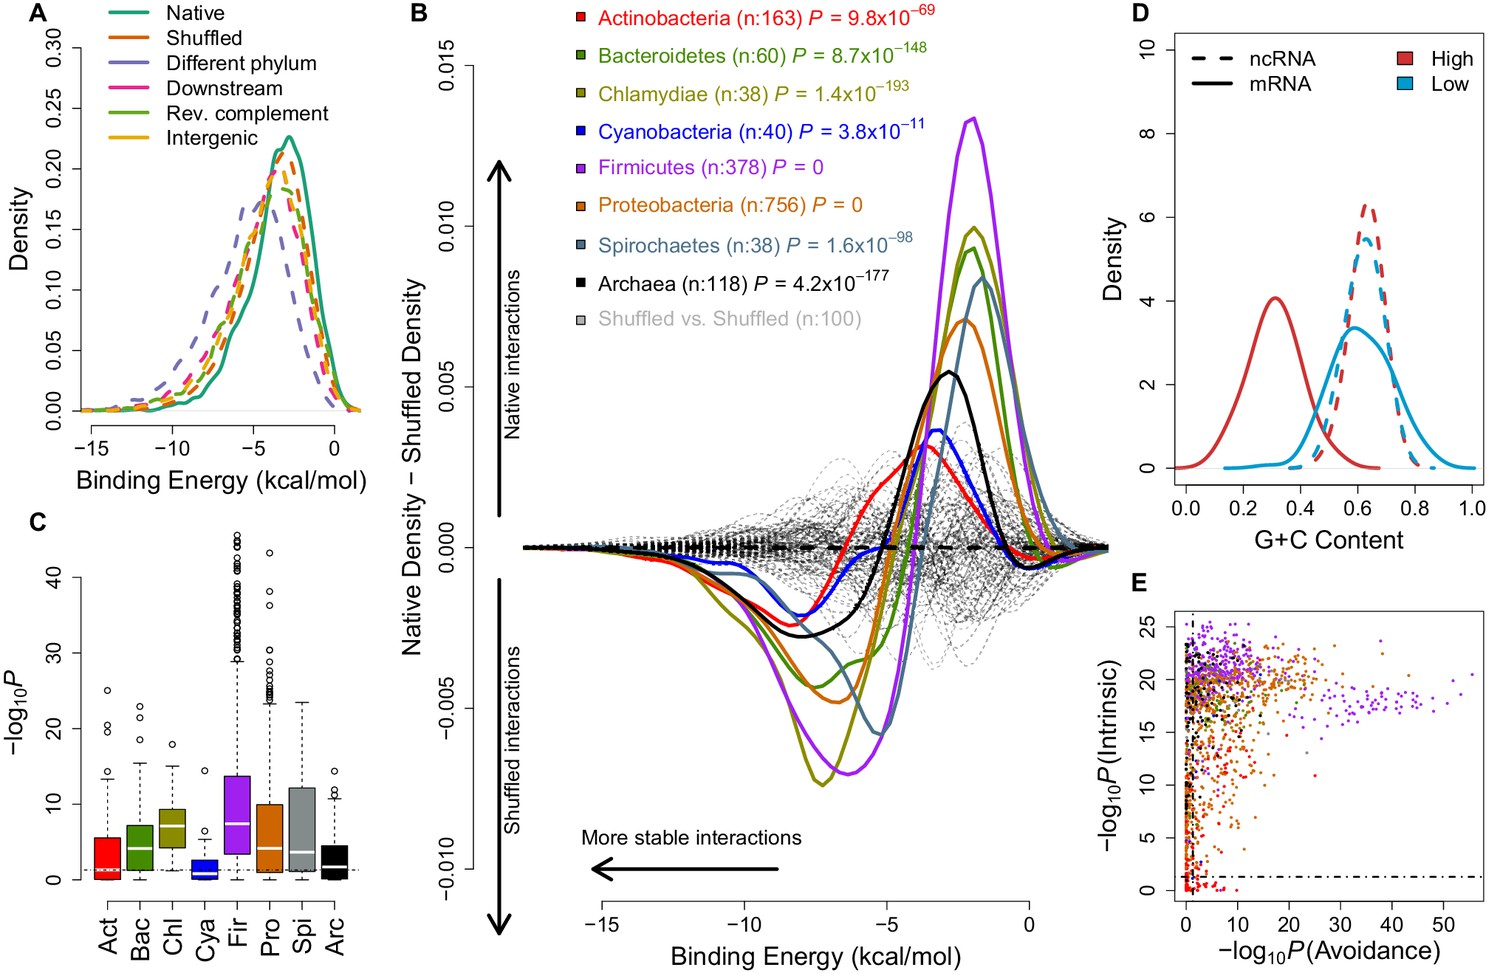
mRNA:ncRNA avoidance is a conserved feature of bacteria and archaea.
(A) Native core mRNA:ncRNA binding energies (green line; mean = −3.21 kcal/mol) are significantly higher than all mRNA negative control binding energies (dashed lines; mean binding energies are -3.62, -5.21, -4.13, -3.86 & -3.92 kcal/mol respectively) in pairwise comparisons (p<2.2 × 10⁻¹⁶ for all pairs, one-tailed Mann-Whitney U test) for Streptococcus suis RNAs. (B) The difference between the density distributions of native mRNA:ncRNA binding energies and dinucleotide preserved shuffled mRNA:ncRNA controls as a function of binding energy for different taxonomic phyla. Each coloured curve illustrates the degree of extrinsic avoidance for different bacterial phyla or the archaea. Positive differences indicate an excess in native binding for that energy value, negative differences indicate an excess of interactions in the shuffled controls. The dashed black line shows the expected result if no difference exists between these distributions and the dashed grey lines show empirical differences for shuffled vs shuffled densities from 100 randomly selected bacterial strains. (C) This box and whisker plot shows −log10(P) distributions for each phylum and the archaea, the p-values are derived from a one-tailed Mann-Whitney U test for each genome of native mRNA:ncRNA versus shuffled mRNA:ncRNA binding energies. The black dashed line indicates the significance threshold (p<0.05). (D) A high intrinsic avoidance strain (Thermodesulfobacterium sp. OPB45) shows a clear separation between the G+C distribution of mRNAs and ncRNAs (p=9.2 × 10⁻²⁵, two-tailed Mann-Whitney U test), and a low intrinsic avoidance strain (Mycobacterium sp. JDM601) has no G+C difference between mRNAs and ncRNAs (p=0.54, two-tailed Mann-Whitney U test). (E) The x-axis shows −log10(P) for our test of extrinsic avoidance using binding energy estimates for both native and shuffled controls, while the y-axis shows −log10(P) for our intrinsic test of avoidance based upon the difference in G+C contents of ncRNAs and mRNAs. Two perpendicular dashed black lines show the threshold of significance for both avoidance metrics. 97% of bacteria and archaea are significant for at least one of these tests of avoidance.
Figure 1—figure supplement 1
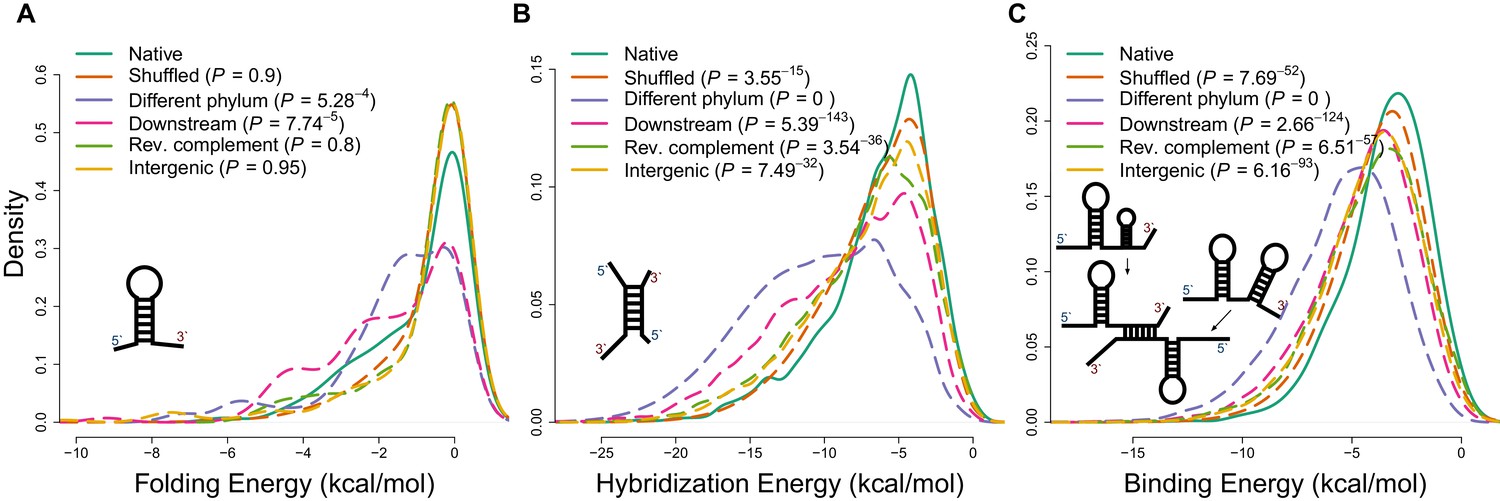
Applying different energy models of intramolecular and intermolecular interactions for native sequences and various negative controls.
(A) The distributions of internal secondary structure (intramolecular) minimum free energies (MFEs) for 5 ends of mRNA sequences, estimated using RNAfold from the Vienna package (Lorenz et al., 2011). (B) The distributions of hybridization MFEs between core mRNAs and ncRNAs, estimated using the RNAduplex algorithm from the Vienna package (Lorenz et al., 2011). (C) The distributions of binding MFEs between core mRNAs and ncRNAs, estimated using the RNAup algorithm (Lorenz et al., 2011). The RNAup algorithm minimizes the sum of energies necessary to open binding sites on two RNA molecules and the hybridization energy (Lorenz et al., 2011). This method has been shown to be the most accurate general approach for sequence-based RNA interaction prediction (Pain et al., 2015).
Figure 1—figure supplement 2
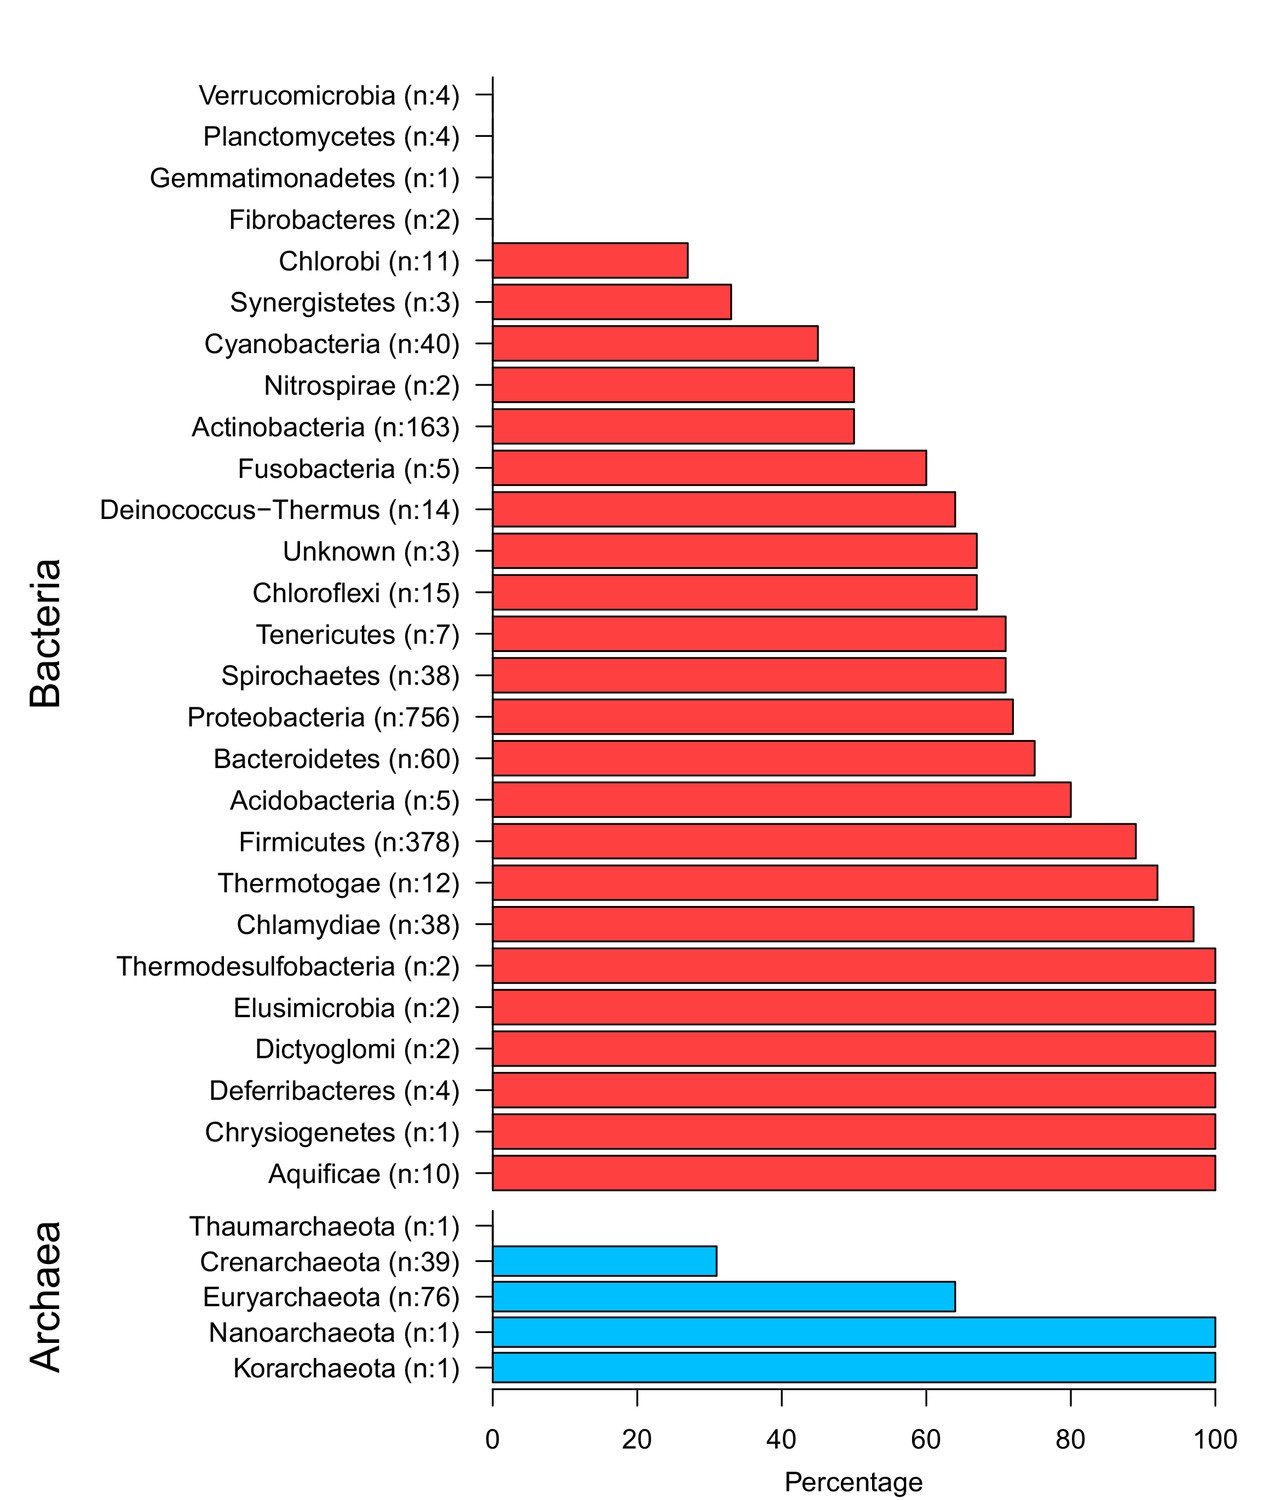
The top and the bottom panels show bacterial phyla and archaeal phyla respectively.
Numbers in brackets show the total members and the x-axis displays the percentage of extrinsic avoidance conservation in associated phylum. The archaeal and bacterial phyla with fewer than 20 publicly available sequenced genomes were excluded from further analysis due to concerns about sample size sufficiency.
Figure 2 with 5 supplements
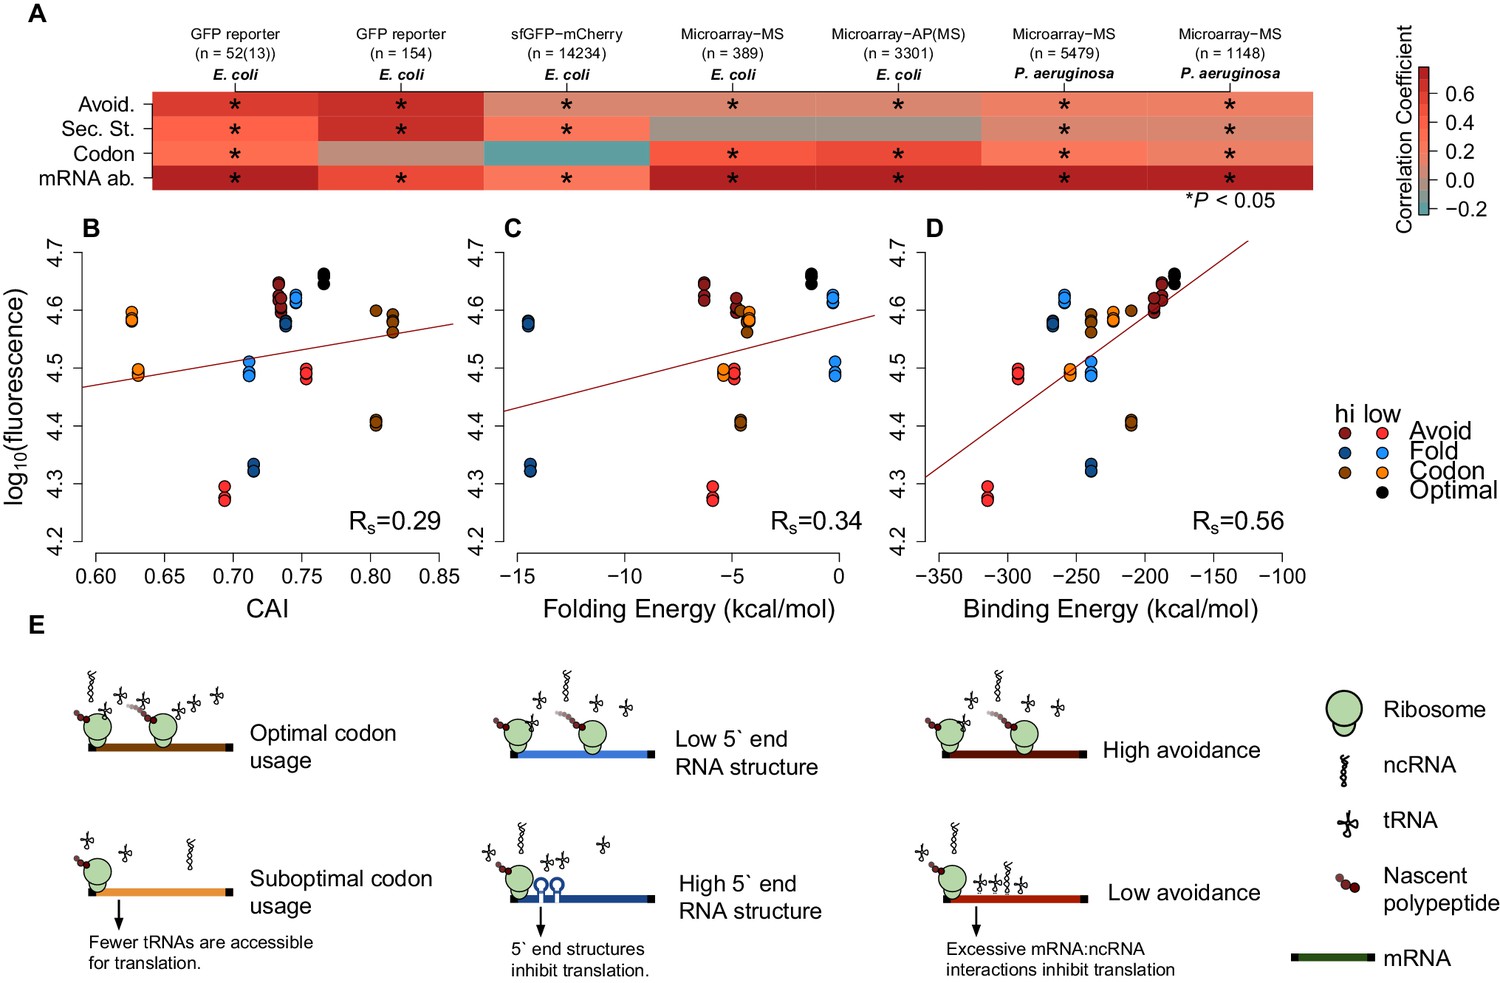
mRNA attributes have different impacts on protein abundance.
(A) This heatmap summarizes the effect sizes of four mRNA attributes (avoidance of mRNA:ncRNA interaction, 5´ end secondary structure, codon bias and mRNA abundance) on protein expression as Spearman’s correlation coefficients, which are represented in gradient colors, while a starred block shows if the associated correlation is significant (p<0.05). (B) GFP expression correlates with optimized codon selection, measured by CAI (Rs = 0.29, p=0.016). (C) GFP expression correlates with 5 end secondary structure of mRNAs, measured by 5’ end intramolecular folding energy (Rs = 0.34, p=0.006). (D) GFP expression correlates with avoidance, measured by mRNA:ncRNA binding energy (Rs = 0.56, p=6.9 × 10⁻⁶). (E) Each cartoon illustrates the corresponding hypothesis; (1) optimal codon distribution (corresponding tRNAs are available for translation), (2) low 5´ end RNA structure (high folding energy of 5´ end) and (3) avoidance (fewer crosstalk interactions) lead to faster translation.
Figure 2—figure supplement 1

GFP mRNA constructs have an unbiased design that produces different protein expressions.
An unrooted maximum likelihood tree of the extreme GFP mRNAs on the left panel illustrates the low similarity between our GFP mRNA constructs. The distances were calculated using HKY85 nucleotide substitution model. On the right panel, the y-axis shows relative fluorescence units (RFU) of GFP expression from synonymously sampled mRNAs with different characteristics, these are labelled on the figure legend. Optimal and high avoidance GFP mRNAs produce the highest expression while low avoidance GFP mRNAs have the lowest expression (p=1.35 × 10⁻⁵, Kruskal-Wallis test).
Figure 2—figure supplement 2
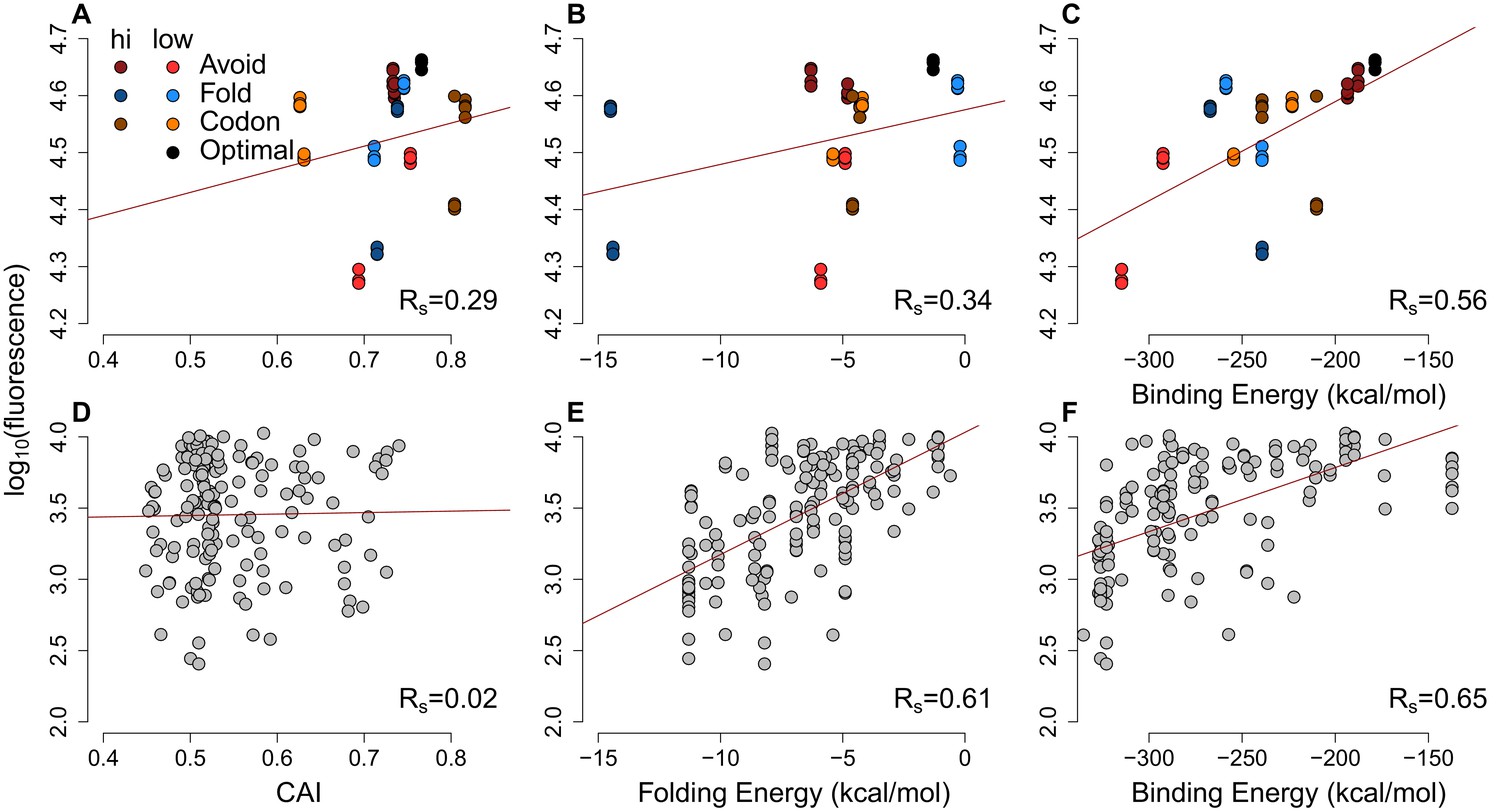
The scatter-plots of protein abundances (as log-fluorescences) summarize the effect of general factors for extreme GFP and previously published GFP datasets.
(A–C) Each GFP mRNA was sampled from the extremes of one of three metrics presumed to impact expression mRNA:ncRNA binding, 5´ end secondary structure or codon usage. Slightly darker or lighter colors display the type of extremes. Avoidance correlates with GFP expression (Rs = 0.56, p=6.9 × 10⁻⁶) more than CAI (Rs = 0.29, p=0.01) and 5´ end folding energy (Rs = 0.34, p=0.006). (D–F) Using a previously published GFP dataset (Kudla et al., 2009) the CAI does not correlate with protein abundance (Rs = 0.02, p=0.4), while 5´ end folding energy (Rs = 0.61, p=5.7 × 10⁻¹⁸) and avoidance (Rs = 0.65, p=1.6 × 10⁻²⁰) influence GFP expression.
Figure 2—figure supplement 3
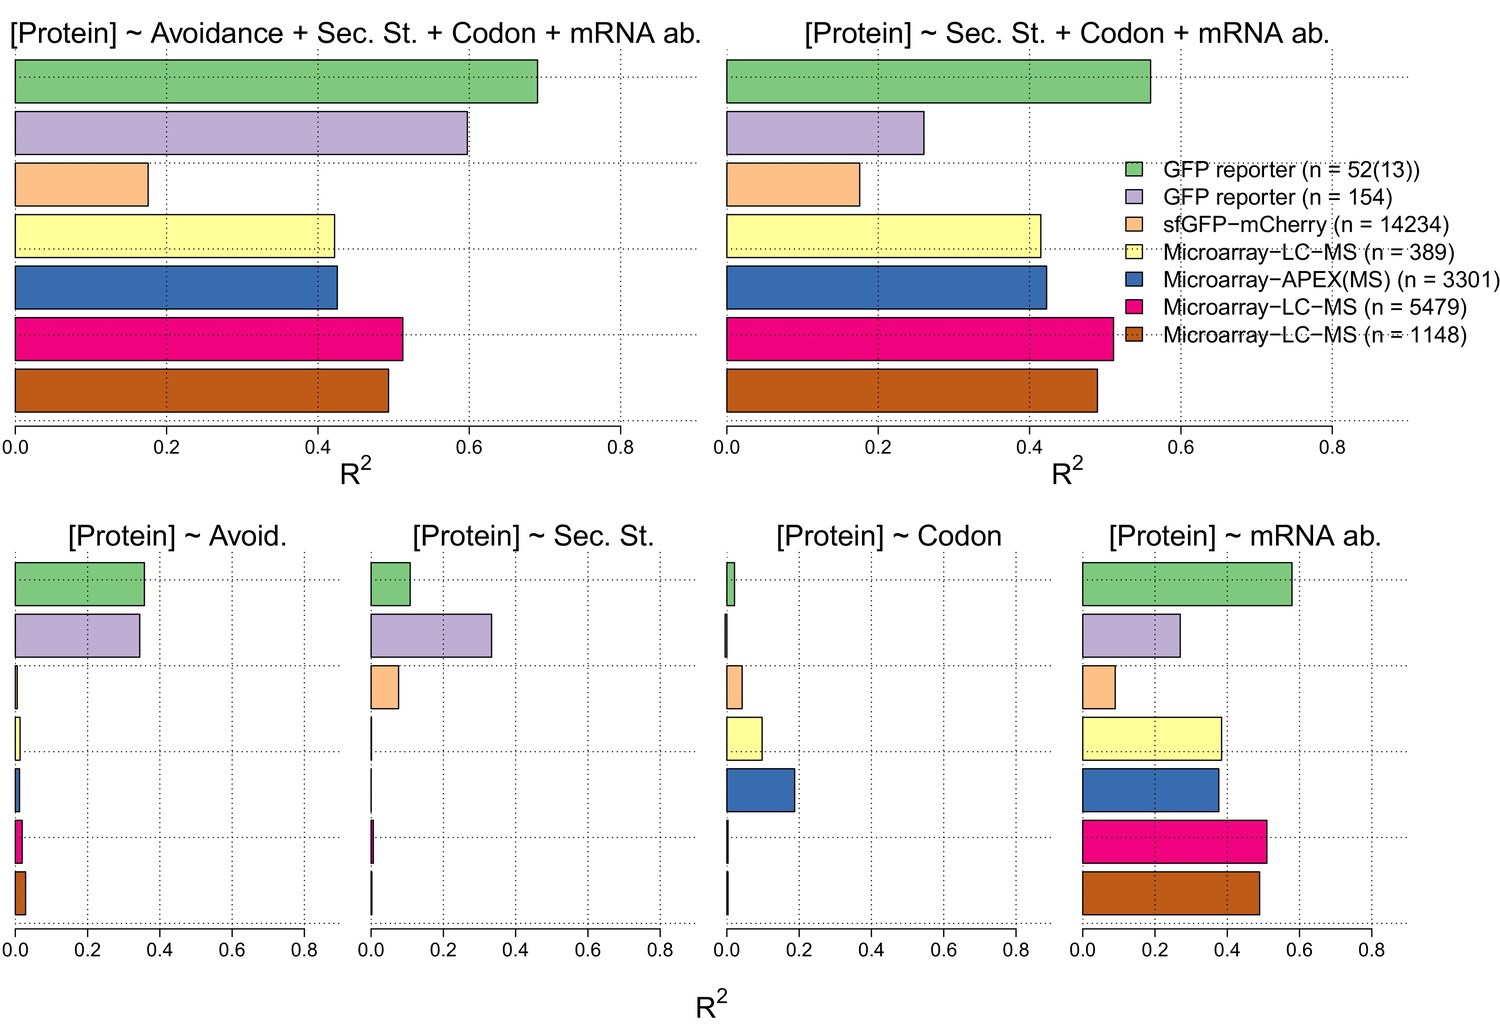
In the lower four panels we show the R2 values for linear regression models between measures of each of avoidance, internal secondary structure, codon usage and mRNA levels for each of seven independent protein and mRNA expression datasets Supplementary file 5).
We have also computed R2 values for multiple linear regression models of the sum of the four measures (right) and the sum less the avoidance measure (right).
Figure 2—figure supplement 4

An outlier analysis of E. coli protein-per-mRNA ratios and avoidance, codon usage and internal mRNA secondary structure statistics.
(A) In this plot a distribution of protein-per-mRNA ratio of native E. coli genes (n = 389) (Laurent et al., 2010) is seen. We selected the top ten most and least productive genes which lie on the extreme ends of the plot (purple and green bars) (B) The y-axis shows the z-transformed scores of native mRNAs: CAIs, folding energies and binding energies. The expected background distribution (the white null bar in the middle) has a mean of 0 and standard deviation of 1, while a starred block shows whether the associated z-scores are significantly higher (or lower) than this background (p<0.05). This demonstrates RNA avoidance is the only factor that explains protein-per-mRNA ratio difference of the most and the least efficient native E. coli mRNAs.
Figure 2—figure supplement 5
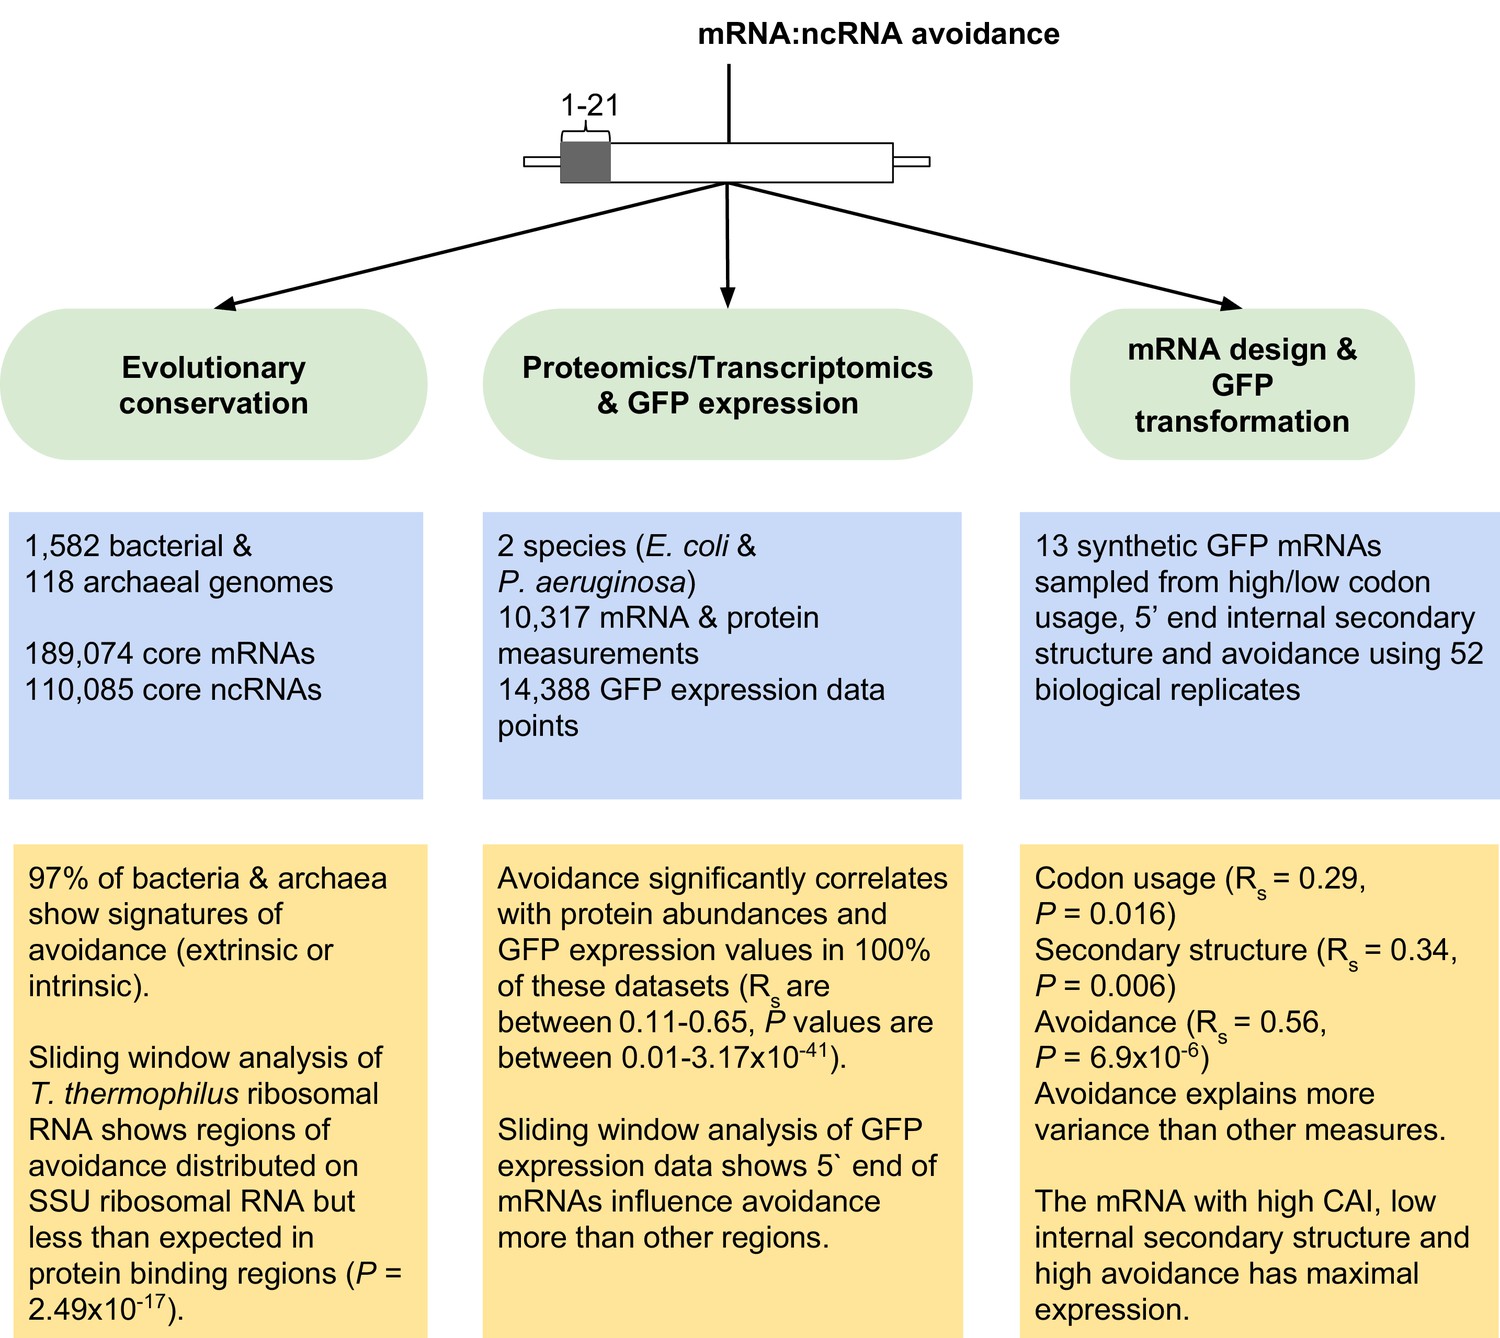
Overview of mRNA:ncRNA avoidance analysis and results.
Our tests for avoidance can be divided into three main parts; (1) evolutionary conservation analyses to detect energy shifts in bacterial and archaeal genomes relative to dinucleotide shuffled negative controls, (2) analyses of proteomics, transcriptomics and GFP transformation data to predict the effect size of avoidance on protein expression and lastly (3) the application of avoidance hypothesis to design synonymous mRNAs that either produce high or low levels of corresponding protein.
Figure 3 with 3 supplements
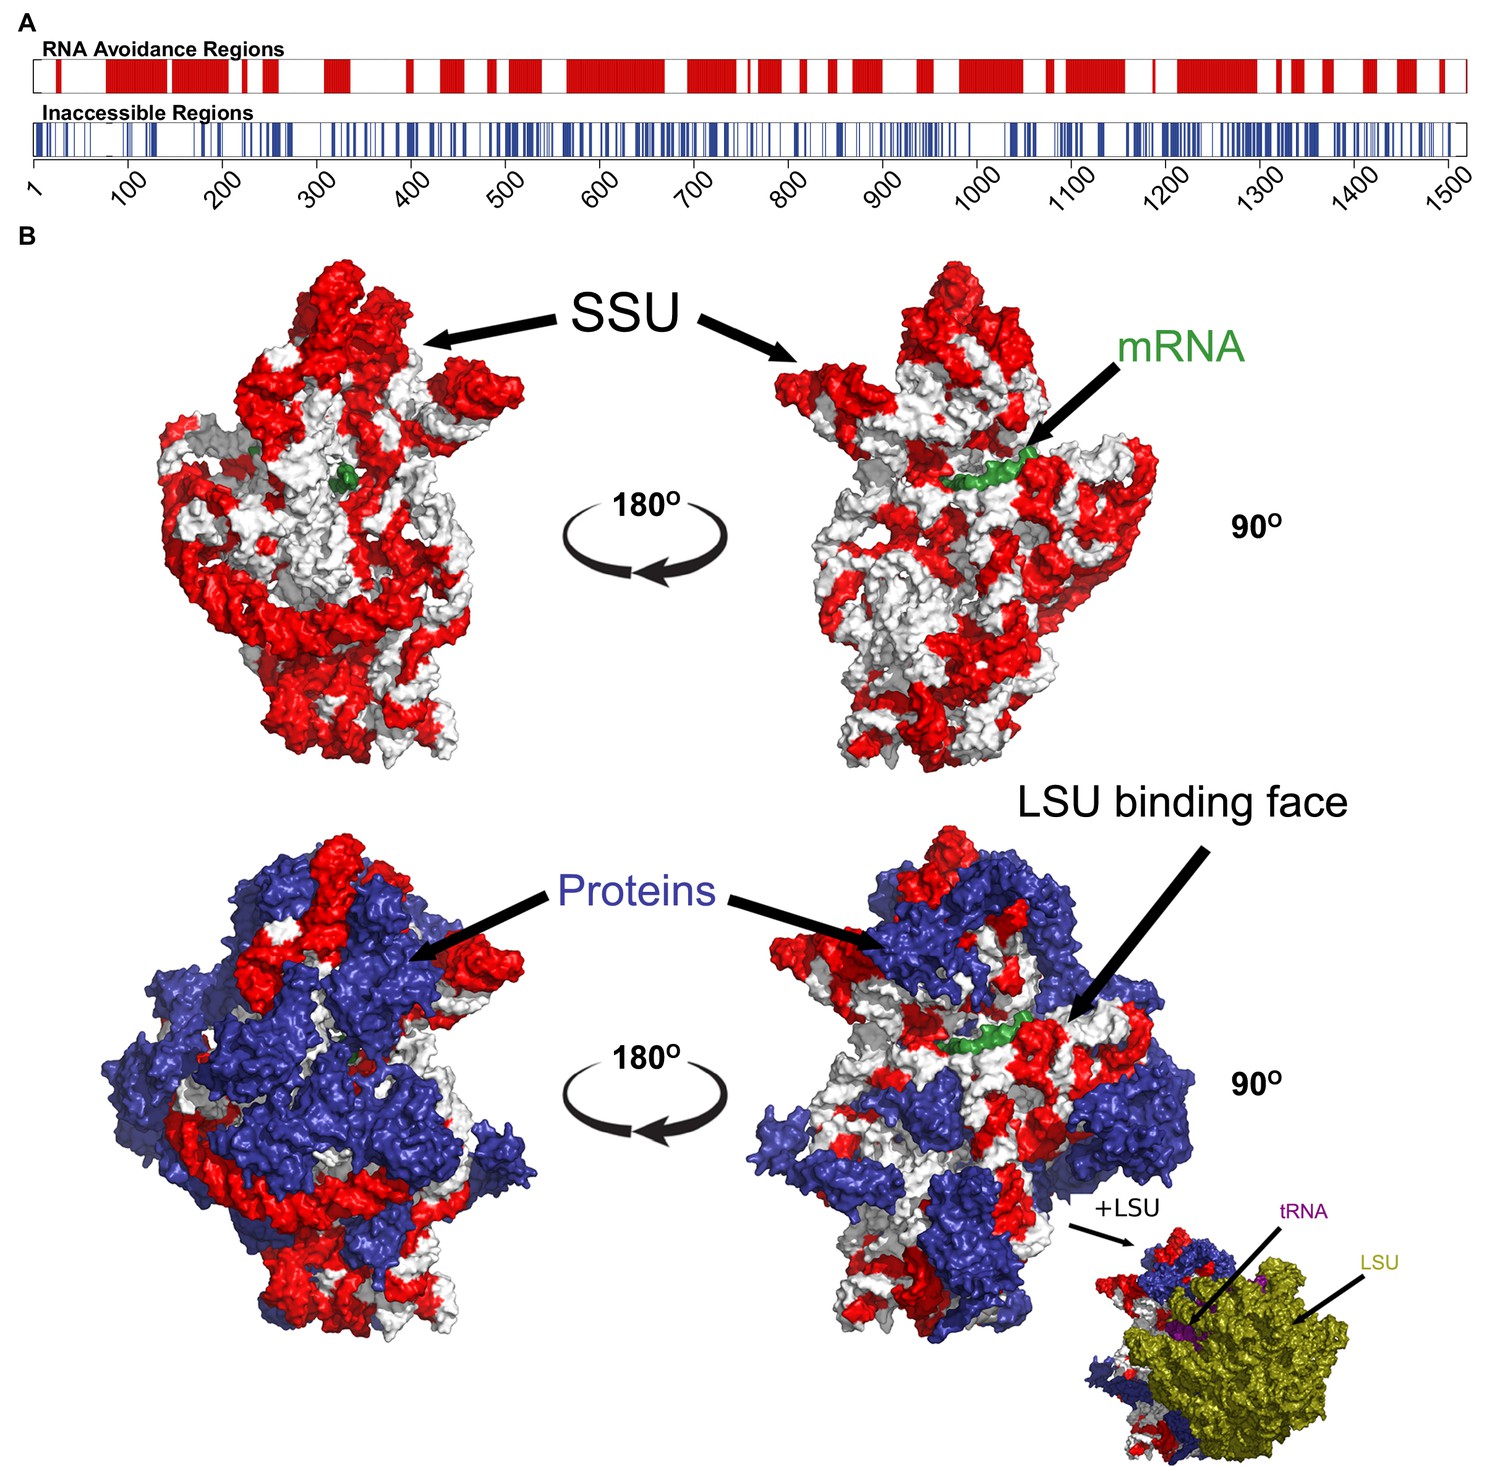
The most under-represented mRNA:rRNA interactions correspond to exterior regions of the ribosome.
(A) In the upper bar, the regions of the T. thermophilus SSU rRNA that are under-represented in stable interactions with mRNAs (p<0.05) are highlighted in red. In the lower bar, the inaccessible residues (<3.4 Angstroms from other nucleotides or amino acids in the PDB structure 4WZO). (B) The 3 dimensional structure of the T. thermophilus ribosome includes 5S, SSU and LSU rRNA, 48 ribosomal proteins, 4 tRNA and a bound mRNA (PDB ID: 4WZO) (Rozov et al., 2015). We have highlighted the most avoided regions of the SSU rRNA in red (based upon the fewest stable interactions with T. thermophilus mRNAs (p<0.05). Two different orientations are shown on the left and right, the upper structure shows just the SSU rRNA and mRNA structures, the lower includes the ribosomal proteins (coloured blue). Bottom right, a view of the ribosome that also includes the LSU rRNA (green) is also shown. There is a significant correspondence between the accessibility of a region of SSU rRNA and the degree to which it is avoided (p=2.5 × 10⁻¹⁷, Fisher’s exact test).
Figure 3—figure supplement 1

Avoidance pattern and its correlation with protein expression vary on mRNAs.
(A) A sliding window (length 21, step size 1) analysis based on previously published GFP expression dataset (Kudla et al., 2009) shows the significance of the correlation between avoidance and their corresponding fluorescence values for each position along with the coding region. Darker red regions show more significant positions (with higher −log10(P) values). (B) This analysis proves that the binding energy of first 21 nt region influences protein expression more than any other downstream region and corresponding Spearman’s correlation coefficients for selected sliding window start positions are seen at bottomright. It also justifies our selection of 5´ end coding region for avoidance.
Figure 3—figure supplement 2

Comparison of different regions for evolutionary conservation analyses.
(A) This box and whisker plot (similar to Figure 1C except archaea) shows −log10(P) distributions for each bacterial phylum. The black dashed line indicates the significance threshold (p<0.05). We used 5´ end CDS regions as designated interaction location. (B) In this plot, 5´ end UTR regions (90 nucleotides upstream to 21 nucleotides downstream) are used as designated interaction regions. It seems both regions have similar avoidance conservation, which proves avoidance is not limited to 5´ ends of the coding region.
Figure 3—figure supplement 3
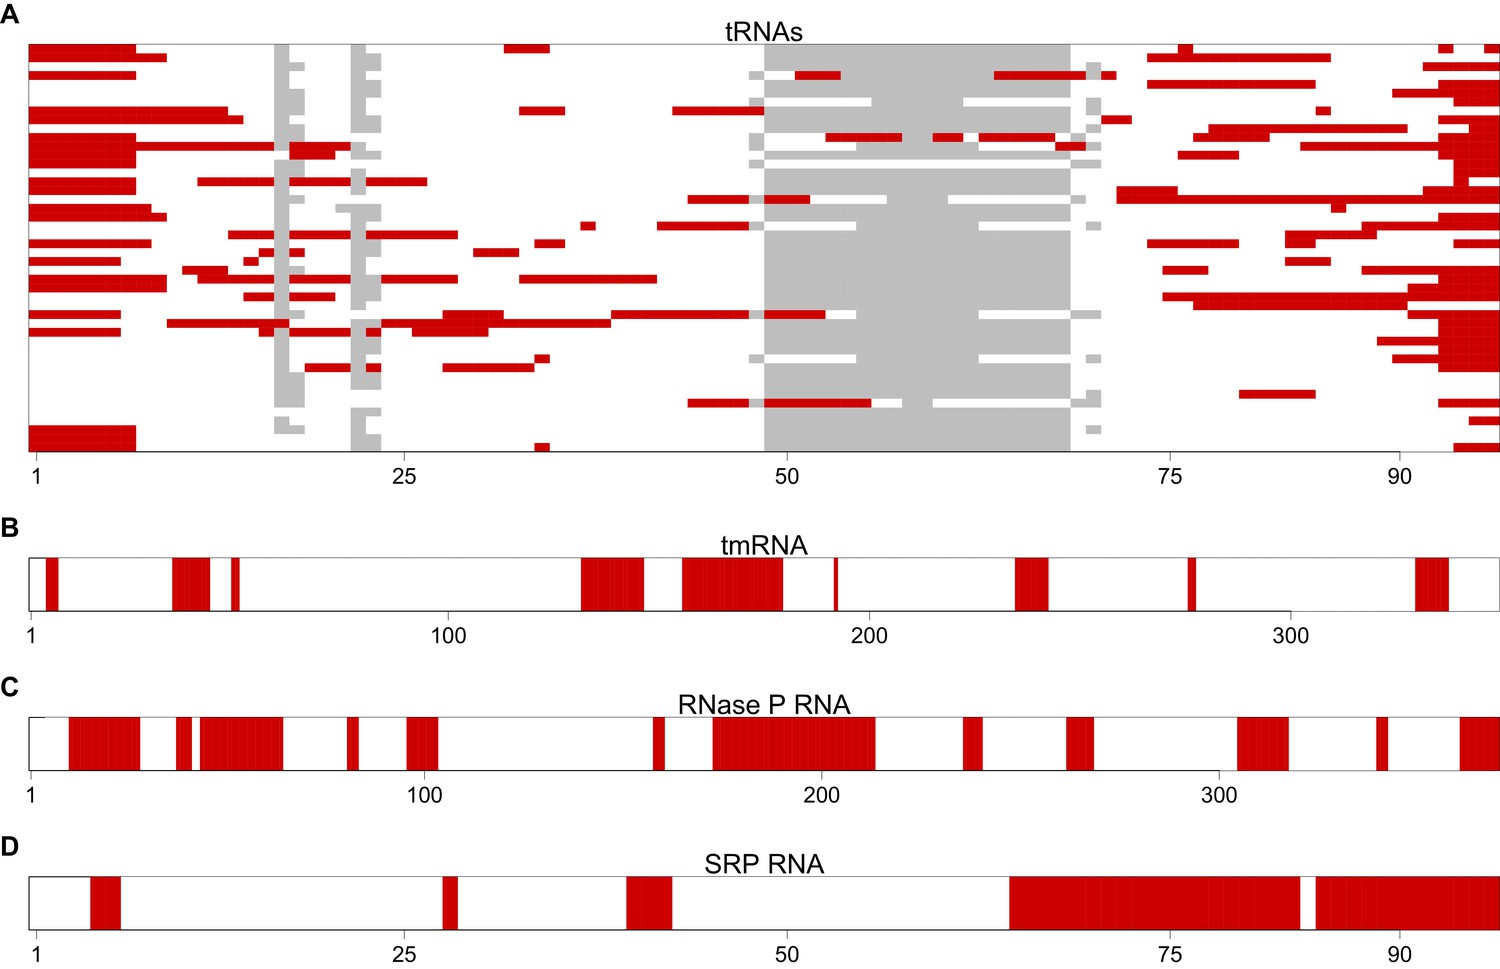
The most avoided regions of selected T. thermophilus non-coding RNAs.
(A) A graphical view for an alignment of the T. thermophilus tRNAs (n = 46). Regions that have significantly (p<0.001, Mann-Whitney U test) fewer than expected interactions with T. thermophilus mRNAs are highlighted in red. These regions are therefore the most avoided regions by the host’s mRNAs. The grey blocks show gaps in the alignment. (B–D) A graphical view of the most avoided regions is illustrated for tmRNA, RNase P and SRP RNA respectively.
Figure 4
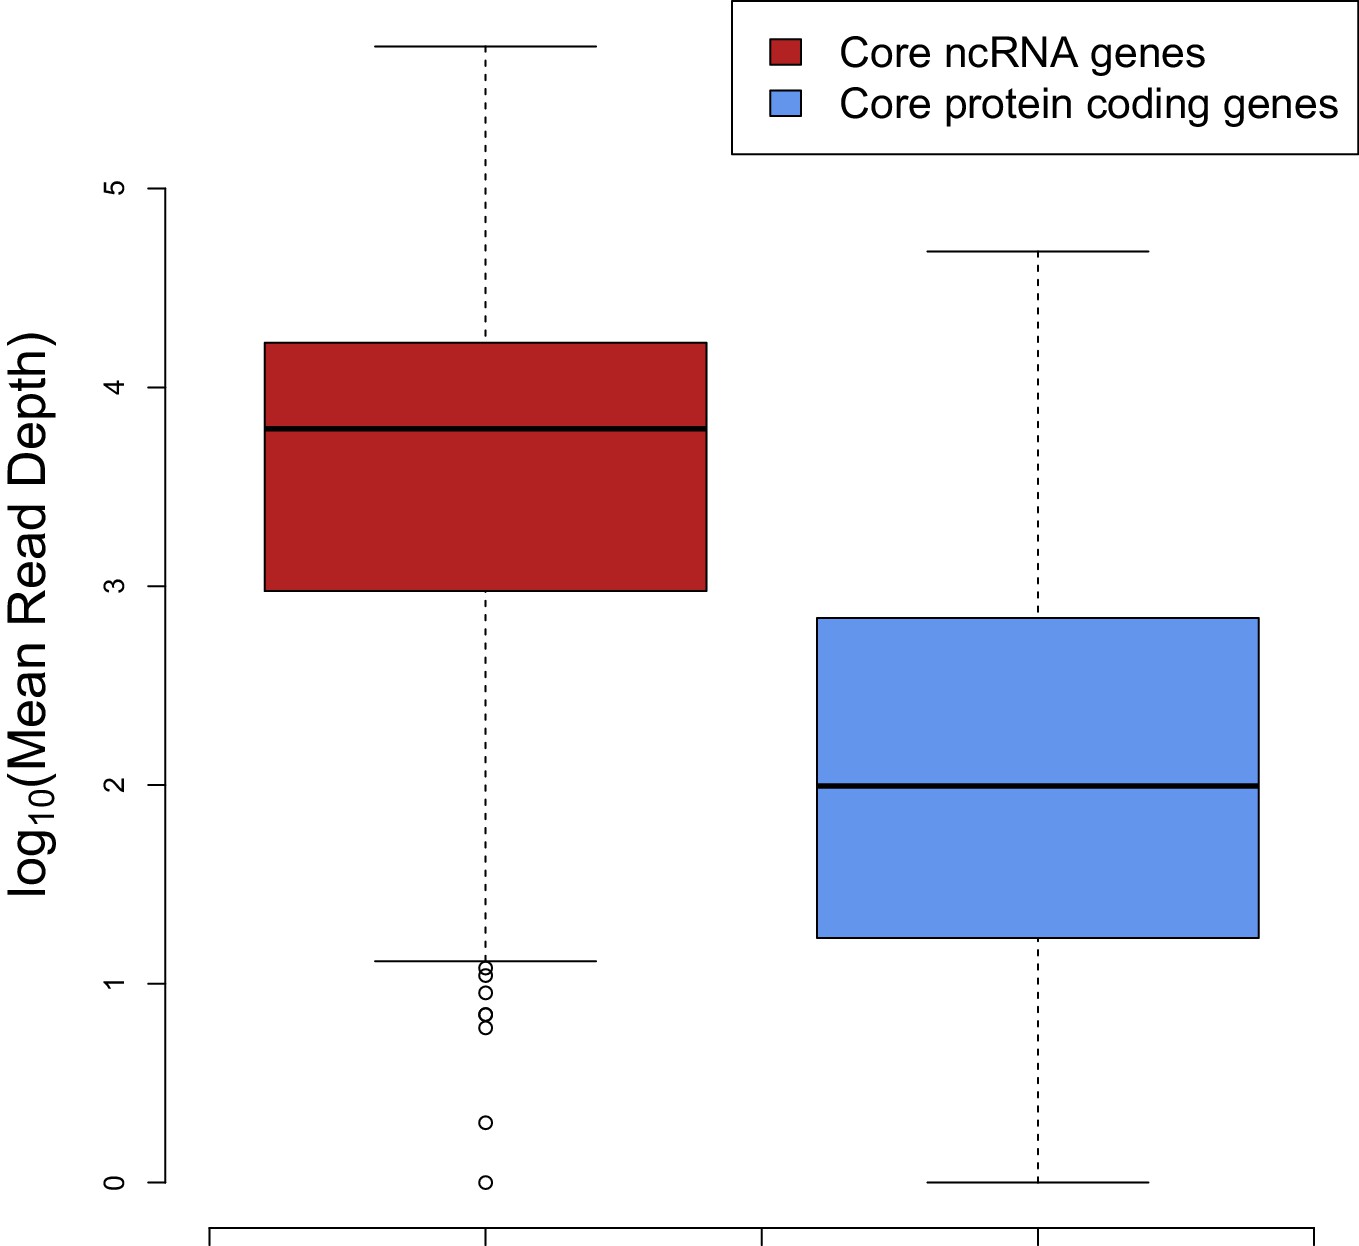
The median expression of core ncRNA genes (n = 325 data points) in prokaryotic genomes is nearly two orders of magnitude greater than core mRNAs (n = 8086 data points) which proves that ncRNAs constitute most of the cellular RNAs.
To create this plot, we used mean mapped reads per gene length (i.e. mean read depth per position) of each core gene. The expression data are compiled from 5 archaeal and 37 bacterial strains from a previous study (Lindgreen et al., 2014).
Additional files
-
Supplementary file 1
The levels of extrinsic and intrinsic avoidance for each publicly available bacterial and archaeal genome sequence.
Column A contains the species and strain names; Column B contains the ENA accession; Column C contains the phylum name; Column D contains the extrinsic avoidance p-value (i.e. the difference between RNAup Gibbs’ free-energy of interaction distributions between native and randomized sequences, one-tailed Mann-Whitney U test); Column E contains the genomic G+C content; Column F contains the genome size in nucleotides; Column G contains the average G+C content of the first 21 nucleotides of 114 ‘core’ (highly conserved) mRNAs; Column F contains the average G+C content of six core highly expressed ncRNAs (tRNA, rRNA, RNase P RNA, SRP RNA, tmRNA and 6S RNA); Column F contains the intrinsic avoidance p-value (i.e. the difference in G+C content between core mRNAs and ncRNAs, two-tailed Mann- Whitney U test). Table A contains the data for bacterial species, Table B contains the data for archaeal species.
- https://doi.org/10.7554/eLife.13479.017
-
Supplementary file 2
Data for the extreme GFP transformations, including fluorescence levels and RT-qPCR analyses.
Table A: Column A contains a unique identifier for each mRNA sequence; Column B contains a unique numeric code for each mRNA sequence; Column C contains a colour used for visualizing the datasets; Column D contains the sum of RNAup Gibbs’ free-energy of interactions between nucleotides 1 to 21 of the GFP mRNA and the core ncRNAs of E. coli BL21(DE3); Column E contains the RNAfold Gibbs’ free-energy of folding for nucleotides 1 to 37; Column F contains the CAI for each GFP mRNA, using codon distribution patterns acquired from the core protein coding genes of E. coli BL21(DE3); Column G contains the GFP flourescence values (four replicates for each mRNA); Column H contains ΔΔCT values from RT-qPCR results, these can be used to quantify mRNA concentrations; Column I contains mean GFP fluorescence values; Column J contains mRNA abundances; Table B: contains the oligonucleotide sequences used to gather RT-qPCR results.
- https://doi.org/10.7554/eLife.13479.018
-
Supplementary file 3
Data corresponding to the heatmap in Figure 2A.
Each row corresponds to a different dataset containing protein and mRNA expression levels. Column A contains a brief summary of the type of dataset; Column B contains Spearman correlation coefficients (and corresponding p-values) between avoidance measurements and protein abundance; Column C contains Spearman correlation coefficients (and corresponding p-values) between mRNA secondary structure measurements measurements and protein abundance; Column D contains Spearman correlation coefficients (and corresponding p-values) between codon adaptation index measurements and protein abundance; Column E contains Spearman correlation coefficients (and corresponding p-values) between mRNA and protein abundances; Column F contains the species names of the organism each dataset was collected in; Column G contains the size of the dataset; Column H contains a reference to the manuscript each dataset was first published in; Column H contains a link to the Pubmed entry for each manuscript;
- https://doi.org/10.7554/eLife.13479.019
-
Supplementary file 4
Data corresponding to Figure 3.
<3.4 For each position in the SSU rRNA sequence provided in PDB structure 4WZO, in Column A the accessibility of the region is evaluated (i.e. ’1’ if the residue is Angstroms from another nucleotide or aminoacid residue and ’0’ otherwise). Column B contains local SSU:mRNA avoidance p-values corresponding to differences in RNAup Gibbs’ free-energy of interaction distributions between native and randomized sequences using Mann-Whitney U tests.
- https://doi.org/10.7554/eLife.13479.020
-
Supplementary file 5
This table contains the results of R2 values for linear regression models between protein levels and the different predictors of expression level that are illustrated in Figure 2—figure supplement 3.
Column A contains the model (e.g. ”Protein abundance Avoidance + Folding Energy + CAI + mRNA abundance” corresponds to the relationship between protein abundance, mRNA avoidance, mRNA folding, codon usage and mRNA abundance; Column B contains the R2 value for the relationship; Column C contains the reference the corresponding protein and mRNA data came from; Column D contains the type of data and the size of the dataset;
- https://doi.org/10.7554/eLife.13479.021
Download links
A two-part list of links to download the article, or parts of the article, in various formats.
Downloads (link to download the article as PDF)
Open citations (links to open the citations from this article in various online reference manager services)
Cite this article (links to download the citations from this article in formats compatible with various reference manager tools)
Avoidance of stochastic RNA interactions can be harnessed to control protein expression levels in bacteria and archaea
eLife 5:e13479.
https://doi.org/10.7554/eLife.13479


