Histone H2B ubiquitylation represses gametogenesis by opposing RSC-dependent chromatin remodeling at the ste11 master regulator locus
- University of Namur, Belgium
- Instituto de Biología Funcional y Genómica, Spain
Figures
Figure 1 with 2 supplements
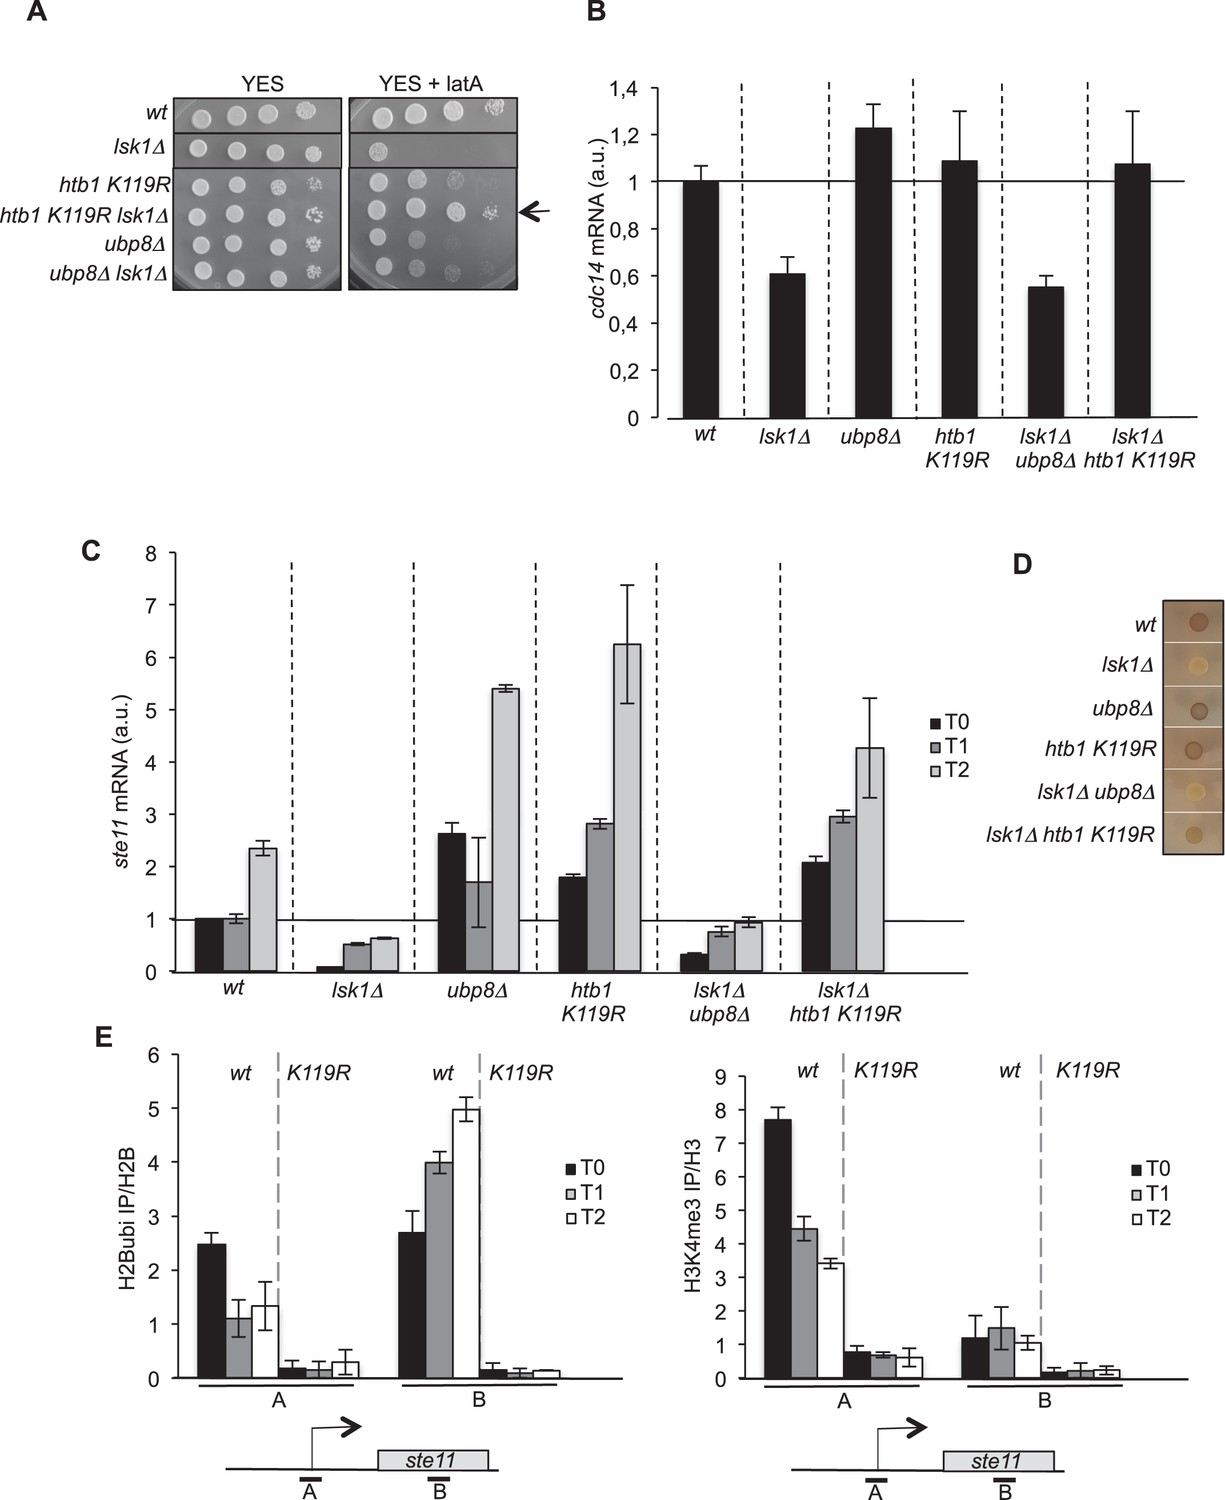
The abolition of histone H2B ubiquitylation suppresses the requirement of lsk1.
(A) Spot dilution assay of indicated strains grown 2 days at 32°C on rich medium in the presence or absence of LatA (0.5 μM). The arrow indicates the suppression of lsk1 growth defect by the htb1 KR mutant. (B) Relative quantification of the cdc14 mRNA determined by quantitative RT-Q-PCR in the indicated strains. a.u.: arbitrary units. Each column represents the averaged value ± SEM (n = 3). (C) Relative quantification of the ste11 mRNA determined by quantitative RT-Q-PCR in the indicated strains during vegetative growth (T0) and nitrogen starvation at the indicated time points (hours). a.u.: arbitrary units. Each column represents the averaged value ± SEM (n = 3). (D) The indicated strains were plated for 48 hr on mating medium (malt extract) before iodine staining to reveal sterility. (E) Left panel. The wt and htb1 K119R strains were starved for nitrogen at the indicated time points (hours). The occupancy of ubiquitylated H2B at the indicated locations (A, B) was determined by ChIP using the anti-H2Bubi normalized against unmodified H2B. Right panel. The wt and htb1 K119R strains were starved for nitrogen at the indicated time points (hours). The occupancy of ubiquitylated H2B at the indicated locations (A, B) was determined by ChIP using the anti-H3K4me3 normalized against unmodified H3. The same chromatin sample was used for the left and right panel. Each column represents the averaged value ± SEM (n = 3)
Figure 1—figure supplement 1
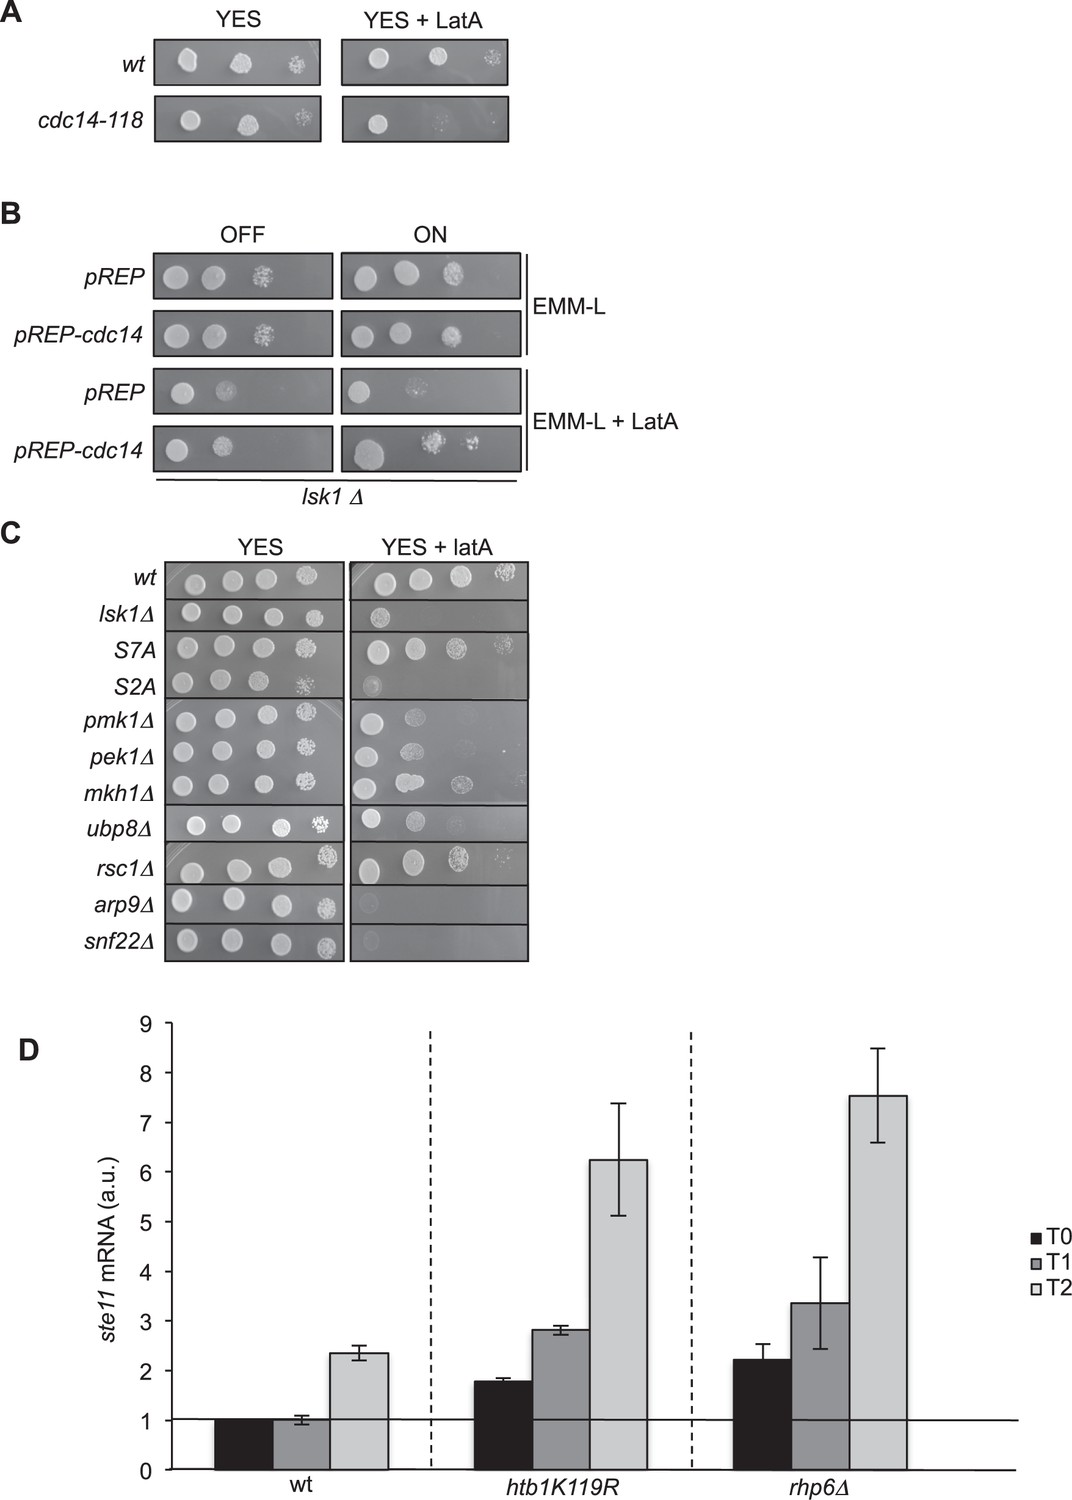
The overexpression of cdc14 rescues the LatA sensitivity of a lsk1 deleted strain.
(A) Spot dilution assay of a wild type and cdc14 ts (cdc14-118, a kind gift of V. Simanis) strains grown 2 days at 25°C on rich medium in the presence or absence of LatA (0.5 μM). Note that 25°C is the permissive temperature of the cdc14-118 allele. (B) Spot dilution assay of an lsk1 deleted strain transformed with the empty pREP vector or the same vector expressing the wild type cdc14 gene (a gift of V. Simanis) from the thiamine repressible nmt1 promoter. The strains were grown 2 days on minimal media at 32°C in the presence or absence of LatA (0.5 μM). (C) Spot dilution assay of indicated strains grown 2 days at 32°C on rich medium in the presence or absence of LatA (0.5 μM). (D) Relative quantification of the ste11 mRNA determined by quantitative RT-Q-PCR in the indicated strains during vegetative growth (T0) and nitrogen starvation at the indicated time points (hours). a.u.: arbitrary units. Each column represents the averaged value ± SEM (n = 2)
Figure 1—figure supplement 2
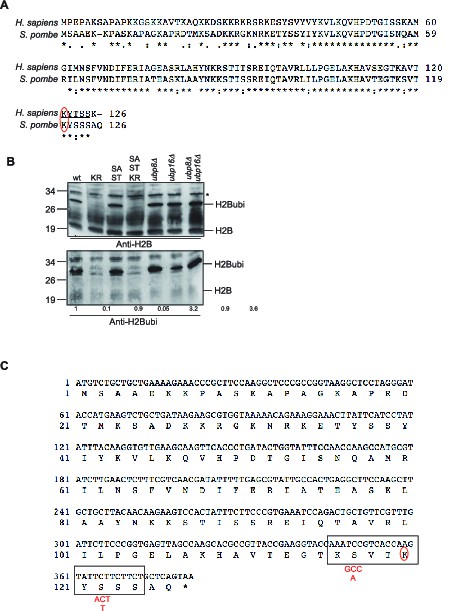
Characterization of the histone H2B mutants generated.
(A) Sequence alignment of the histone H2B gene from Human (H. sapiens) and fission yeast (S. pombe). The ubiquitylated site (K120 in Human, K119 in fission yeast) is circled in red. Note that the numbering takes into account the removal of the first methionine. (B) Western blot analysis (anti-H2B and anti-H2Bubi) of total protein extracts from the indicated strains. KR: htb1 K119R, SA-ST: htb1 S116A S121T, SA-ST-KR: htb1 S116A K119R S121T (see A) for sequence details. The * designs a non-specific band. Quantification of signal intensity was performed from scanned gels using Image J and the numbers represent the signal obtained with the anti-H2Bubi normalized on the signal obtained with the anti-H2B with the wild type set as 1. (C) DNA and protein sequences of the fission yeast htb1 gene encoding histone H2B. The epitope used to generate the antibody is framed. The S116A and S121T mutation designed to 'humanize' the fission yeast gene are indicated in red. Note that the numbering takes into account the removal of the first methionine.
Figure 2 with 1 supplement
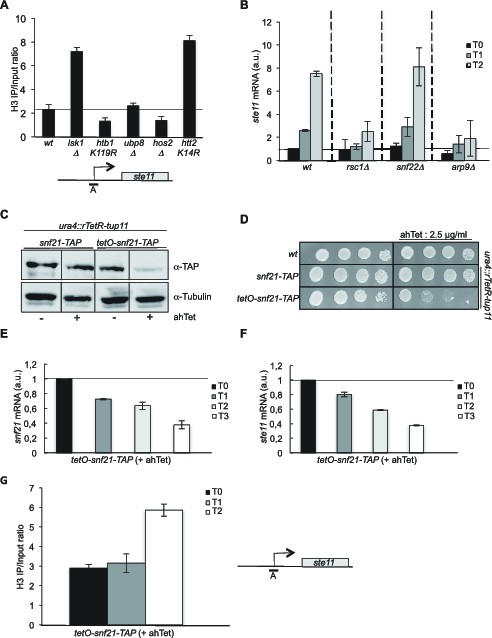
The RSC complex is required for the induction of ste11.
(A) The occupancy of histone H3 at the ste11 promoter was measured by ChIP using the indicated amplicon in the indicated strains. Each column represents the averaged value ± SEM (n = 3). (B) Relative quantification of the ste11 mRNA determined by quantitative RT-Q-PCR in the indicated strains during vegetative growth (T0) and nitrogen starvation at the indicated time points (hours). a.u.: arbitrary units. Each column represents the averaged value ± SEM (n = 3). (C) Western blot analysis (anti-TAP and anti-tubulin) of total protein extracts from the indicated strains grown 2 hr in the presence or absence of anhydrotetracycline (ahTet 2.5 μg/ml). (D) Spot dilution assay of indicated strains grown 2 days at 32°C on rich medium in the presence or absence of ahTet (2.5 μg/ml). (E) Relative quantification of the snf21 mRNA determined by quantitative RT-Q-PCR in the indicated strain grown in the presence of ahTet for three hours. Samples were taken at the indicated time (hours). a.u.: arbitrary units. Each column represents the averaged value ± SEM (n = 3). (F) Same as E, except that the ste11 mRNA was quantified. Each column represents the averaged value ± SEM (n = 3). (G) The occupancy of histone H3 at the ste11 promoter was measured by ChIP using the indicated amplicon in the tet0-snf21-TAP strain grown in the presence of ahTet for two hours. Each column represents the averaged value ± SEM (n = 3).
Figure 2—figure supplement 1
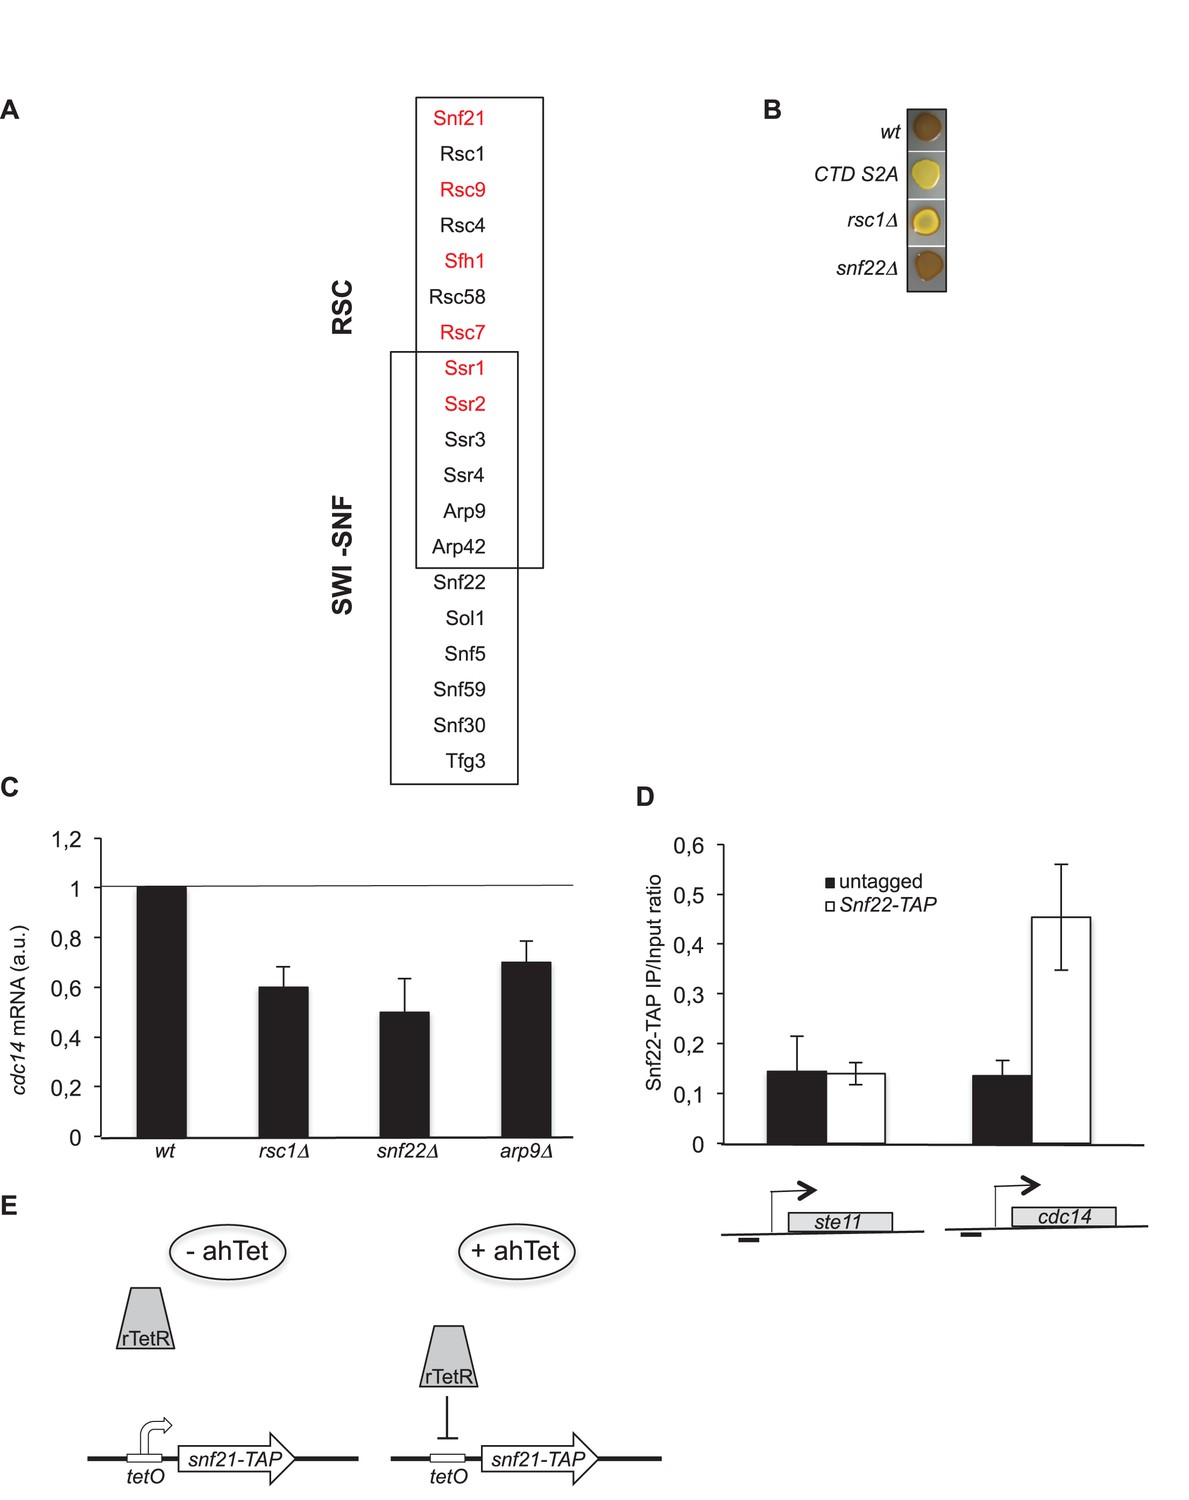
Subunits composition of the fission yeast SWI/SNF and RSC complexes - Schematic of the rTetR switch off system used.
(A) The subunit composition of the SWI/SNF and RSC chromatin remodeling complexes is indicated with the shared subunits. The red colour refers to essential subunits (Monahan et al., 2008). (B) The indicated homothallic strains were plated for 48 hr on mating medium (malt extract) before iodine staining to reveal sterility. (C) Relative quantification of the cdc14 mRNA determined by quantitative RT-Q-PCR in the indicated strains during vegetative growth. a.u.: arbitrary units. Each column represents the averaged value ± SEM (n = 2). (D) The occupancy of Snf22-TAP at the ste11 and cdc14 promoters was measured by ChIP using the indicated amplicons in the wt and Snf22-TAP strains. Each column represents the averaged value ± SEM (n = 3). (E) A TAP tag encoding sequence was integrated at the snf21 locus. The tetO operator was then integrated as described (Zilio et al., 2012), which allows rTetR repression in the presence of ahTet.
Figure 3 with 2 supplements

The RSC complex regulates nucleosomes occupancy at the ste11 promoter.
(A) The occupancy of histone H3 at the ste11 locus was measured by ChIP using the indicated amplicons (A–D) in the indicated strains. Each column represents the averaged value ± SEM (n = 3). (B) Nucleosome scanning analysis of the indicated strains. Nucleosomal DNA enrichment at the indicated positions of the ste11 locus was determined by ChIP experiment on MNase-digested chromatin. Data are presented as the average of three independent experiments along with the SEM. Inferred nucleosome locations are indicated. The bar indicates the position of amplicon A used in ChIP experiments. (C) The occupancy of Rsc1-TAP at the ste11 locus was measured by ChIP using the indicated amplicons (A–B) in the wt and htt2 K14R strains. Each column represents the averaged value ± SEM (n = 4). To determine whether the decreased Rsc1-TAP enrichment was statistically significant, the difference in the means of enrichment between the ChIP peak in the wild type and the tested strains was estimated using t-test, assuming unequal variances between samples (Welch's t- test). p-value < 0.05 indicated by *, n.s. : non significant. (D) The occupancy of Rsc1-TAP at the ste11 locus was measured by ChIP using the indicated amplicons (A–B) in the wt and lsk1 deleted strains. Each column represents the averaged value ± SEM (n = 4). To determine whether the decreased Rsc1-TAP enrichment was statistically significant, the difference in the means of enrichment between the ChIP peak in the wild type and the tested strains was estimated using t-test, assuming unequal variances between samples (Welch's t- test). p-value < 0.05 indicated by *, n.s. : non significant.
Figure 3—figure supplement 1
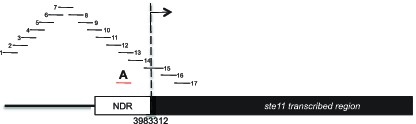
Schematic of amplicons used in the nucleosome scanning experiments.
The black bars represent 17 overlapping amplicons covering a 1179 bp region encompassing the NDR and 215 bp of the ste11 transcribed region. The +1 site and its genomic coordinate are indicated. The red bar represents the amplicon used in ChIP experiments (referred as A).
Figure 3—figure supplement 2
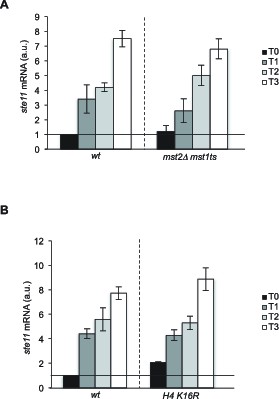
The NuA3 and NuA4 HATs and histone H4 acetylation on K16 are not required for ste11 induction.
(A) Relative quantification of the ste11 mRNA determined by quantitative RT-Q-PCR in the indicated strains grown during vegetative growth (T0, 25°C) and nitrogen starvation at the indicated time points (hours) at 36°C. Note that the strains were shifted to 36°C one hour before nitrogen starvation. Samples were taken at the indicated time (hours). a.u.: arbitrary units. Each column represents the averaged value ± SEM (n = 2). (B) Relative quantification of the ste11 mRNA determined by quantitative RT-Q-PCR in the indicated strains grown during vegetative growth (T0) and nitrogen starvation at the indicated time points (hours). a.u.: arbitrary units. Each column represents the averaged value ± SEM (n = 2).
Figure 4 with 2 supplements

H2B-ubi and HDAC oppose the recruitment of the RSC complex at the ste11 promoter.
(A) The occupancy of ubiquitylated H2B at the indicated locations (A, B) was determined by ChIP in the indicated strains using the anti-H2Bubi normalized against unmodified H2B. Each column represents the averaged value ± SEM (n = 3). (B) The occupancy of Arp9-TAP at the ste11 locus was measured by ChIP using the indicated amplicons (A-B) in the wt and htb1 K119R strains. Each column represents the averaged value ± SEM (n = 3). (C) The occupancy of Arp9-TAP at the ste11 locus was measured by ChIP using the indicated amplicons (A–B) in the wt and hos2△ strains. Each column represents the averaged value ± SEM (n = 3). (D) The occupancy of Arp9-TAP at the ste11 locus was measured by ChIP using the indicated amplicons (A–B) in the wt and lsk1△ strains. Each column represents the averaged value ± SEM (n = 3). (E) The occupancy of acetylated H3K14 at the ste11 promoter was determined by ChIP in the indicated strains using the anti-H3 K14ac normalized against unmodified H3. Each column represents the averaged value ± SEM (n = 3).
Figure 4—figure supplement 1
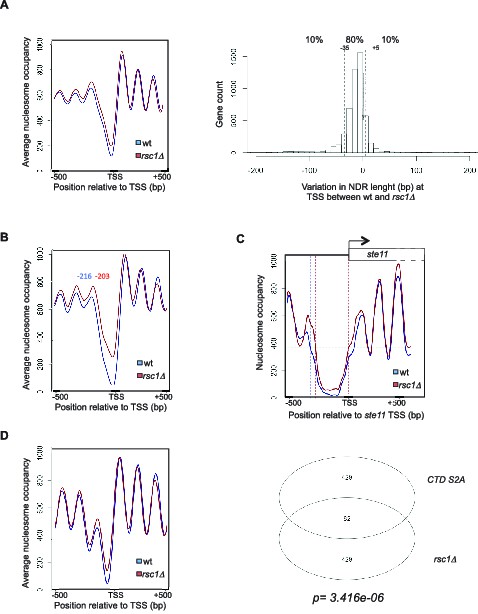
Genome-wide analysis of the absence of Rsc1 on NDR and connection between RSC and CTD S2P.
(A) Left panel: Meta-gene analysis of the nucleosome occupancy signal for all protein coding genes near the TSS for the wt and the rsc1 mutant. Right panel: distribution of the variation in NDR length at TSS between wt and the rsc1 mutant. The 10% genes showing the strongest increase or strongest decrease in NDR size are indicated. (B) Left panel: Meta-gene analysis of the nucleosome occupancy signal for the 10% protein coding genes showing the strongest decrease in NDR size at the TSS in the rsc1 mutant compared to wild type. The distance between the TSS and the average -1 nucleosome midpoint is indicated in blue for the wt and red for the rsc1 mutant. (C) Nucleosomes occupancy nearby the transcription start site of ste11 (blue: wt, red: rsc1). (D) Left panel: Meta-gene analysis of the nucleosome occupancy signal of the previously established list of genes whose promoter nucleosome-depleted region (NDR) shrinks the most in the S2A mutant (Materne et al., 2015) when rsc1 is deleted. Right panel: Venn diagram showing the overlap between the number of fission yeast coding genes with the strongest 10% shrinkage in the rsc1 and CTD S2A mutants. Enrichment was computed as Fisher’s exact one-sided test p-value.
-
Figure 4—figure supplement 1—source data 1
List of the 10% genes showing the strongest promoter NDR size decrease in the rsc1 mutant (see Figure 4—figure supplement 1A, right panel) with their genomic coordinates, NDR size in wild type and the rsc1 mutant.
If marked « TRUE », the gene is part of list of genes (in Figure 1—source data 2 - [Materne et al., 2015]), showing the strongest promoter NDR size decrease in the CTD S2A mutant.
- https://doi.org/10.7554/eLife.13500.012
Figure 4—figure supplement 2
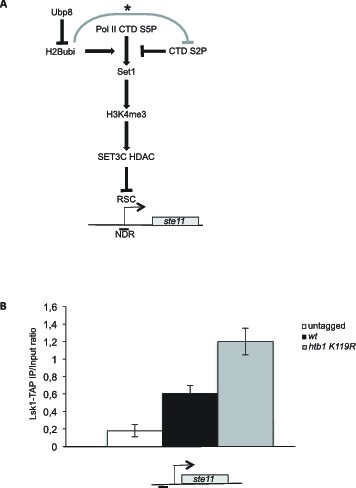
Schematic of the role of H2B-ub1 and RSC in the control of ste11 expression.
(A) See text for details. The grey line marked with an asterisk refers to the reported repressing role of H2Bubi on Ctk1 recruitment (Wyce et al., 2007). (B) The occupancy of Lsk1-TAP at the ste11 promoter was measured by ChIP in the indicated strains. Each column represents the averaged value ± SEM (n = 3).
Author response image 1

Additional files
-
Supplementary file 1
The file contains a list of oligonucleotides and strains used in the study.
- https://doi.org/10.7554/eLife.13500.014
Download links
A two-part list of links to download the article, or parts of the article, in various formats.
Downloads (link to download the article as PDF)
Open citations (links to open the citations from this article in various online reference manager services)
Cite this article (links to download the citations from this article in formats compatible with various reference manager tools)
Histone H2B ubiquitylation represses gametogenesis by opposing RSC-dependent chromatin remodeling at the ste11 master regulator locus
eLife 5:e13500.
https://doi.org/10.7554/eLife.13500


