Hyperosmotic stress memory in Arabidopsis is mediated by distinct epigenetically labile sites in the genome and is restricted in the male germline by DNA glycosylase activity
- University of Warwick, United Kingdom
- Max Planck Institute for Developmental Biology, Germany
- University of Perugia, Italy
- Instituto Gulbenkian de Ciencia, Portugal
Figures
Figure 1 with 1 supplement
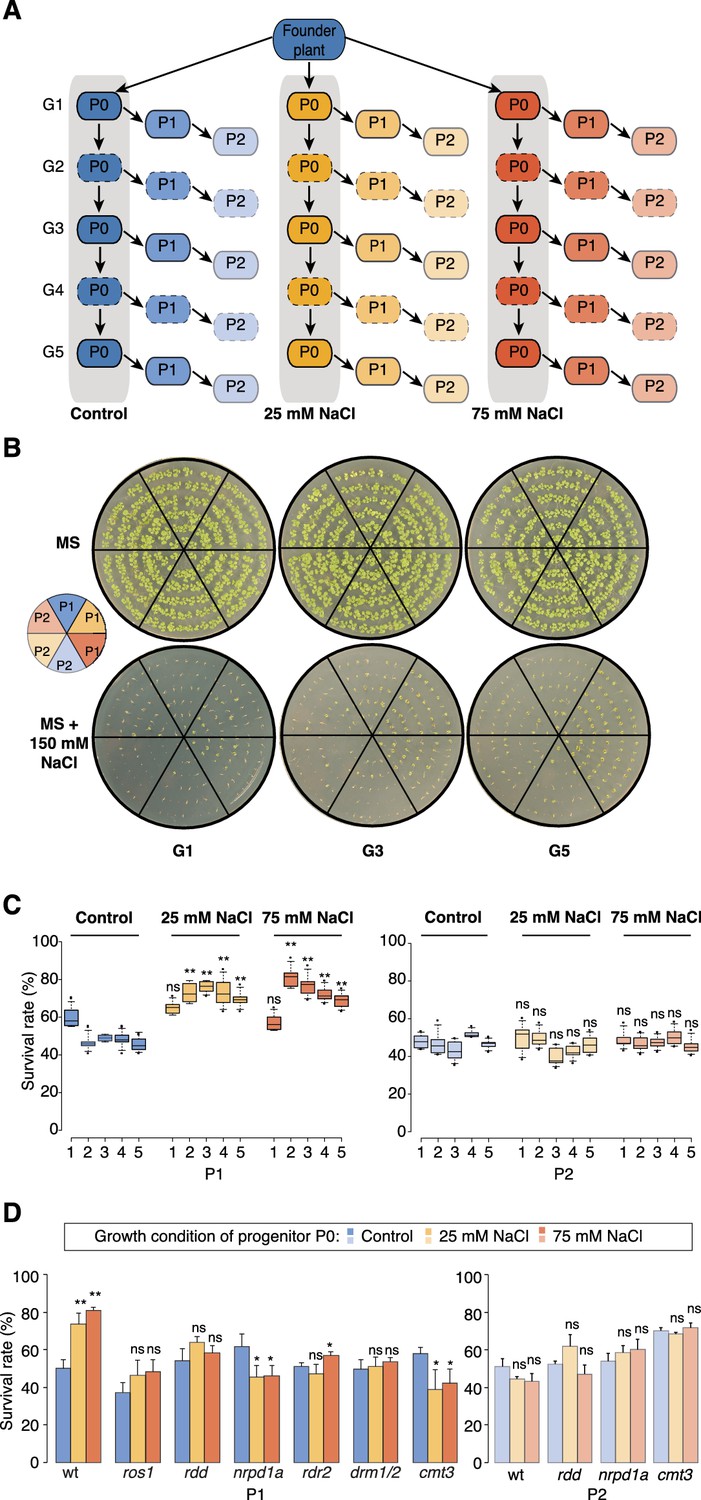
Improved salt resistance of progeny from parents exposed to hyperosmotic stress.
(A) Diagram of the experimental design. Plants were grown on control or hyperosmotic medium (25 mM and 75 mM NaCl) for five consecutive generations. From each generation, progeny in P1 and P2 were grown in the absence of stress. Pools of 10 plants from generations 1, 3 and 5, and of their respective P1 and P2 progeny were used for bisulfite sequencing (solid-lined small boxes). (B) Salt tolerance assay of P1 and P2 progeny of control and G1, G3 and G5 salt-treated plants. Seeds were germinated on MS with or without NaCl; images are 2 weeks after sowing. Color code as in (A). (C) Survival of P1 and P2 seedlings grown on medium with 150 mM NaCl. At least 300 seedlings tested per triplicate in two independent experiments. Asterisks indicate a significant difference between the control group of the same generation (unpaired Student’s t-test; * p<0.05, ** p<0.01, ns p>0.05). Horizontal bar corresponds to median, whiskers indicate entire 95th percentile. (D) Survival of wild-type (wt) and RdDM and DNA methylation mutant P1 and P2 seedlings on medium with 150 mM NaCl (unpaired Student’s t-test; * p<0.05, ns p>0.05). Error bars indicate standard deviation.
Figure 1—figure supplement 1
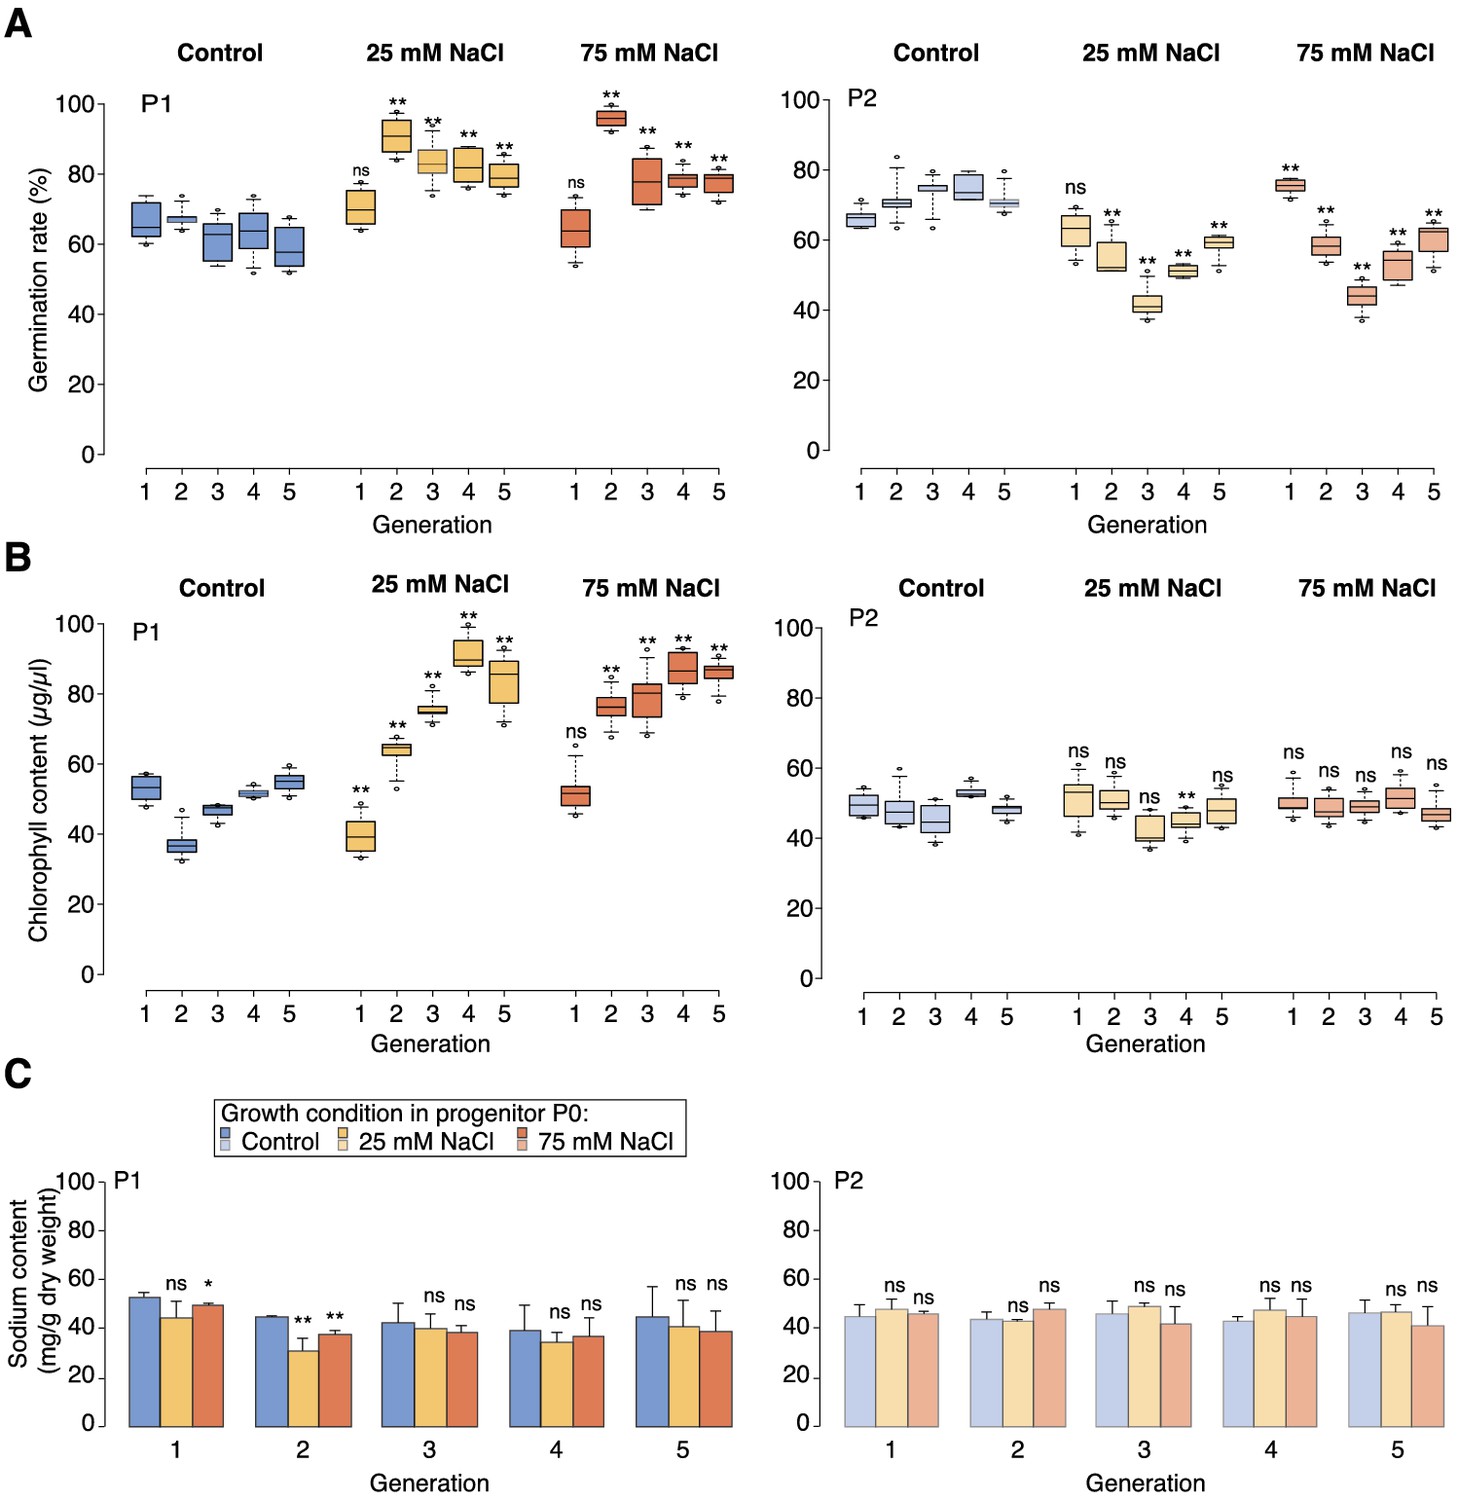
High-salinity tolerance assays.
(A) Germination rates of P1 and P2 seeds on control medium or medium supplemented with 200 mM NaCl. For each sample and treatment 300 seeds were analysed in two triplicates. (B) Chlorophyll content of P1 and P2 plants grown for 5 weeks on control medium or medium supplemented with 100 mM NaCl (6 individuals). (C) Sodium content of P1 and P2 plants grown for 5 weeks on control medium or medium supplemented with 100 mM NaCl (10 individuals). Asterisks indicate a significant difference to the control of the same generation (unpaired Student’s t-test; * p<0.05, ** p<0.01, ns p>0.05).
Figure 2 with 5 supplements

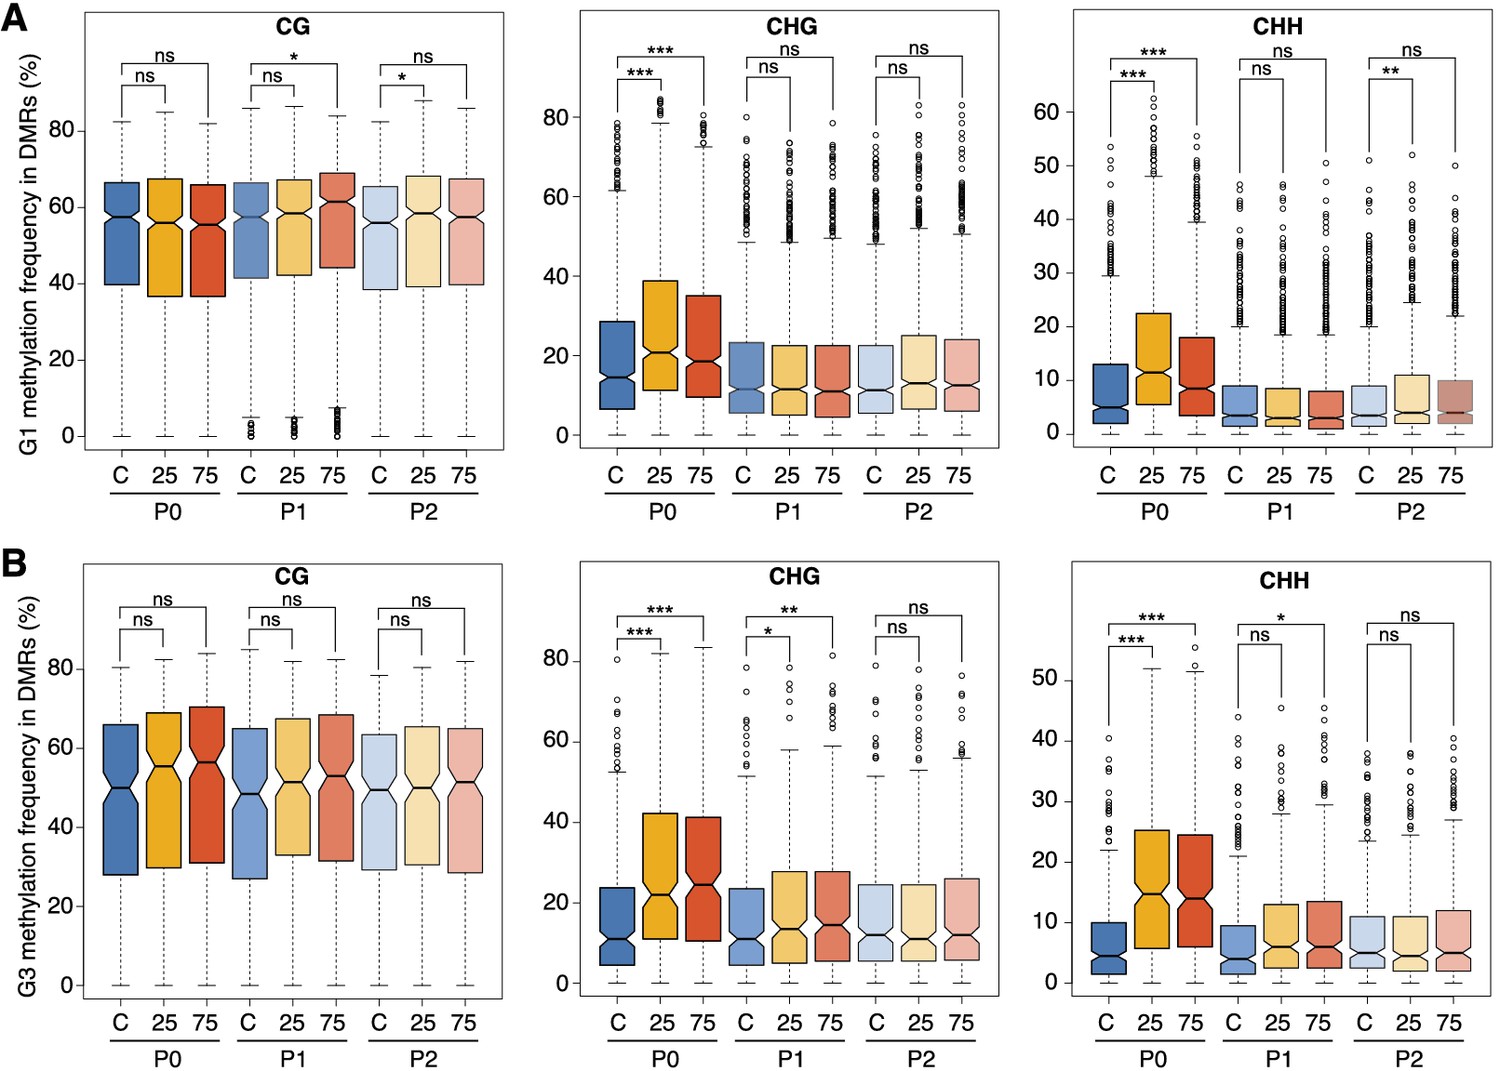
Hyperosmotic stress-induced differentially methylated regions (DMRs) in the absence of stress stimulus.
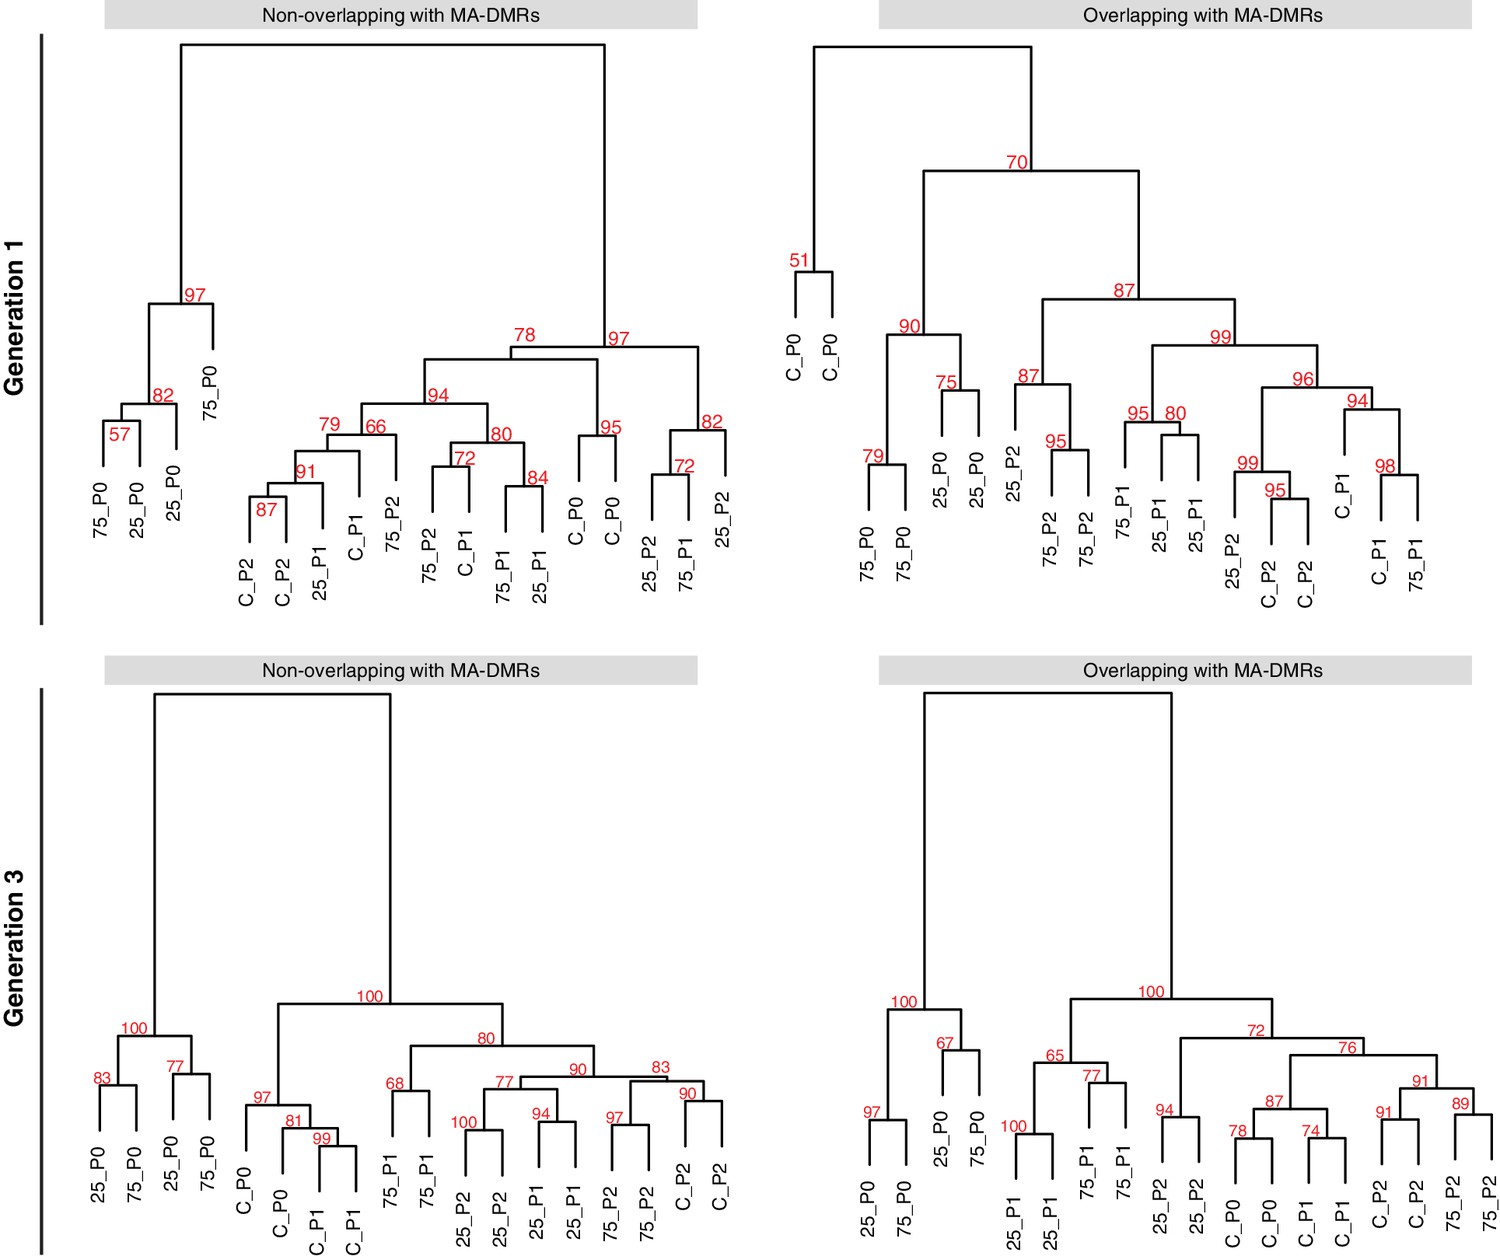
(A) Annotation of cytosines in MRs and DMRs between P0 control and P0 hyperosmotic treated samples in different generations (see Figure 1A). (B) Methylation frequencies by sequence context in DMRs identified between control (P0 of G5), stress-treated (P0 of G5), and the derived P1 and P2 plants (unpaired two-tailed Student’s t-test; ***p<0.001, ns p>0.05). Horizontal bar corresponds to median, whiskers indicate entire 95th percentile. (C) Complete linkage clustering of samples from different generations based on DMR methylation frequencies. Methylation frequency of cytosines contained in each DMR were averaged, and only DMRs covered in all samples were considered. Numbers in red indicate approximately unbiased (AU) p-values (x100), calculated with pvclust. (D) Overlap (including 500 bp flanking windows) of DMRs between P0 control and stress-treated samples from G1, G3 and G5. Overlap with DMRs from a previous analysis of mutation accumulation (MA) lines (Hagmann et al., 2015) is also shown. (E) Clustering of DMRs between P0 control and stress-treated samples in G5 according to overlap with MA-DMRs. C, control, 25, 25 mM NaCl and 75, 75 mM NaCl.
Figure 2—figure supplement 1
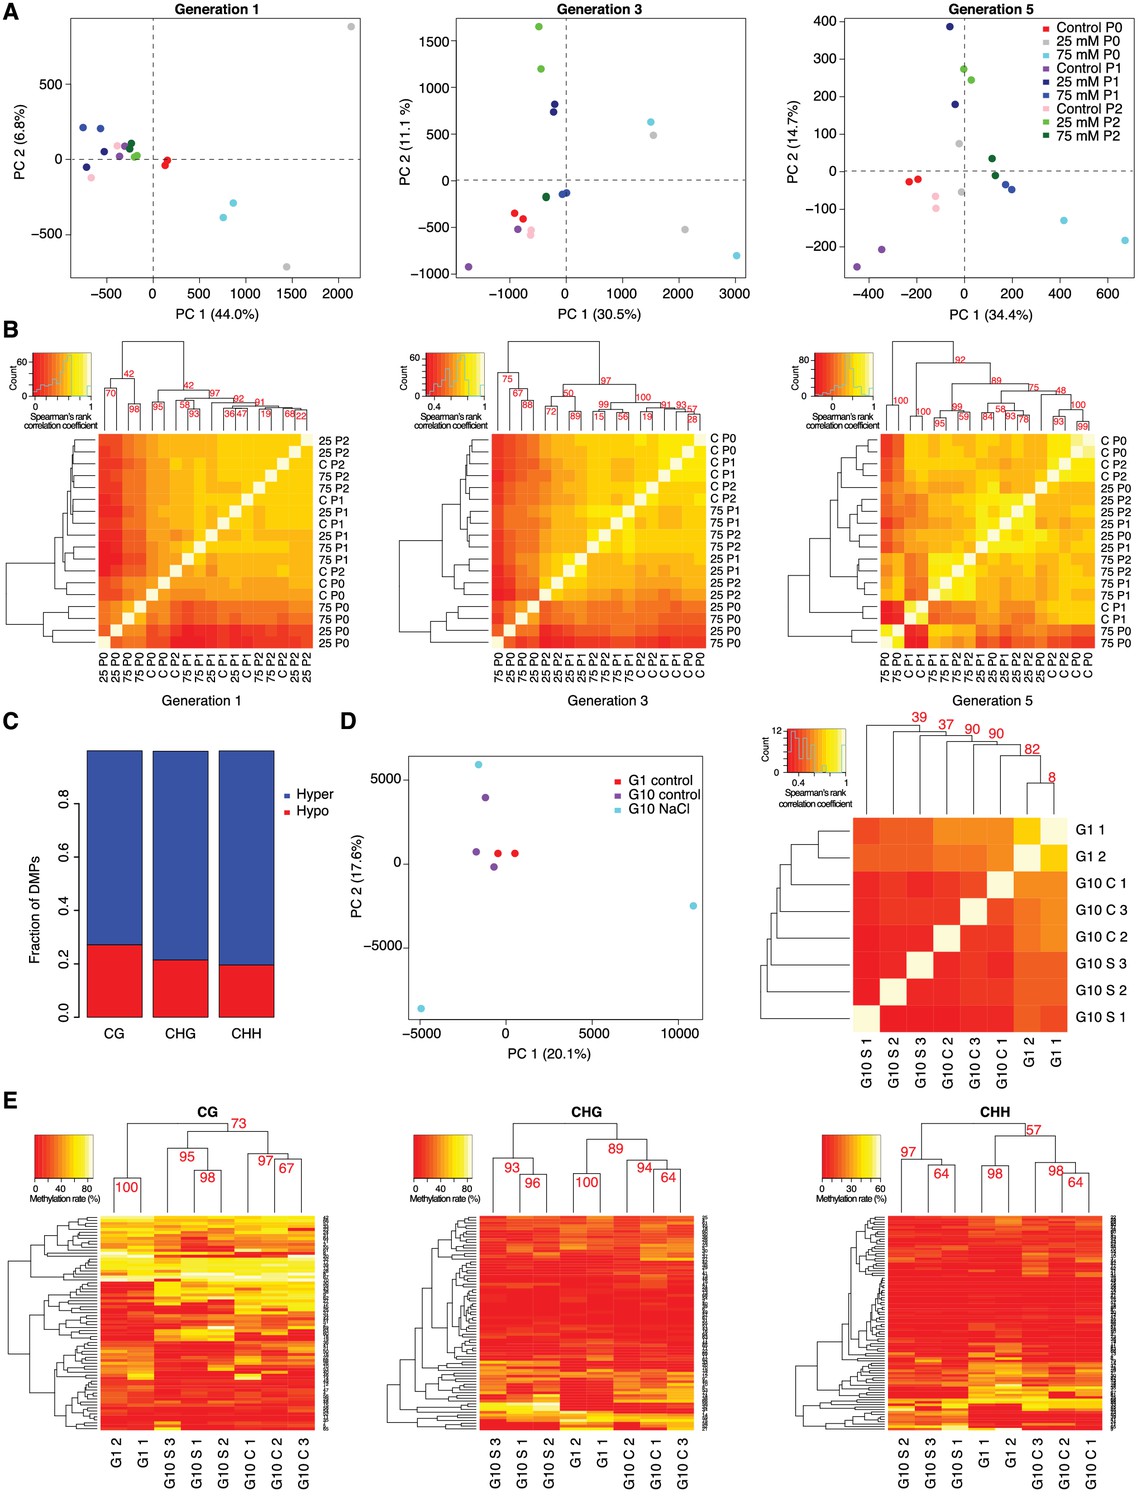
DNA methylation variation after multigenerational hyperosmotic stress.
(A) Principal component (PC) analysis of methylation frequencies at DMPs in each generation, with full information across all samples of that generation. Numbers in brackets indicate the percentage of variation explained by the respective PC. (B) Complete linkage clustering of pairwise correlation of DMP methylation frequencies, separated by generation. (C) Fraction of hyper- and hypo-methylated DMPs after salt-treatment of P0 samples. (D and E) Analyses based on data published by Jiang et al. (2014). G1: generation 1. G10: plants after 10 generations of either control of NaCl treatment. (D) Reanalysis of published hyperosmotic stress data (Jiang et al., 2014). PC analysis of methylation frequencies at DMPs (left panel). Bi-hierarchical clustering of pairwise correlation of methylation frequency at DMPs identified in all pairwise comparisons, with full information across all samples (right panel). (E) Reanalysis of previously published hyperosmotic stress data (Jiang et al., 2014). Complete linkage clustering based on DMR methylation frequencies, divided by sequence context. The methylation frequency of each DMR per sample was calculated as the average methylation frequency of cytosines in that DMR. Only DMRs covered in each sample were considered. G1, untreated generation 1; G10, generation 10; C, control; S, salt-treated.
Figure 2—figure supplement 2
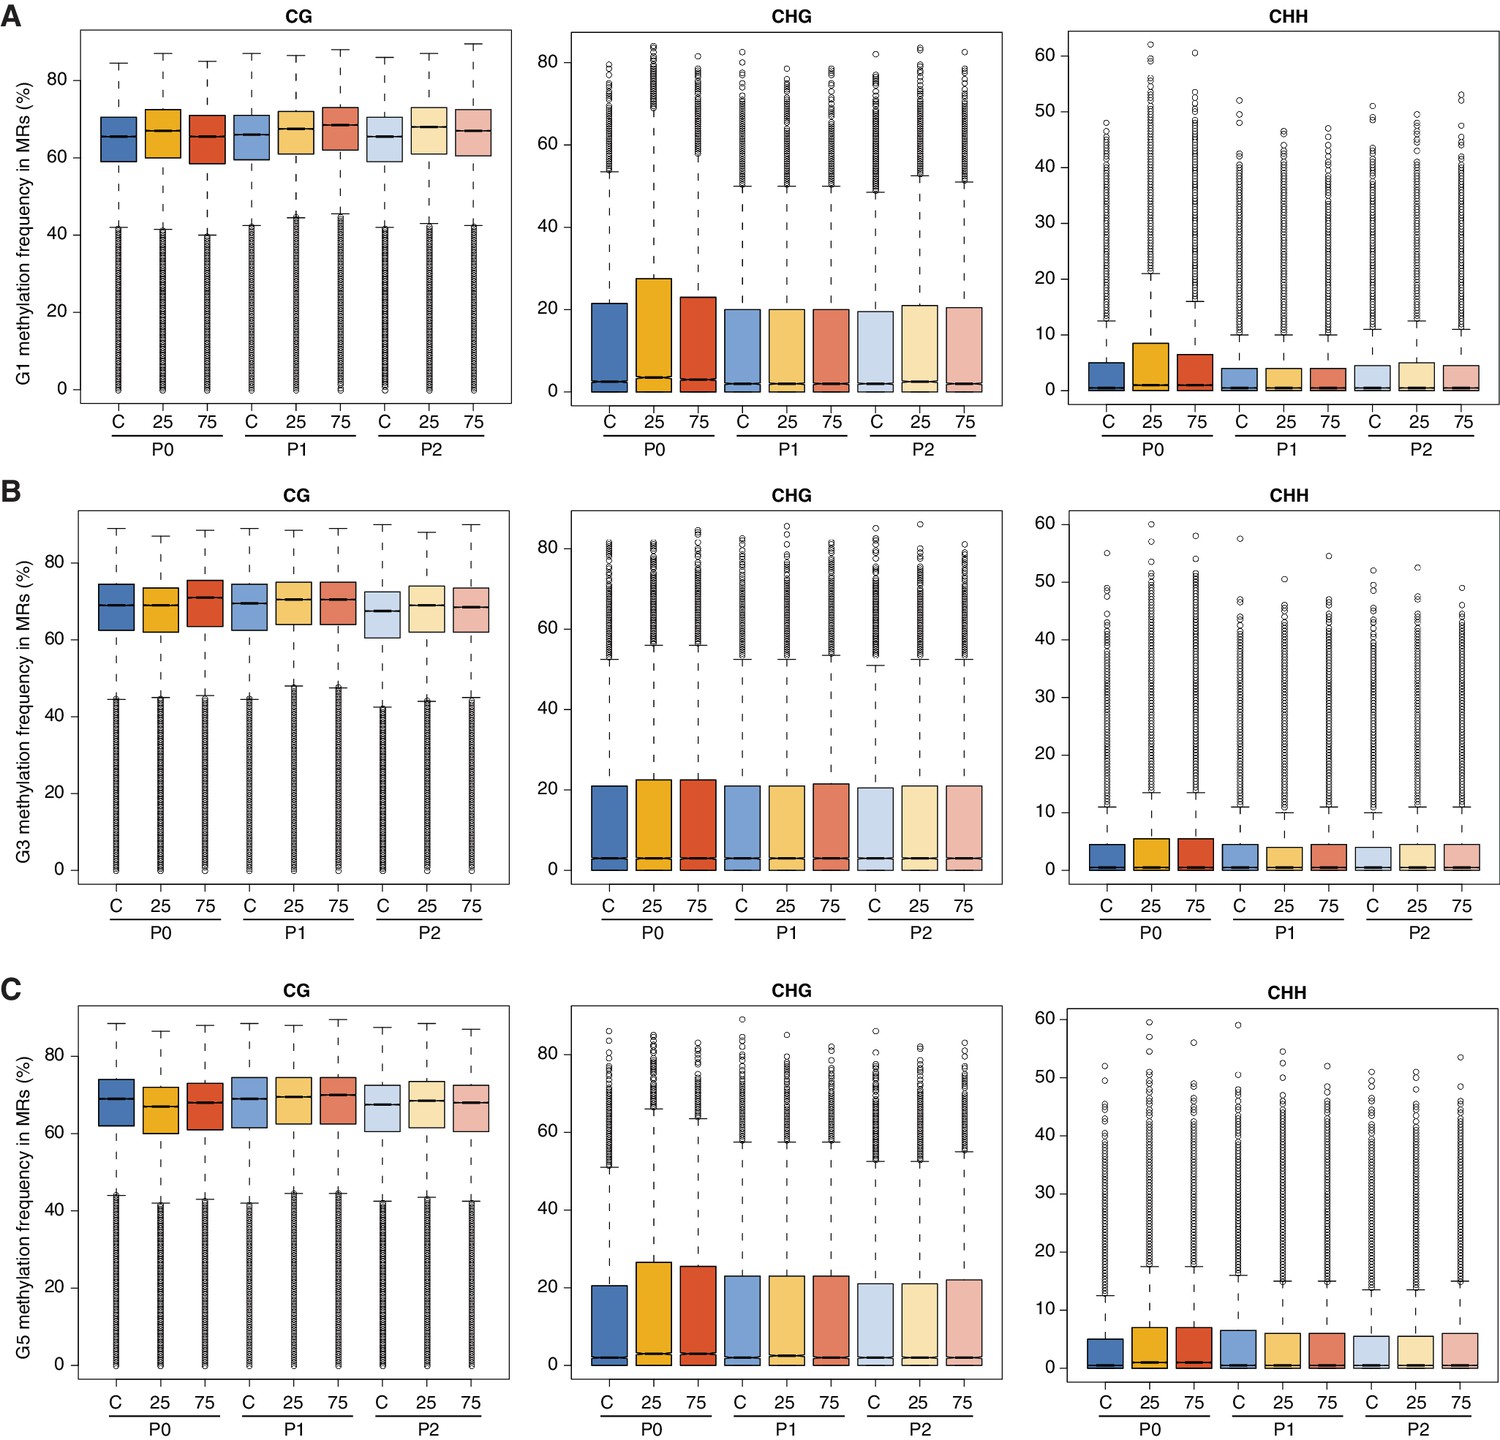
Effect of hyperosmotic-stress on global methylation.
Methylation frequencies in MRs of plants from different generations, divided by sequence context. 25, 25 mM NaCl; 75, 75 mM NaCl; C, control.
Figure 2—figure supplement 3
Hyperosmotic-stress induced methylation changes in DMRs.
Methylation frequencies in MRs of plants from different generations, divided by sequence context (unpaired Student’s t-test; * p<0.05, ** p<0.01, *** p<0.001, ns p>0.05). C, control; 25, 25 mM NaCl; 75, 75 mM NaCl.
Figure 2—figure supplement 4
Overlap of HS-DMRs with MA-DMRs.
(A-B) Clustering of DMRs between P0 control and salt-treated samples in generations 1 and 3, separated according to overlap with DMRs in MA lines (Hagmann et al., 2015).
Figure 2—figure supplement 5
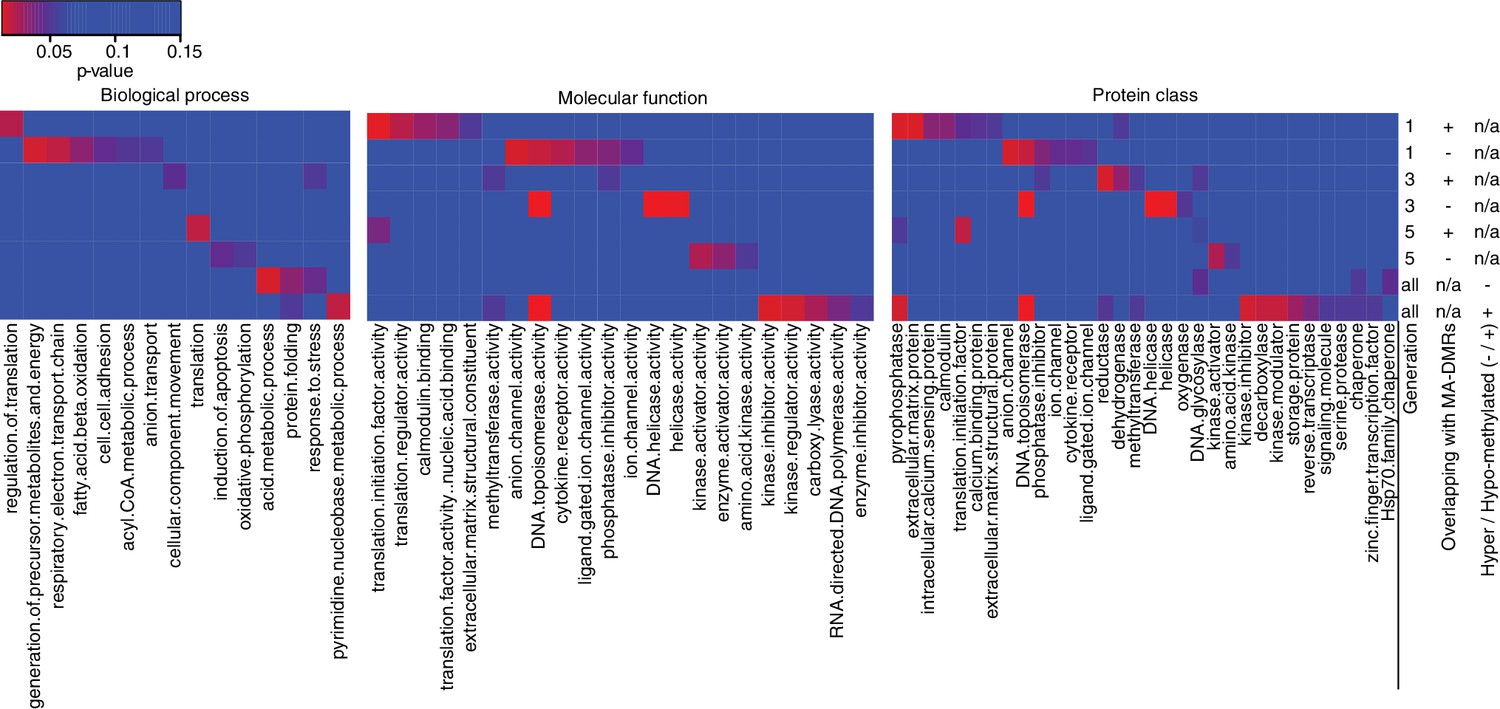
Gene Ontology analysis of genes associated to HS-DMRs.
Heatmaps of significantly enriched GO categories among hypo-/hypermethylated salt-stress induced DMRs that overlap or do not overlap with DMRs identified in MA lines (Hagmann et al., 2015) (p-value<0.05).
Figure 3 with 2 supplements
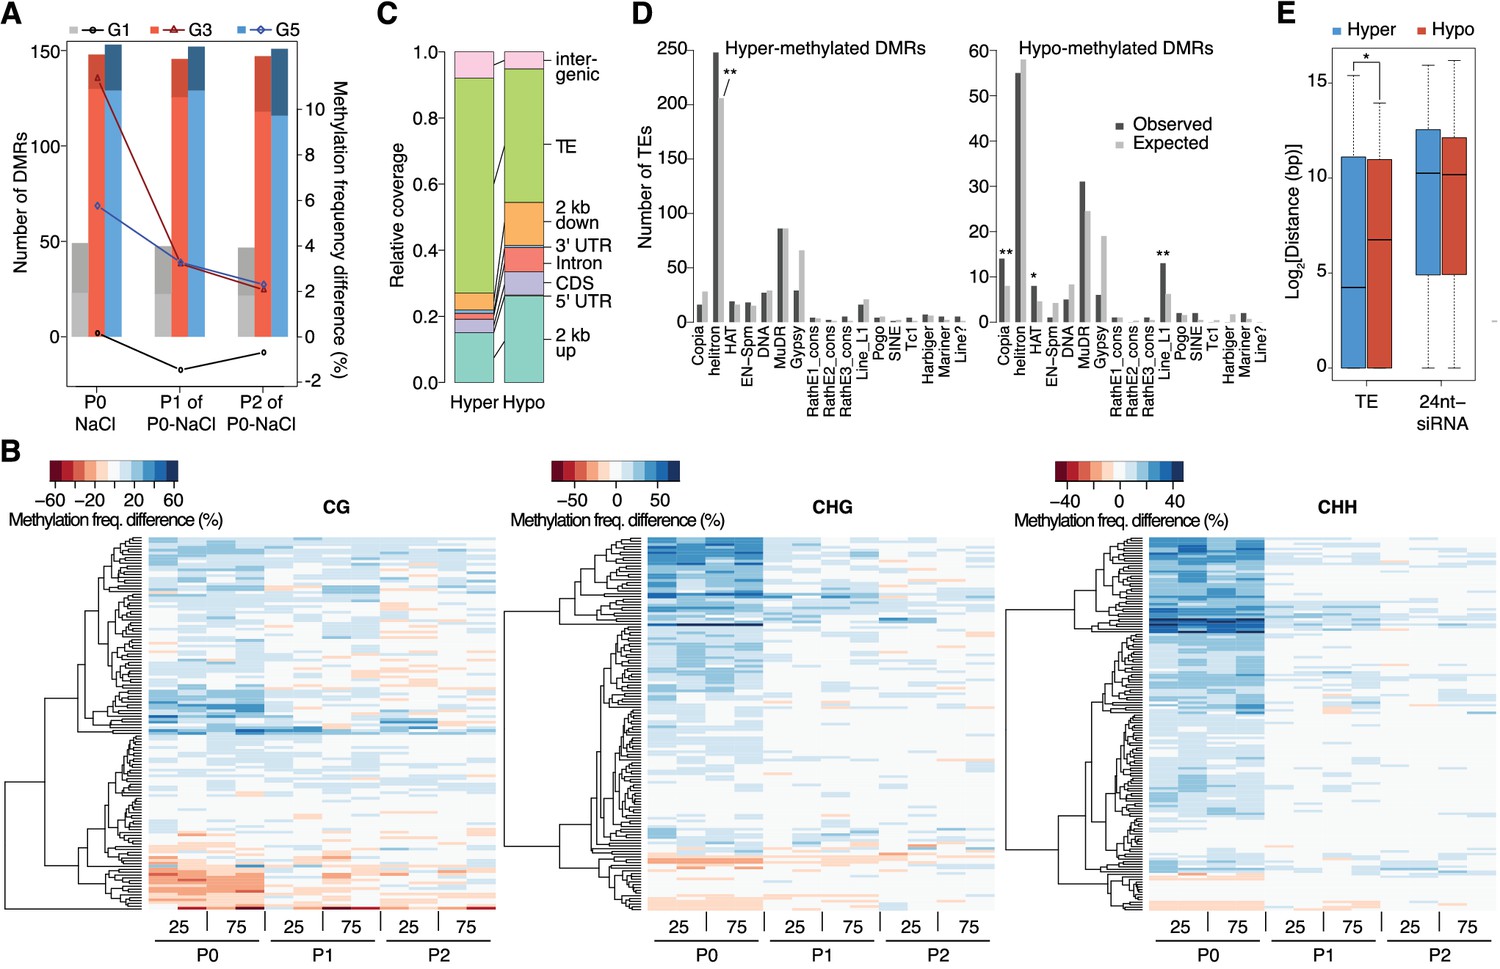
Dynamics of methylation frequency changes in DMRs.
(A) DMRs that are hypo- (darker colours) or hyper-methylated (lighter colours) in stress-treated P0 and their P1 and P2 progeny compared to the average of all control samples. Methylation states were determined by subtracting the methylation frequency of a DMR in the respective sample from the combined controls (P0, P1 and P2) of that generation (G1, G3, or G5); positive differences were considered as hyper-, negative differences as hypo-methylation events. Line plots indicate the absolute net methylation frequency change (in% ) across all DMRs. (B) One-directional clustering of DMRs in G3 by methylation frequency difference, separated by sequence context. Differences for each DMR were calculated by subtracting the methylation frequency of the DMR in a sample from the average in the combined P0, P1 and P2 control samples (see also Figure 1a). Blue colour indicates hyper-, red colour indicates hypomethylation. 25, 25 mM NaCl; 75, 75 mM NaCl; C, control. (C) Annotation of DMRs. (D) Classes of TEs next to DMRs. (E) Distance of DMRs to the nearest transposable element (TE) or 24 nt-siRNA locus (Fahlgren et al., 2010) (unpaired Student’s t-test; *p<0.05). Horizontal bar corresponds to median, whiskers indicate entire 95th percentile; outliers are not shown.
Figure 3—figure supplement 1
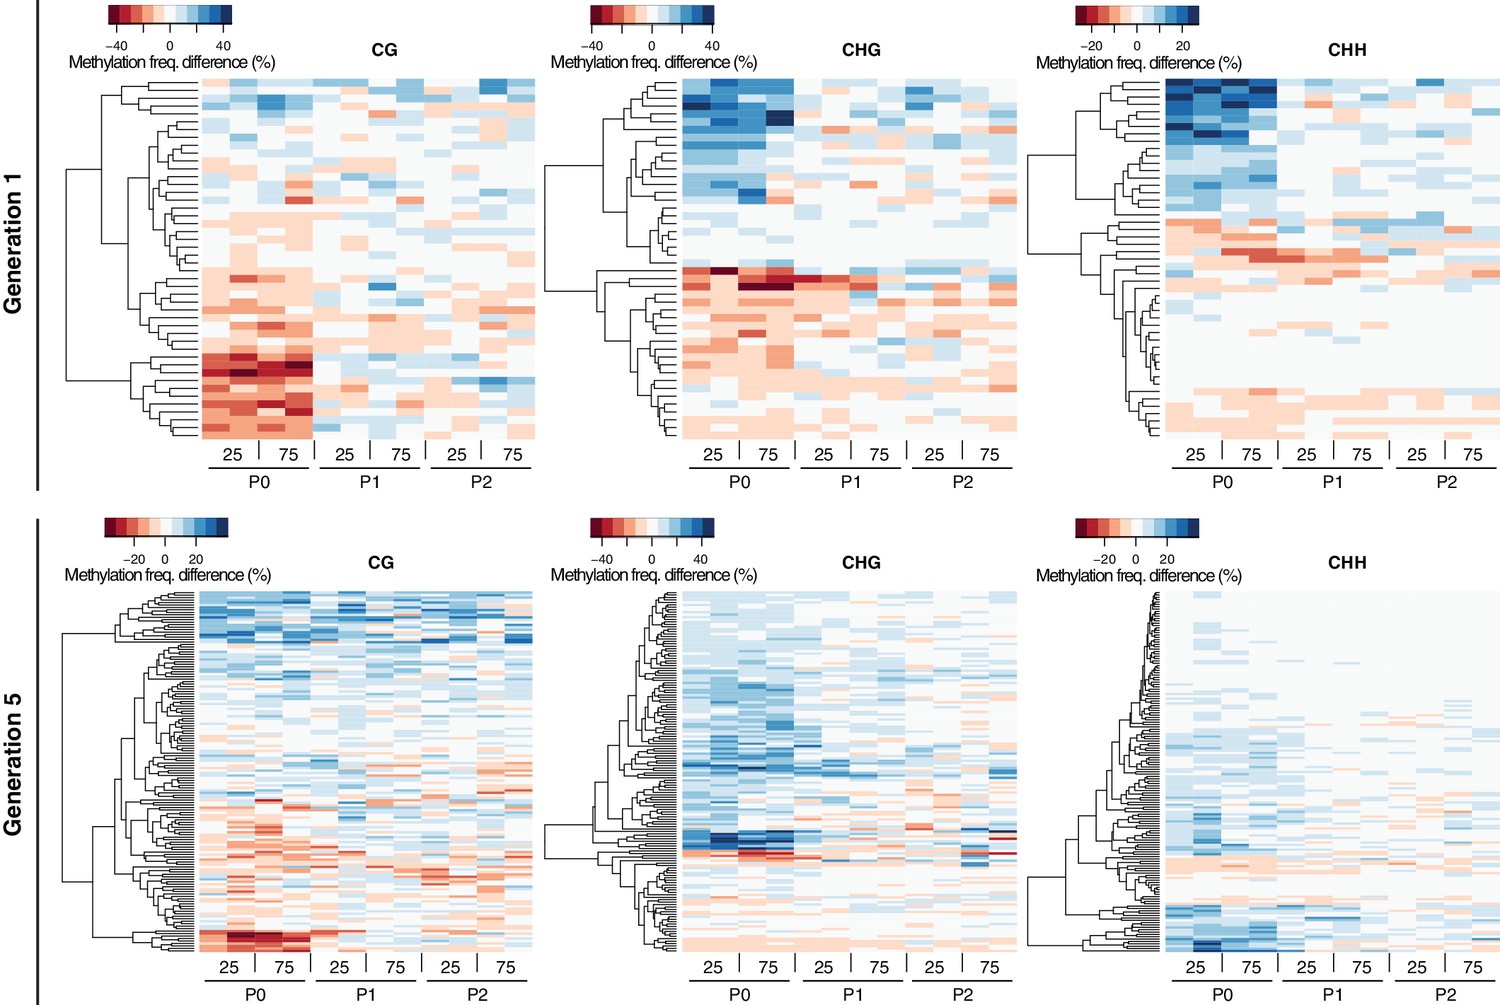
Methylation dynamics of HS-DMRs across three generations.
One-directional clustering of DMRs in generations 1 and 5 by methylation frequency difference, divided by sequence context. Methylation frequency differences were calculated by subtracting the methylation frequency for each DMR in the respective sample from the average methylation frequency in the combined P0, P1 and P2 control samples. Blue colour indicates hyper-, red colour indicates hypo-methylation. C, control; 25, 25 mM NaCl; 75, 5 mM NaCl.
Figure 3—figure supplement 2

Methylation at hyperosmosis-induced DMRs in drm1drm2 double mutants.
Methylation frequency difference in the P1 progeny of salt-stressed Col-0 wild-type and drm1 drm2 plants, separated by sequence context. Methylation frequency differences were calculated by subtracting the methylation frequency for each DMR in the respective sample from its average methylation frequency in the combined P0, P1 and P2 Col-0 control samples. Blue colour indicates hyper-, red colour indicates hypomethylation.
Figure 4 with 2 supplements
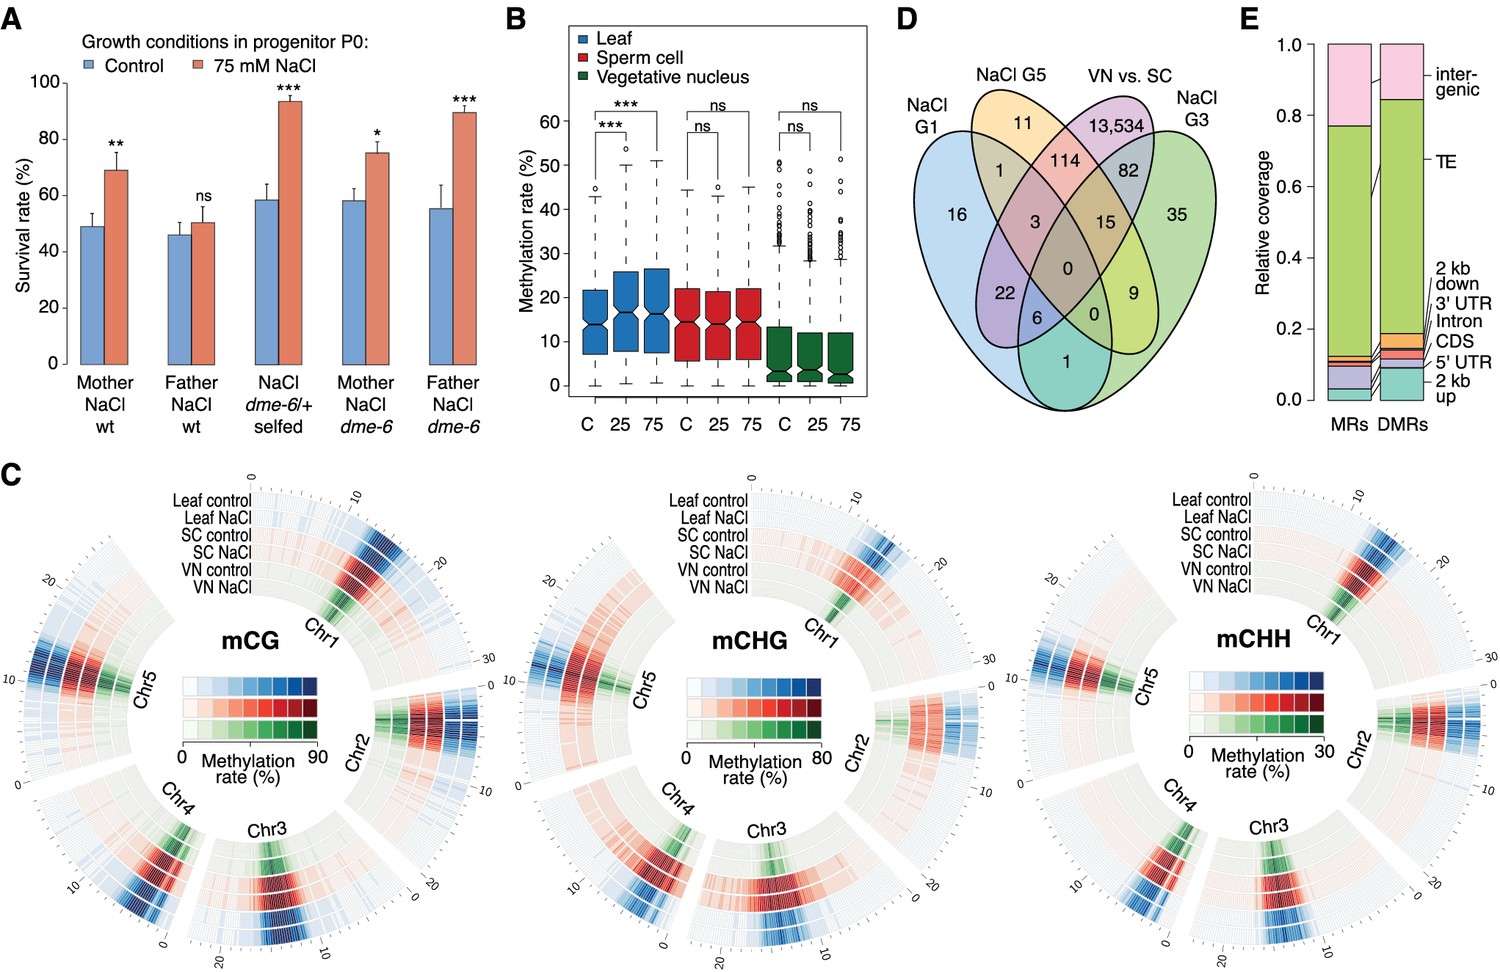
Parent-of-origin effects on stress-induced epimutations.
(A) Survival of F1 seedlings derived from reciprocal crosses between Col-0 wild type or dme-6 mutants that had been exposed to hyperosmotic stress for two generations and untreated wild-type (wt), or progeny of dme-6/+ selfed plants (unpaired Student’s t-test; *p<0.05, **p<0.01, ***p<0.001, ns p>0.05). (B) Absolute methylation frequency differences in DMRs in different tissues from control and stress-treated plants (unpaired, two-sided Student’s t-test; ***p<0.001, ns p>0.05). C, control; 25, 25 mM NaCl; 75, 75 mM NaCl. (C) Genome-wide methylation levels in leaves and pollen derived from control and salt-stressed P0 plants (generation G1). Methylation frequency was calculated as the average methylation frequency of cytosines in a 250 kb window. Chr, chromosome. (D) Overlap of DMRs from the comparison of vegetative nuclei and sperm cells with DMRs identified in leaf tissue after salt treatment in G1, G3, G5. (E) Annotation of MRs and DMRs in vegetative nuclei and sperm cells.
Figure 4—figure supplement 1
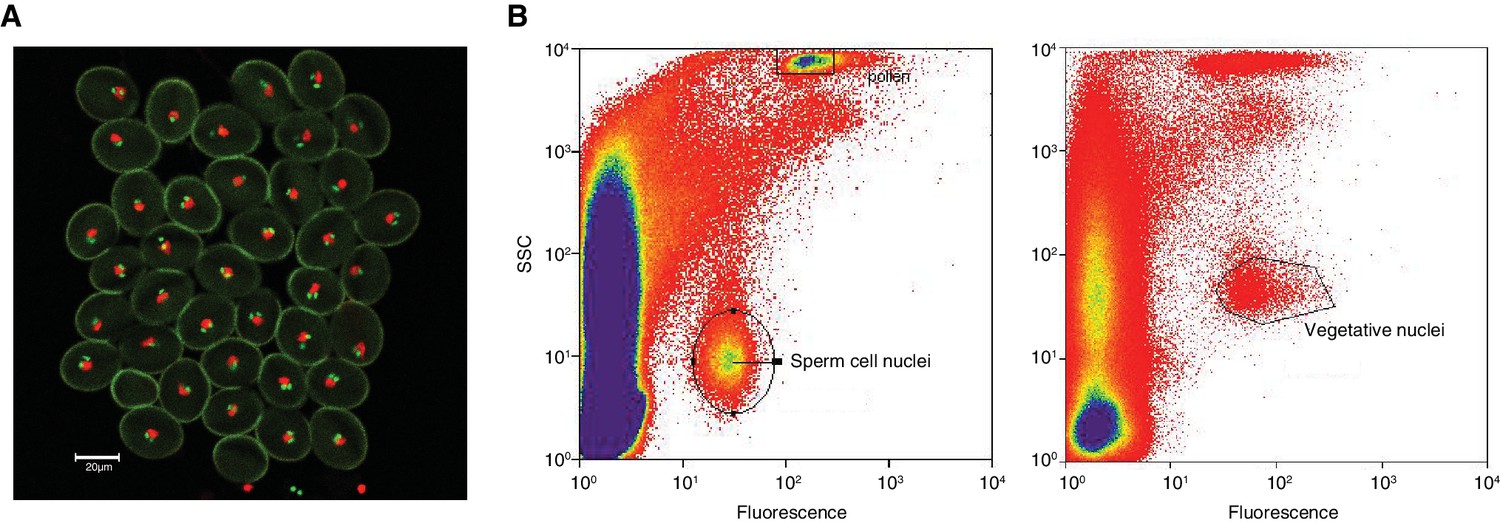
Isolation of sperm cells and vegetative nuclei by fluorescent-activated-cell-sorting.
(A) Confocal microscopy image (25x) of pollen from the A. thaliana pMGH3::MGH3-eGFP/pACT11::H2B marker line. pMGH3::MGH3-eGFP expression marks the sperm cell nuclei (green); pACT11p::H2B-mRFP expression labels vegetative cell nuclei (red). (B) Isolation of sperm and vegetative cells by Fluorescence-Activated-Cell-Sorting (FACS) of sperm cell and vegetative nuclei were isolated based on their GFP and RFP signal, respectively, as well as on their intra-cellular complexity (side scatter, SSC) and particle size (forward scatter, FSC).
Figure 4—figure supplement 2
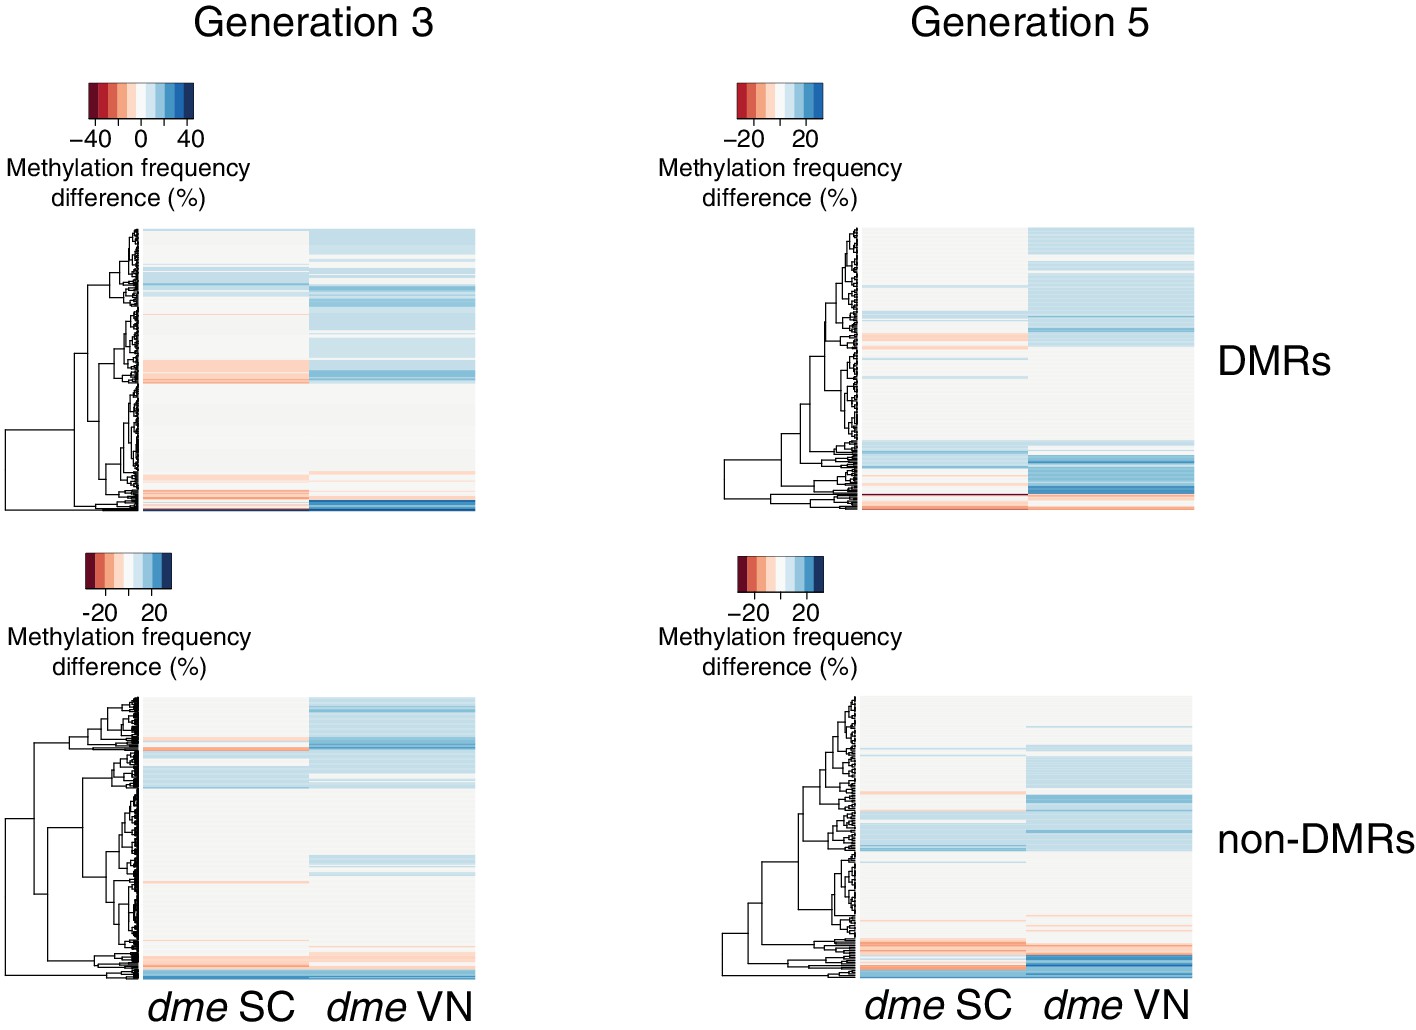
Methylation at hyperosmotic stress-induced DMRs in the dme-6 mutants.
Methylation frequency difference in sperm cells (SC) and vegetative nuclei (VN); original sequencing data was taken from Ibarra et al. (2012). Differences were calculated by subtracting the methylation frequency of each DMR from its methylation frequency in the Col-0 wild-type control samples. Blue colour indicates hyper-, red colour indicates hypomethylation
Figure 5 with 4 supplements
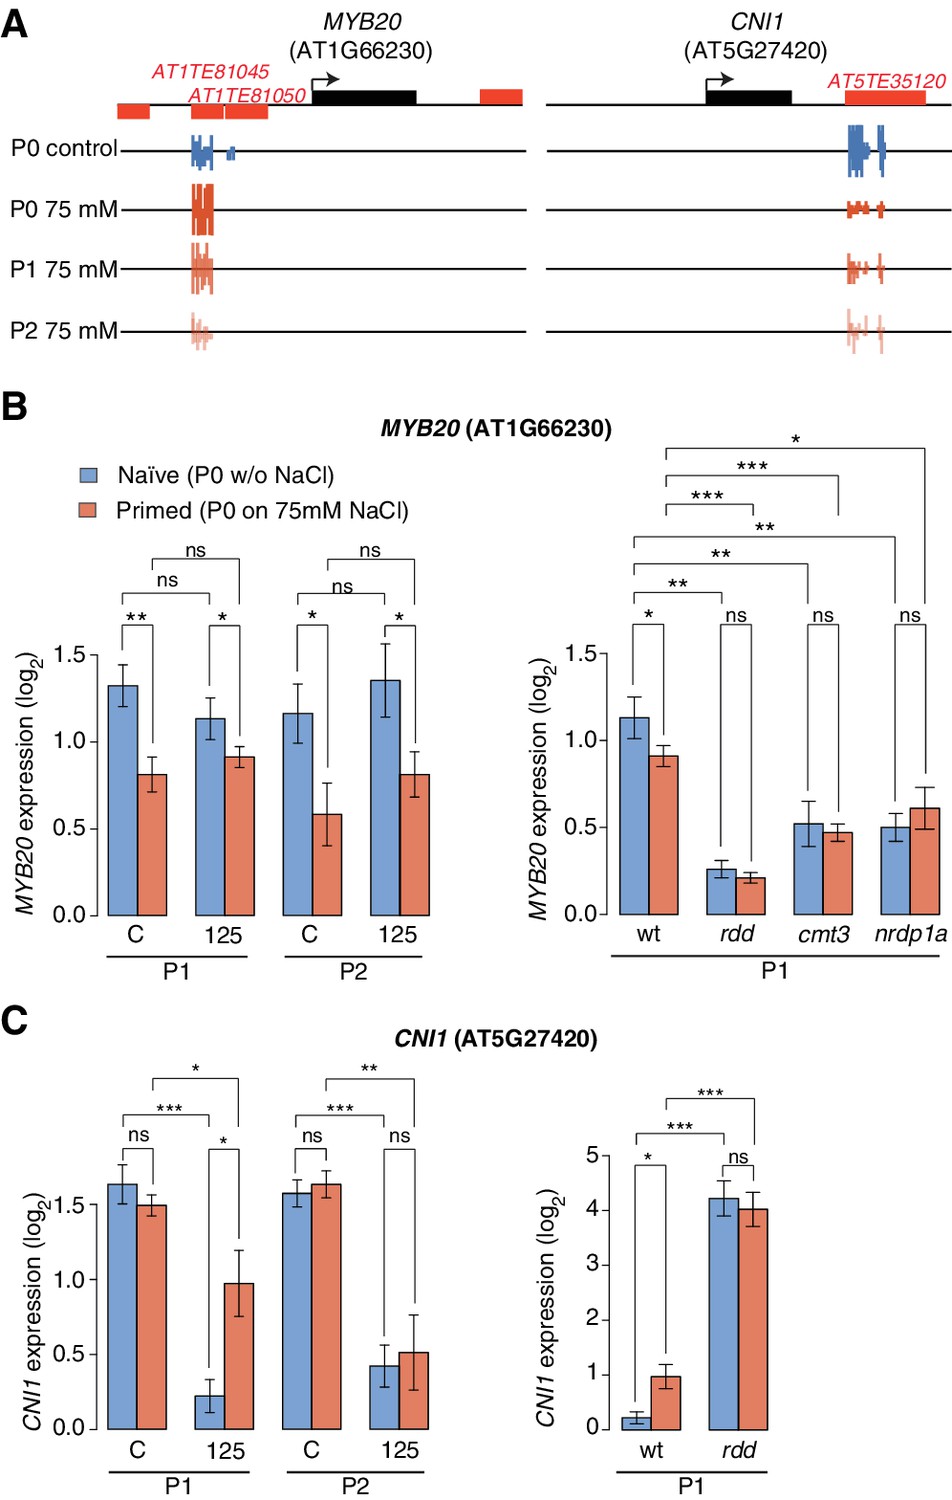
Expression of two genes adjacent to hyperosmotic stress-induced DMRs.
(A) Methylation near MYB20 and CNI1. Black boxes on top represent genes, red boxes TEs. Methylation on the top and bottom strands at individual cytosines is shown as vertical bars below. (B–C) MYB20 and CNI1 expression (arbitrary units) in the P1 and P2 progeny of control ('naïve') and salt-treated ('primed') wild-type and mutant plants. Leaves of 2-week-old plants grown on MS medium were analysed (unpaired Student’s t-test; *p<0.05, **p<0.01, ns p>0.05). Error bars indicate standard deviation. C, control; 125, 125 mM NaCl.
Figure 5—figure supplement 1
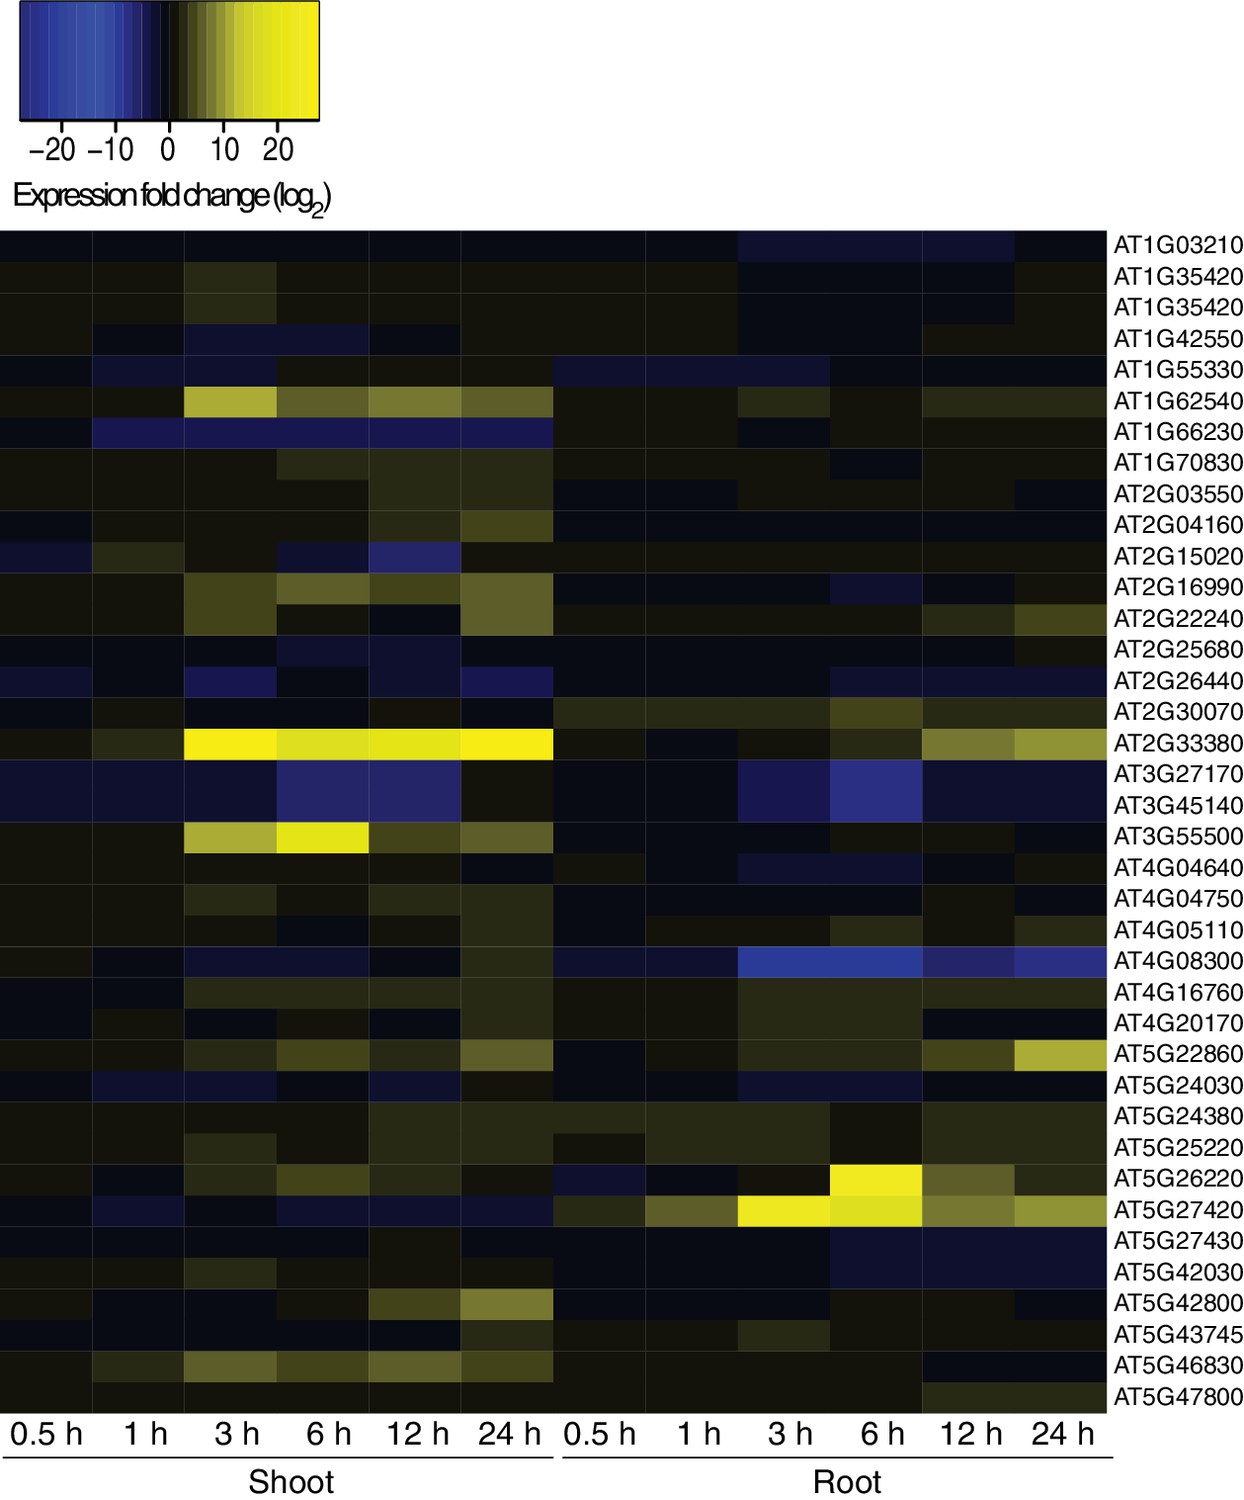
Hyperosmotic stress response of genes next to HS-DMRs.
Heatmap showing expression changes of genes adjacent to HS-DMRs after exposure to hyperosmotic stress (0.5 to 24 hr) in shoots and roots (Zeller et al., 2009). Blue indicates downregulated genes (log2 <-10) and yellow indicates upregulated (log2>10) genes. Gene identifiers are listed on the right hand side of the heatmap. Blue indicates down-regulation and yellow indicates up-regulation by hyperosmotic stress.
Figure 5—figure supplement 2
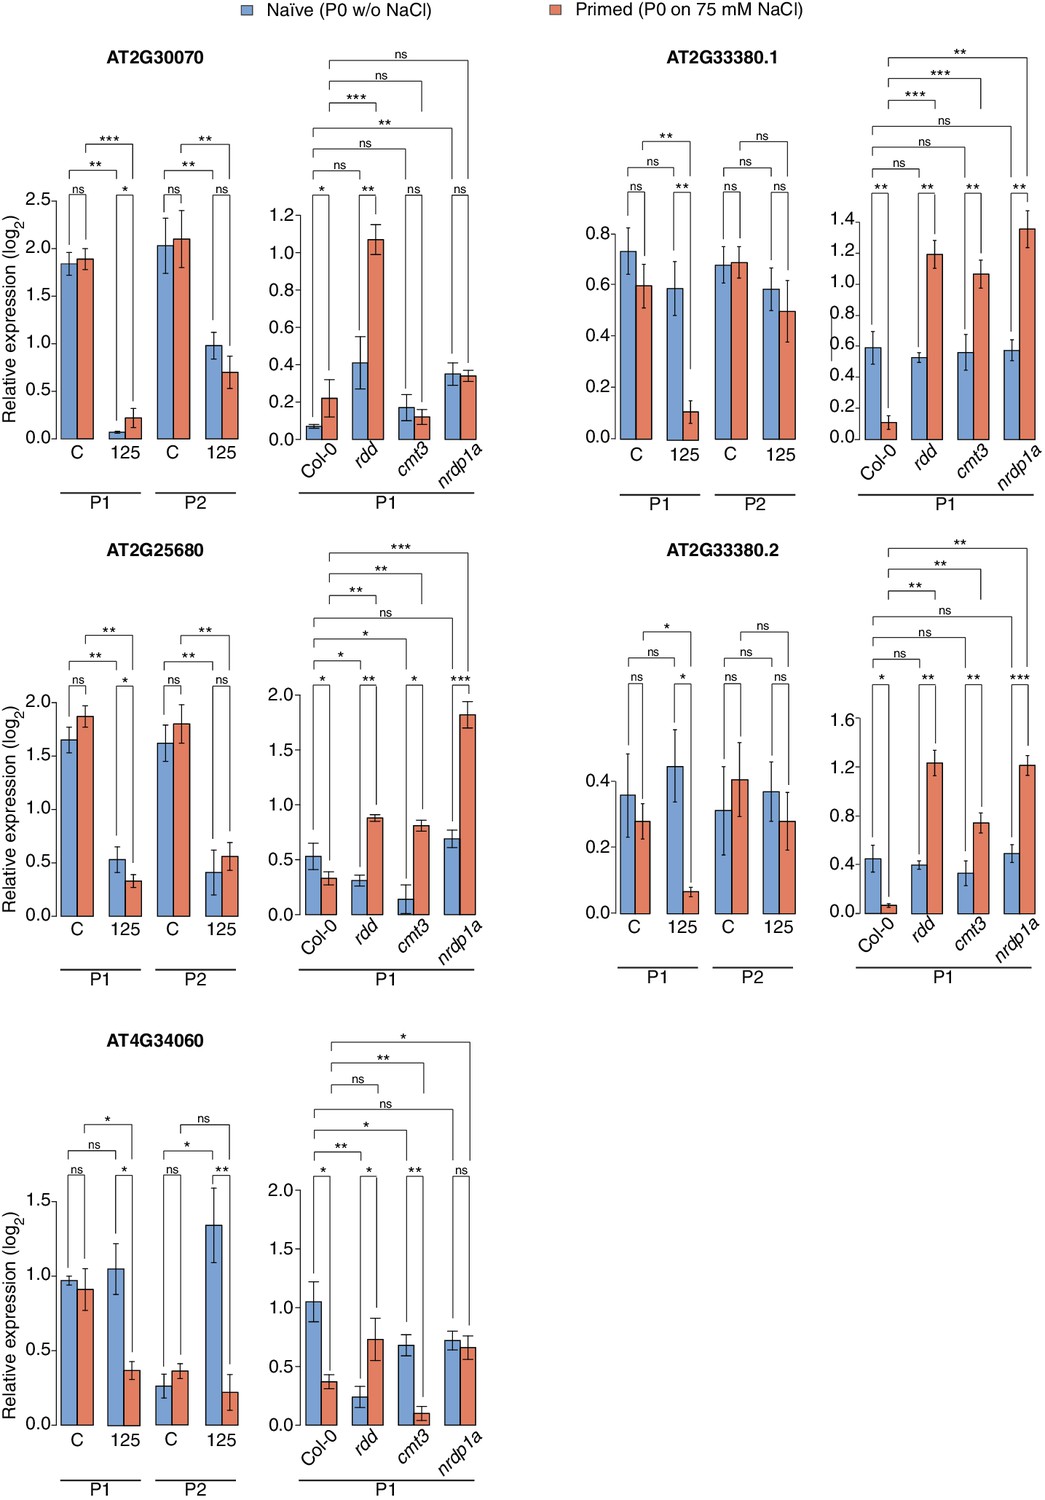
Expression of genes adjacent to HS-DMRs.
Expression of four genes next to HS-DMRs in leaves of P1 and P2 progeny of P0 control ('naïve') and P0 salt-treated ('primed') plants, was analysed in leaves of 2-week-old wild type and rdd, cmt3 and nrpd1a mutants. Plants were grown on MS medium or medium supplemented with 125 mM NaCl. For AT2G33380, two differentially spliced isoforms were analysed (unpaired Student’s t-test; *p<0.05, **p<0.01, ns p>0.05). Error bars indicate standard deviation. C, control; 125, 125 mM NaCl.
Figure 5—figure supplement 3
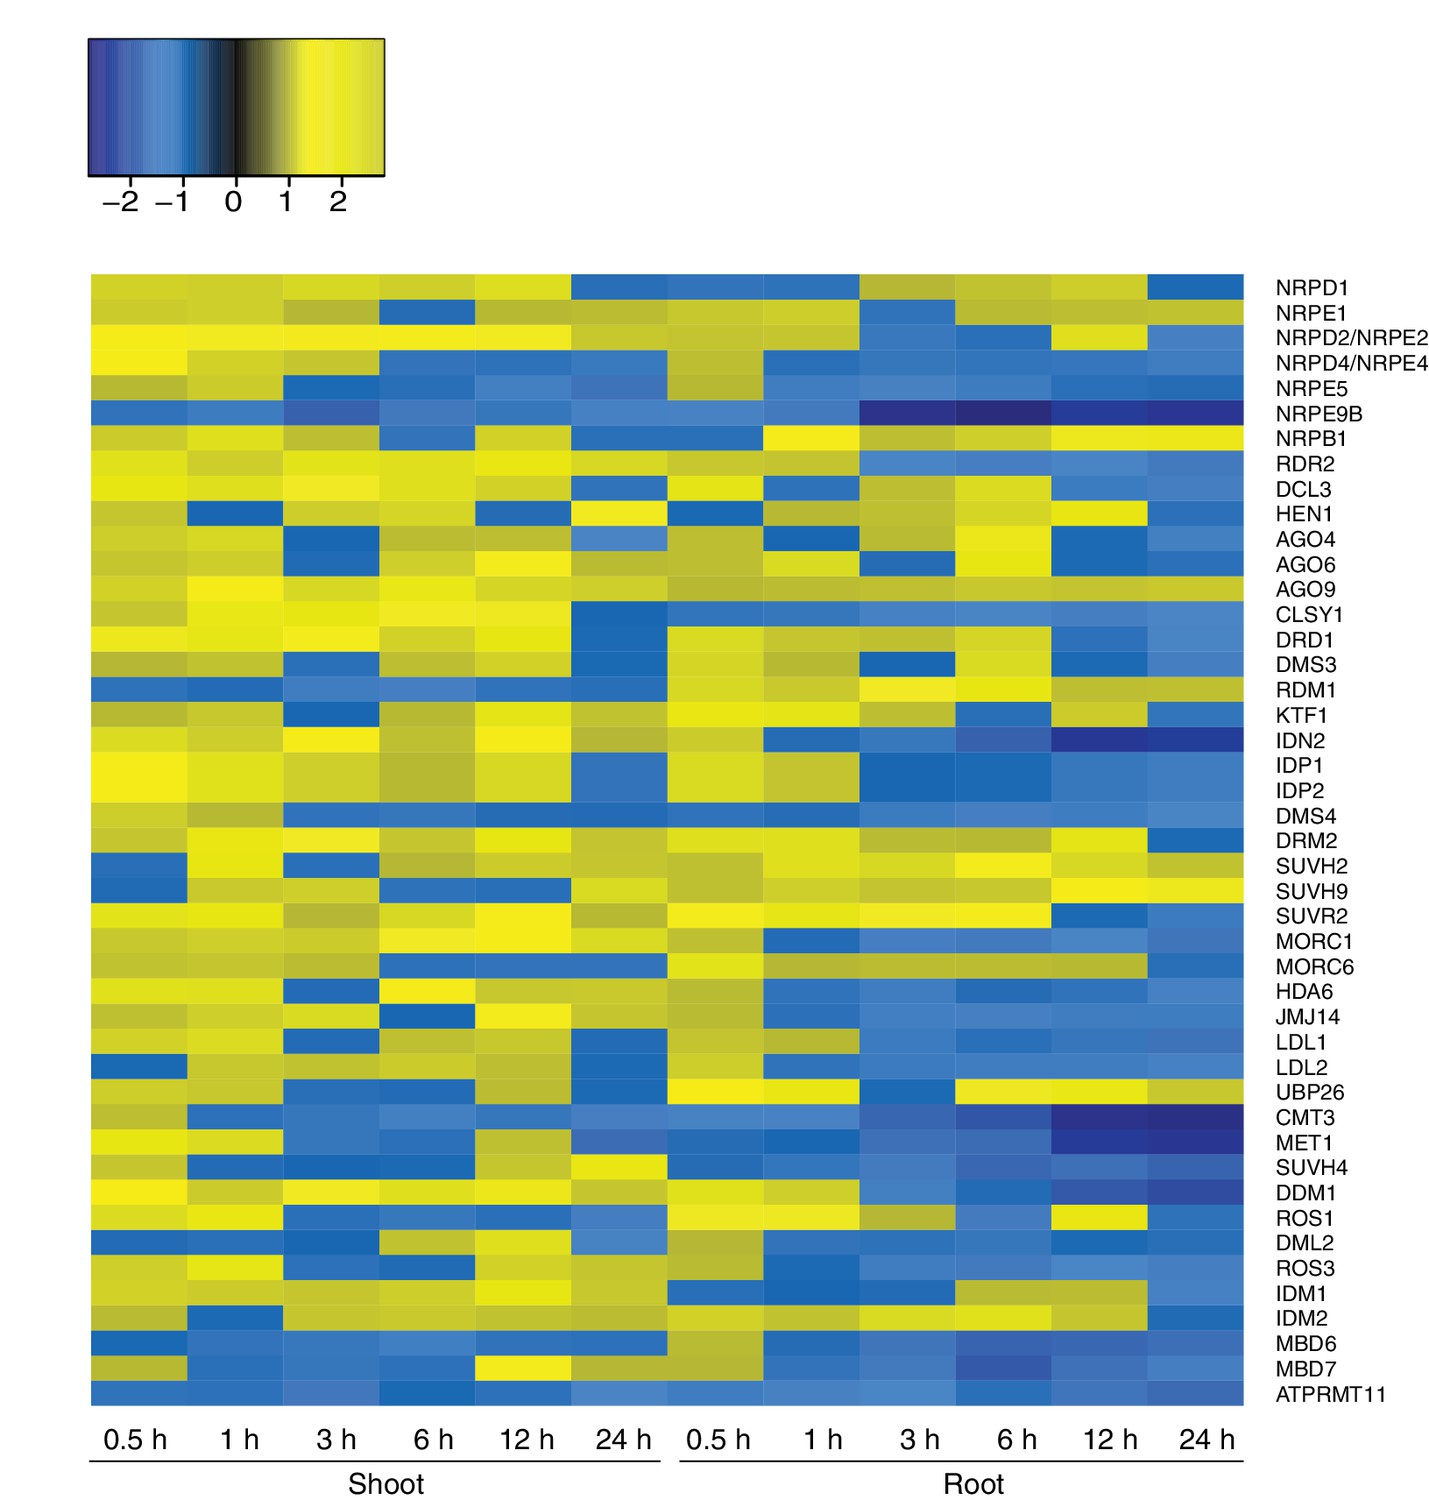
Expression of RdDM and demethylation pathway genes in response to hyperosmotic stress.
Heatmap showing expression of genes from RdDM and demethylation pathways after exposure to hyperosmotic stress (0.5 to 24 hr) in shoots and roots (Zeller et al., 2009). Gene names are listed on the right. Blue indicates down-regulation and yellow indicates up-regulation by hyperosmotic stress.
Figure 5—figure supplement 4
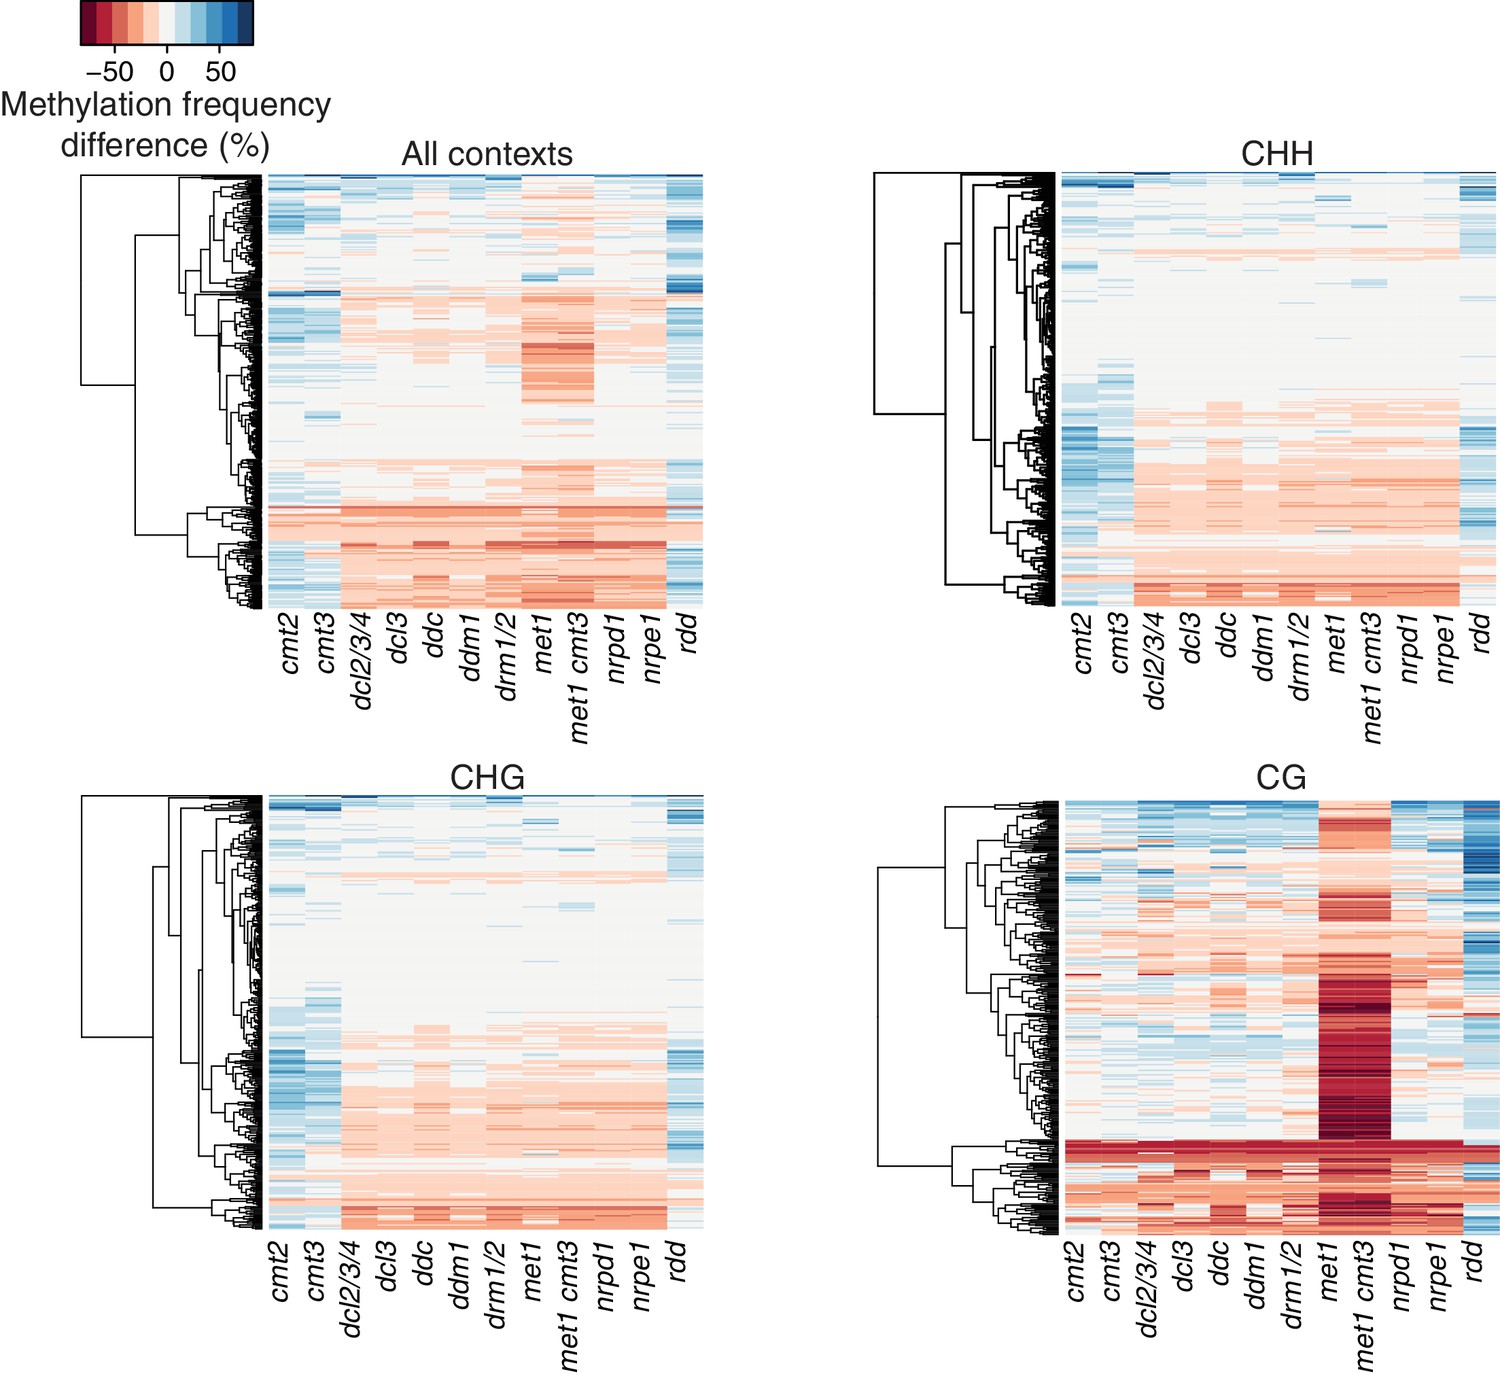
Methylation profiles of HS-DMRs in DNA methylation and demethylation Arabidopsis mutants.
Heatmap of methylation frequency differences in HS-DMRs in different methylation contexts in twelve epigenetic mutants; original data from Stroud et al. (2013).
Figure 6 with 3 supplements
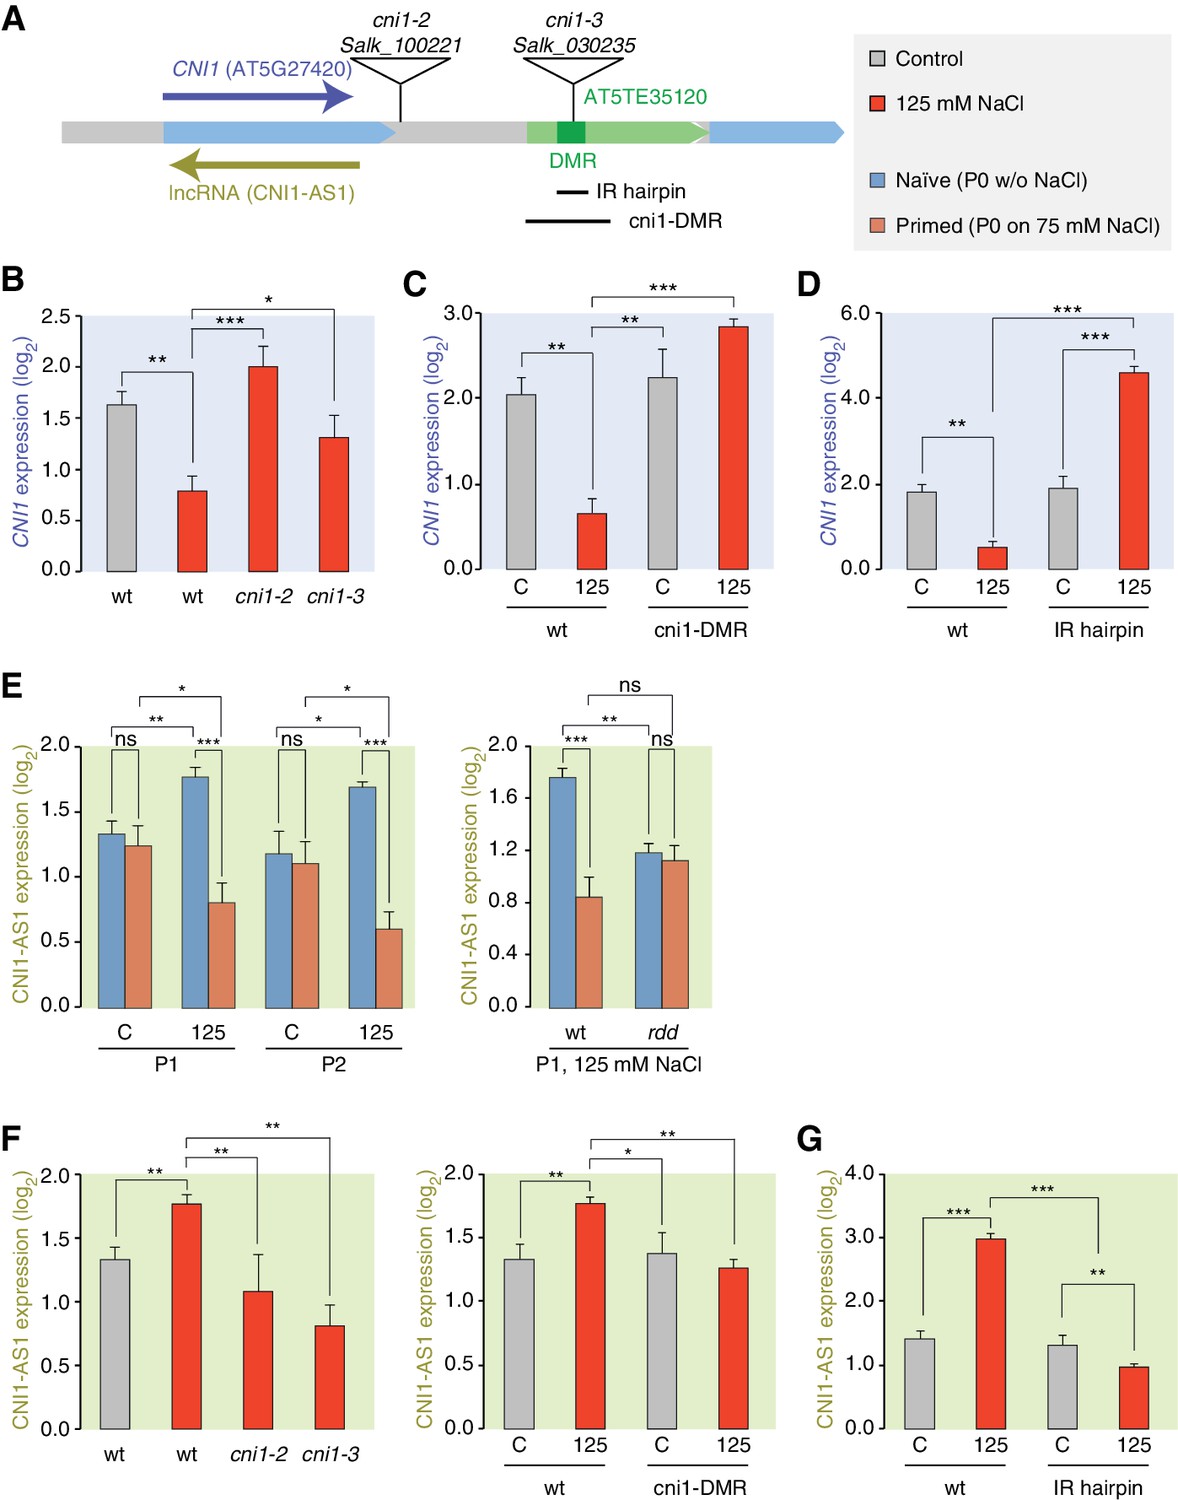
lncRNA-mediated control of CNI1 expression by a salt-induced DMR.
(A) Diagram of the CNI1 locus and key for expression experiments. Positions of insertion alleles, cni1-2 (Salk_100221) and cni1-3 (Salk_030235), are indicated, as are the DMR (dark green) in the transposable element (AT5TE35120) downstream of CNI1, the sequence used for the inverted repeat (IR) hairpin to induce methylation independent of the environment, and the CRISPR/Cas9 created deletion Δcni1-DMR (cni1-DRM). (B, C, D) Salt-responsive CNI1 expression in wild type and T-DNA insertion mutants, CRISPR/Cas9 deletion mutants, and IR hairpin transgenic plants. Asterisks indicate significant differences relative to controls (unpaired Student’s t-test; *p<0.05, **p<0.01, ***p<0.001, ns p>0.05). Error bars indicate standard deviation. C, control; 125, 125 mM NaCl. (E) Salt-responsive lncRNA expression in progeny of naïve or salt-treated wild type and in rdd mutants. (F, G) Salt-responsive lncRNA expression in wild type and T-DNA insertion mutants, CRISPR/Cas9 mutants, and IR hairpin transgenic plants.
Figure 6—figure supplement 1
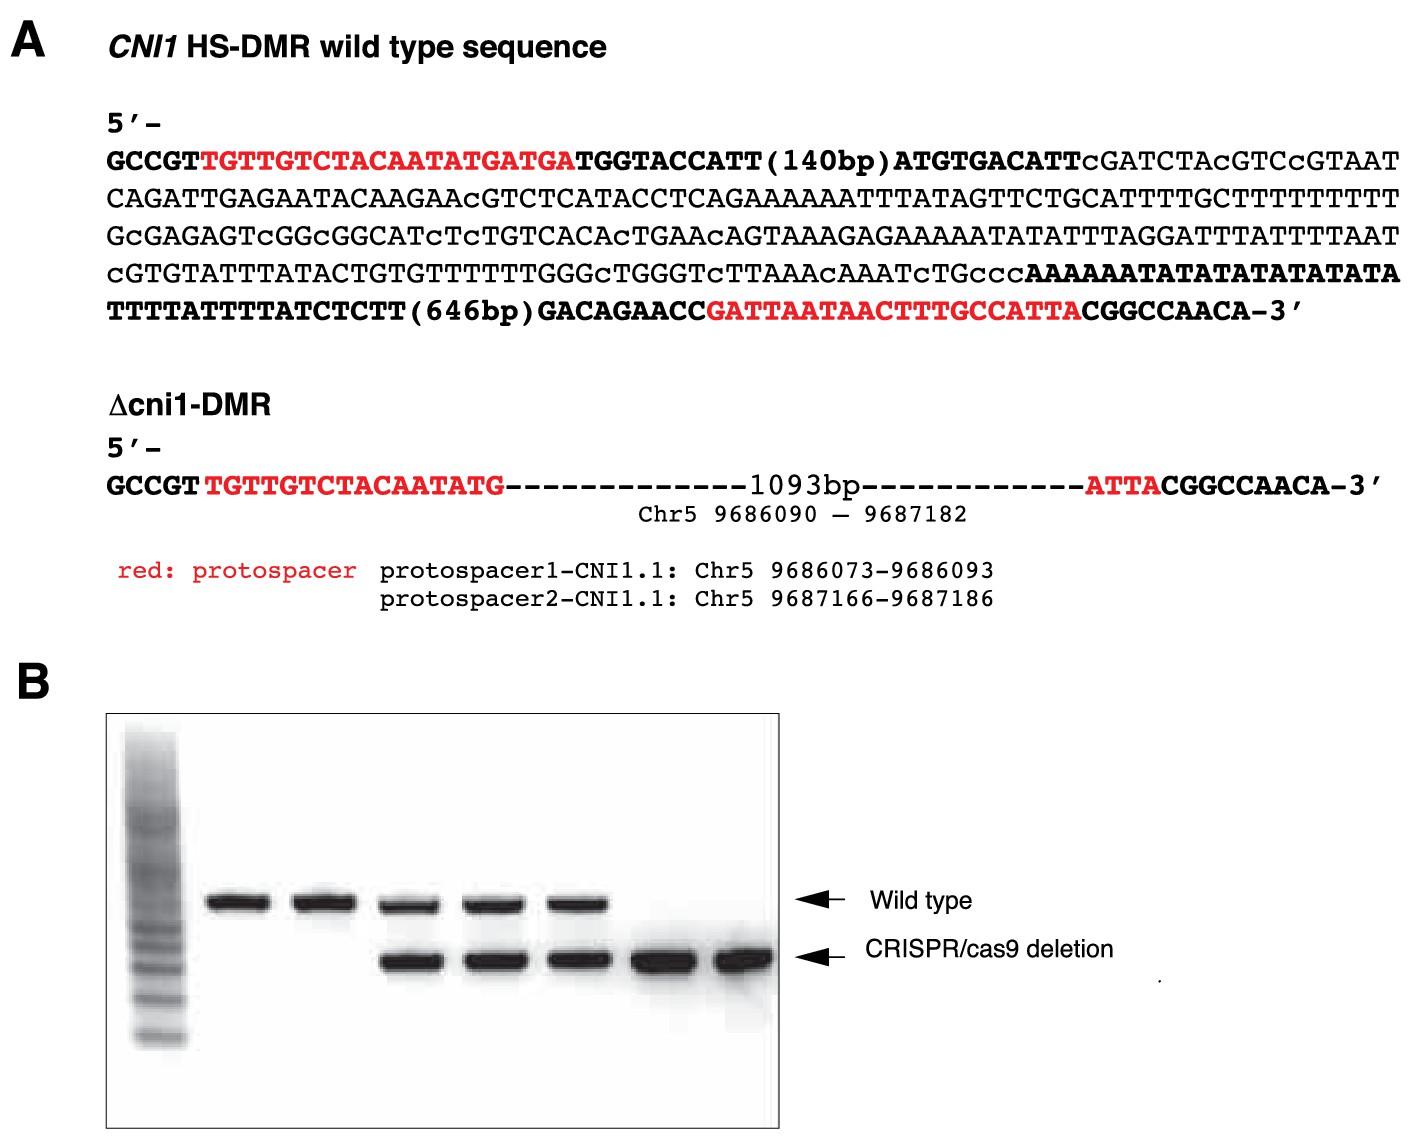
Generation of CRISPR/Cas9 deletions at the CNI1 HS-DMR region.
(A) Sequence of the flanking CNI1 HS-DMR selected for targeted genome editing (methylated cytosines in lower case) and sequence of the CNI1 HS-DMR deletion line generated by CRISPR/Cas9 genome editing. (B) PCR amplicons from genomic DNA of plants segregating for wild type sequence and Δcni1 HS-DMR.
Figure 6—figure supplement 2
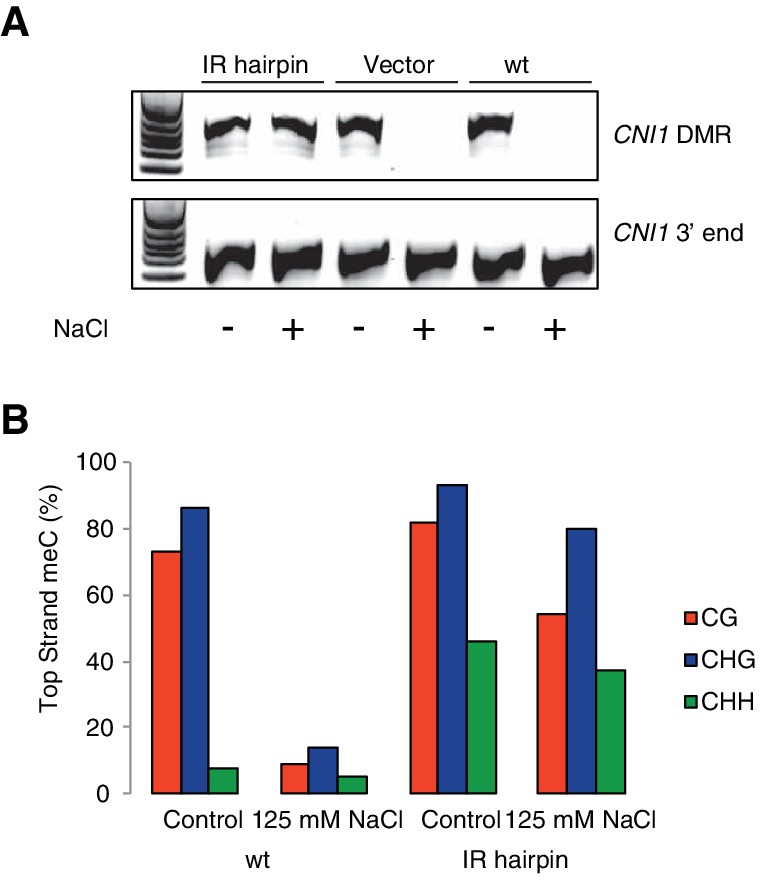
Methylation analysis of hairpin lines directing RdDM hypermethylation at the CNI1 HS-DMR.
(A) CHOP-PCR assay demonstrating that the HS-DMR downstream of CNI1 remains methylated in IR hairpin lines after exposure to hyperosmotic stress. A flanking region not was used as PCR control. (B) Targeted bisulfite sequencing (15 clones each) of the CNI1 HS-DMR in wild type and IR hairpin lines grown with and without 125 mM NaCl.
Figure 6—figure supplement 3
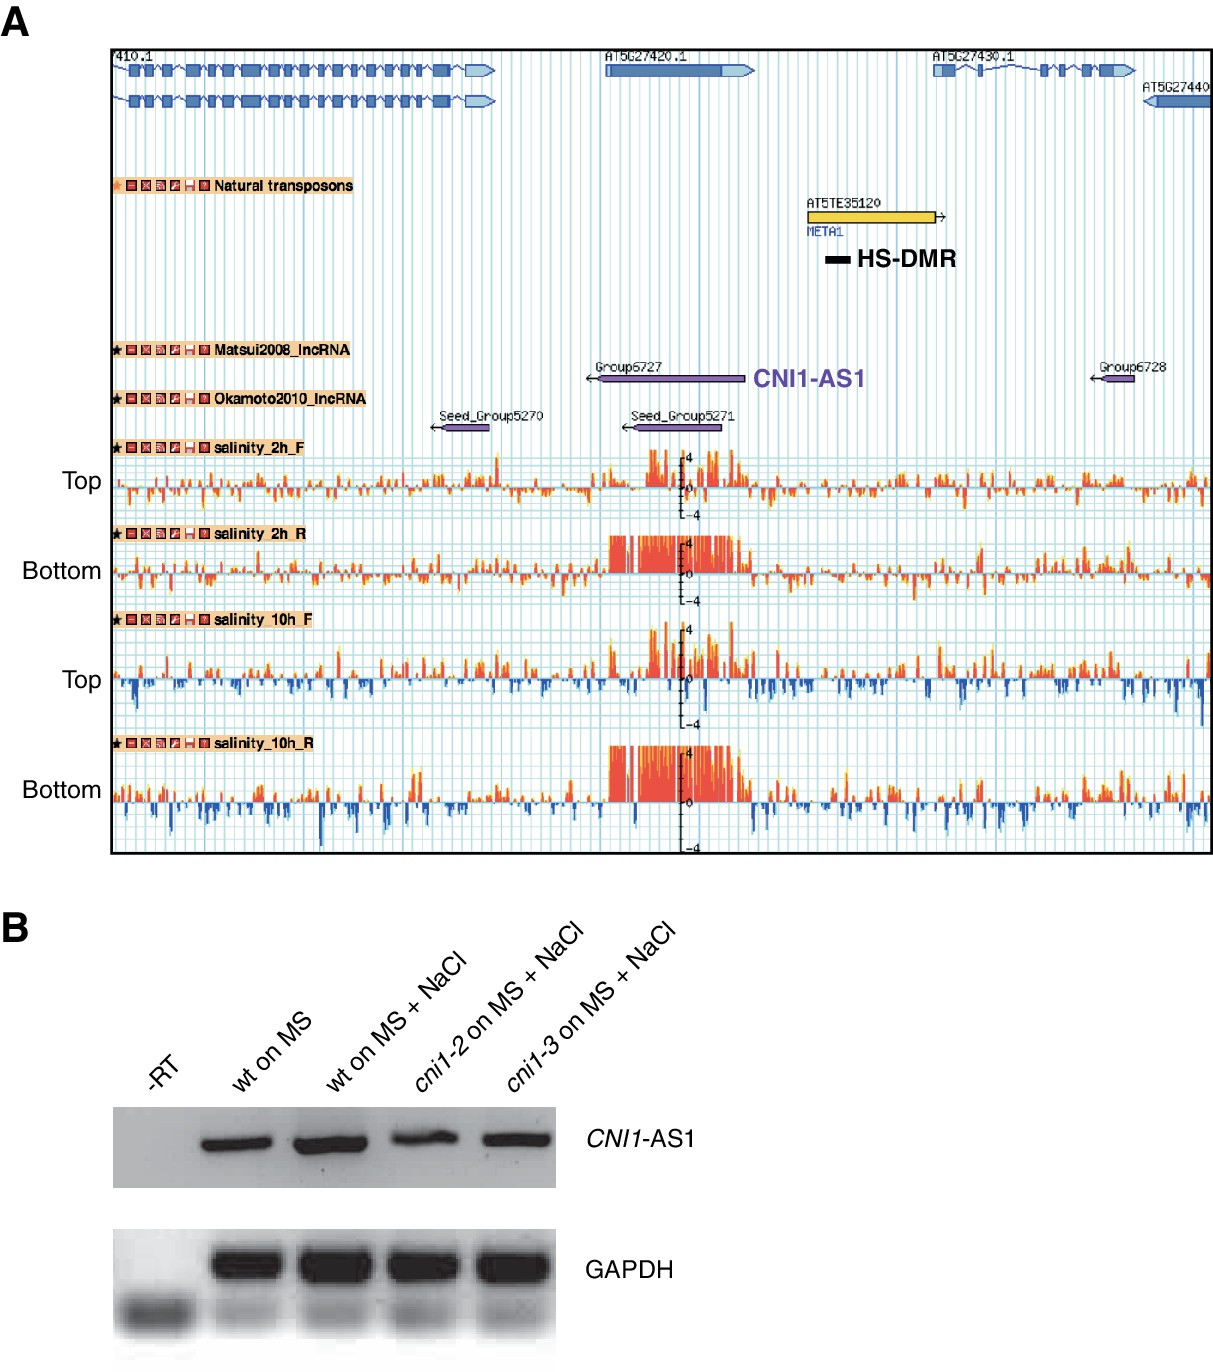
Expression analysis of CNI1 antisense lncRNA transcripts in response to hyperosmotic stress.
(A) Genome browser view of the genomic region flanking CNI1 (At5g27420). Tracks represent gene annotations (blue), transposons (yellow) and HS-DMR (black), lncRNAs (purple) and normalised signal of tilling arrays hybridized with labelled RNA extracted from plants exposed to 125 mM NaCl for 2 and 10 hr (red and blue bars). Signal corresponding to top and bottom strands are indicated (Jin et al., 2013). (B) CNI1 antisense lncRNAs expression (RT-PCR) after exposure to hyperosmotic stress. NaCl, 125 mM NaCl.
Figure 7

Working model for stress-dependent epigenetic regulation of CNI1.
In wild type, demethylation of a DMR in response to hyperosmotic stress stimulates lncRNA expression (CNI1-AS1), which in turn causes downregulation of CNI1 expression by an unknown mechanism. In insertion and deletion mutants, upregulation of the CNI1-AS1 is reduced, impairing the salt-dependent reduction in CNI1 expression. In IR hairpin lines, salt-induced DMR demethylation is countered by forced methylation triggered by the IR hairpin. RdDM, RNA directed DNA methylation activity; RDD, DNA demethylation activity. Black/open lollipops signify methylated/unmethylated cytosines.
Tables
Table 1
Association between differential DNA methylation induced by hyperosmotic stress and histone modifications (Sani et al., 2013).
https://doi.org/10.7554/eLife.13546.014| Chromatin mark | Hypo HS-DMRs | Hyper HS-DMRs | MRs |
|---|---|---|---|
| All | 70 | 280 | 72,074 |
| H3K4me2 (650/98) | 0/0 | 3/0 | 508/155 |
| H3K4me3 (1454/46) | 4/0 | 8/0 | 1065/40 |
| H3K9me3 (276/254) | 0/0 | 0/0 | 484/920 |
| H3K27me3 (1213/6520) | 3/15 | 7/99 | 1318/7774 |
-
Intersections between high salt-induced DMRs (HS-DMRs), MRs and different chromatin marks (Sani et al., 2013). The two numbers behind each mark indicate significantly increased or decreased regions after hyperosmotic stress (Sani et al., 2013).
Additional files
-
Supplementary file 1
Phenotypic data.
- https://doi.org/10.7554/eLife.13546.028
-
Supplementary file 2
Methylation sequencing statistics.
- https://doi.org/10.7554/eLife.13546.029
-
Supplementary file 3
Differentially methylated positions (DMPs).
- https://doi.org/10.7554/eLife.13546.030
-
Supplementary file 4
Differentially methylated regions (DMRs).
- https://doi.org/10.7554/eLife.13546.031
-
Supplementary file 5
Genes in proximity of HS-DMRs.
- https://doi.org/10.7554/eLife.13546.032
-
Supplementary file 6
Intersection between stress-induced lncRNAs and HS-DRM associated genes.
- https://doi.org/10.7554/eLife.13546.033
-
Supplementary file 7
List of oligonucleotides employed in PCR analyses.
- https://doi.org/10.7554/eLife.13546.034
-
Supplementary file 8
Scoring matrix for assessing cytosine site statistics.
- https://doi.org/10.7554/eLife.13546.035
Download links
A two-part list of links to download the article, or parts of the article, in various formats.
Downloads (link to download the article as PDF)
Open citations (links to open the citations from this article in various online reference manager services)
Cite this article (links to download the citations from this article in formats compatible with various reference manager tools)
Hyperosmotic stress memory in Arabidopsis is mediated by distinct epigenetically labile sites in the genome and is restricted in the male germline by DNA glycosylase activity
eLife 5:e13546.
https://doi.org/10.7554/eLife.13546


