Critical role for the mediodorsal thalamus in permitting rapid reward-guided updating in stochastic reward environments
- Imperial College London, United Kingdom
- Oxford University, United Kingdom
Figures
Figure 1
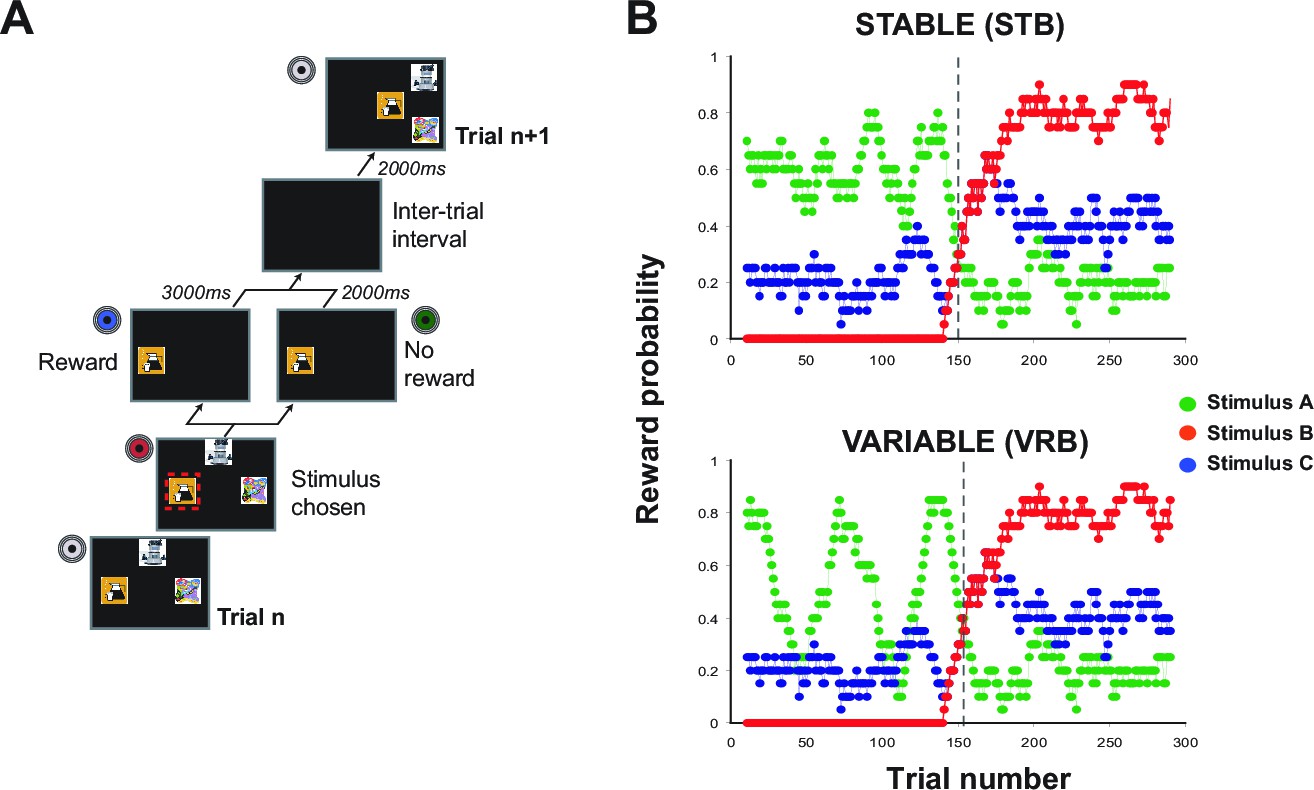
Task design.
(A) Schematic of a single trial. At the start of each trial, 3 stimuli were presented on the screen in one of four spatial configurations. Monkeys chose a stimulus by touching its location on the screen. Once selected, the alternative options disappeared and reward was or was not delivered according to a pre-determined schedule (note that the red box is shown for illustration only, but was not presented during testing). Following an intertrial interval, the next trial would begin. (B) Schematic of two varying schedules, 'Stable' (upper panel) and 'Variable' (lower panel), showing the running average probability (across 20 trials) during a session that selecting that option would result in reward.
Figure 2 with 1 supplement
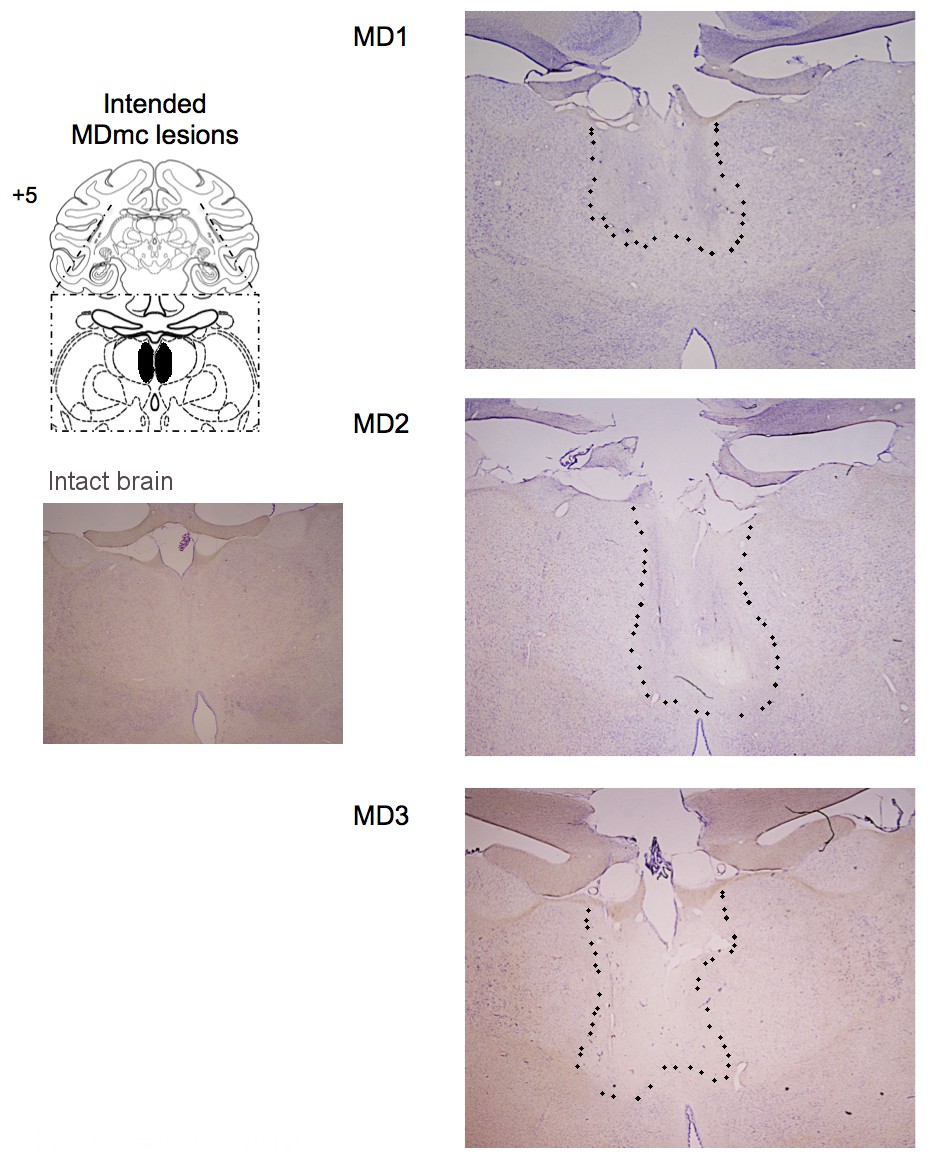
Histological reconstruction of the MDmc lesions.
Coronal sections (right) corresponding to the schematic diagram (left) with lesion detailed (dotted outline) for the bilateral magnocellular mediodorsal thalamic neurotoxic lesions (MDmc) for the three monkeys, MD1, MD2 and MD3. A corresponding coronal section from an intact monkey has been included for comparison.
Figure 2—figure supplement 1
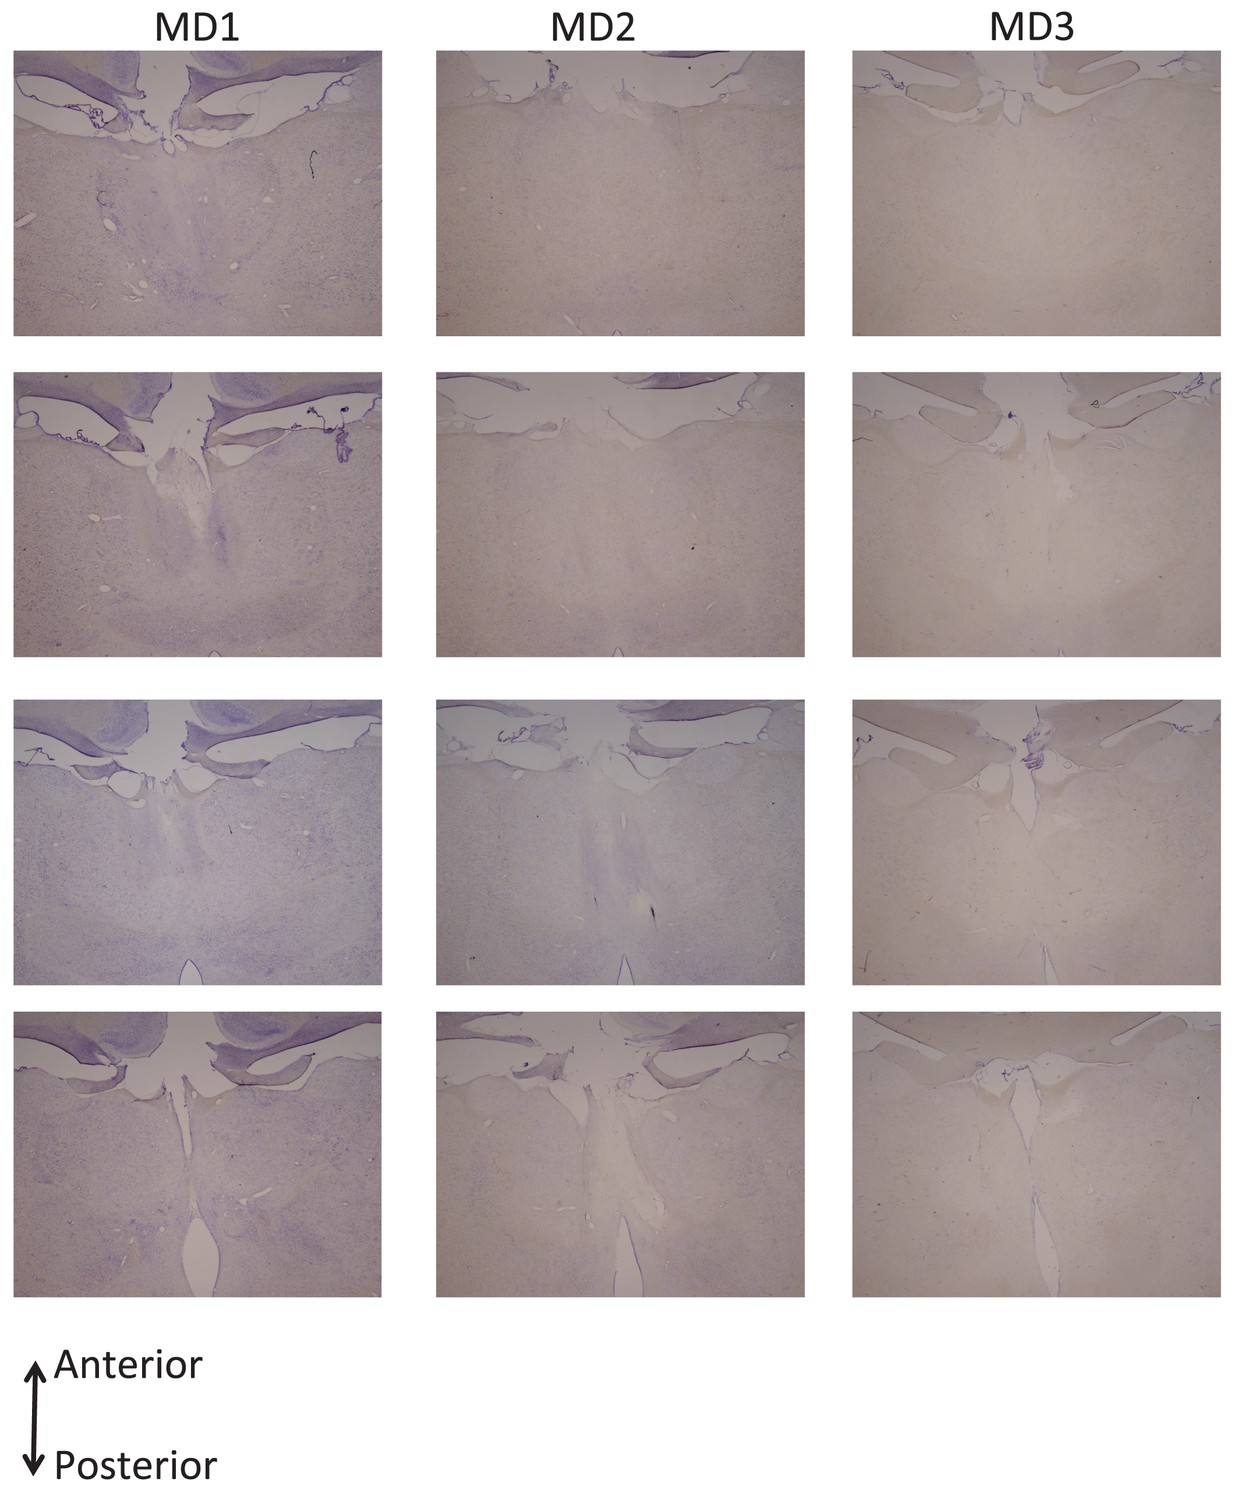
Histological documentation of the MDmc lesions.
Additional coronal sections documenting the bilateral magnocellular mediodorsal thalamic neurotoxic lesions for the three monkeys: MD1, MD2 and MD3.
Figure 3 with 1 supplement
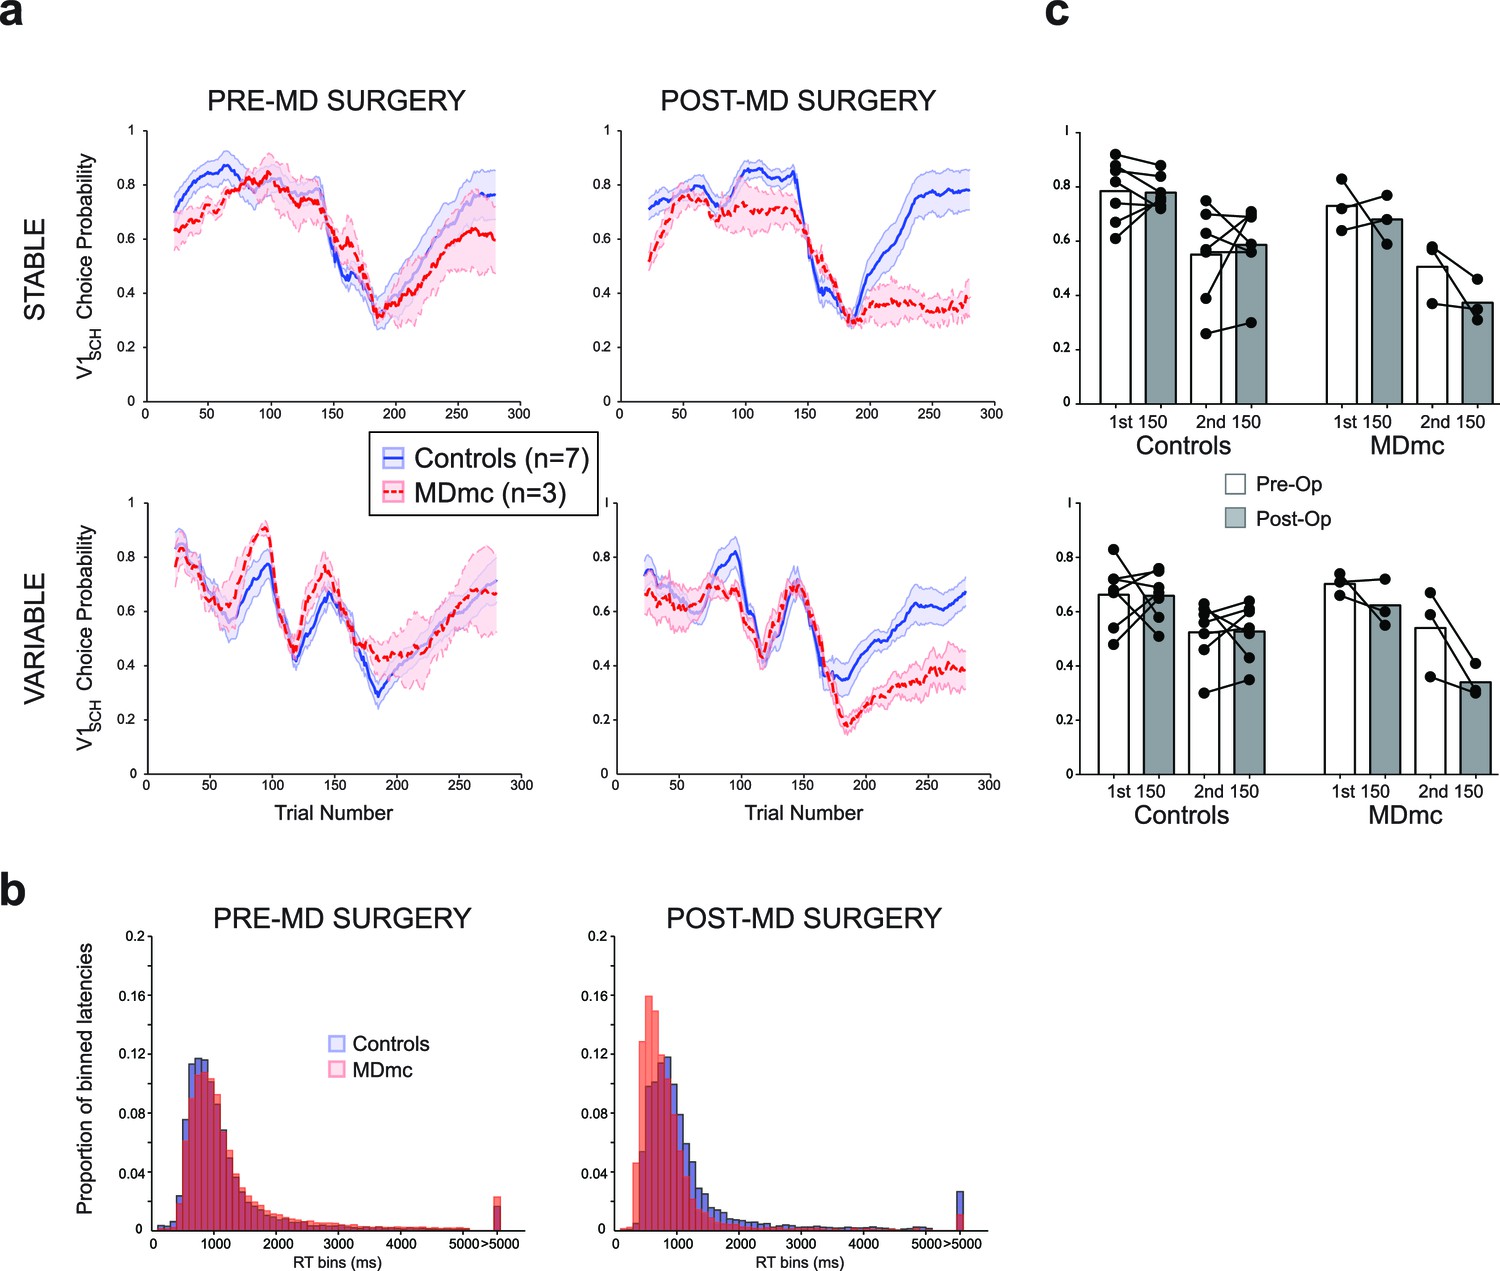
Choice performance and latencies on the varying schedules.
(a) Mean proportion of choices ( ± S.E.M.) of the V1sch in the control and MDmc groups both pre- and post-operatively. Left and center panel depict group average choices over the whole session (Controls = blue filled line, MDmc = red dashed line); (c) right panel depicts choices divided into the first and last 150 trials (dots = individual monkey’s choices). (b) Proportion of trial-by-trial choice response times grouped into 100 ms bins for the controls (blue bars) or MDmc monkeys (red bars).
Figure 3—figure supplement 1
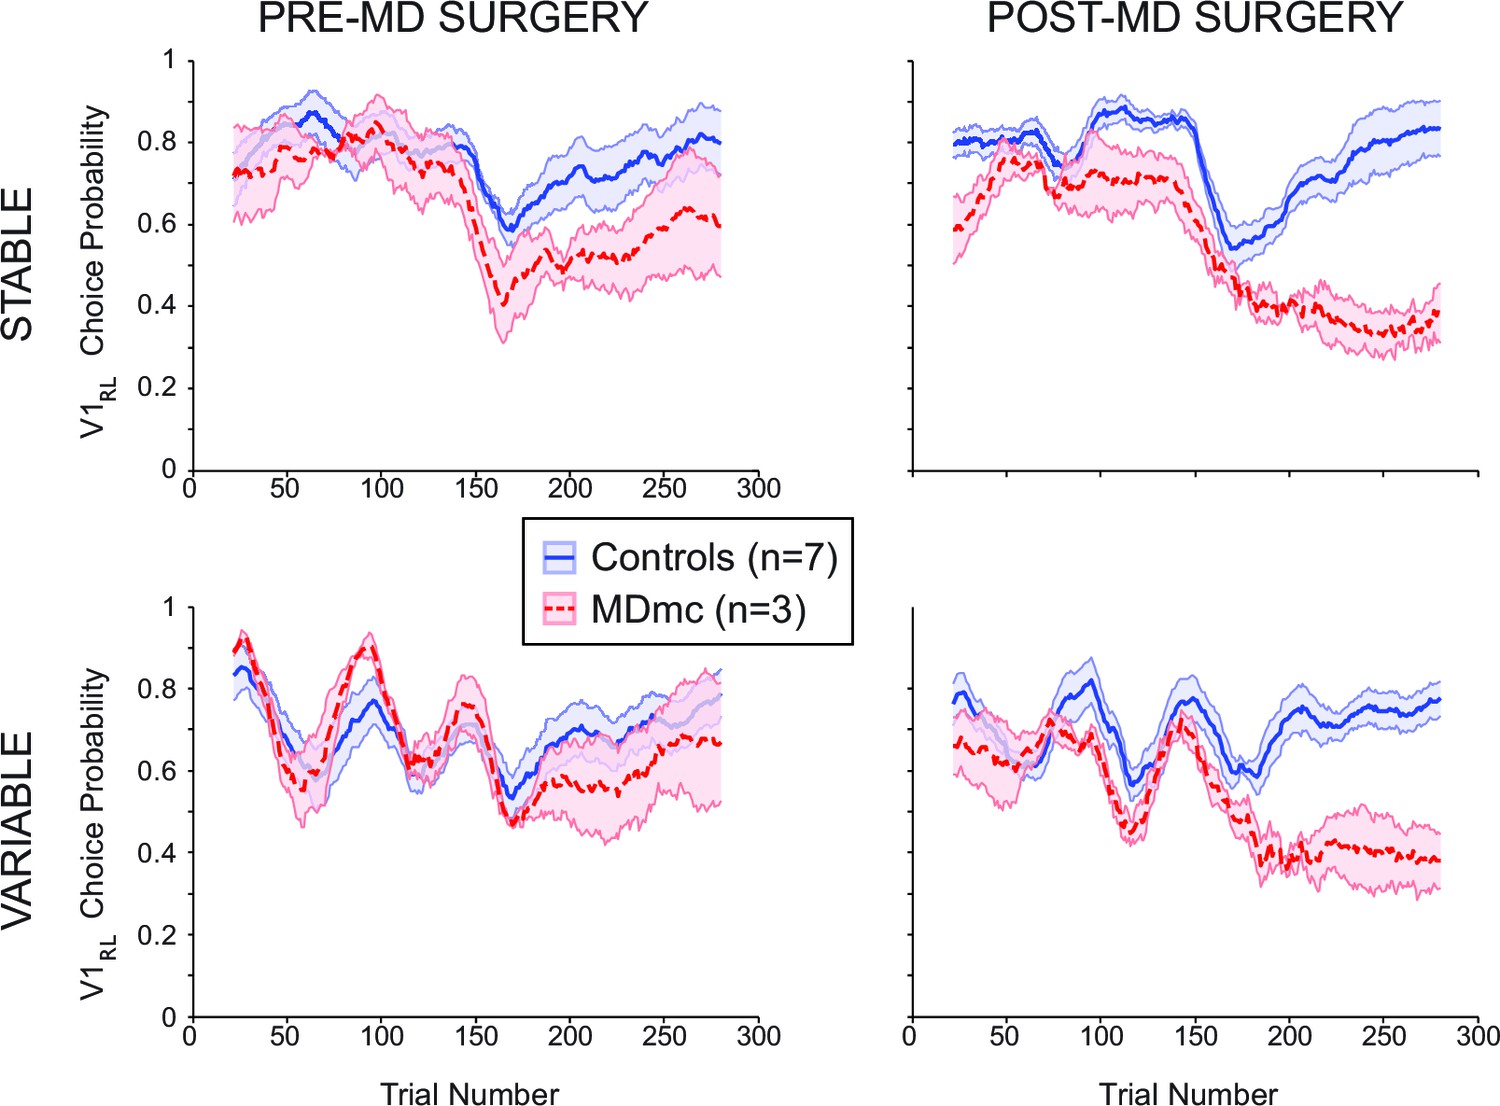
Choice performance and latencies on the varying schedules for the subjective values.
Mean proportion of choices ( ± S.E.M.) of the V1RL in the control and MDmc groups (Controls = blue filled line, MDmc = red dashed line) both pre- and post-operatively. Left panel depicts group average choices over the whole session prior to the MDmc surgery; right panel depicts choices post the MDmc surgery.
Figure 4
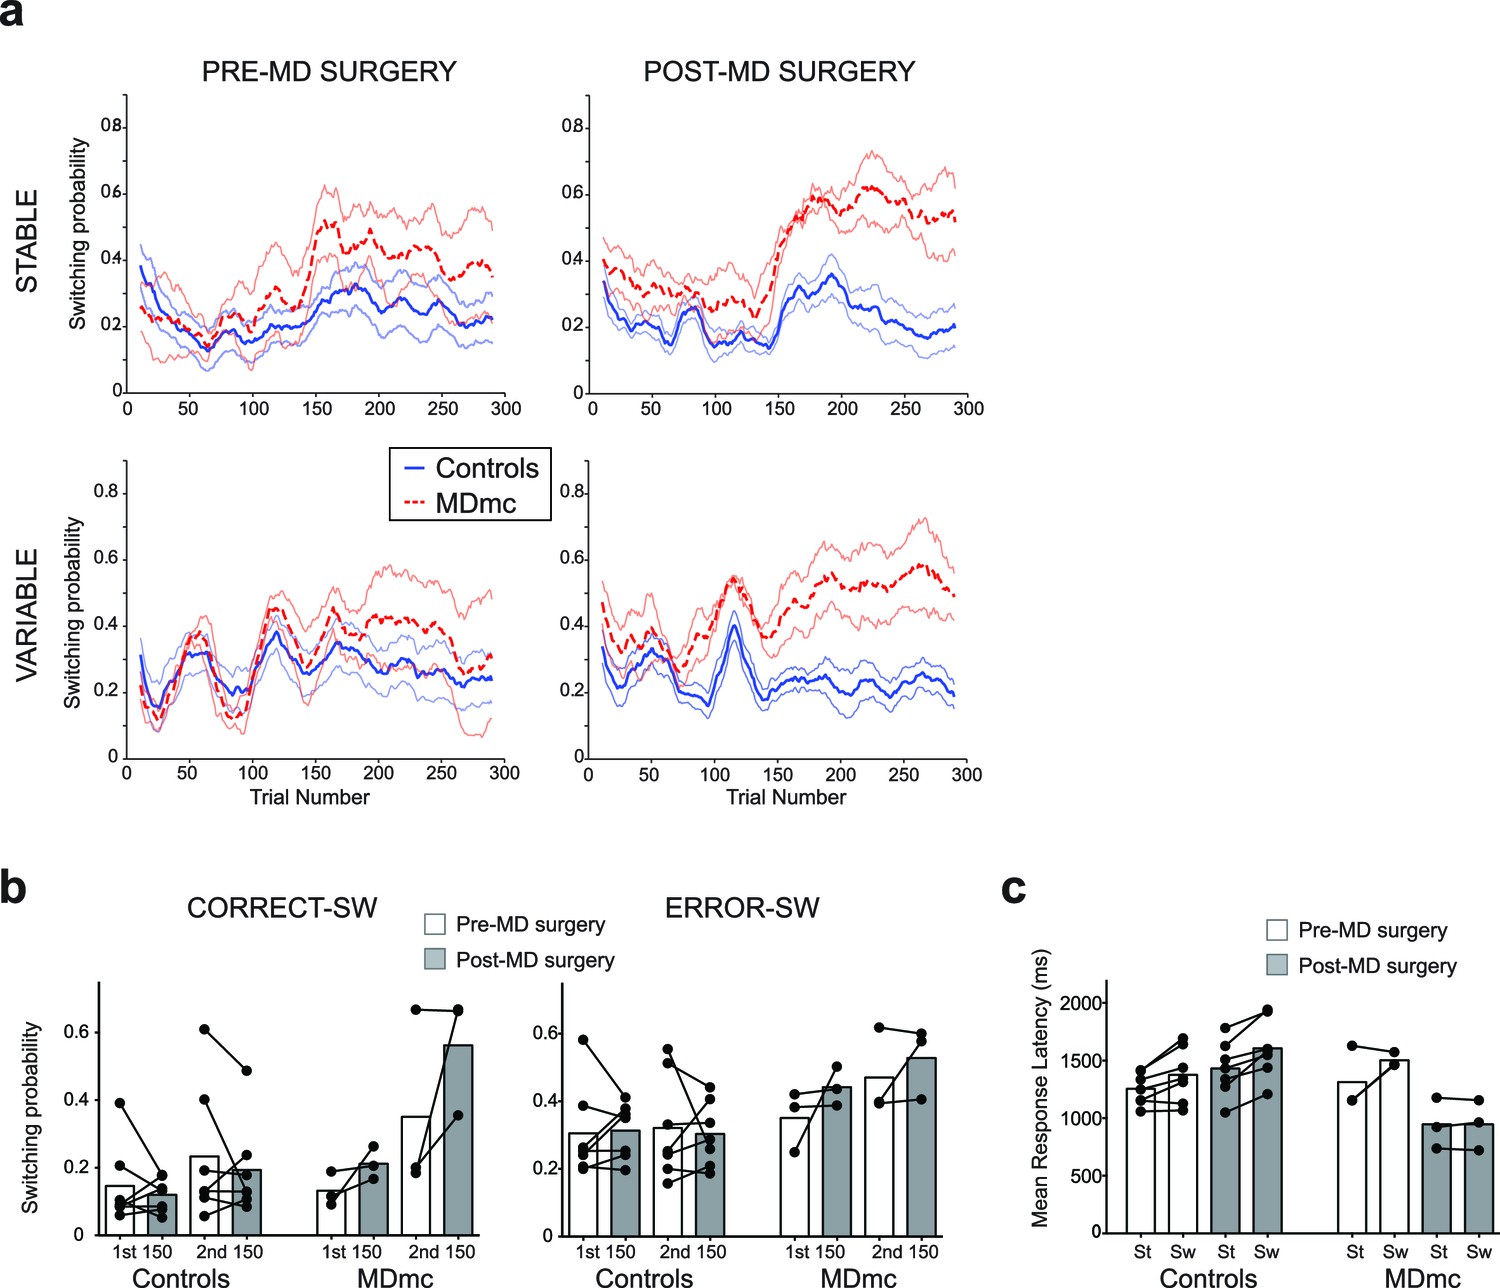
Switching behavior in the control and MDmc lesioned monkeys.
Mean likelihood of switching to a different stimulus in the two groups both pre- and post-operatively (a) throughout each schedule (mean ± S.E.M.) or (b) divided up into switches (SW) following a choice leading to a reward (CORRECT–SW) or to no reward (ERROR–SW) (dots = individual monkey’s switching probabilities). (c) Mean response latency in each animal following a repeated choice of the same stimulus (‘St’) or a switch to a different stimulus (‘Sw’) in the two groups (dots = individual monkey’s latencies). Note that two MDmc monkeys had very similar latencies pre-operatively and so their data is overlapping.
Figure 5

Influence of recent choice history over subsequent choices.
(a–c) Differential likelihood (mean ± S.E.M. across monkeys) of repeating a ‘B’ choice (a), switching back to option ‘A’ (b) or switching away to option ‘C’ (c) after a ‘B’ choice made on trial n-1 either was rewarded or was not rewarded. Data are plotted in runs following a switch to ‘B’ as a function of the recent choice history: just one choice of a different ‘A’ stimulus on trial n–2 (‘A1B?’), two choices of ‘A’ on trials n–2 and n–3 (‘A2B?’), three choices of ‘A’ on trials n–2 to n–4 (‘A3B?’) or four to seven choices of ‘A’ on trials n–2 to n–5–8 (‘A4-7B?’). ‘A’ and ‘B’ do not refer to particular stimulus identities but instead to arbitrary choices of one option or another. Main plots show Controls (blue lines) and MDmc (red lines), filled lines = pre-MDmc surgery; dashed lines = post-MDmc surgery. Insets (green lines) depict data from lateral OFC (LOFC) lesioned animals taken from a previous experiment reported in Walton et al. (2010). (d) Differential likelihood (mean ± S.E.M. across monkeys) of repeating a ‘B’ choice after a reward or no reward plotted as a function of the number of times option ‘B’ was selected in the 5 previous trials (n–2 to n–6). Controls = blue lines; MDmc = red lines; Pre-MDmc surgery = filled lines; Post-MDmc surgery = dashed lines.
Figure 6
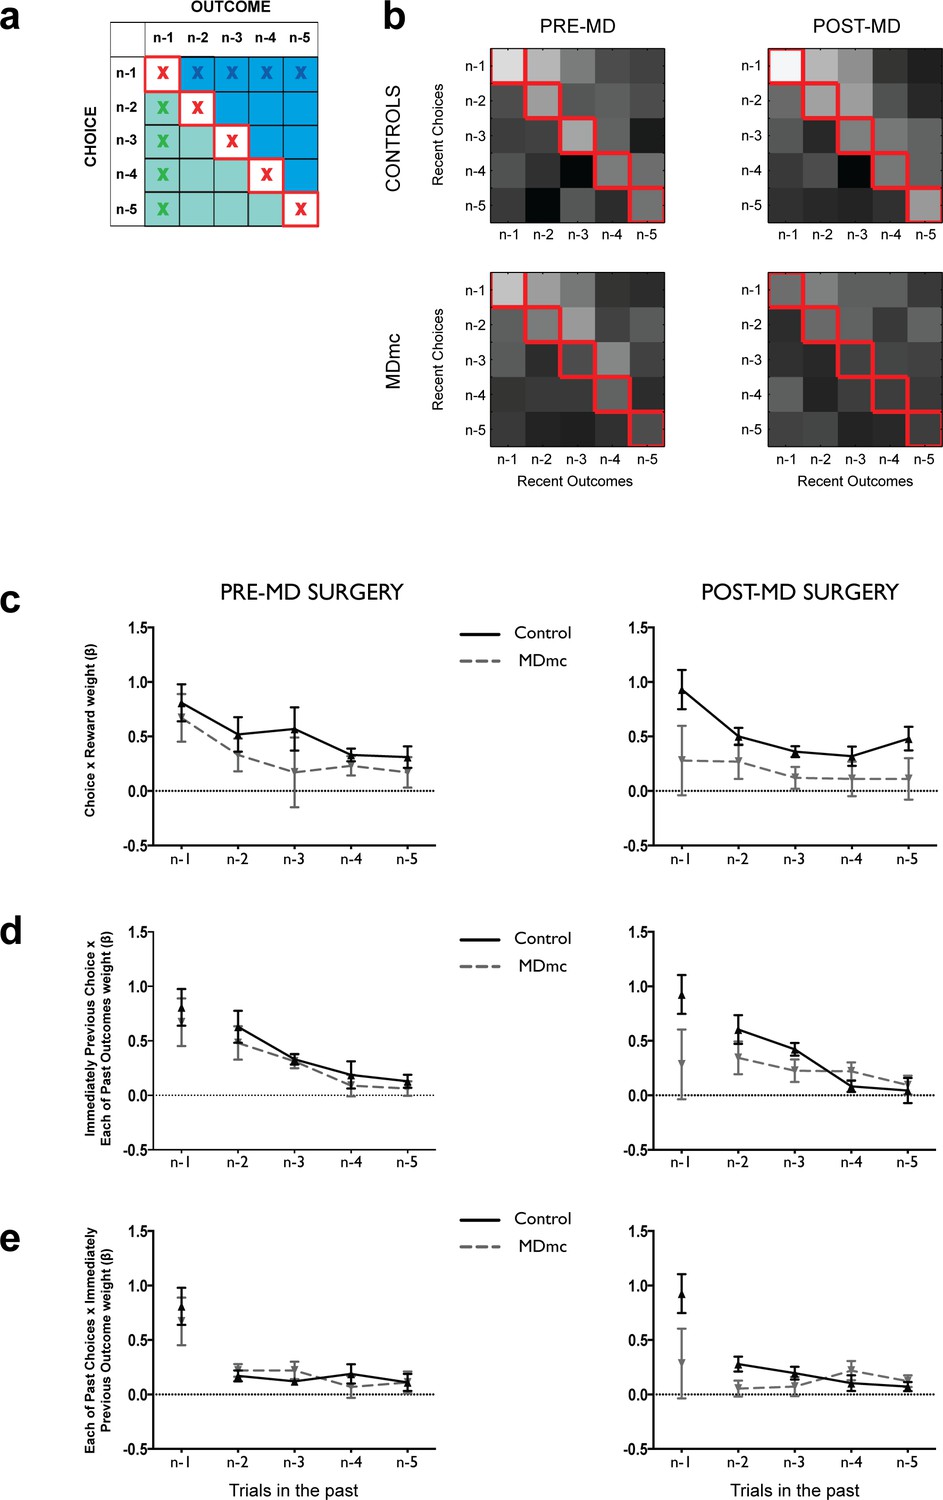
Logistic regression on the influence of combinations of recent choices and recent outcomes.
(a) Representation of the design matrix used in the logistic regression consisting of all combinations of the five previous choices (rows) and five previous outcomes (columns). The white squares on the diagonal with red crosses represents the influence of correct contingent learning – choice x outcome combinations; the blue area represents the non-contingent influence of a past outcome spreading forwards to influence more recent choices; the green area represents the non-contingent influence of more recent outcome spreading backwards to associate with an earlier choice. (b) Regression weights averaged across the controls and MDmc groups for choices of each of the 3 potential stimuli pre- and post-MD surgery (lighter shades = larger average regression weights; values have been log transformed for ease of visualization). (c–e) Regression weights (mean ± S.E.M. across monkeys, arbitrary units) for trials n–1 to n–5 for the contingent choice x outcome pairs (corresponding to the red crosses in a) (c), past choice x all previous outcomes (middle panel, blue crosses in panel a) (d), and past outcome x all previous choices (lower panel, green crosses in panel a) (e).
Figure 7
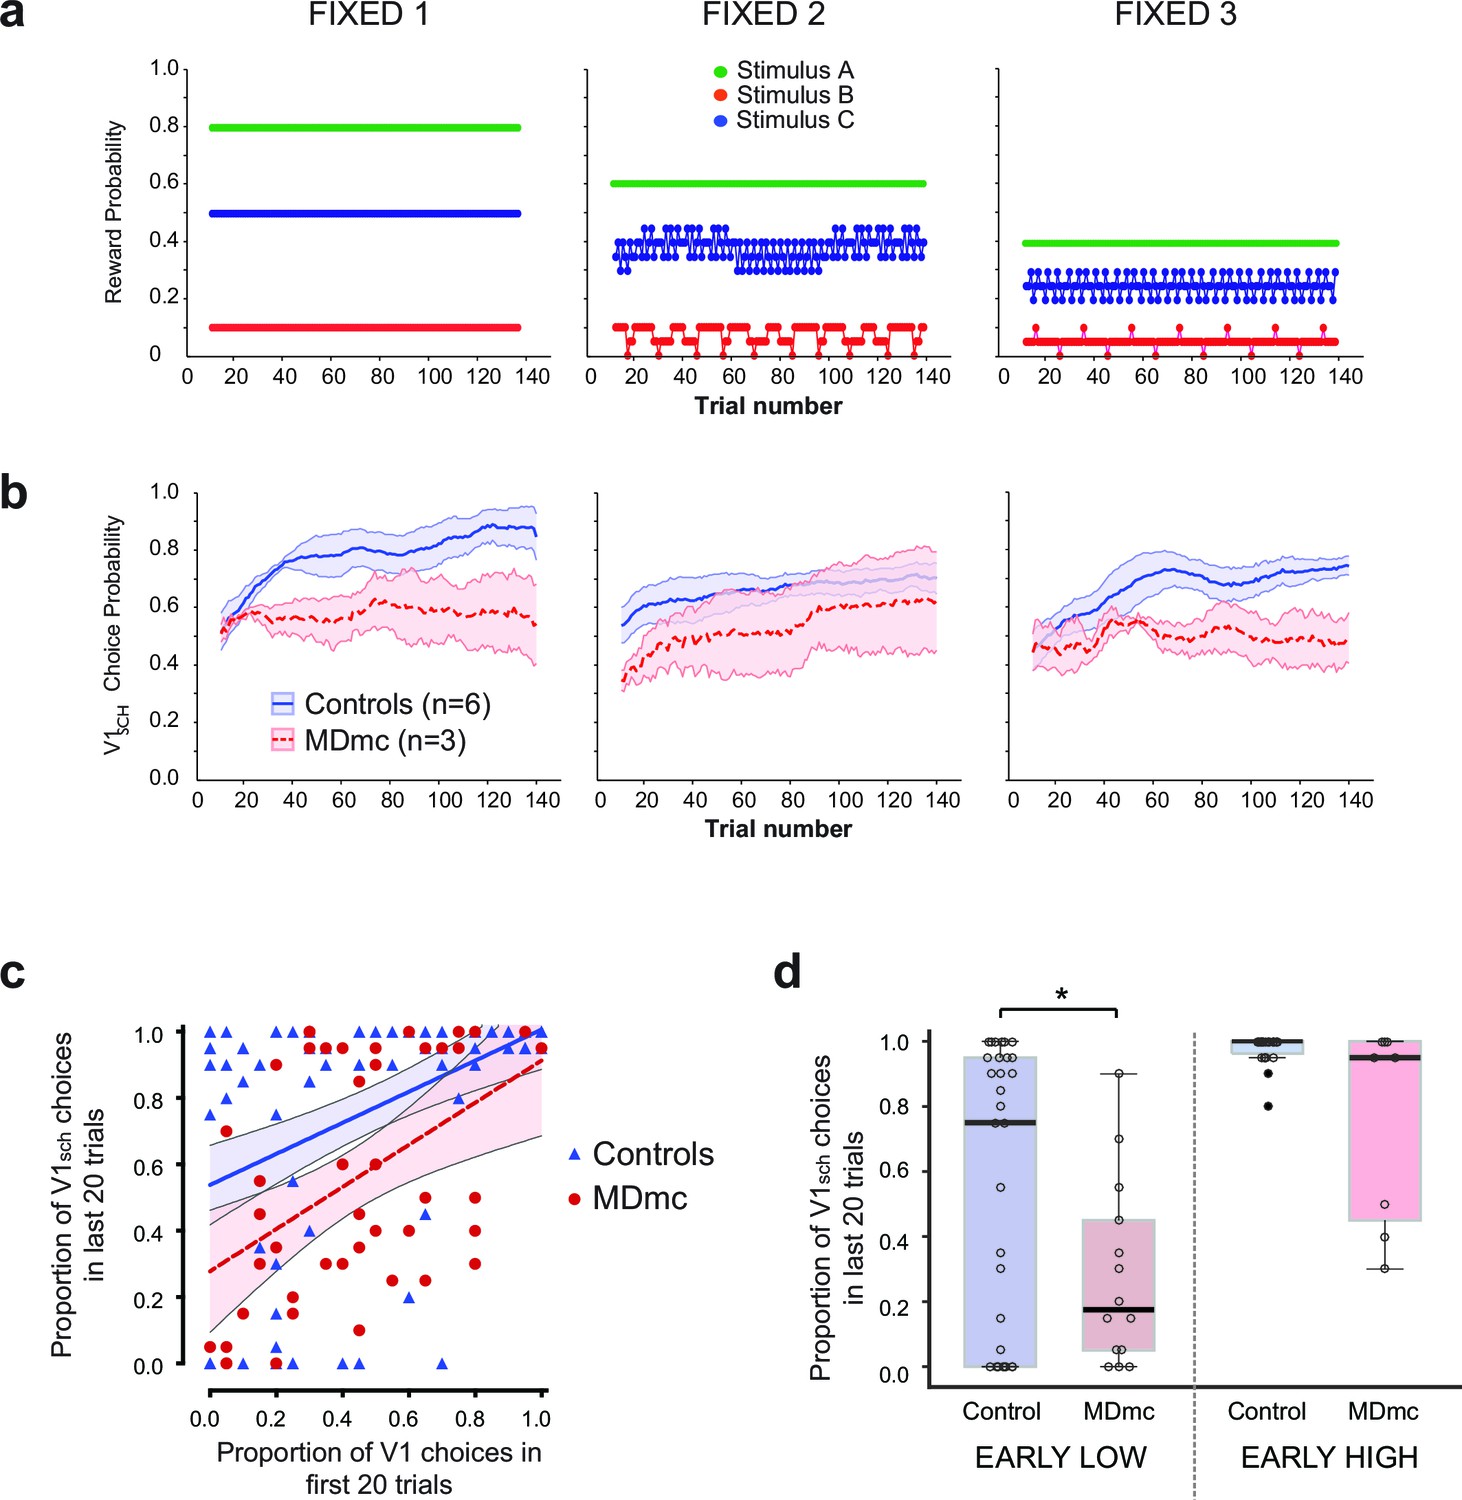
Fixed schedule performance.
(a–b) Schematic of Fixed schedules (upper panels, a) and average proportion of choices ( ± S.E.M.) of the V1sch in the control and MDmc groups in each schedule (lower panels, b). (c) Proportion of V1sch choices in the first and last 20 trials in each session for each animal, plotted along with the best-fit linear regression and 95% confidence limits for each group (Controls or MDmc). (d) Box plots showing average proportion V1sch choices in the last 20 trials for sessions in which animals made a low number of V1sch choices in the first 20 trials (≤25% V1sch choices; 'EARLY LOW') or a high number of V1sch choices in the first 20 trials (≥75% V1sch choices; 'EARLY HIGH'). For all box plots, the central mark is the median, the edges of the box are the 25th and 75th percentiles, and the whiskers extend to the most extreme data points not treated as outliers. (*p<0.05, Independent Samples Kolmogorov-Smirnov Test, treating each session as an independent sample.)
Author response image 1
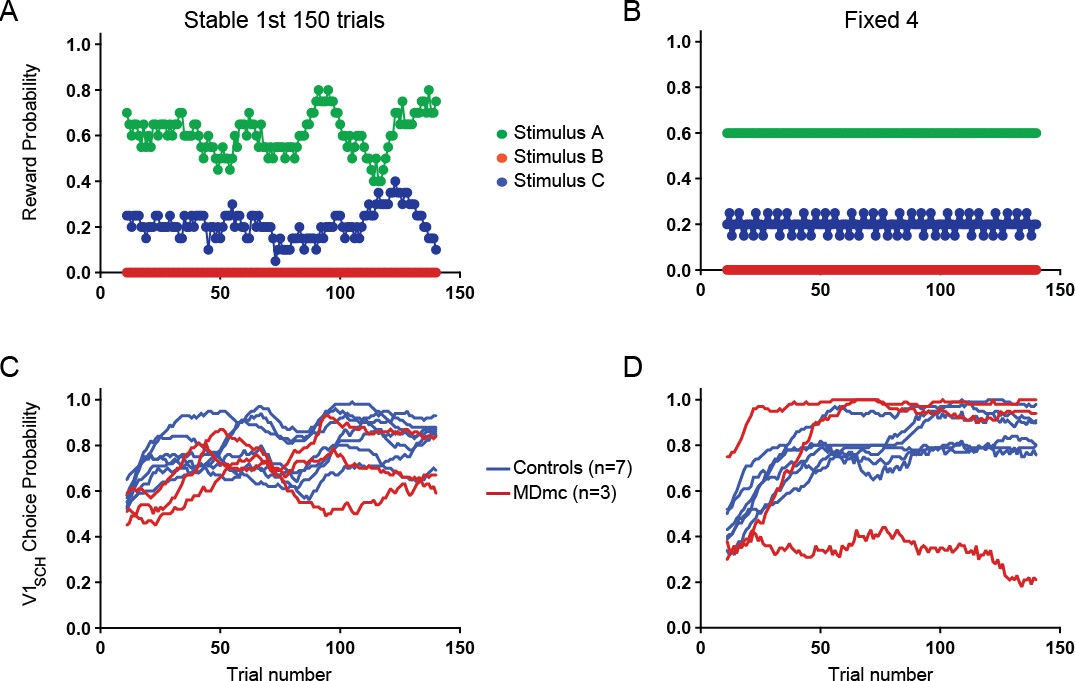
Comparison between choice performance during initial learning period of Stable with an equivalent “Fixed” condition.
Reward probabilities for choosing each option during the 1st 150 trials of Stable (A) and an equivalent Fixed schedule (B) and individual animals’ average proportion of V1sch choices in these schedules (Stable, C; Fixed, D).
Author response image 2
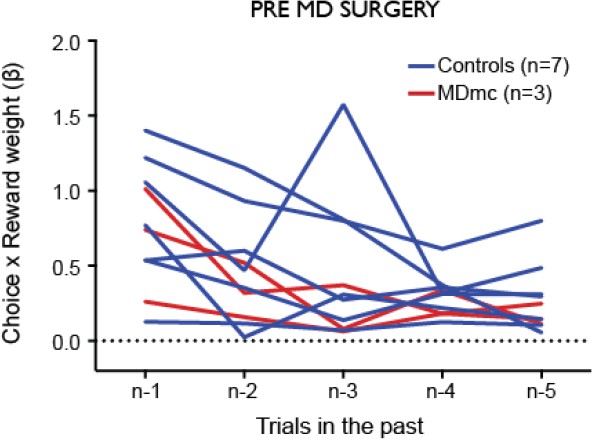
Influence of contingent recent choice – outcome pairs on the current choice.
https://doi.org/10.7554/eLife.13588.013
Author response image 3
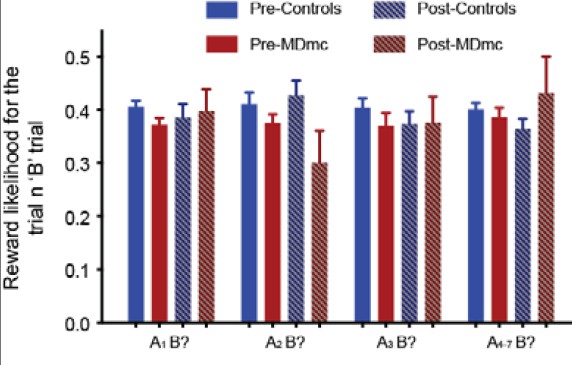
Probability of reward on the ‘B?’ trial as a function of recent reward history.
There were no differences between the groups (all F < 1.54, p > 0.23).
Download links
A two-part list of links to download the article, or parts of the article, in various formats.
Downloads (link to download the article as PDF)
Open citations (links to open the citations from this article in various online reference manager services)
Cite this article (links to download the citations from this article in formats compatible with various reference manager tools)
Critical role for the mediodorsal thalamus in permitting rapid reward-guided updating in stochastic reward environments
eLife 5:e13588.
https://doi.org/10.7554/eLife.13588


