The glyoxylate shunt is essential for desiccation tolerance in C. elegans and budding yeast
- Max Planck Institute of Molecular Cell Biology and Genetics, Germany
- Institute for Stem Cell Biology and Regenerative Medicine, India
Figures
Figure 1 with 1 supplement
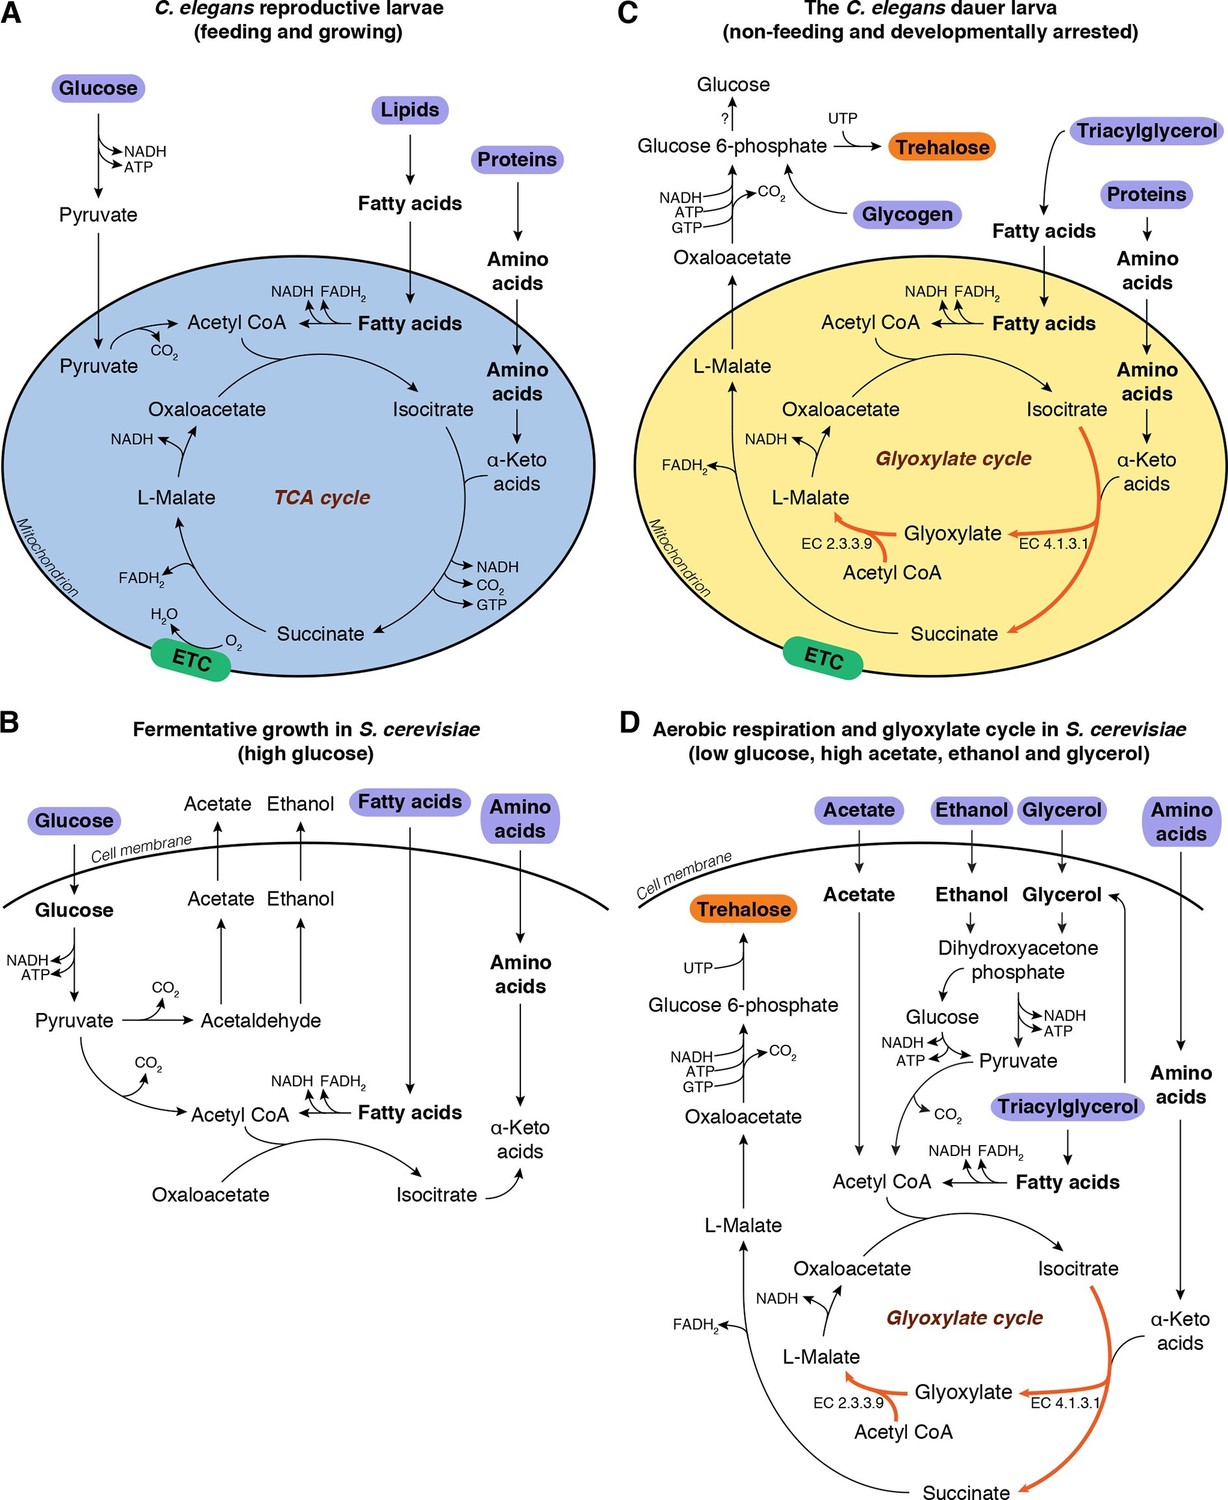
Metabolic modes of C. elegans and S. cerevisiae.
(A) C. elegans reproductive larvae, which are feeding and growing, can utilize nutrients (purple) via TCA cycle and produce energy. Mitochondria are in a catabolic mode (blue). (B) During fermentative growth, S. cerevisiae uses glucose to produce energy via glycolysis. (C) The non-feeding dauer larva utilizes internal TAG reserves via GS to drive gluconeogenesis and produce trehalose (orange). Mitochondria are in an anabolic mode (yellow). (D) In low glucose, high acetate, ethanol and glycerol regime, yeast switches to gluconeogenesis via GS.
Figure 1—figure supplement 1
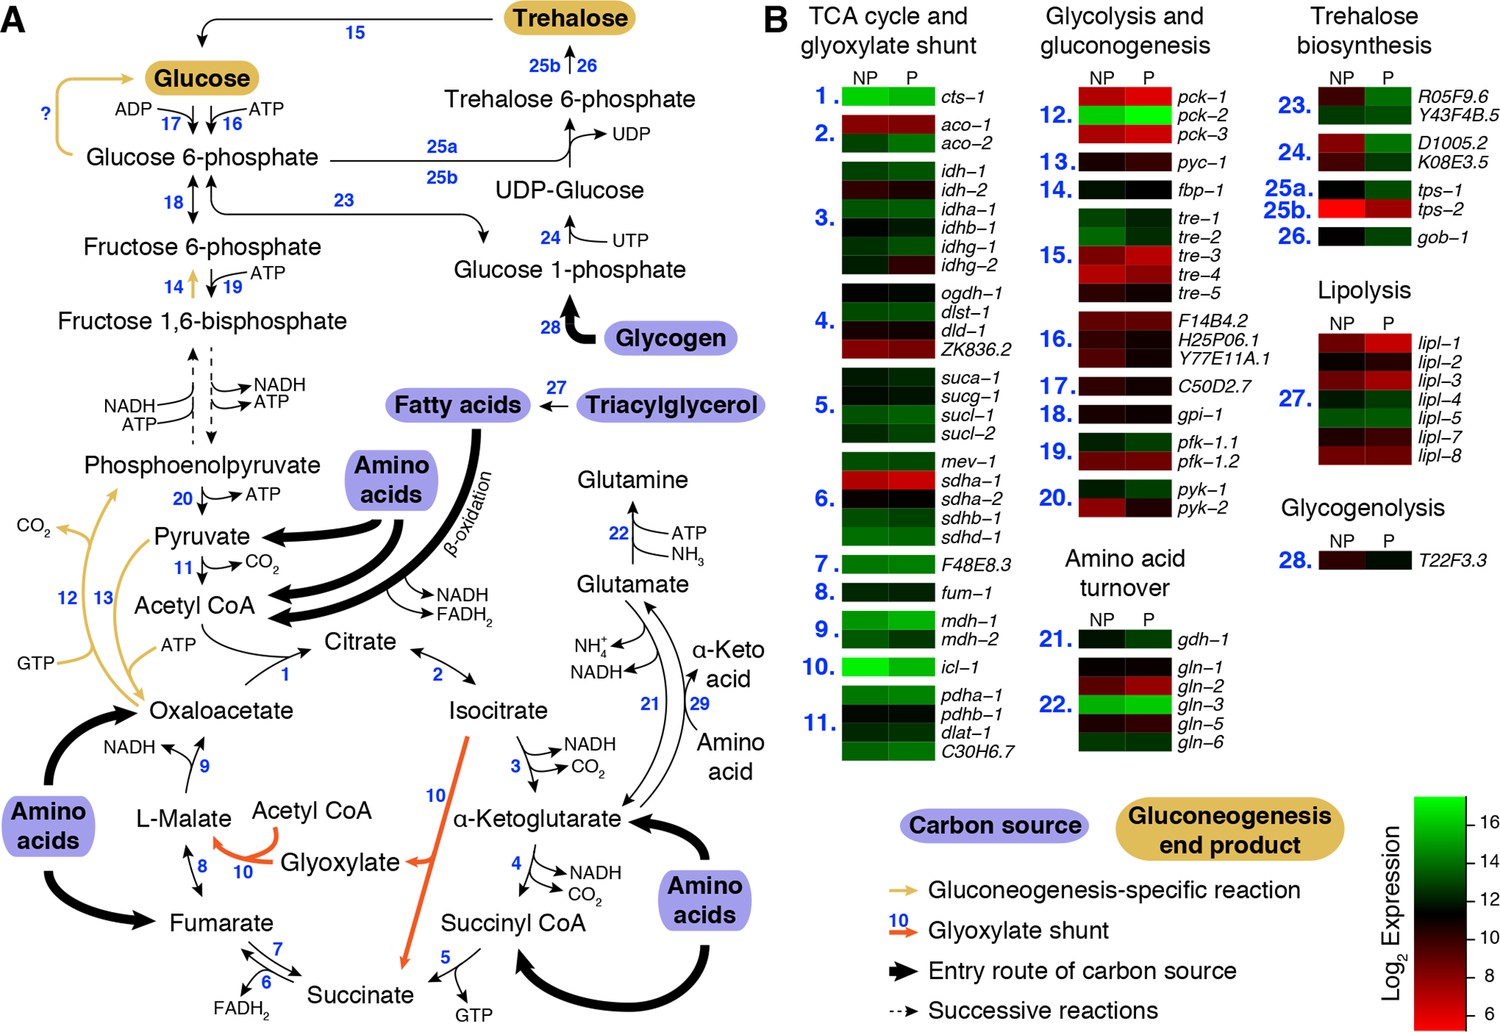
Metabolic pathways of glycolysis, gluconeogenesis, TCA cycle and glyoxylate shunt reactions during preconditioning.
(A) Overview of reactions catalyzed by (1) citrate synthase, (2) aconitase, (3) isocitrate dehydrogenase, (4) α-ketoglutarate dehydrogenase, (5) succinyl CoA synthetase, (6) succinate dehydrogenase, (7) fumarate reductase, (8) fumarase, (9) malate dehydrogenase, (10) isocitrate lyase / malate synthase, (11) pyruvate dehydrogenase, (12) phosphoenolpyruvate carboxykinase, (13) pyruvate carboxylase, (14) fructose 1,6-bisphosphatase, (15) trehalase, (16) hexokinase, (17) ADP-dependent glucokinase, (18) phosphoglucose isomerase, (19) phosphofructokinase, (20) pyruvate kinase, (21) glutamate dehydrogenase, (22) glutamine synthetase, (23) phosphoglucomutase, (24) UDP-glucose pyrophosphorylase, (25a, 25b) trehalose 6-phosphate synthase, (25b, 26) trehalose 6-phosphate phosphatase, (27) various lipases, (28) glycogen phosphorylase and (29) various aminotransferases. (B) Normalized expression levels of genes encoding the enzymes of these reactions. NP: Non-preconditioned, P: Preconditioned.
Figure 2 with 1 supplement
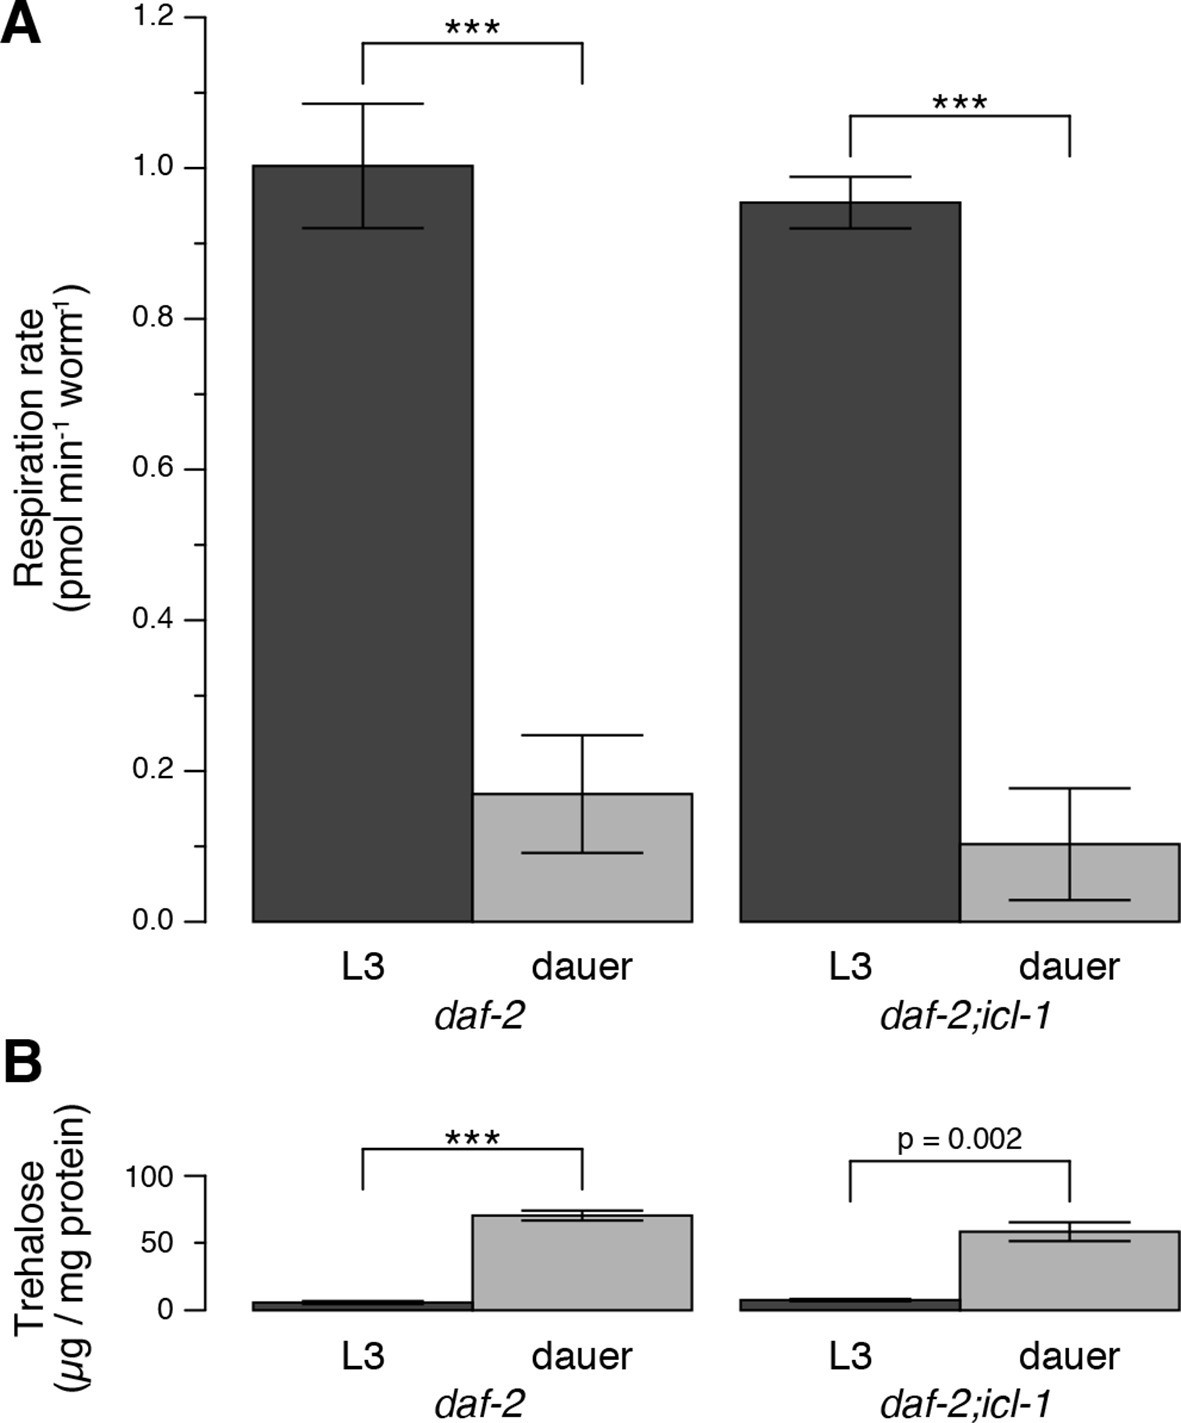
Energetic modes of C. elegans reproductive and dauer larvae.
(A) Respiration rates in terms of OCR difference between water-treated and azide-treated worms (n = 4 for each group). ANOVA shows that in both strains, L3 larvae consume significantly more oxygen than dauer larvae (F1,12 = 1469, p < 0.001). There is also a minor effect of strain on oxygen consumption (F1,12 = 6.864, p = 0.022), however there is no interaction between the larval stage and the strain (F1,12 = 0.166, p = 0.691). Error bars show 95% confidence intervals. (B) Steady-state trehalose levels of daf-2 and daf-2;icl-1, L3 and dauer larvae (n = 3 for each group). L3 larvae produce less trehalose than dauer larvae (F1,8 = 92.814, p < 0.001) independent of the strain (F1,8 = 0.083, p = 0.781). Error bars show standard error of the mean. *p < 0.001.
Figure 2—figure supplement 1
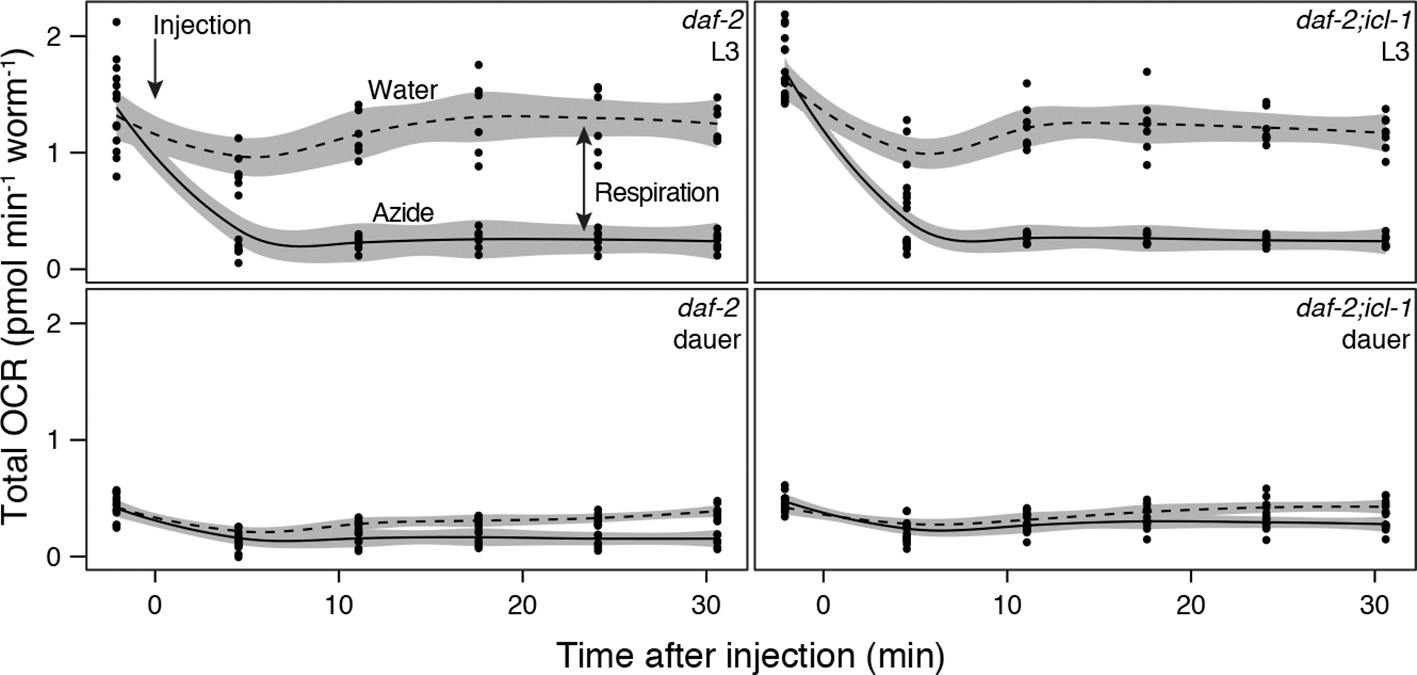
Details of oxygen consumption rate measurements.
Oxygen consumption rates of L3 (top panels) and dauer (bottom panels) larvae of daf-2 (left panels) and daf-2;icl-1 (right panels). Dashed and solid lines indicate OCR after water (control) and 20 mM sodium azide injection, respectively.
Figure 3 with 2 supplements
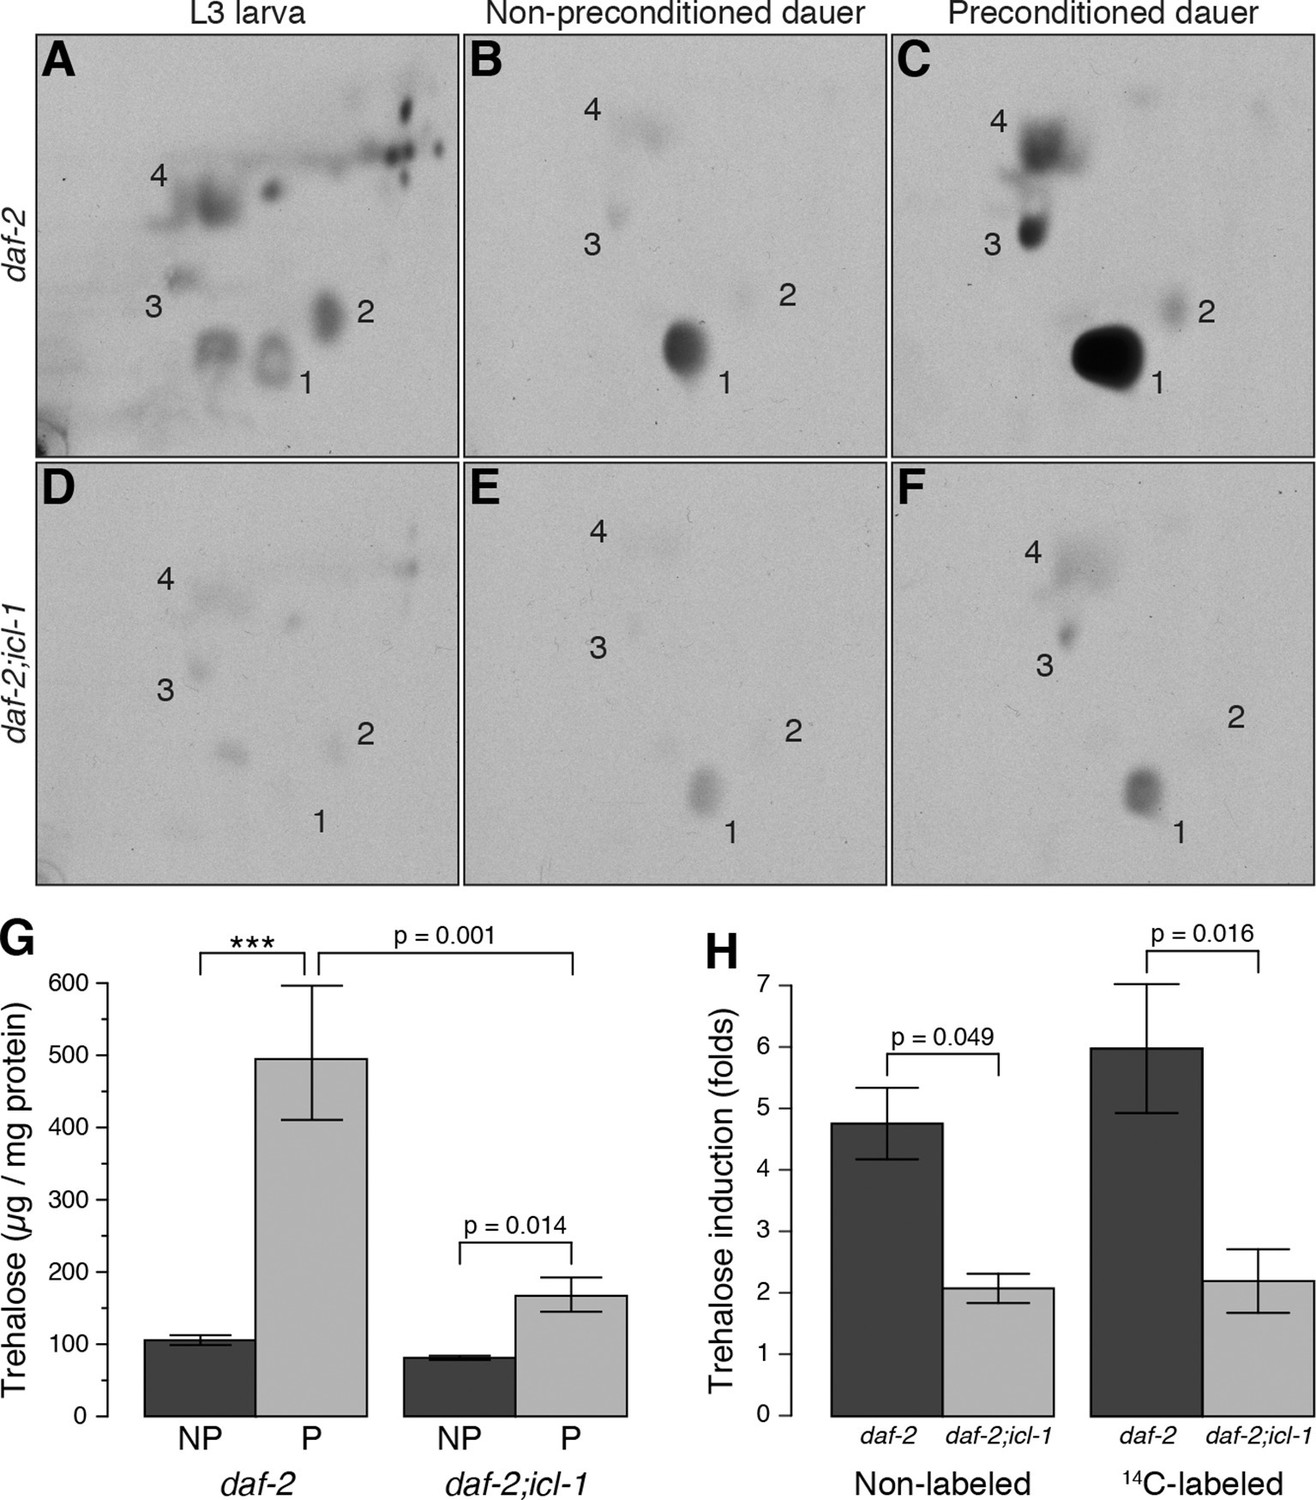
Metabolic modes of C. elegans reproductive and dauer larvae.
(A–C) Radioactively labeled metabolites of daf-2 L3, as well as non-preconditioned (NP) and preconditioned (P) dauer larvae. Enumerated spots indicate trehalose (1), glucose (2), glutamate (3) and glutamine (4). (D–F) The same analysis for daf-2;icl-1. Equivalent metabolome extracts were separated and exposed for 2 days for both strains and larval/experimental conditions. (G) Steady state trehalose levels before and after preconditioning in daf-2 and daf-2;icl-1 dauer larvae (n = 3 for each group). Both strains elevate their trehalose levels upon preconditioning (ANOVA for preconditioning reports F1,8 = 85.20, p < 0.001) but to different extents (ANOVA for strain reports F1,8 = 30.11, p < 0.001; interaction between strain and preconditioning F1,8 = 11.26, p = 0.010). Error bars show standard error of the mean. *p < 0.001. (H) Induction of non-labeled and 14C-labeled trehalose upon preconditioning in daf-2 and daf-2;icl-1 dauer larvae expressed as fold changes (n = 3 for each group). ANOVA shows that daf-2 larvae induce both non-labeled and labeled trehalose more than daf-2;icl-1 larvae (F1,8 = 26.229, p < 0.001) however induction in labeled trehalose does not differ from non-labeled (F1,8 = 0.343, p = 0.571). Error bars show standard error of the mean.
Figure 3—figure supplement 1
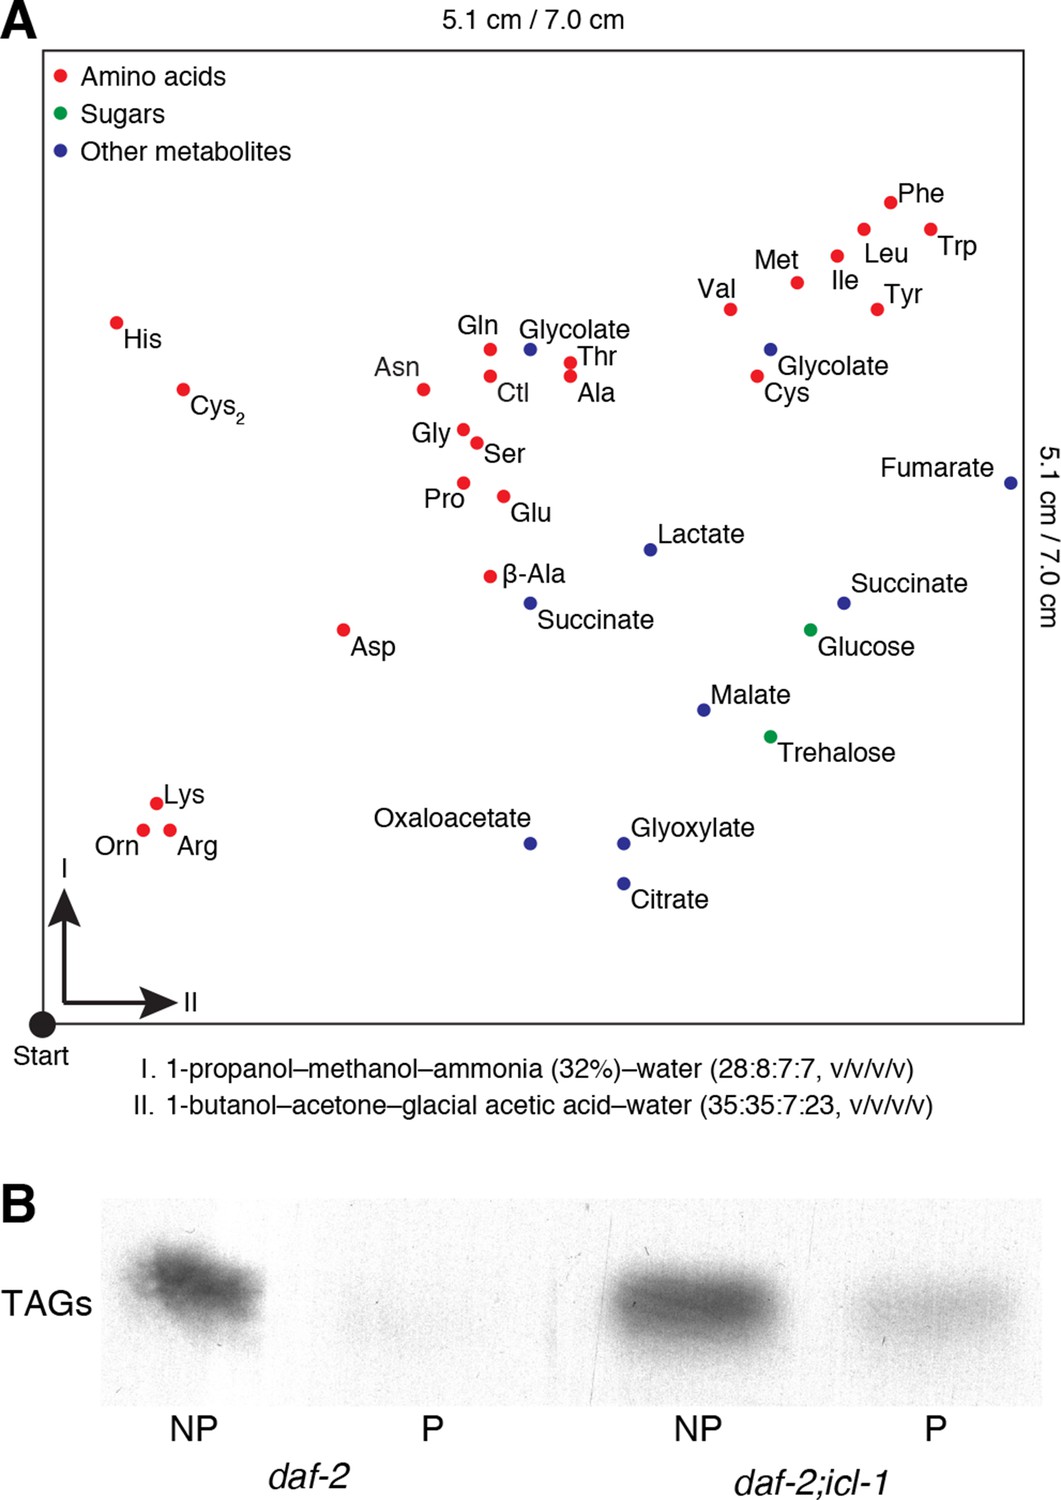
Details for the detection of metabolites.
(A) Map of metabolites in the 2D-HPTLC system. Amino acids, sugars and miscellaneous metabolites are indicated in red, green and blue, respectively. Metabolites are spread only on a part of the plate (5.1 × 5.1 cm). (B) Incorporation of 14C into TAGs after metabolic labeling.
Figure 3—figure supplement 2
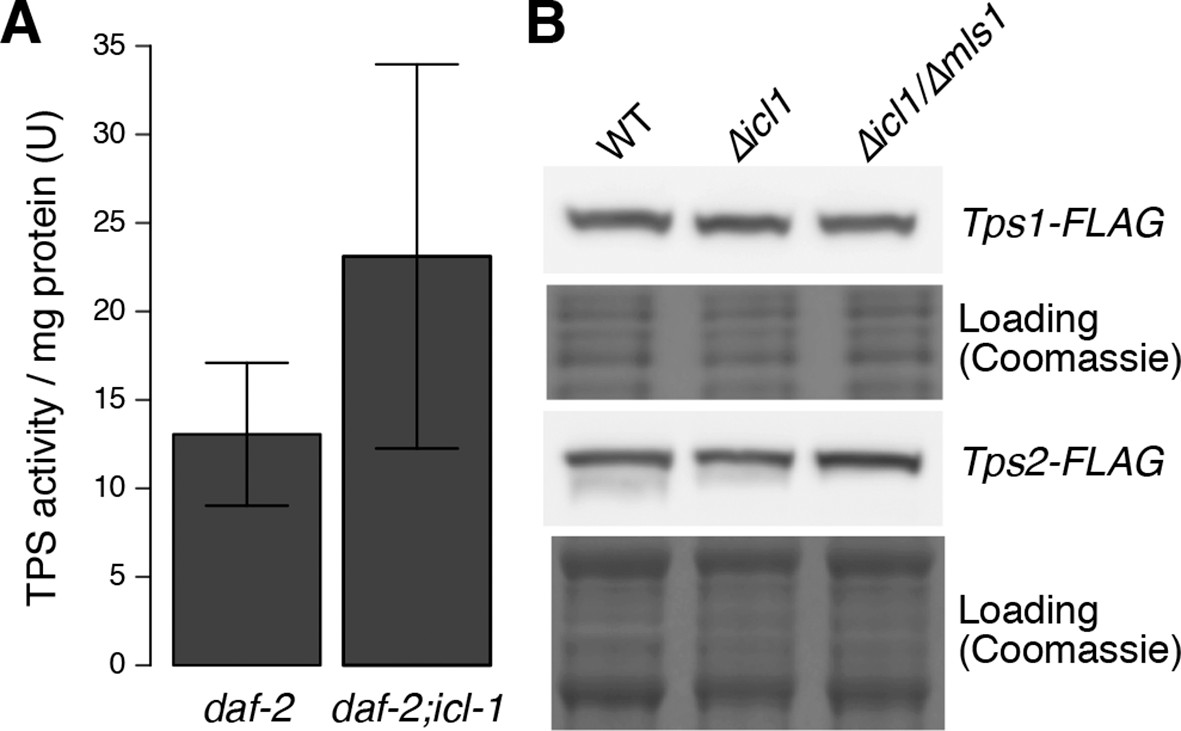
Trehalose 6-phosphate synthase (TPS) levels in worm and yeast.
(A) TPS activity in worm lysates of daf-2 and daf-2;icl-1 background (n = 3 for each group). Activity unit is defined as the amount of trehalose 6-phosphate (nmol) produced per min, normalized to total soluble protein amount in the lysate. Two-sample t-test shows no significant difference between TPS activities of different strains (p = 0.783). (B) Tps1 and Tps2 levels in wild type, ∆icl1 and ∆icl1/∆mls1 yeast. Both proteins are expressed at comparable levels in all strains.
Figure 4 with 1 supplement
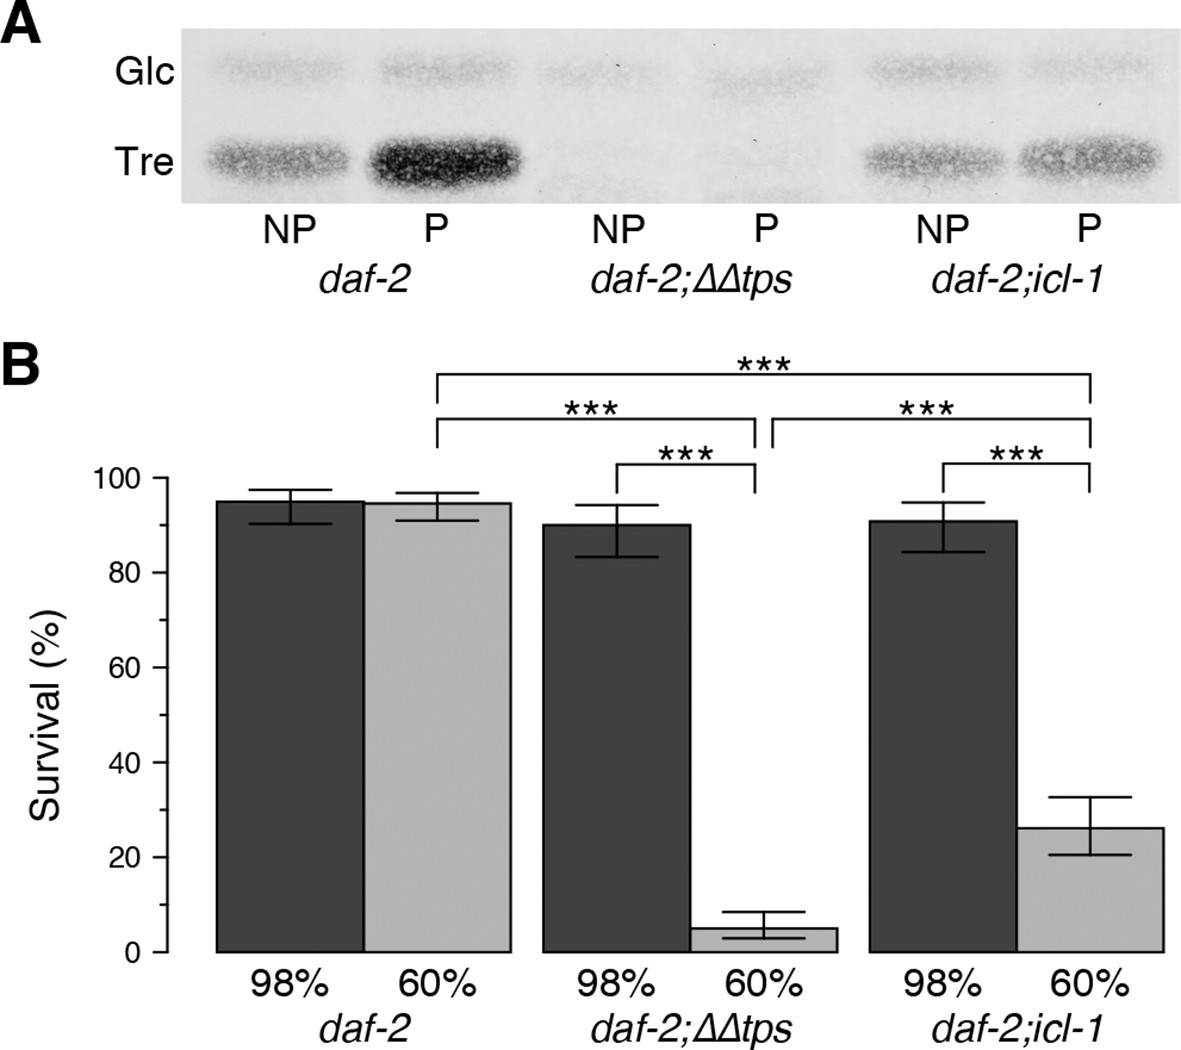
Effect of the glyoxylate shunt on desiccation tolerance.
(A) Trehalose levels before (NP) and after (P) preconditioning in daf-2, daf-2;∆∆tps and daf-2;icl-1 dauer larvae after separation with HPTLC and visualization via Molisch’s staining. Tre: Trehalose, Glc: Glucose. (B) Survival levels of the same strains at 98% and 60% RH after preconditioning (dark and light boxes, respectively). Statistical comparison was done with beta regression followed by multiple hypothesis testing. Analysis of deviance results indicate that survival levels depend both on the strain ( = 124.64, p < 0.001) and the RH ( = 141.46, p < 0.001). Error bars show 95% confidence intervals. *p < 0.001
Figure 4—figure supplement 1
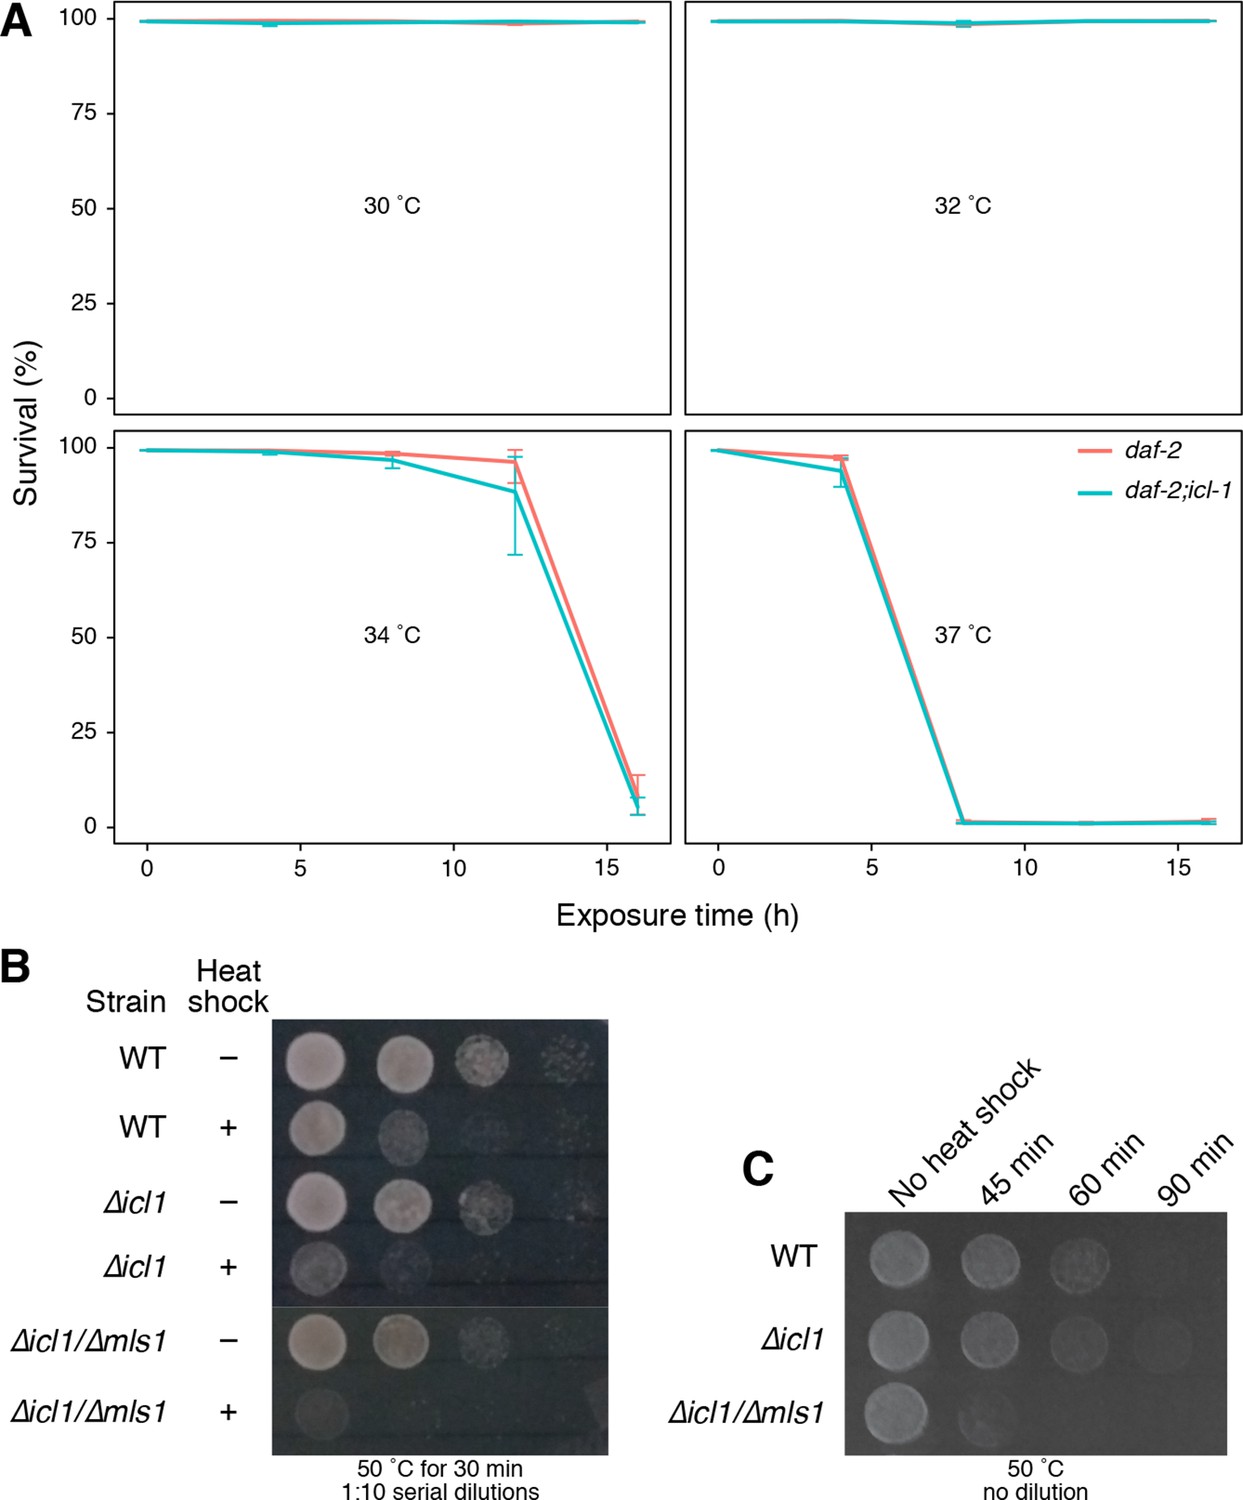
GS is not involved in heat-shock stress in C. elegans and S. cerevisiae.
(A) Survival rates of worms upon heat shock at 30°°C, 32°C, 34°C and 37°C for up to 16 hr. Red and blue lines show daf-2 and daf-2;icl-1 strains, respectively. Error bars show standard error of the mean calculated via beta regression. Analysis of deviance results indicate that survival does not depend on the strain ( = 0.221, p < 0.638) but it depends on time of exposure ( = 56.071, p < 0.001) and temperature ( = 86.041, p < 0.001). (B) Resistance of wild type and GS-deficient cells to heat stress. Cells at decreasing cell densities (OD600 = 1.0–0.001) were subjected to a single heat shock (50°C for 30 min), and survival was estimated by spotting on YPD plates. (C) Cells at a constant cell density (OD600 = 0.1) were subjected to increasing durations of heat shock (50°C for 45, 60 and 90 min) and survival was estimated by spotting onto YPD plates.
Figure 5 with 1 supplement

ICL-1 is a mitochondrial protein.
(A) Subcellular localization of ICL-1::GFP in L3 hypodermis (B) Mitochondrial staining of L3 hypodermis. (C) Colocalization of mitochondria and ICL-1::GFP in L3 hypodermis. Seam cells are circled with dashed curves. (D) Subcellular localization of ICL-1::GFP in dauer hypodermis. Seam cells are circled with dashed curves. (E) Subcellular localization of ICL-1::GFP in dauer gut. Gut lumen is shown as a dashed line. Scale bar corresponds to 10 µm for all images.
Figure 5—figure supplement 1
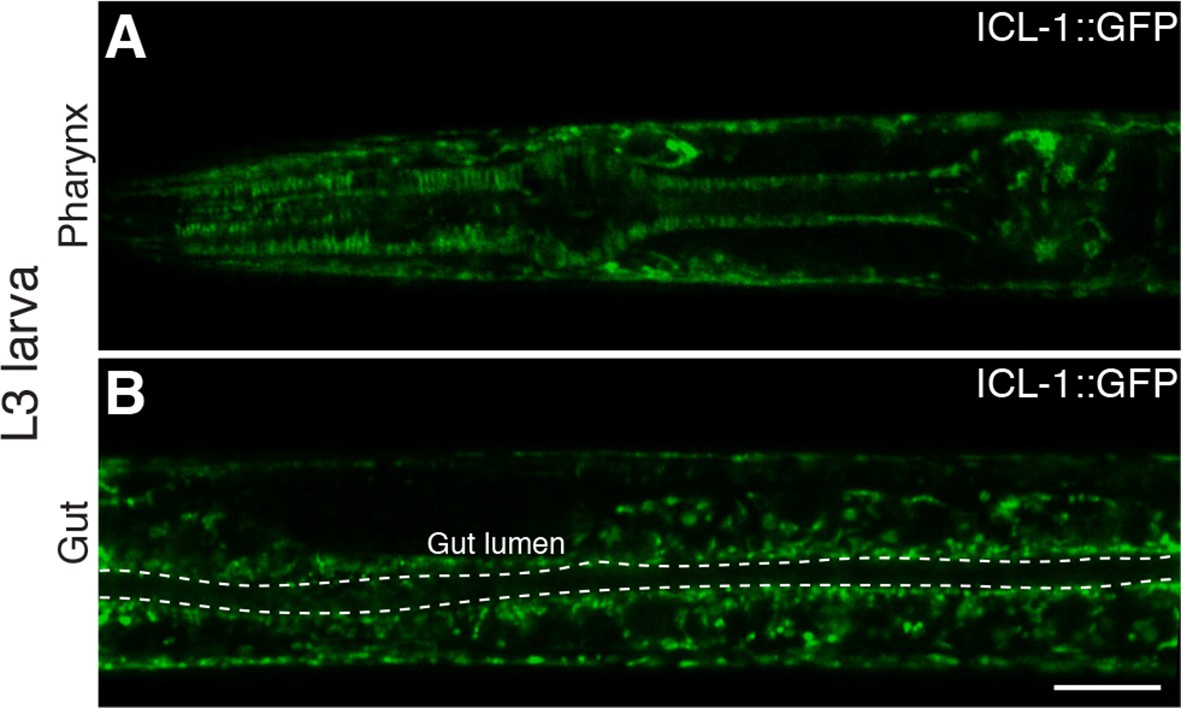
Expression of ICL-1 in different tissues.
(A) Pharynx. (B) Gut. Gut lumen is shown between dashed lines. Scale bar corresponds to 10 µl for both images.
Figure 6
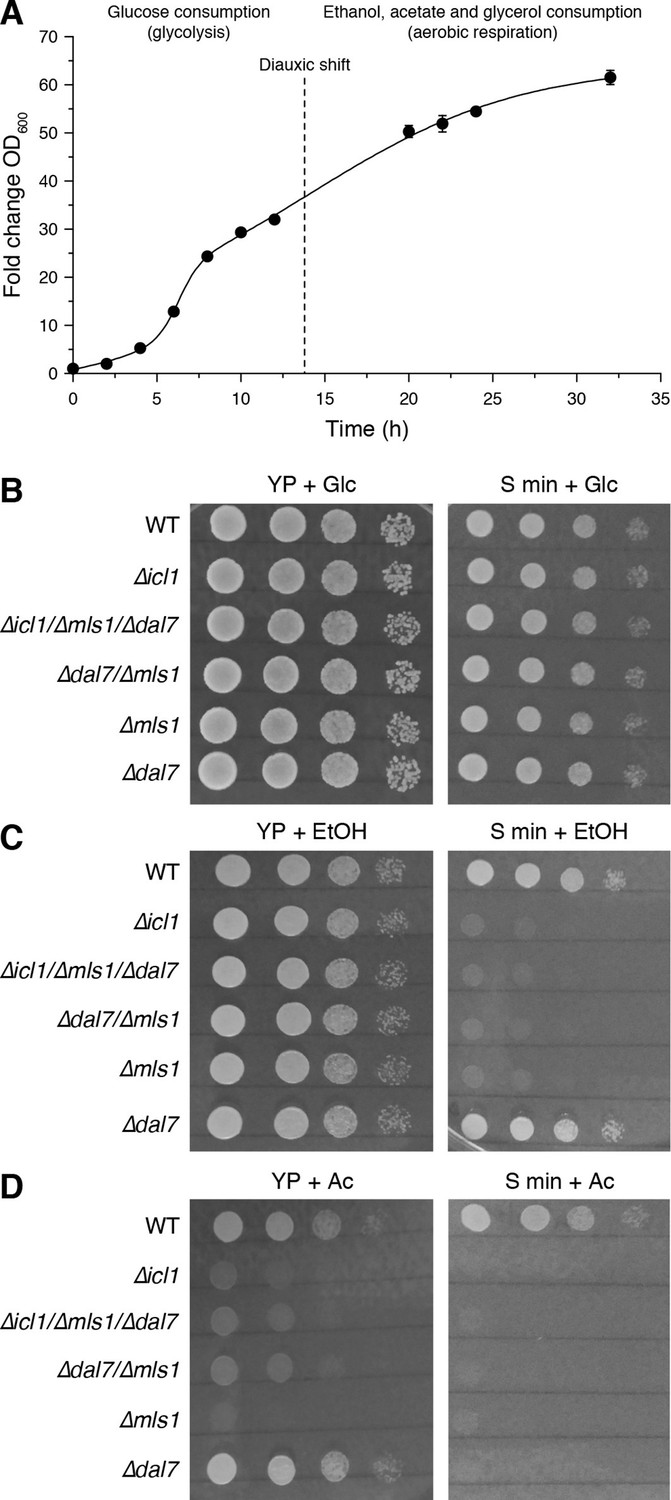
Growth of GS-deficient yeast cells in media with different carbon sources.
(A) Growth of wild-type S. cerevisiae in YP + Glc medium in batch culture. The time of diauxic shift is shown with a dashed line. Error bars show standard deviation (n = 3). (B–D) Growth of wild-type (WT) or GS-deficient yeast in amino acid rich (YP) or minimal medium with glucose (B), ethanol (C) and acetate (D) as the carbon source. Note that particularly with acetate as the primary carbon source, GS mutants (∆icl1, ∆mls1, ∆dal7, ∆mls1/∆dal7 and ∆icl1/∆mls1/∆dal7) grow poorly regardless of amino acid availability.
Figure 7 with 1 supplement
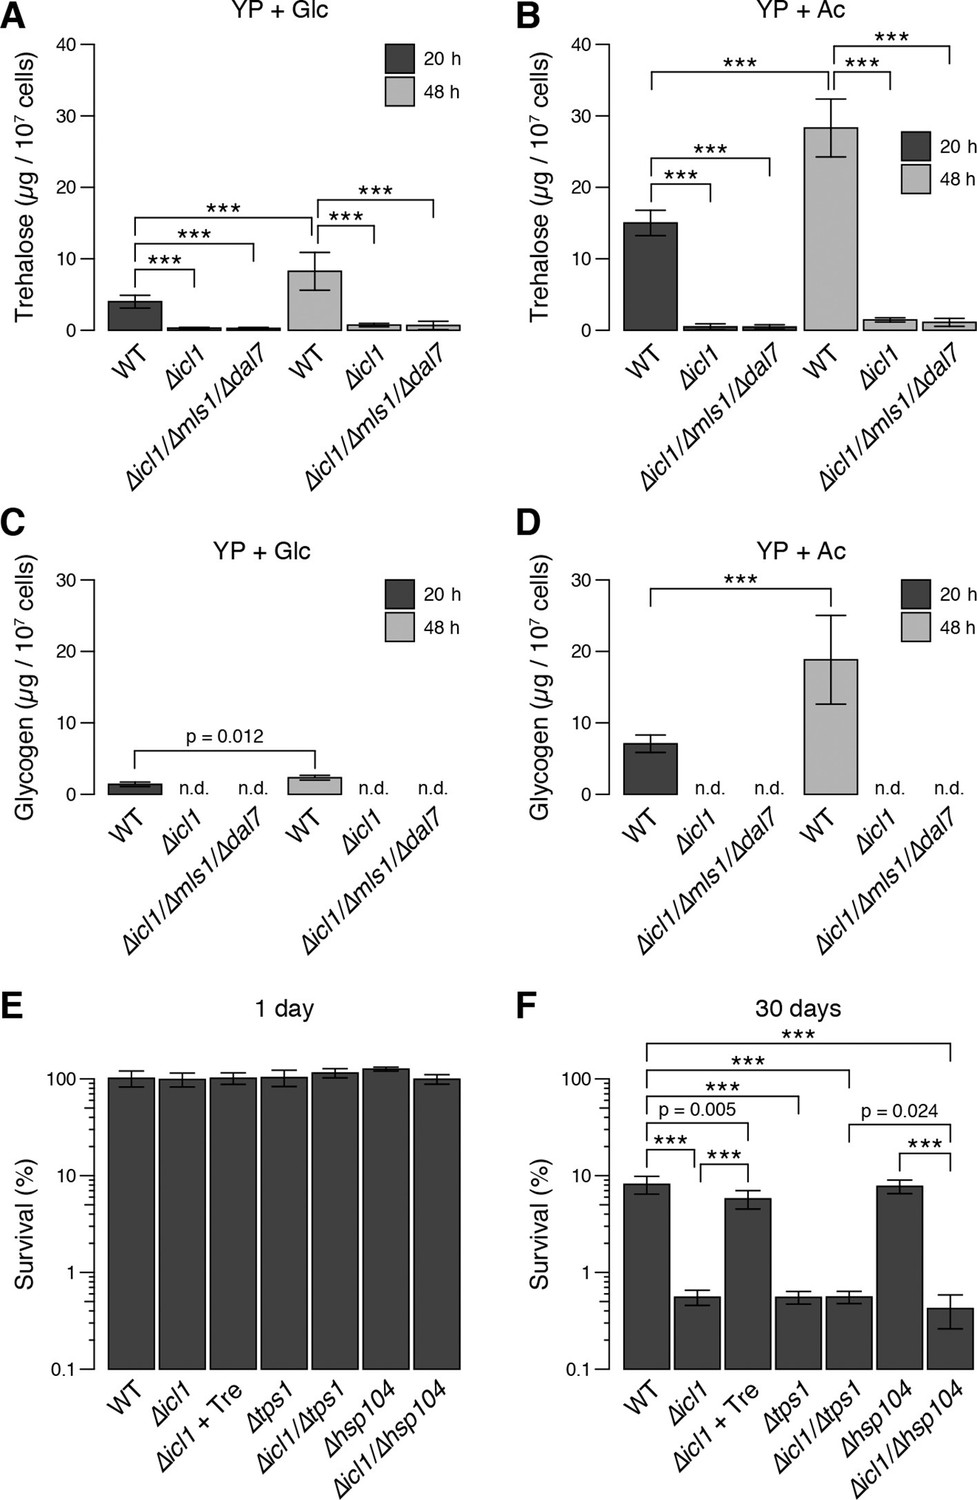
Trehalose/glycogen synthesis and desiccation tolerance in GS-deficient yeast cells.
(A, B) Steady-state trehalose levels of WT, ∆icl1 and ∆icl-1/∆mls1/∆dal7 strains in YP + Glc (A) and YP + Ac (B) media after 20 hr (post-diauxic shift, dark bars) and 48 hr (stationary phase, light bars). (C, D) Steady-state glycogen levels under the same conditions. n.d.: Not detected/below assay sensitivity range. (E, F) Desiccation tolerance of the indicated WT and mutant yeast cells, measured after 24 hr (E) or 30 days (F) of desiccation. Error bars show 95% confidence intervals. ***p < 0.001.
Figure 7—figure supplement 1
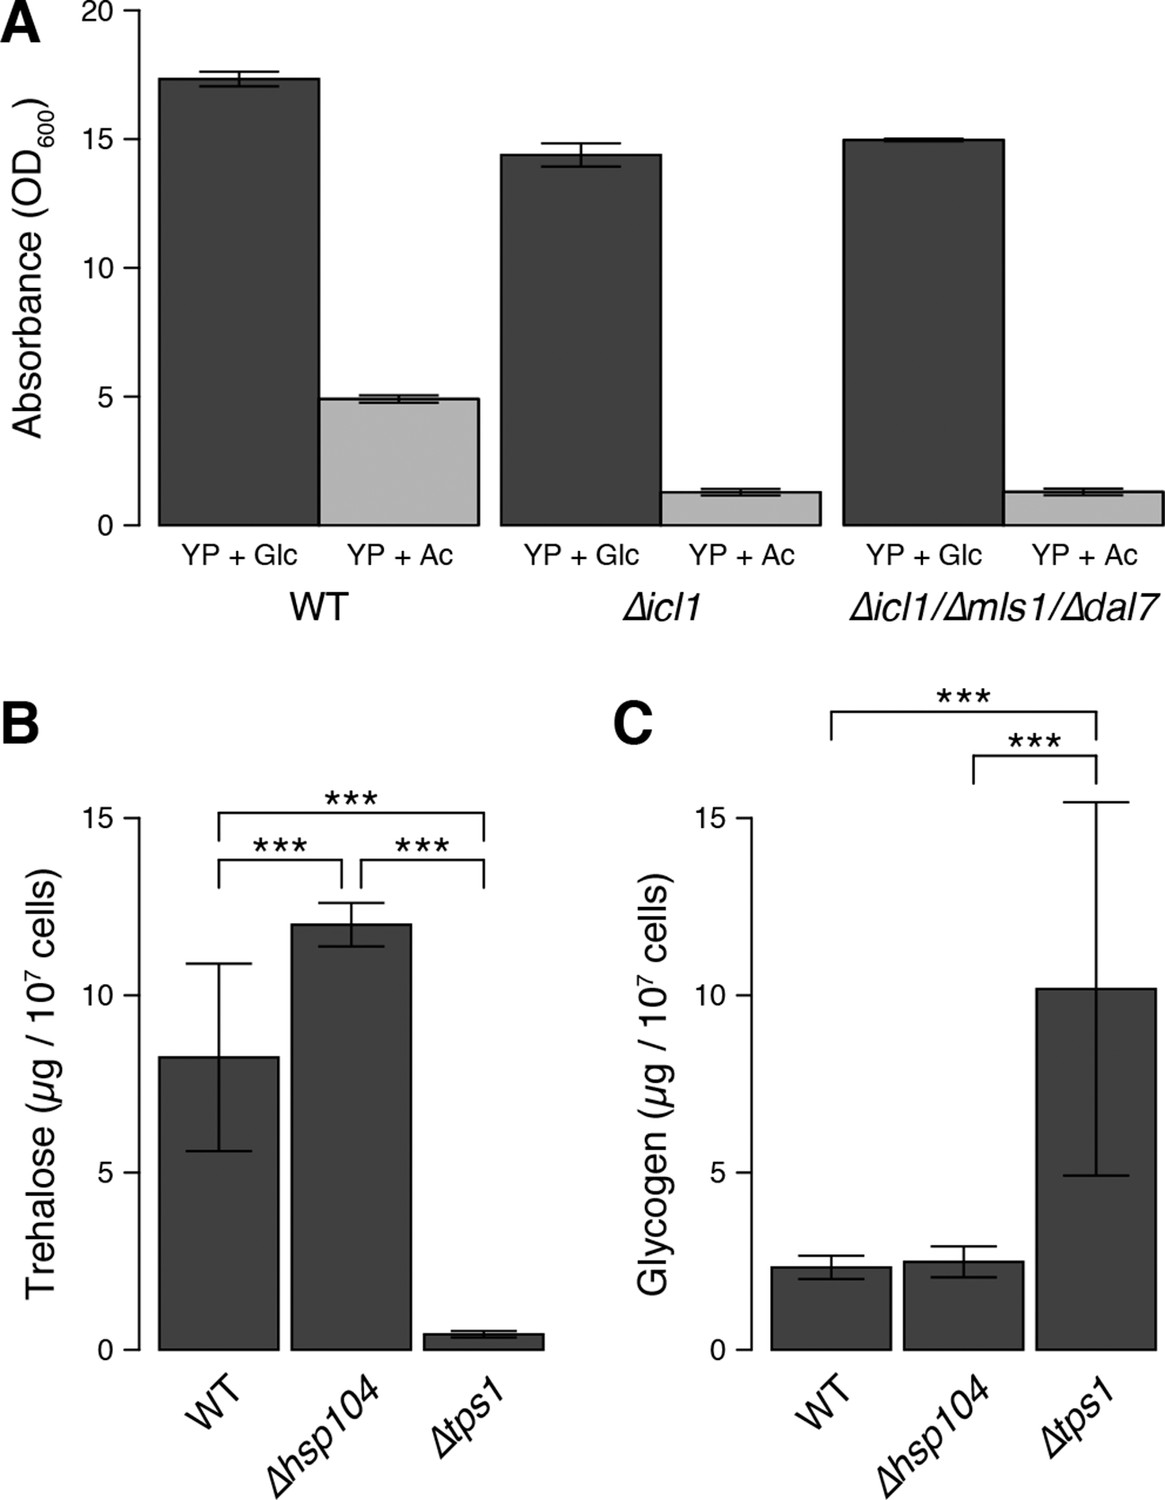
Cell density, trehalose and glycogen levels in WT and mutant yeast strains.
(A) Maximum cell density attained by wild type and GS-deficient cells after 48 hr of growth in YP + Glc medium or YP + Ac medium. (B) Trehalose levels in WT, ∆hsp104 and ∆tps1 cells after 48 hr of growth in YP + Glc medium. (C) Glycogen levels in WT, ∆hsp104 and ∆tps1 cells after 48 hr of growth in YP + Glc medium. Error bars represent 95% confidence intervals. ***p < 0.001
Figure 8
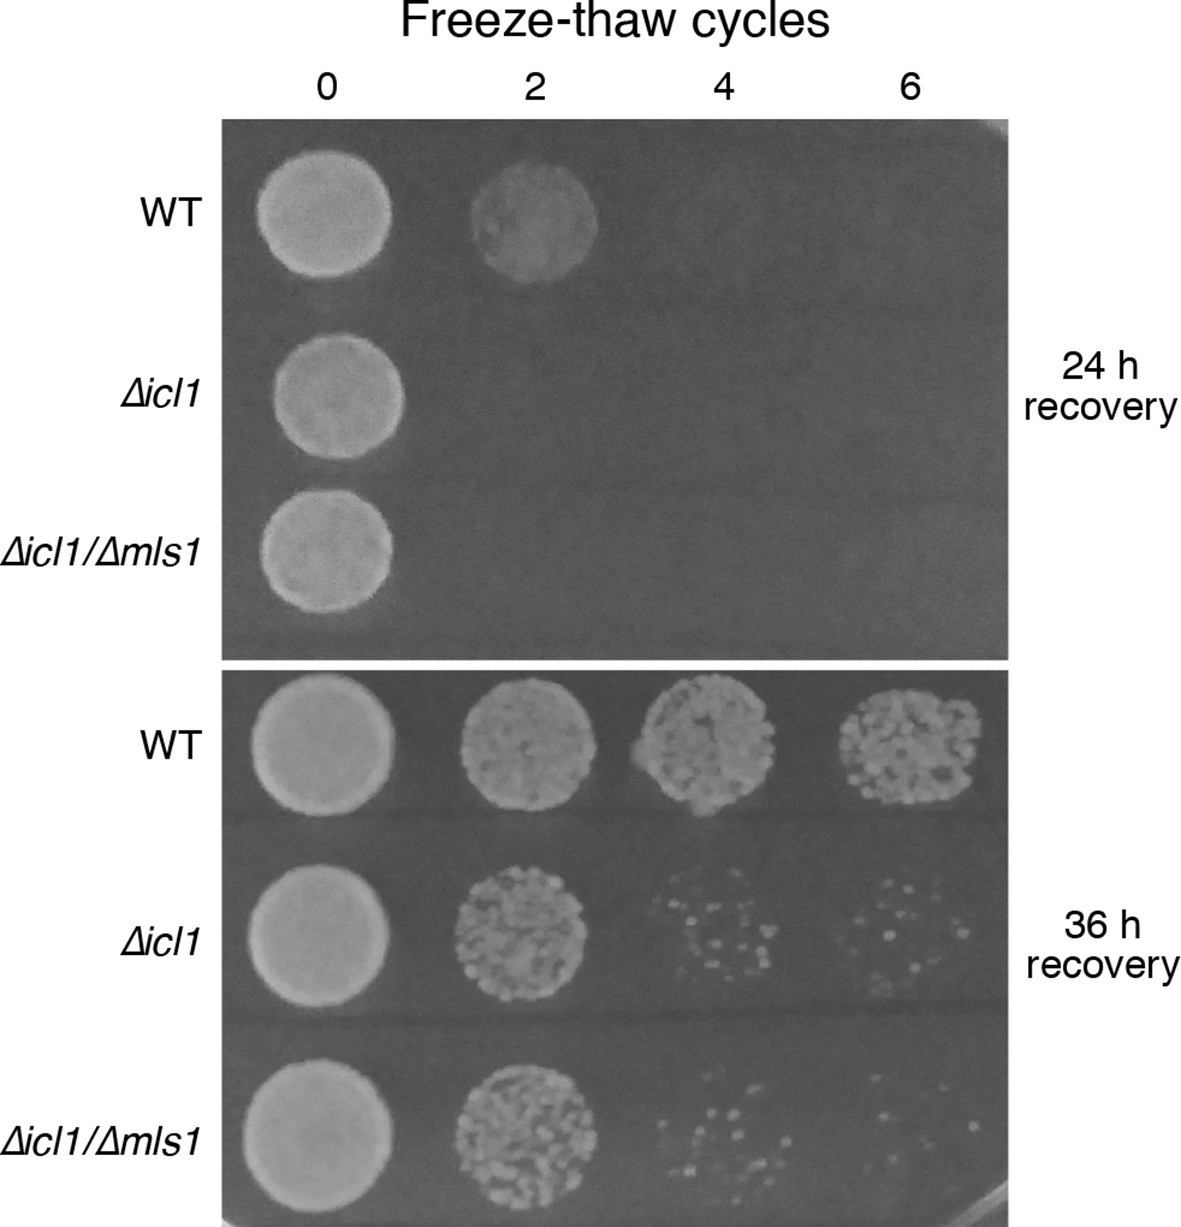
Resistance of WT and GS-deficient cells to freezing and thawing.
Equal numbers of cells were subjected to multiple freeze-thaw cycles, and survival estimated by spotting onto YPD plates. The plates were imaged after different times of recovery, to more carefully observe survival phenotypes.
Download links
A two-part list of links to download the article, or parts of the article, in various formats.
Downloads (link to download the article as PDF)
Open citations (links to open the citations from this article in various online reference manager services)
Cite this article (links to download the citations from this article in formats compatible with various reference manager tools)
The glyoxylate shunt is essential for desiccation tolerance in C. elegans and budding yeast
eLife 5:e13614.
https://doi.org/10.7554/eLife.13614


