A new synthetic biology approach allows transfer of an entire metabolic pathway from a medicinal plant to a biomass crop
- Max-Planck-Institut für Molekulare Pflanzenphysiologie, Germany
Figures
Figure 1

Metabolic pathway of artemisinin biosynthesis.
The canonical pathway of artemisinin synthesis starts with the conversion of IPP/DMAPP (C5 isoprenoids produced by the MVA pathway in the cytosol or the MEP pathway in the chloroplast) into farnesyl pyrophosphate (FPP), catalyzed by farnesyl pyrophosphate synthase (FPS). Amorpha-4,11-diene synthase (ADS) converts FPP into amorpha-4,11-diene in the first committed step of the pathway. Amorpha-4,11-diene is then successively oxidized to artemisinic alcohol, artemisinic aldehyde and artemisinic acid by the cytochrome P450 monooxygenase CYP71AV1 (CYP) and its redox partner, the cytochrome P450 reductase (CPR). In A. annua, artemisinic aldehyde is converted to dihydroartemisinic aldehyde by DBR2, and then to dihydroartemisinic acid by ALDH1. Artemisinin is generated by the spontaneous oxidation of dihydroartemisinic acid in planta, and can be produced by chemical conversion of artemisinic acid in vitro. Enzymes depicted in red improve the efficiency of different oxidation steps in yeast (Paddon et al., 2013; Paddon and Keasling, 2014). See text for details.
Figure 2
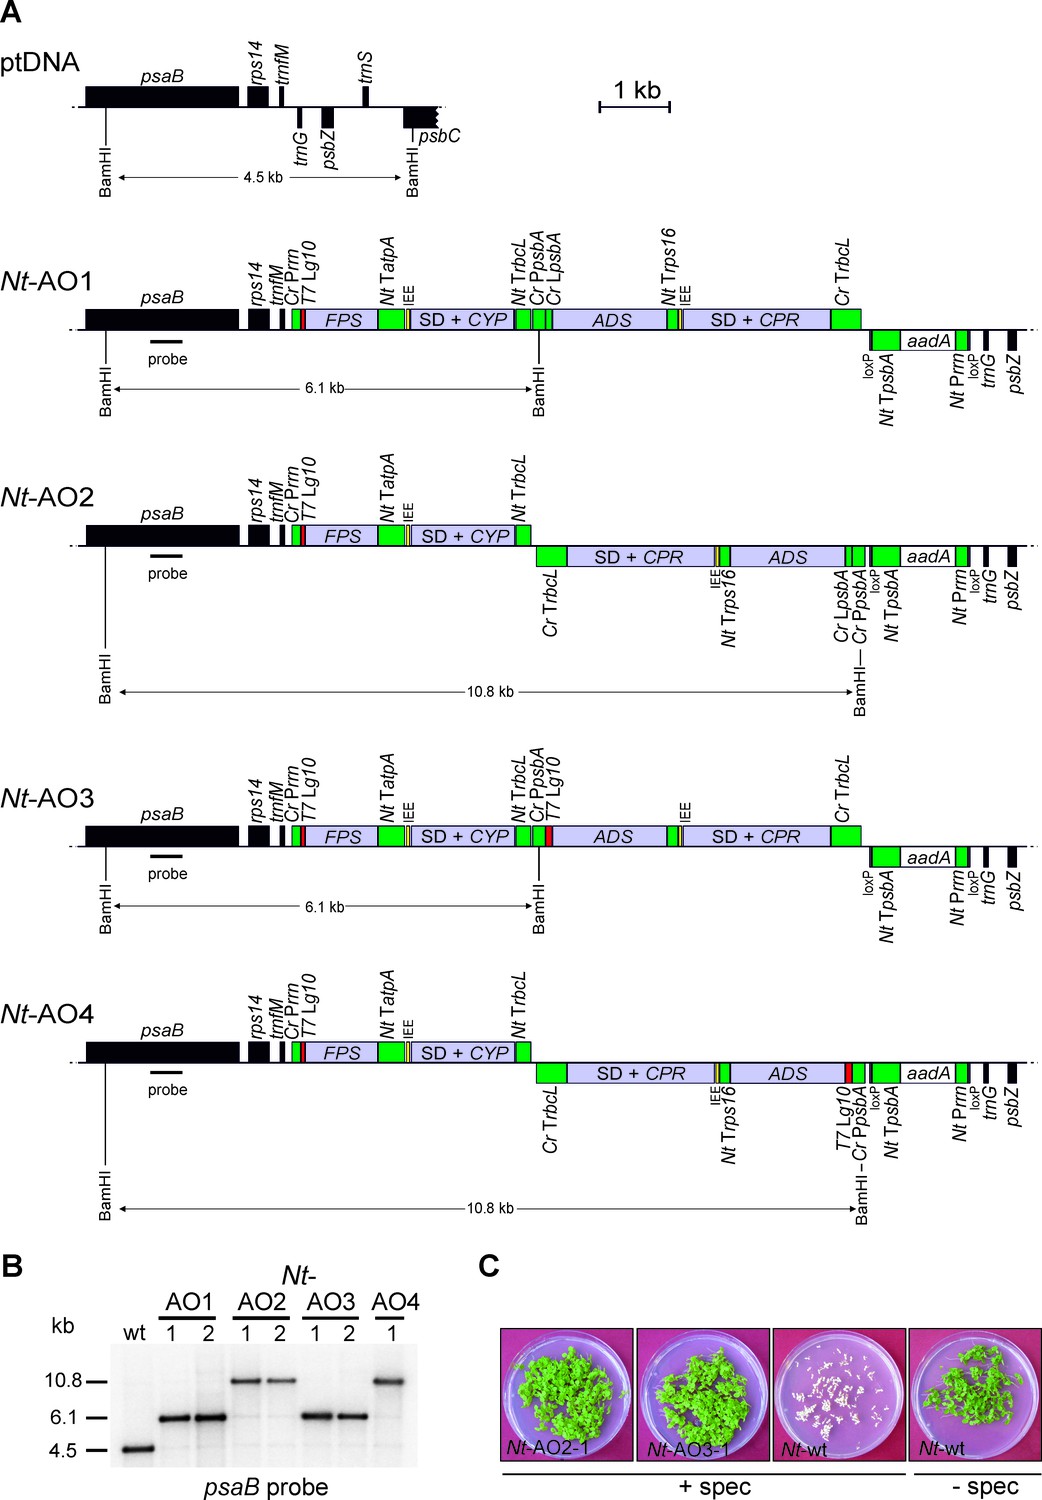
Implementation of the canonical pathway of artemisinic acid biosynthesis in chloroplasts.
Synthetic codon-optimized genes for the four enzymes required to produce artemisinic acid (Figure 1) were introduced into the tobacco plastid genome by stable genetic transformation with four different synthetic operon constructs (pAO1-4). The constructs differ in gene arrangement and in the translation signals that drive synthesis of the key pathway enzyme (ADS) catalyzing the first committed step. (A) Physical map of the plastid genome region (ptDNA) used for integration of the synthetic artemisinic acid operons and maps of the transgenic loci in the generated transplastomic tobacco lines (Nt-AO1-4). The artemisinic acid operon genes are depicted as light blue boxes. Chloroplast promoters and terminators are shown in green, the aadA selectable marker gene for chloroplast transformation is represented as a white box, and genes in flanking plastid sequences used for transgene targeting via homologous recombination are in black. Genes above the line are transcribed from left to right, genes below the line are transcribed in the opposite direction. The four transgenes are arranged in two dicistronic operons. FPS and CYP are driven by the Chlamydomonas reinhardtii plastid ribosomal RNA operon promoter (Cr Prrn) and the g10 leader sequence from phage T7 (T7 Lg10). The second operon containing ADS and CPR is driven by the C. reinhardtii psbA promoter (Cr PpsbA) and either the T7 Lg10 or the psbA leader sequence from C. reinhardtii (Cr LpsbA). This operon is arranged either in sense and downstream of the first operon (AO1, 3) or in antisense, downstream of the aadA cassette (AO2, 4). The genes in each operon are separated by an intercistronic expression element (IEE) conferring intercistronic RNA processing and, in this way, enhancing expression of downstream cistrons of the operon (Zhou et al., 2007; Drechsel and Bock, 2010). The BamHI restriction sites used in RFLP analyses and the expected fragment sizes are indicated. The location of the hybridization probe is shown as a black bar. Cr: C. reinhardtii; Nt: N. tabacum; T7: bacteriophage T7; P: promoter; L: leader sequence; T: terminator; SD: Shine-Dalgarno sequence. (B) RFLP analysis of transplastomic plants. Two independently isolated transplastomic lines are shown for constructs pAO1-3 and one for pAO4. (C) Seed assays confirming the homoplasmic state of the transplastomic plants. Seeds were germinated on medium containing 500 mg/L spectinomycin (Nt-AO2-1, Nt-AO3-1, Nt-wt) or antibiotic-free medium (Nt-wt).
Figure 3 with 2 supplements

Phenotype of transplastomic tobacco plants and accumulation of artemisinic compounds.
(A) Transplastomic lines Nt-AO1-1 and Nt-AO3-1 display a slightly pale and growth-delayed phenotype at the juvenile stage. WAT: weeks after transfer from tissue culture to soil; scale bars: 10 cm. (B) Amorpha-4,11-diene is synthesized in all transplastomic lines, but accumulates to lower levels in the lines displaying an altered phenotype (purple bars). (C) Artemisinic alcohol is detected in similar amounts in all transplastomic plants. (D) Accumulation of artemisinic acid correlates with the altered phenotype of Nt-AO1-1 and Nt-AO3-1. Relative accumulation of amorpha-4,11-diene was profiled by GC-MS analysis of volatile organic compounds (VOCs). Relative accumulation of the sum of free and conjugated artemisinic alcohol and artemisinic acid were determined by GC-MS analysis of the soluble metabolite fraction after saponification (see Materials and methods; Figures 6 and 7). In agreement with previous reports (van Herpen et al., 2010), these compounds were found to be present mainly as conjugates. Expanding leaves of 5–6 plants per line were used for each measurement. Error bars represent the SD. Different letters above the bars indicate significant differences as determined by One-way ANOVA (p<0.001) and the Holm-Sidak post-hoc test.
Figure 3—figure supplement 1
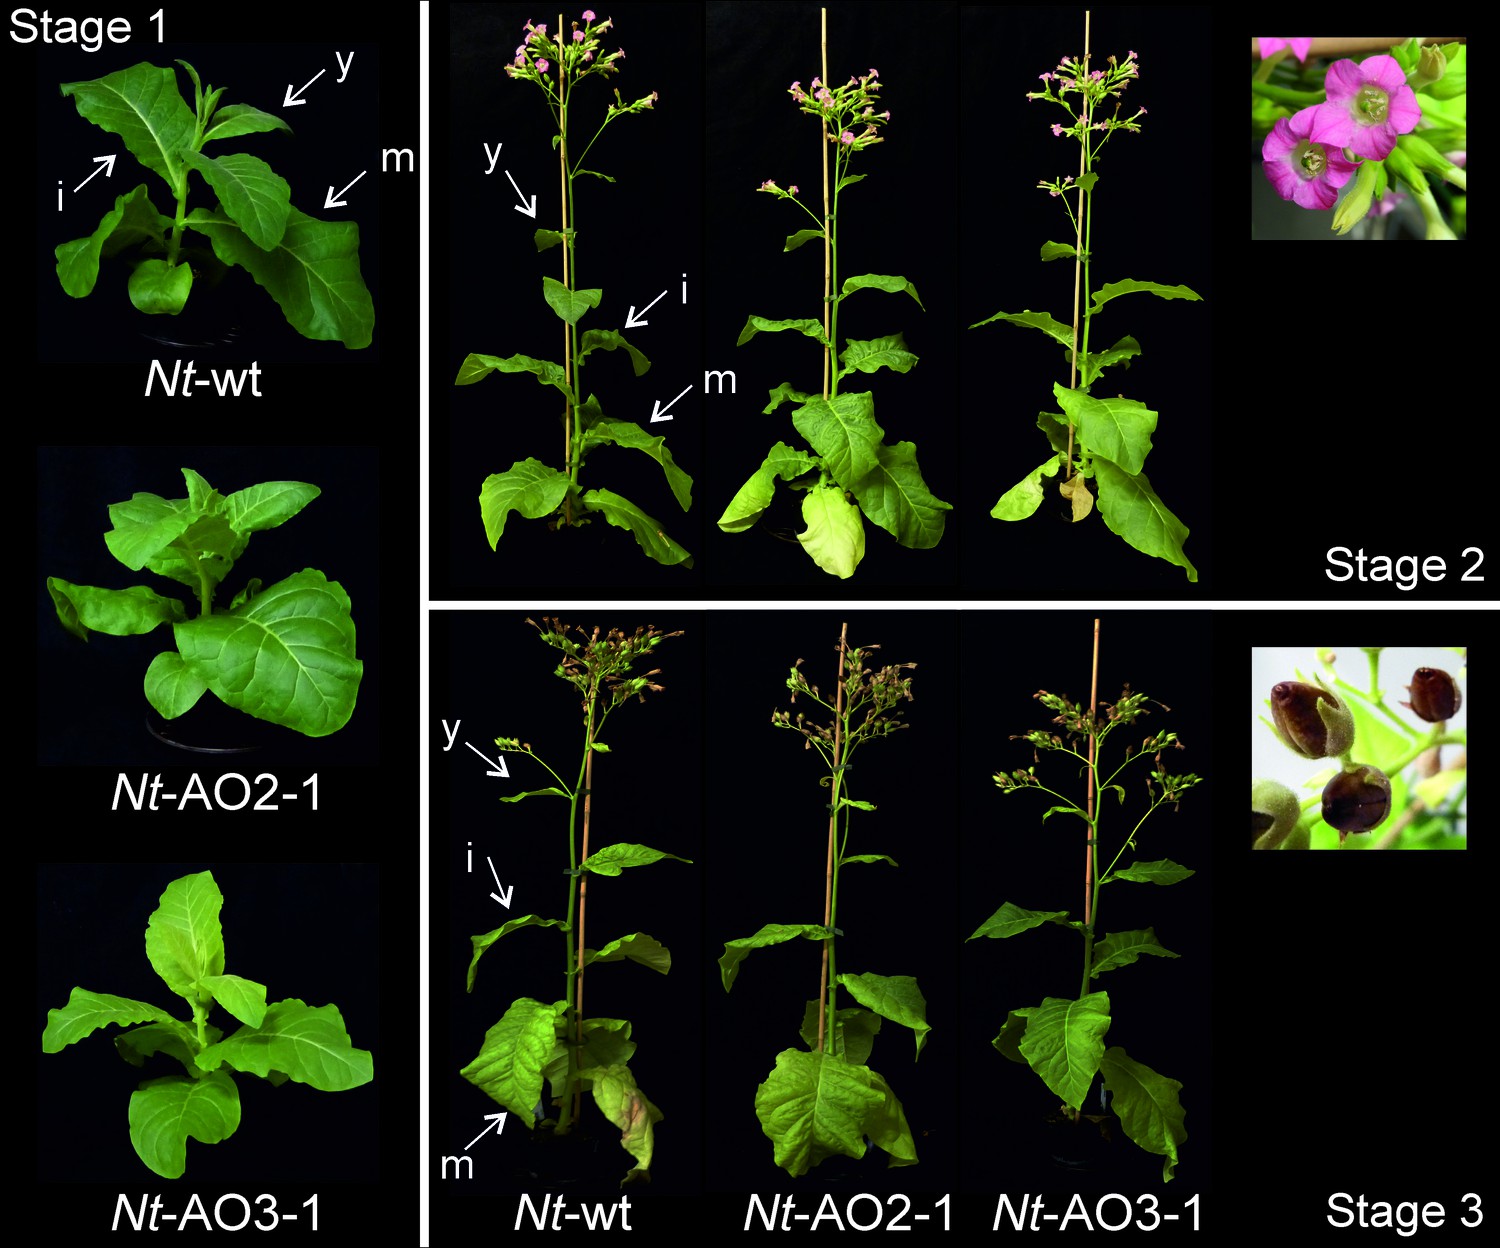
Phenotypes of Nt-AO2-1 and Nt-AO3-1 plants throughout development.
Six plants per line (Nt-wt, Nt-AO2-1 and Nt-AO3-1) were grown under standard greenhouse conditions and photographs were taken of one representative plant per line at different time points: young plants (before flowering, stage 1), flowering plants (stage 2) and old plants (seed capsules formed, stage 3). Light-green leaves and slightly delayed growth of line Nt-AO3-1 are more evident at the young stage. At later stages, all Nt-AO lines display a wild type-like phenotype and produce viable seeds in indistinguishable amounts. y: young leaf; i: expanding (intermediate) leaf; m: fully expanded (mature) leaf.
Figure 3—figure supplement 2
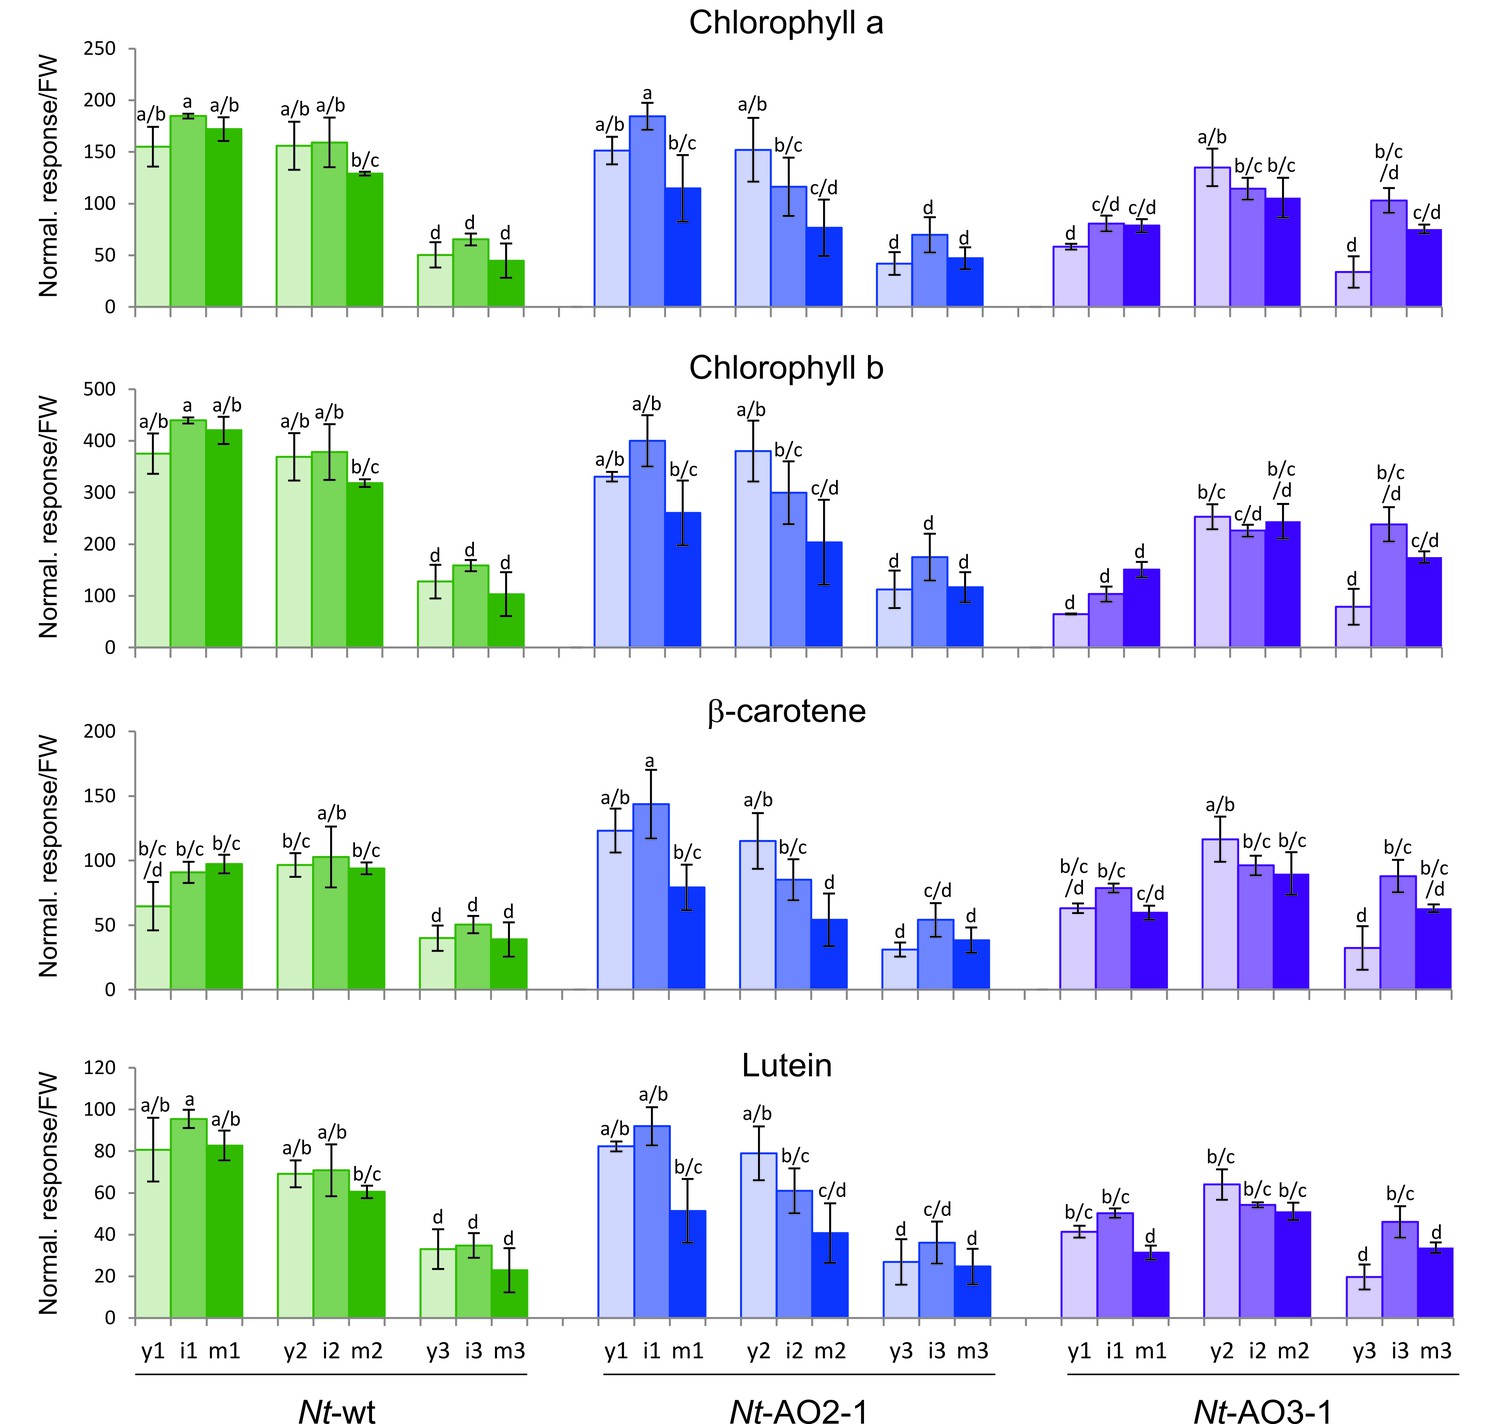
Isoprenoids levels throughout development in wild-type Nicotiana tabacum plants (Nt-wt) and the transplastomic lines Nt-AO2-1 and Nt-AO3-1.
Plants were grown under standard greenhouse conditions and samples were taken from young (y), expanding (i), and fully expanded (m) leaves at three developmental stages (1–3; cf. Figure 3—figure supplement 1). Metabolite levels were determined by UPLC analysis. The values represent the peak height for each compound divided by 10.000 and normalized to the fresh weight (FW), resulting in the normalized response/FW. Error bars represent the SD (n = 3 plants per line). Different letters above the bars indicate significant differences as determined by One-way ANOVA (p<0.05) and the Holm-Sidak post-test.
Figure 4 with 1 supplement
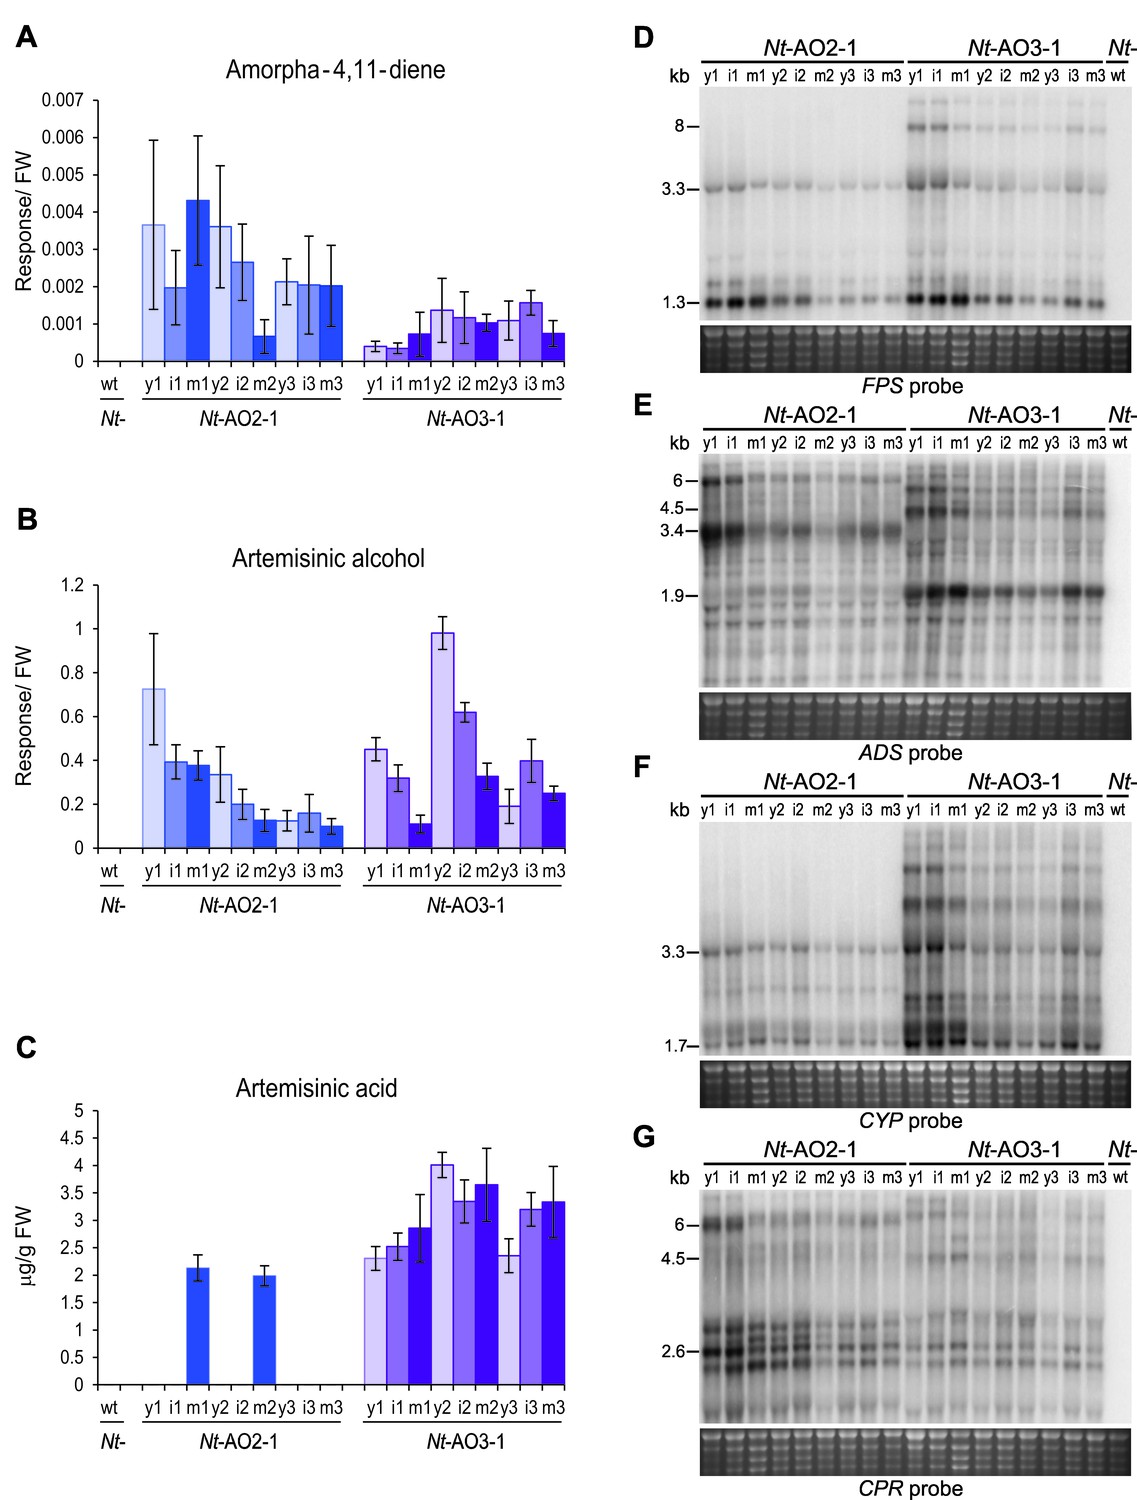
Production of artemisinic acid is maintained throughout plant development and correlates with a high CYP/CPR expression ratio.
Artemisinic compounds and expression levels of the transgenes were measured in young (stage 1), flowering (stage 2) and old plants (stage 3; see Figure 3—figure supplement 1). (A) Amorpha-4,11-diene accumulates to higher levels in line Nt-AO2-1 than in Nt-AO3-1. (B) Artemisinic alcohol is present at similar levels in early (1) and late stages (3) of development in lines Nt-AO2-1 and Nt-AO3-1, but it is slightly higher in the flowering stage (2) of line Nt-AO3-1. (C) Artemisinic acid accumulates to high levels during all developmental stages of line Nt-AO3-1, whereas in line Nt-AO2-1, it is detectable only in mature leaves of young and flowering plants. Relative accumulation of amorpha-4,11-diene and artemisinic alcohol was profiled, the tissue content of artemisinic acid was quantified using an authenticated reference standard (n = 5–6 plants per line; Figures 6 and 7). The sum of free and conjugated artemisinic alcohol and artemisinic acid were determined. y: young leaf; i: expanding (intermediate) leaf; m: fully expanded (mature) leaf. Error bars represent the SD. (D–G) Northern blot analysis of the expression of the four transgenes. Total RNA samples from N. tabacum wild-type (Nt-wt) plants and the transplastomic lines Nt-AO2-1 and Nt-AO3-1 (at the developmental stages 1–3) were separated in denaturing 1.5% agarose gels, blotted and hybridized to strand-specific RNA probes. Below each blot, the rRNA-containing region of the ethidium bromide-stained gel prior to blotting is shown as a control for RNA integrity and equal loading. The Nt-wt sample corresponds to RNA extracted from a fully expanded leaf of a N. tabacum wild-type plant at developmental stage 2. The smallest labeled band in each blot corresponds to the monocistronic mRNA. Larger bands represent unprocessed polycistronic precursor transcripts and read-through transcripts (which are common in plastids; e.g., Elghabi et al., 2011; Lu et al., 2013). CYP transcripts accumulate to higher levels in line Nt-AO3-1, while CPR transcripts accumulate to higher levels in line Nt-AO2-1, resulting in a higher CYP/CPR expression ratio in line Nt-AO3-1.
Figure 4—figure supplement 1
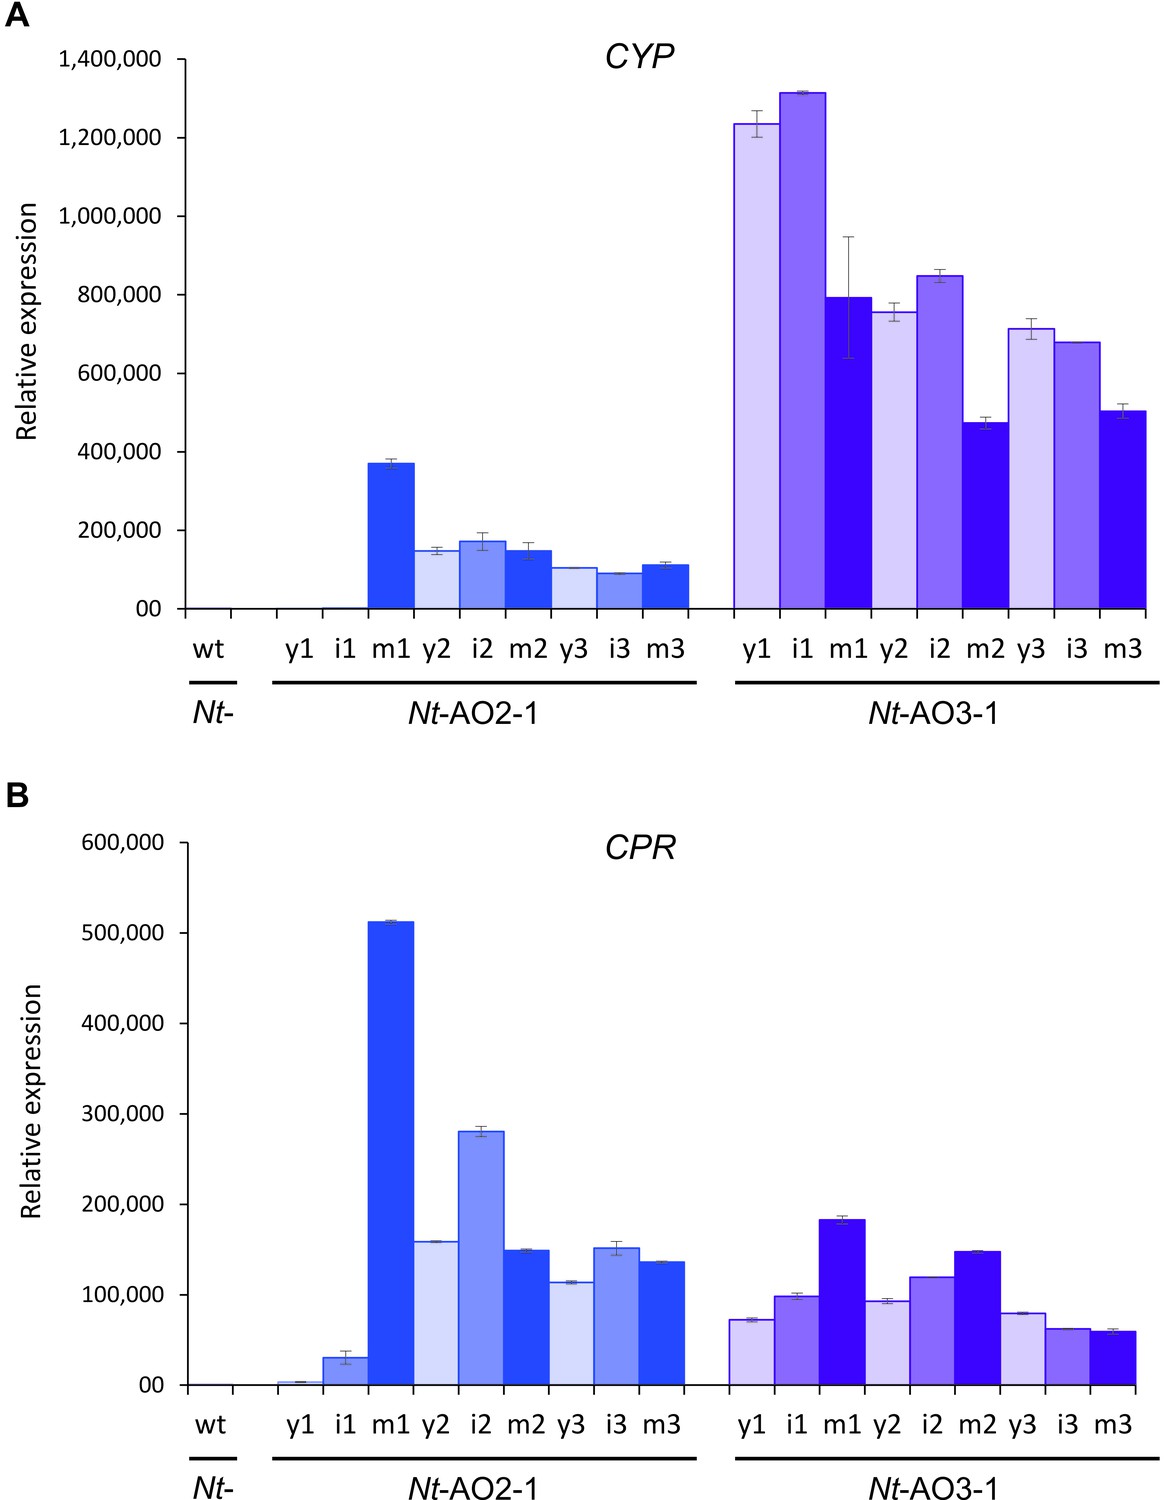
Quantitation of the expression of CYP and CPR by qRT-PCR analysis.
Samples from young (y), expanding (intermediate; i) and fully expanded (mature; m) leaves were measured in three technical replicates for each line, in early, flowering and late developmental stages (1–3; cf. Figure 3—figure supplement 1). The wild-type sample (wt) corresponds to a sample from a fully expanded leaf of N. tabacum cv. Petit Havana at the flowering stage. The qRT-PCR data confirm the northern blot analyses that had revealed a higher CYP to CPR expression ratio in transplastomic line Nt-AO3-1 than in line Nt-AO2-1.
Figure 5 with 2 supplements
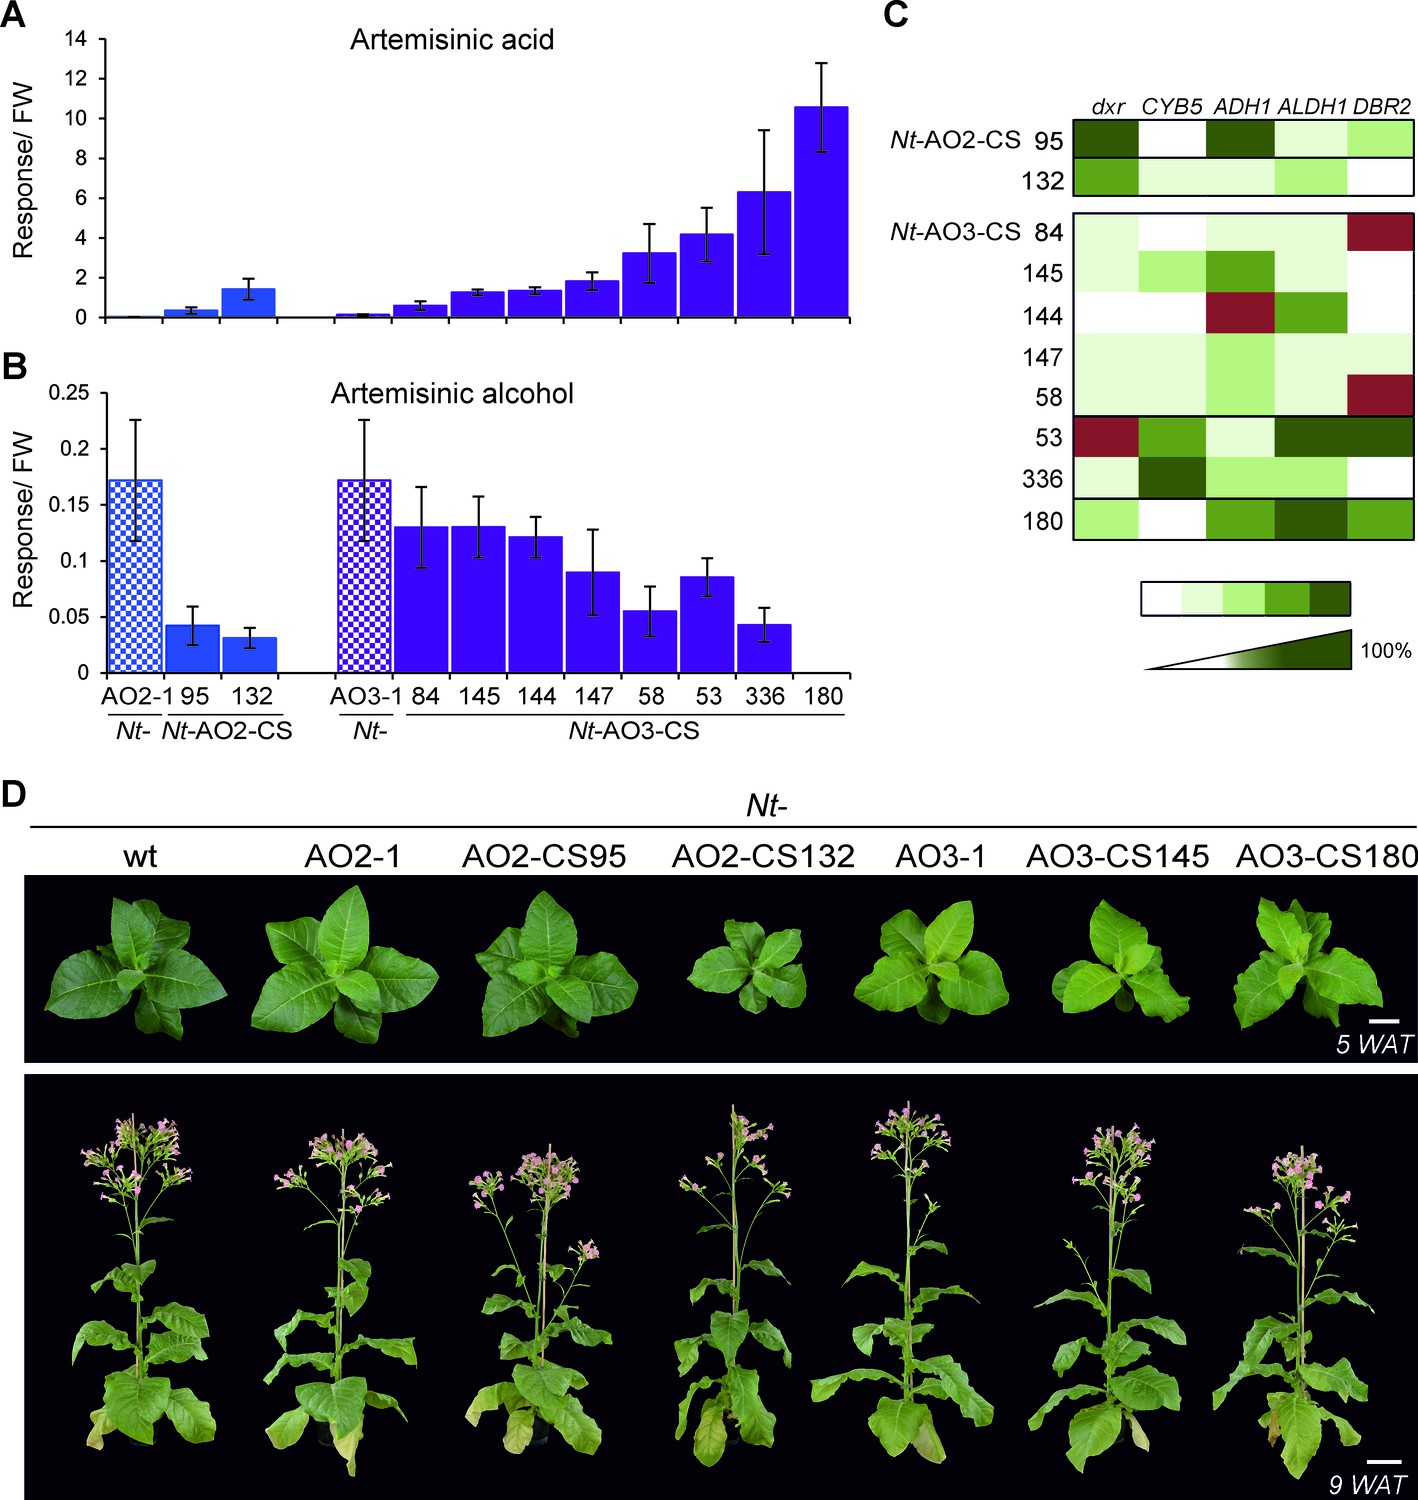
Isolation of combinatorially supertransformed transplastomic lines with a strong increase in artemisinic acid accumulation.
Transplastomic lines Nt-AO2-1 and Nt-AO3-1 were combinatorially supertransformed with genes for additional enzymes of the pathway (Figure 1) to facilitate large-scale screening for increased artemisinic acid production. (A) Relative artemisinic acid levels (given in response/FW; see Materials and methods) in the T1 generation of two combinatorially supertransformed lines obtained with transplastomic recipient line Nt-AO2-1 (Nt-AO2-CS) and eight lines obtained with transplastomic recipient line Nt-AO3-1 (Nt-AO3-CS). An up to 77-fold increase in artemisinic acid was achieved (line Nt-AO3-CS180) in comparison to recipient line Nt-AO3-1. For a complete list of screened supertransformed lines, see Figure 5—source data 1. (B) Inverse relationship between artemisinic acid accumulation and artemisinic alcohol accumulation in supertransformed lines. Fully expanded leaves of 5–6 plants per line (at the flowering stage) were used for metabolite profiling. The sum of free and conjugated artemisinic alcohol and artemisinic acid were determined. (C) qRT-PCR analysis of transgene expression suggests a predominant role of ALDH1 in boosting artemisinic acid synthesis. 2–3 plants per line were measured, and the expression levels were ranked after One-way ANOVA comparison (p<0.05). Brown color indicates absence of gene expression. (D) Combinatorially supertransformed lines with a high increase in artemisinic acid (Nt-AO2-CS132 and Nt-AO3-CS180) display a similar phenotype as the corresponding transplastomic recipient line. WAT: weeks after transfer from tissue culture to soil; scale bars: 10 cm.
-
Figure 5—source data 1
Metabolic screening (phenotyping) and genotyping of the T0 generation of combinatorially supertransformed Nt-AO-CS lines.
The supertransformed lines Nt-AO2-CS and Nt-AO3-CS are arranged according to their artemisinic acid content, from low to high. Fresh weight corrected response values (R/FW) for amorpha-4,11-diene were multiplied by 1,000 and expressed as Rx1000/FW. Dihydroartemisinic acid was only detectable in line Nt-AO3-CS180 at a low level of 0.03 R/FW. Asterisks mark the selected candidate lines further analyzed in the T1 generation. Lines were clustered according to artemisinic acid content using hierarchical cluster analysis based on Ward’s method. Cnd: cluster nd (artemisinic acid not detected); C1: cluster 1; C2: cluster 2; C3: cluster 3; C4: cluster 4; C5: cluster 5. Genes detected in the genomic PCR assays are numbered as follows: 1: dxr; 2: CYB5; 3: ADH1; 4: ALDH1; 5: DBR2; 0: no gene detected; ?: unclear result. nd: not detected; nm: not measured; -: not determined. Amorpha-4,11-diene values are from one measurement per line, values for artemisinic alcohol, dihydroartemisinic alcohol and artemisinic acid represent averages of three technical replicates per line. SD: standard deviation.
- https://doi.org/10.7554/eLife.13664.011
Figure 5—figure supplement 1

Amorpha-4,11-diene, dihydroartemisinic alcohol and dihydroartemisinic acid accumulation in the T1 generation of combinatorially supertransformed plants.
Levels of amorpha-4,11-diene in Nt-AO-CS lines do not correlate with the strong increase in artemisinic acid (Figure 5). Dihydroartemisinic alcohol accumulates to higher levels in lines Nt-AO2-CS95 and Nt-AO3-CS145. Dihydroartemisinic acid is detectable only in two of the best-performing COSTREL lines. Amorpha-4,11-diene levels were determined by GC-MS of VOCs. Dihydroartemisinic alcohol and dihydroartemisinic acid were measured by GC-MS analysis of soluble saponified metabolites. The sum of free and conjugated artemisinic compounds was determined. Error bars represent the SD (n = 5–6 plants per line).
Figure 5—figure supplement 2
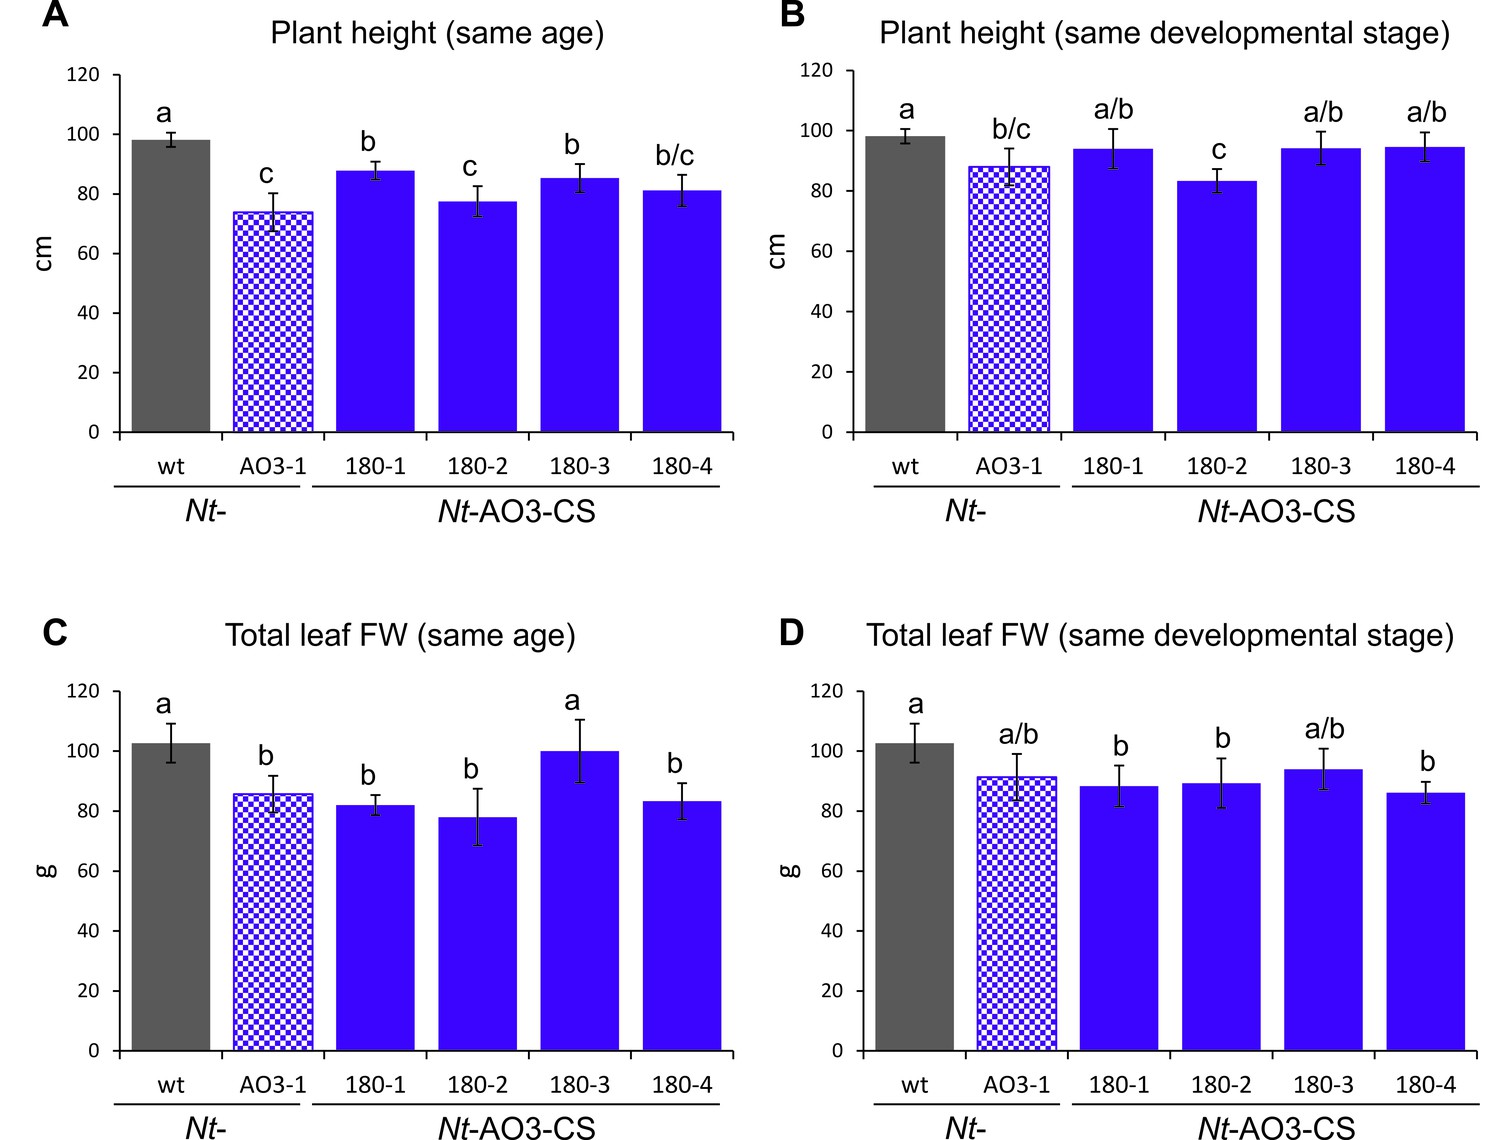
Measurements of plant height and total leaf biomass of COSTREL line Nt-AO3-CS180 (progeny of four different T1 lines), its transplastomic progenitor line Nt-AO3-1 and the wild type (wt).
(A) Comparison of plant height at the same age. Plants were measured when the wild type started to flower. (B) Comparison of plant height at the same developmental stage. Transplastomic line Nt-AO3-1 and COSTREL line Nt-AO3-CS180 were measured five days later than the wild type to compensate for their slightly delayed onset of flowering. (C) Comparison of total leaf biomass (fresh weight, FW) at the same plant age. Plants were measured when the wild type started to flower. (D) Comparison of total leaf biomass at the same developmental stage. Transplastomic line Nt-AO3-1 and COSTREL line Nt-AO3-CS180 were measured five days later than the wild type to compensate for their delayed flowering. Note that, at the same plant age, transplastomic line Nt-AO3-1 and COSTREL line Nt-AO3-CS180 are slightly shorter and produce less total leaf biomass than the wild type. Once the transplastomic plants and the COSTREL lines flower (same developmental stage, five days later), the COSTREL plants reach a height and a total leaf biomass that is close to the values measured for the wild type. On average, the COSTREL plants are 7% shorter and produce 13% less leaf biomass than wild-type plants. No significant difference in either height or total leaf FW was observed between COSTREL plants and their transplastomic progenitor line Nt-AO3-1. Error bars represent the SD (n = 6). Different letters above the bars indicate significant differences as determined by One-way ANOVA (p<0.05) and the Holm-Sidak post-hoc test.
Figure 6
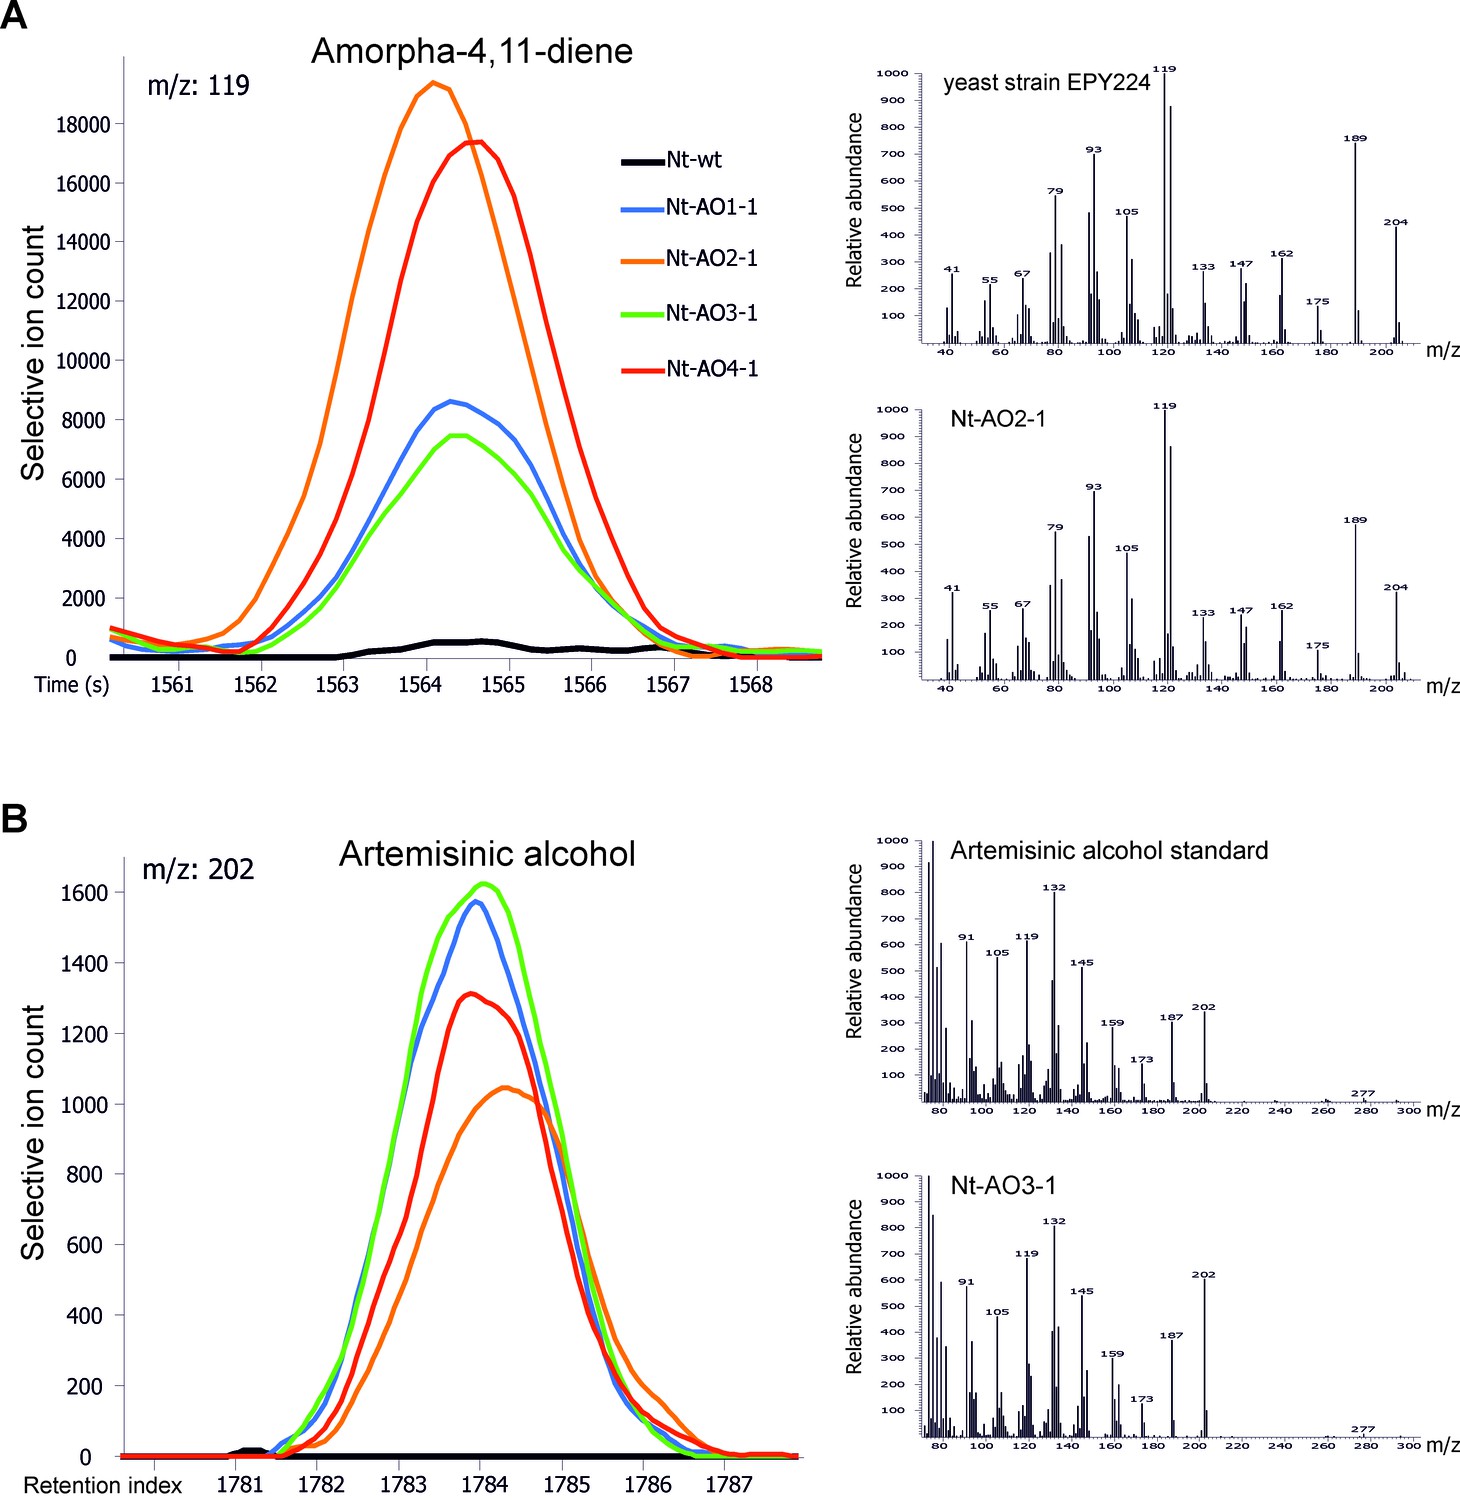
Chromatograms and mass spectra of amorpha-4,11-diene and artemisinic alcohol.
Characteristic peaks for one specific fragment at the expected retention time or index are displayed for each compound. (A) Amorpha-4,11-diene-specific mass feature 119 at a retention time of 1564 s. This metabolite is present in all Nt-AO lines, and at slightly higher levels in lines Nt-AO2-1 and Nt-AO4-1. (B) Artemisinic alcohol-specific mass feature 202 at a retention index of 1784. The compound is present at similar levels in all Nt-AO lines. Both compounds are absent from the wild-type sample. In addition to the chromatograms, the characteristic mass spectrum (m/z) of each compound is shown for the standard and for one of the artemisinic acid operon lines. EPY224: yeast strain that produces amorpha-4,11-diene (Ro et al., 2006). One representative plant per line is depicted. Mass spectra and mass features of trimethylsilylated artemisinic alcohol are shown.
Figure 7
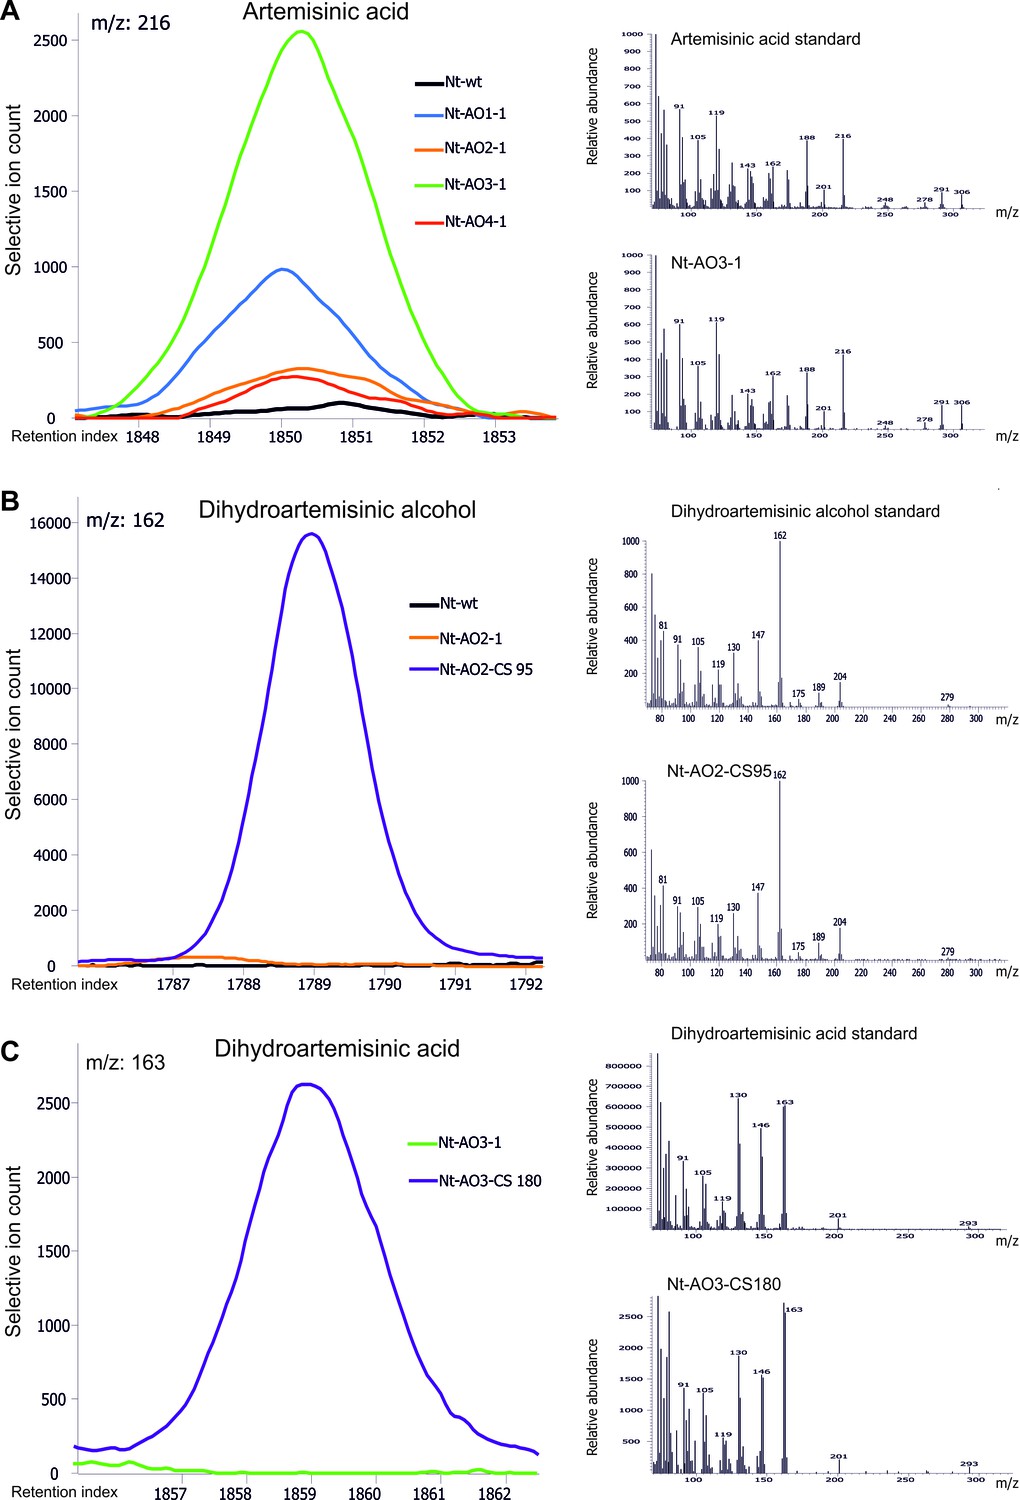
Chromatograms and mass spectra of the artemisinic compounds artemisinic acid, dihydroartemisinic alcohol and dihydroartemisinic acid.
Characteristic peaks for one specific fragment at the expected retention index are shown for each compound. (A) Artemisinic acid-specific mass feature 216 is shown at a retention index of 1850. This compound accumulates to higher levels in lines Nt-AO1-1 and Nt-AO3-1. (B) Dihydroartemisinic alcohol-specific mass feature 162 at a retention index of 1789. The compound is present at high levels in COSTREL line Nt-AO2-CS95, but is absent from transplastomic line Nt-AO2-1. (C) Dihydroartemisinic acid-specific mass feature 163 at a retention index of 1859. This compound accumulates in COSTREL line Nt-AO3-CS180, but is absent from transplastomic line Nt-AO3-1. All compounds are absent from the wild-type sample. In addition to the chromatograms, the characteristic mass spectrum of each compound is shown for the standard and for one of the artemisinic acid operon lines. Mass spectra and mass features of trimethylsilylated artemisinic compounds are shown.
Tables
Table 1
Correlation analysis of artemisinic compounds and transgenes introduced into transplastomic line Nt-AO2-1 by combinatorial supertransformation. The levels of the artemisinic compounds amorpha-4,11-diene, artemisinic alcohol, dihydroartemisinic alcohol and artemisinic acid, and the presence of the transgenes dxr, CYB5, ADH1, ALDH1 and DBR2 were correlated using Spearman’s method in the 39 Nt-AO2-CS lines analyzed by genomic PCR in the T0 generation (see Figure 5—source data 1) using the SPSS software. Dihydroartemisinic acid was excluded from this analysis, because it was not detectable in any of the Nt-AO2-CS lines. CC: correlation coefficient. Positive values indicate positive correlations and negative values indicate negative correlations. *: p<0.05; **: p<0.01; N: number of samples where both variables are present.
| Nt-AO2-CS | Amorpha-4,11-diene | Artemisinic alcohol | Dihydroartemi-sinic alcohol | Artemisinic acid | dxr | CYB5 | ADH1 | ALDH1 | DBR2 | |
|---|---|---|---|---|---|---|---|---|---|---|
| Amorpha-4,11-diene | CC | 1.000 | 0.602** | 0.147 | -0.112 | 0.067 | -0.020 | -0.009 | -0.015 | 0.156 |
| N | 35 | 29 | 13 | 24 | 35 | 35 | 35 | 35 | 35 | |
| Art. alcohol | CC | 0.602** | 1.000 | -0.557* | -0.141 | -0.159 | -0.165 | -0.170 | 0.013 | -0.217 |
| N | 29 | 29 | 13 | 24 | 29 | 29 | 29 | 29 | 29 | |
| Dihydroart. alcohol | CC | 0.147 | -0.557* | 1.000 | 0.642* | 0.462 | 0.248 | 0.383 | 0.180 | 0.496 |
| N | 13 | 13 | 13 | 13 | 13 | 13 | 13 | 13 | 13 | |
| Art. acid | CC | -0.112 | -0.141 | 0.642* | 1.000 | 0.404 | 0.159 | 0.179 | 0.207 | 0.317 |
| N | 24 | 24 | 13 | 24 | 24 | 24 | 24 | 24 | 24 | |
| dxr | CC | 0.067 | -0.159 | 0.462 | 0.404 | 1.000 | 0.643** | 0.402* | 0.546** | 0.578** |
| N | 35 | 29 | 13 | 24 | 39 | 39 | 39 | 39 | 39 | |
| CYB5 | CC | -0.020 | -0.165 | 0.248 | 0.159 | 0.643** | 1.000 | 0.192 | 0.507** | 0.793** |
| N | 35 | 29 | 13 | 24 | 39 | 39 | 39 | 39 | 39 | |
| ADH1 | CC | -0.009 | -0.170 | 0.383 | 0.179 | 0.402* | 0.192 | 1.000 | 0.372* | 0.270 |
| N | 35 | 29 | 13 | 24 | 39 | 39 | 39 | 39 | 39 | |
| ALDH1 | CC | -0.015 | 0.013 | 0.180 | 0.207 | 0.546** | 0.507** | 0.372* | 1.000 | 0.420** |
| N | 35 | 29 | 13 | 24 | 39 | 39 | 39 | 39 | 39 | |
| DBR2 | CC | 0.156 | -0.217 | 0.496 | 0.317 | 0.578** | 0.793** | 0.270 | 0.420** | 1.000 |
| N | 35 | 29 | 13 | 24 | 39 | 39 | 39 | 39 | 39 |
Table 2
Correlation analysis of artemisinic compounds and transgenes introduced into transplastomic line Nt-AO3-1 by combinatorial supertransformation. The levels of the artemisinic compounds amorpha-4,11-diene, artemisinic alcohol, dihydroartemisinic alcohol and artemisinic acid, and the presence of the transgenes dxr, CYB5, ADH1, ALDH1 and DBR2 were correlated using Spearman’s method in the 61 Nt-AO3-CS lines analyzed by genomic PCR in the T0 generation (see Figure 5—source data 1) using the SPSS software. Dihydroartemisinic acid had to be excluded from this analysis, because it was detectable only in one of the Nt-AO3-CS lines in the T0 generation. Note that the negative correlation between artemisinic alcohol and artemisinic acid (Figure 5A,B) is restricted to those lines that display increased artemisinic acid contents, and therefore is not statistically significant over all COSTREL lines analyzed (cf. Figure 5—source data 1). CC: correlation coefficient. Positive values indicate positive correlations and negative values indicate negative correlations. *: p<0.05; **: p<0.01; N: number of samples where both variables are present.
| Nt-AO3-CS | Amorpha-4,11-diene | Artemisinic alcohol | Dihydroartemi-sinic alcohol | Artemisinic acid | dxr | CYB5 | ADH1 | ALDH1 | DBR2 | |
|---|---|---|---|---|---|---|---|---|---|---|
| Amorpha-4,11-diene | CC | 1.000 | 0.363** | 0.079 | 0.237 | 0.006 | 0.082 | 0.439** | -0.032 | 0.049 |
| N | 60 | 58 | 39 | 59 | 60 | 60 | 60 | 60 | 60 | |
| Art. alcohol | CC | 0.363** | 1.000 | 0.124 | -0.081 | -0.088 | -0.119 | 0.086 | 0.026 | -0.009 |
| N | 58 | 59 | 39 | 59 | 59 | 59 | 59 | 59 | 59 | |
| Dihydroart. alcohol | CC | 0.079 | 0.124 | 1.000 | 0.029 | -0.169 | 0.153 | 0.306 | 0.195 | 0.219 |
| N | 39 | 39 | 39 | 39 | 39 | 39 | 39 | 39 | 39 | |
| Art. acid | CC | 0.237 | -0.081 | 0.029 | 1.000 | 0.241 | 0.183 | 0.217 | 0.386** | 0.141 |
| N | 59 | 59 | 39 | 60 | 60 | 60 | 60 | 60 | 60 | |
| dxr | CC | 0.006 | -0.088 | -0.169 | 0.241 | 1.000 | 0.153 | 0.224 | 0.415** | 0.170 |
| N | 60 | 59 | 39 | 60 | 61 | 61 | 61 | 61 | 61 | |
| CYB5 | CC | 0.082 | -0.119 | 0.153 | 0.183 | 0.153 | 1.000 | 0.185 | 0.322* | 0.503** |
| N | 60 | 59 | 39 | 60 | 61 | 61 | 61 | 61 | 61 | |
| ADH1 | CC | 0.439** | 0.086 | 0.306 | 0.217 | 0.224 | 0.185 | 1.000 | 0.339** | 0.252* |
| N | 60 | 59 | 39 | 60 | 61 | 61 | 61 | 61 | 61 | |
| ALDH1 | CC | -0.032 | 0.026 | 0.195 | 0.386** | 0.415** | 0.322* | 0.339** | 1.000 | 0.444** |
| N | 60 | 59 | 39 | 60 | 61 | 61 | 61 | 61 | 61 | |
| DBR2 | CC | 0.049 | -0.009 | 0.219 | 0.141 | 0.170 | 0.503** | 0.252* | 0.444** | 1.000 |
| N | 60 | 59 | 39 | 60 | 61 | 61 | 61 | 61 | 61 |
Table 3
List of oligonucleotides used in this study. The reverse primers (_R) for amplification of the genes FPS, ADS, CYP and CPR contain the sequence of the T7 promoter (bold) to facilitate in vitro transcription.
| Gene | Primer | Sequence (5'→3') | Purpose |
|---|---|---|---|
| dxr | DXR_F | CAACCTATGTACGTTGTTGGAGAAGAGGG | qPCR |
| DXR_R | CTGGAGCACCAGCAATCAATGTCTC | ||
| CYB5 | CYB5_F | CCAGGAGGAGATGAAGTTCTTTTGGCTG | qPCR |
| CYB5_R | GCTGGAGGAACGTAAGCTCTCTTCTTTG | ||
| ADH1 | qADH1_F2 | TCCAGGTCATGAAGGTGTTG | qPCR |
| qADH1_R2 | ATTGTCCACACTCACCAAGG | ||
| ALDH1 | ALDH1_F | CCTGTTTCTTTGGAATTGGGTGGTAAGTC | qPCR |
| ALDH1_R | CAGCAACACACATCTCACCTTTGTTAGTG | ||
| DBR2 | DBR2_F | GAGCAAGTTGAGGGTTGGAAGAAAGTTG | qPCR |
| DBR2_R | TAGAAGAGATAGGAGCAGCTCCACCTG | ||
| CYP | CYP_qF | CCTGAACCTTGGAGATTACC | qPCR |
| CYP_qR | GCCCATTTAGGAGAAGATACAAC | ||
| CPR | CPR_qF | CCTGTTGGAATGGGTGATG | qPCR |
| CPR_qR | CCTACAGCAGCAGTATAAGGAG | ||
| ACTIN | qTac9actin f | CCTGAGGTCCTTTTCCAACCA | qPCR |
| qTac9actin r | GGATTCCGGCAGCTTCCATT | ||
| FPS | FPS_probe_F | CCTGCTTTTGAATTTGATGATG | RNA probe |
| FPS_probe_R | TAATACGACTCACTATAGGGCGAAACCAACAAGGTTGTCC | ||
| ADS | ADS_probe_F | CTGAAGCTGTTGAAAGATGGTC | RNA probe |
| ADS_probe_R | TAATACGACTCACTATAGGGGGAGCAGATACAGCCCATTC | ||
| CYP | CYP_probe_F | TCCTCATCGAGGAGTACGAG | RNA probe |
| CYP_probe_R | TAATACGACTCACTATAGGGTTACAGGTCGTCCAGATCCAG | ||
| CPR | CPR_probe_F | ATGATTGGTCCTGGAACTGG | RNA probe |
| CPR_probe_R | TAATACGACTCACTATAGGGGCCATTCCTTTAGCATCTCC |
Download links
A two-part list of links to download the article, or parts of the article, in various formats.
Downloads (link to download the article as PDF)
Open citations (links to open the citations from this article in various online reference manager services)
Cite this article (links to download the citations from this article in formats compatible with various reference manager tools)
A new synthetic biology approach allows transfer of an entire metabolic pathway from a medicinal plant to a biomass crop
eLife 5:e13664.
https://doi.org/10.7554/eLife.13664


