The structure of the core NuRD repression complex provides insights into its interaction with chromatin
- University of Leicester, United Kingdom
- University of Warwick, United Kingdom
Figures
Figure 1 with 1 supplement
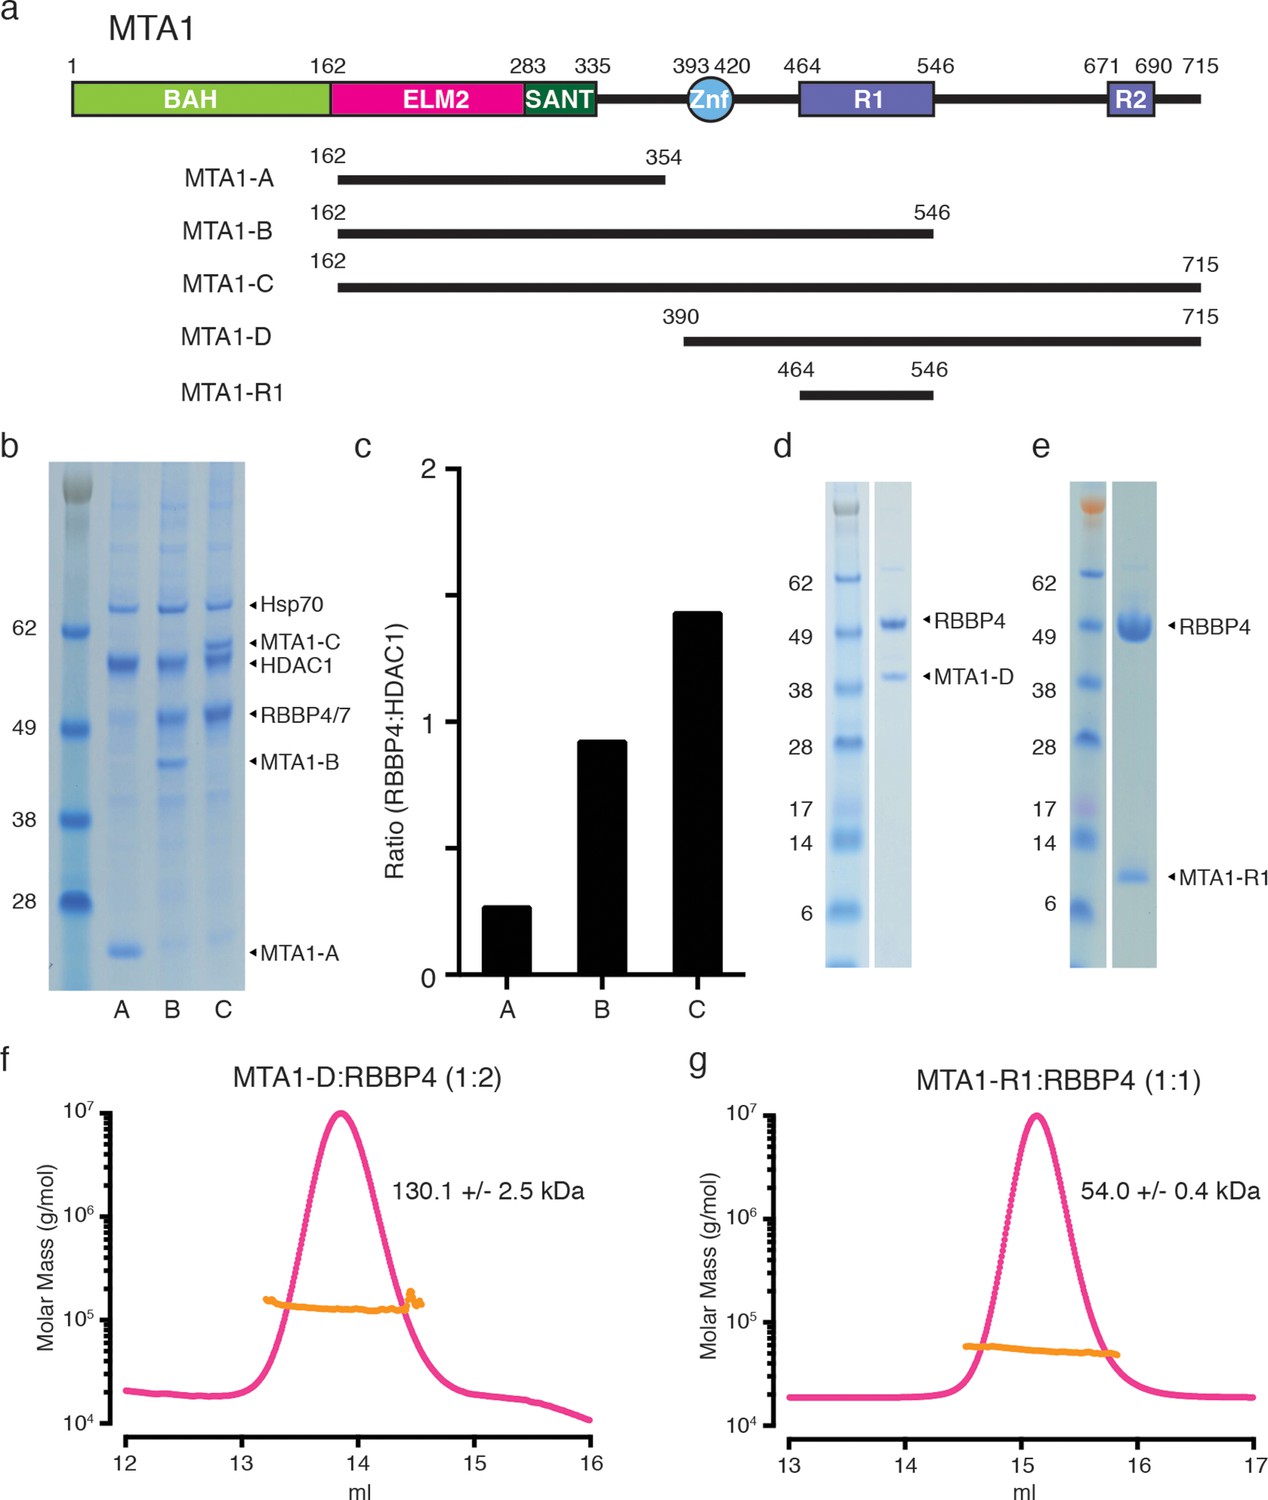
MTA1 co-purifies with endogenous RBBP4/7 in a supra-stoichiometric ratio.
(a) Schematic representation of the domain structure of MTA1, with the R1 and R2 RBBP4 recruitment domains shown in purple. A summary of fragments used in the interaction studies is shown below. (b) MTA1-B and MTA1-C co-purify with endogenous RBBP4/7, as identified by mass spectrometry, in a stoichiometric and a supra-stoichiometric ratio respectively. (c) The ratio of endogenous RBBP4/7 to co-transfected HDAC1 is quantified from the SDS-PAGE gel by densitometry. (d) and (e) Co-expression of the MTA1-D:RBBP4 and MTA1-R1:RBBP4 complexes. (f) and (g) Co-expressed MTA1-D:RBBP4 and MTA1-R1:RBBP4 are shown to form complexes of 1:2 and 1:1 stoichiometry, respectively, as determined by size exclusion chromatography coupled to multi-angle light scattering (MALS). See Figure 1—figure supplement 1 for information about expression, purification and crystallisation.
Figure 1—figure supplement 1
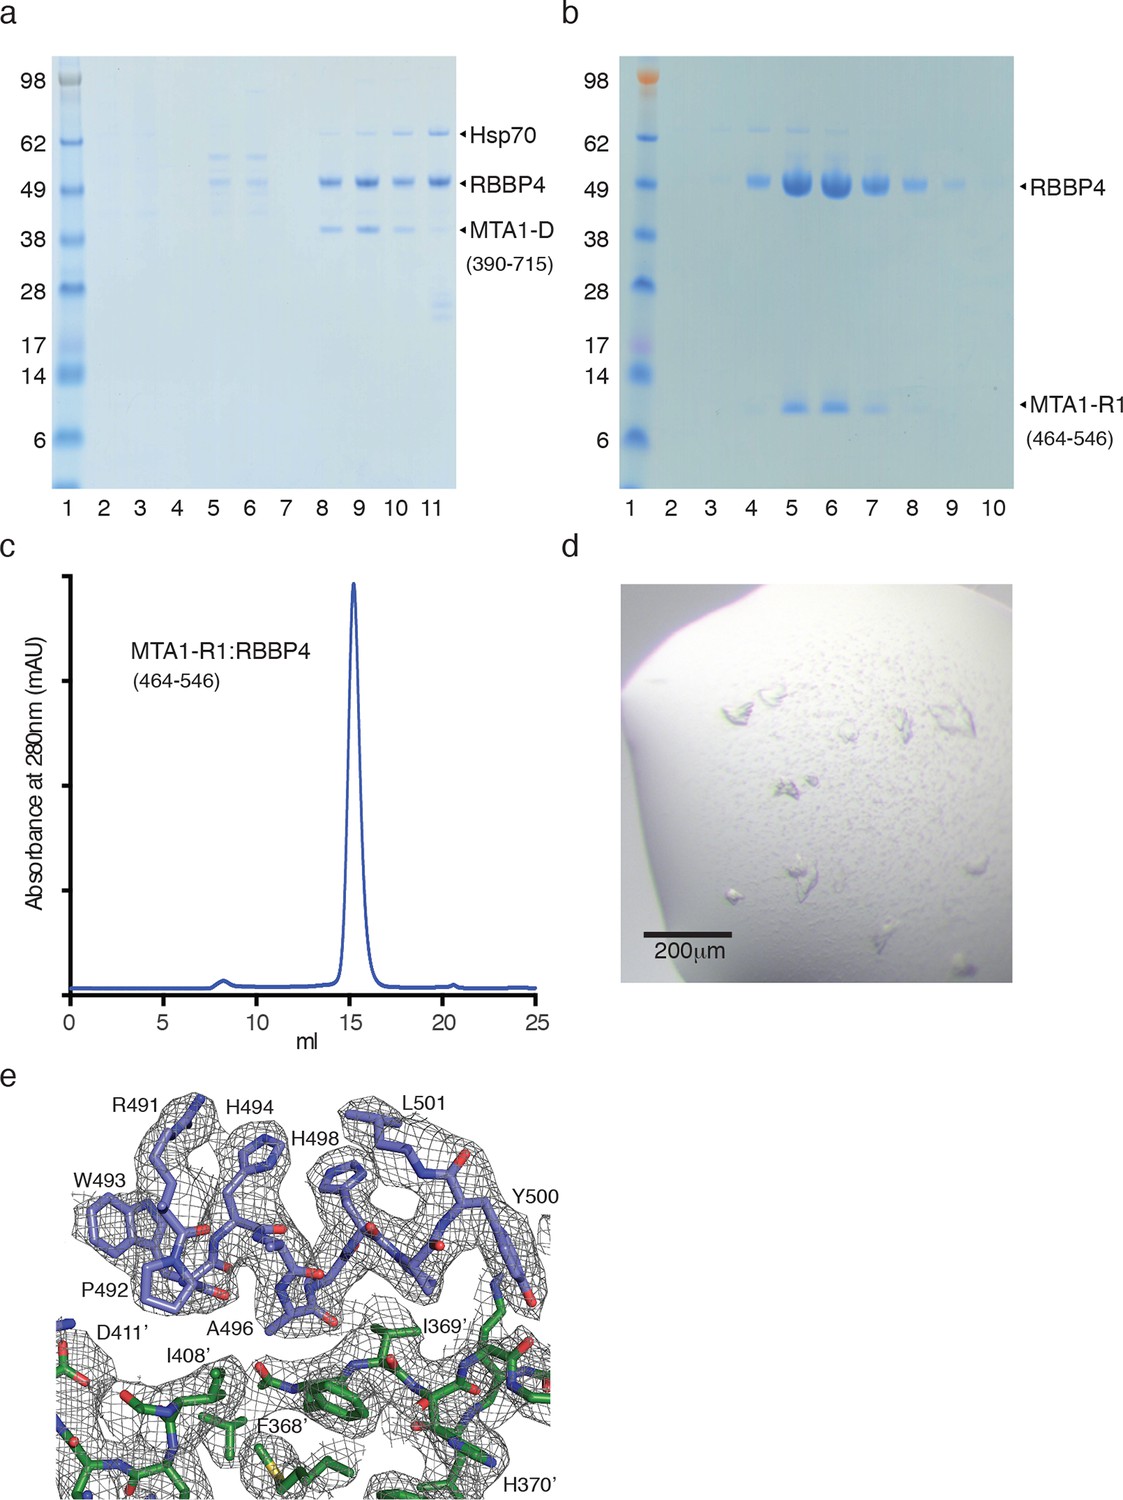
Purification of MTA1:RBBP4 complexes.
(a) SDS-PAGE gel showing purification of the co-transfected MTA1-D (390–715):RBBP4 complex by gel filtration. Peak elution of the complex is in lane 9. (b) and (c) SDS-PAGE gel and Superdex S200 gel filtration profile of the co-transfected MTA1-R1 (464–546):RBBP4 complex. Peak elution of the complex is in lane 6. (d) Crystals of the MTA1-R1:RBBP4 complex. (e) Electron density (2Fo-Fc) contoured at 1σ showing the interface between MTA1-R1 domain (blue) and RBBP4 (green).
Figure 2
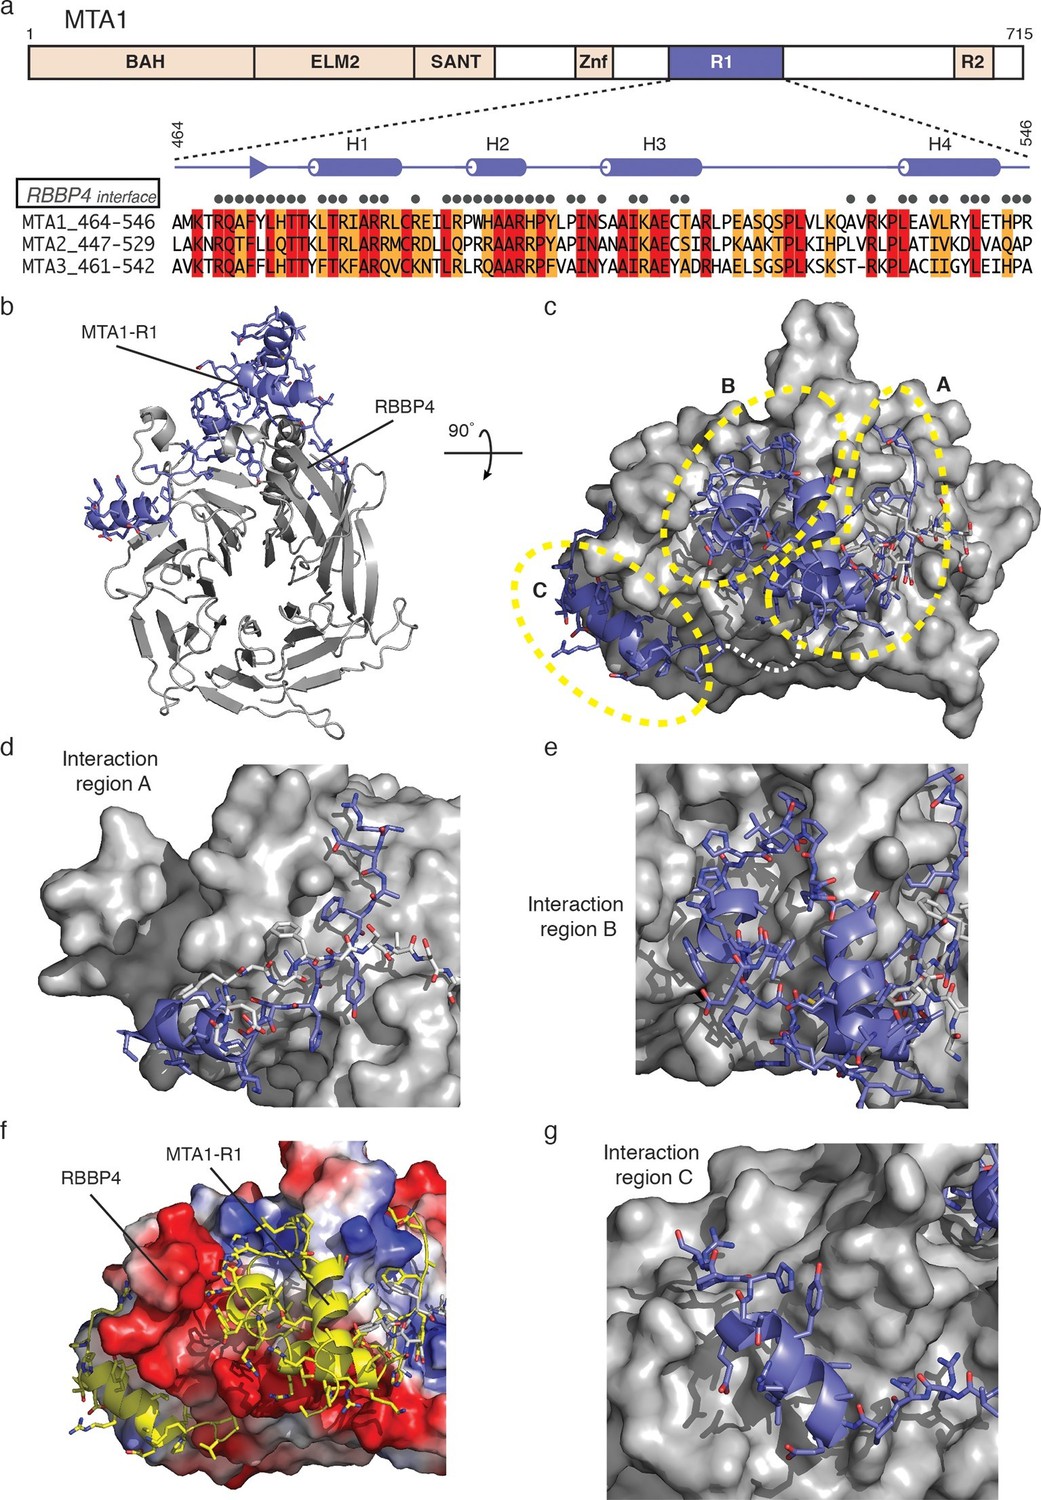
The crystal structure of MTA1-R1 domain bound to RBBP4.
(a) Schematic representation of the domain structure of MTA1. The secondary structure of MTA1-R1 (464–546), corresponding to the R1 domain, is shown. Those residues of MTA1 that form an interface with RBBP4 in the crystal structure are indicated. Below is the sequence alignment of the R1 domains from MTA1, 2 and 3. Residues coloured red are identical and residues coloured orange are conserved. (b) Cartoon representation of the MTA1-R1:RBBP4 complex with MTA1 in purple and RBBP4 in grey. (c) The structure is rotated by 90° and the surface of RBBP4 is shown. The dotted white line indicates the part of MTA1 that is disordered. The 5G loop in RBBP4 is shown as sticks with grey coloured carbon atoms. MTA1-R1 is rationalised into three interaction regions A, B and C and these are shown in more detail in (d), (e) and (g). MTA1 is shown as a cartoon and RBBP4 as a grey surface. (f) Electrostatic surface view of RBBP4 with MTA1 shown in yellow. See Video 1 for a 3D view of the MTA1-R1:RBBP4 complex and Table 1 for the crystallographic data collection and refinement statistics.
Figure 3 with 2 supplements
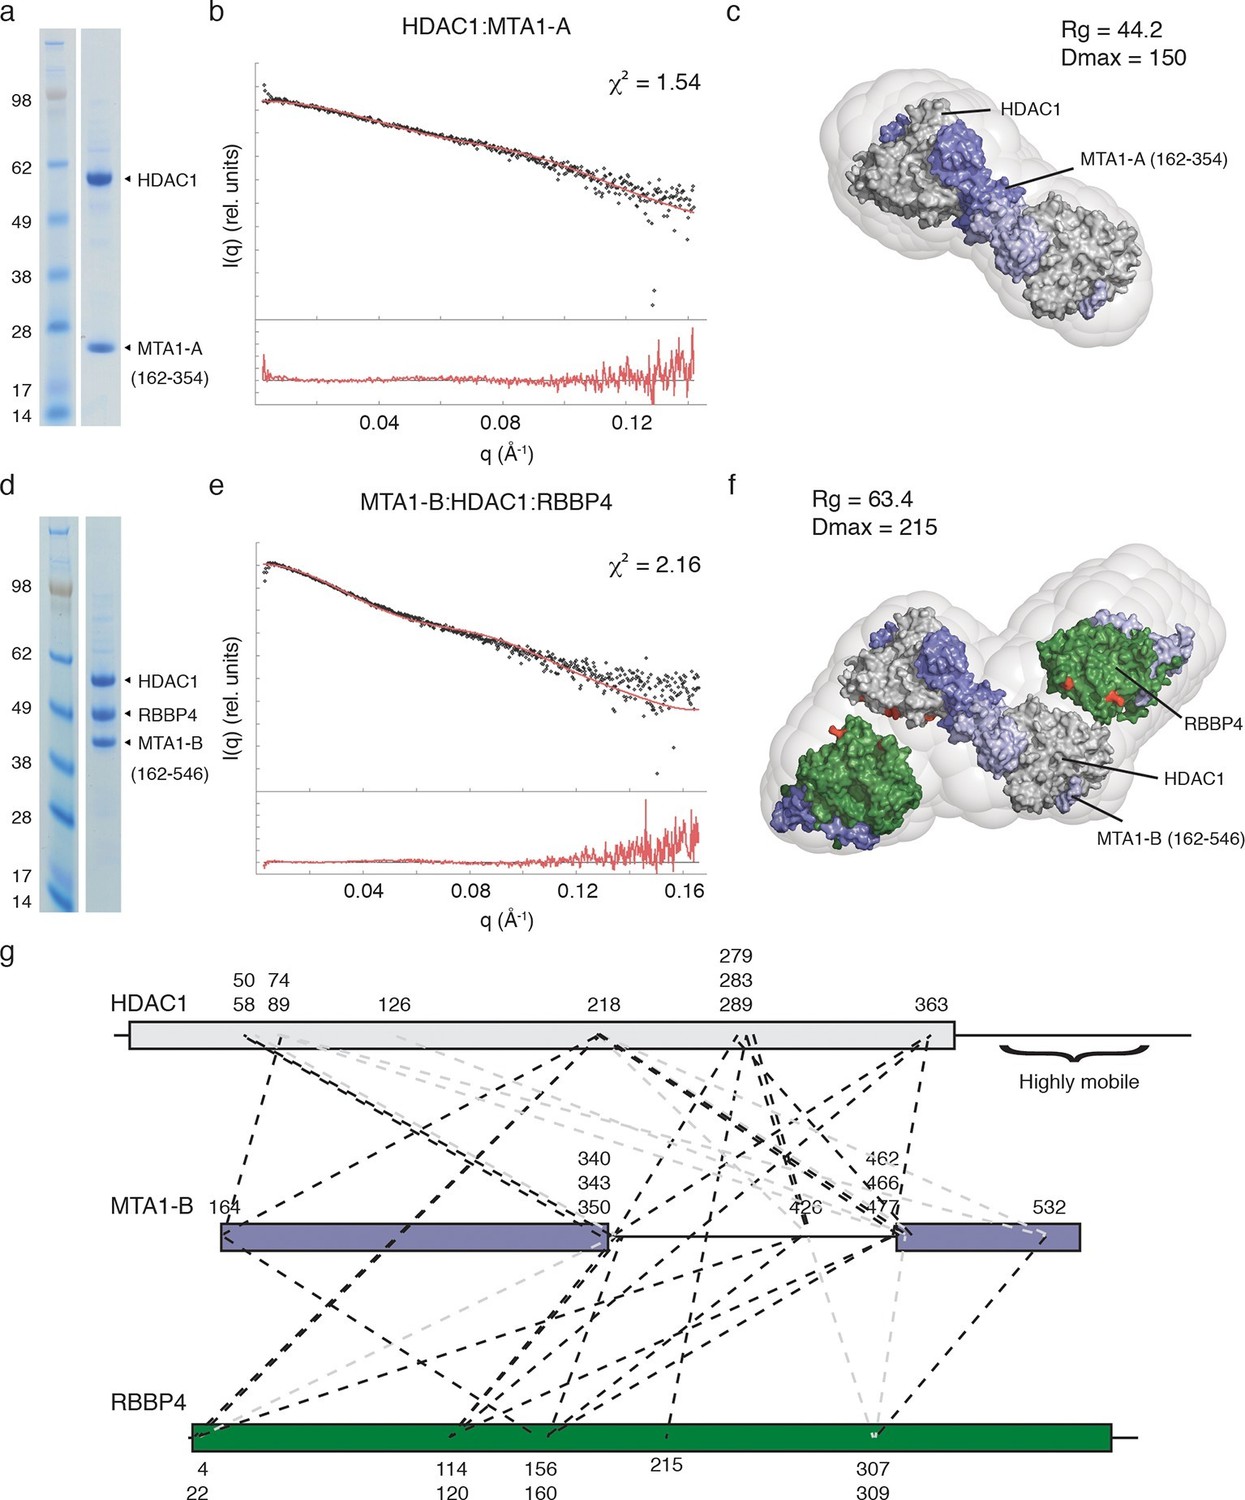
The core NuRD complex has an elongated structure.
(a) Co-expression of the HDAC1:MTA1-A (162–354) complex. (b) SAXS data of HDAC1:MTA1-A with the theoretical scattering curve from the HDAC1:MTA1 dimer (pdb code: 4BKX) superimposed in red and the fit residuals are shown. (c) The HDAC1:MTA1 crystal structure is fitted into the ab initio molecular envelope derived from the SAXS curve. MTA1 is coloured purple and HDAC1 is shown in grey. (d) Co-expression of the MTA1-B (162–546):HDAC1:RBBP4 complex. (e) SAXS data of MTA1-B:HDAC1:RBBP4 with the theoretical scattering curve from the MTA1:HDAC1:RBBP4 model superimposed in red and the fit residuals are shown. (f) The model of MTA1:HDAC1:RBBP4 is fitted into the ab initio molecular envelope derived from the SAXS curve. MTA1 is shown in purple, HDAC1 in grey and RBBP4 in green. The MTA1-R1:RBBP4 crystal structure is orientated based on crosslinks identified on surface of HDAC1 and RBBP4 and these are coloured red. (g) Isotopic crosslinking of MTA1-B:HDAC1:RBBP4. Black dotted lines indicate crosslinks that could be mapped onto the model of MTA1:HDAC1:RBBP4 and those that could not be mapped are shown in grey. The HDAC1 carboxy-terminus is predicted highly disordered and the large number of crosslinks seen to this region suggest it is highly mobile. These crosslinks are not shown for simplicity. See Figure 3—figure supplement 1 and Figure 3—figure supplement 2 for information about purification and SAXS measurements, and Figure 3—source data 1 for crosslinks between MTA1, HDAC1 and RBBP4.
-
Figure 3—source data 1
Crosslinks within the MTA1-B (162–546):HDAC1:RBBP4 complex.
Intermolecular crosslinks are listed with the respective proteins and amino acids identified. Crosslinks with an xQuest score greater than 14.5 are included. Crosslinks that fit the model are numbered. Crosslinks that do not fit the model are indicated "x" and we presume result from low levels of aggregation between complexes.
- https://doi.org/10.7554/eLife.13941.009
Figure 3—figure supplement 1
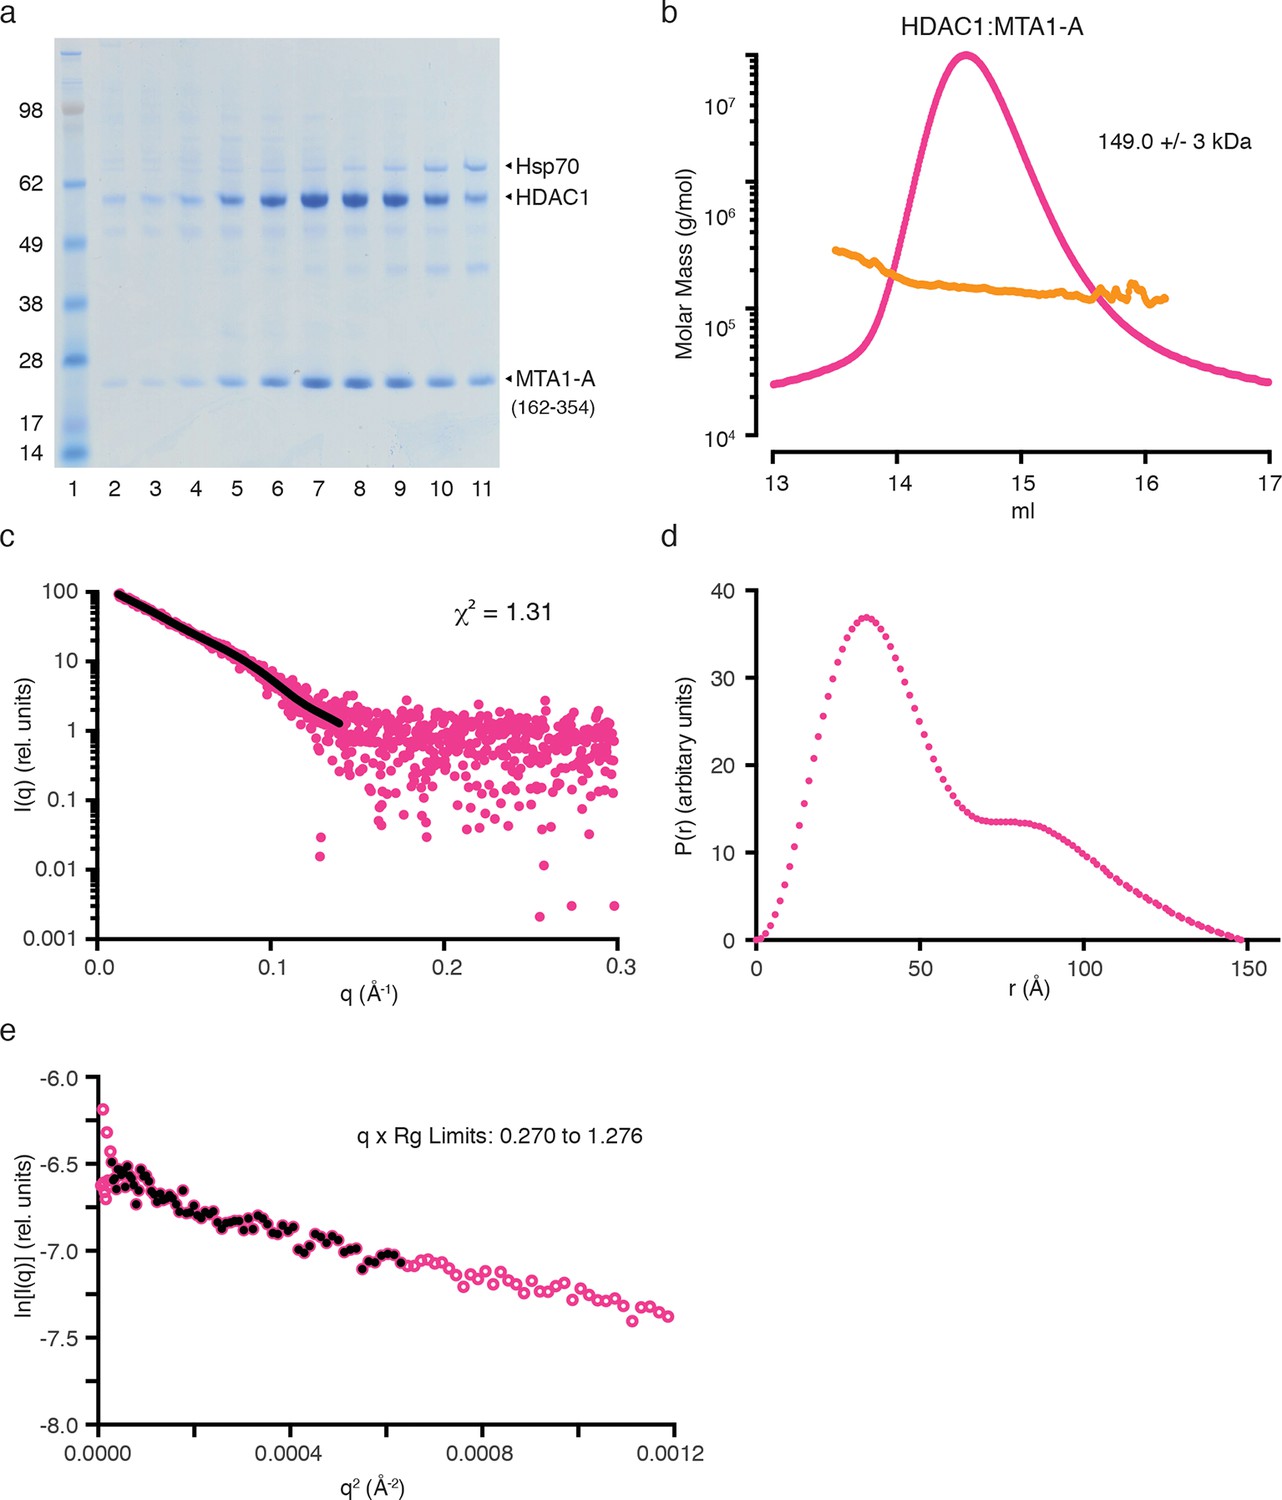
Purification and SAXS analysis of the HDAC1:MTA1-A (162–354) complex.
(a) SDS-PAGE gel showing the purification of HDAC1:MTA1-A by gel filtration. Peak elution of the complex is in lane 8. (b) The light scattering profile (MALS) and calculated molecular weight of HDAC1:MTA1-A. (c) SAXS data of HDAC1:MTA1-A with a line of best fit to the scattering superimposed in black. (d) P(r) distribution for HDAC1:MTA1-A used to determine Dmax. (e) Guinier plot calculated from the scattering data for HDAC1:MTA1-A.
Figure 3—figure supplement 2
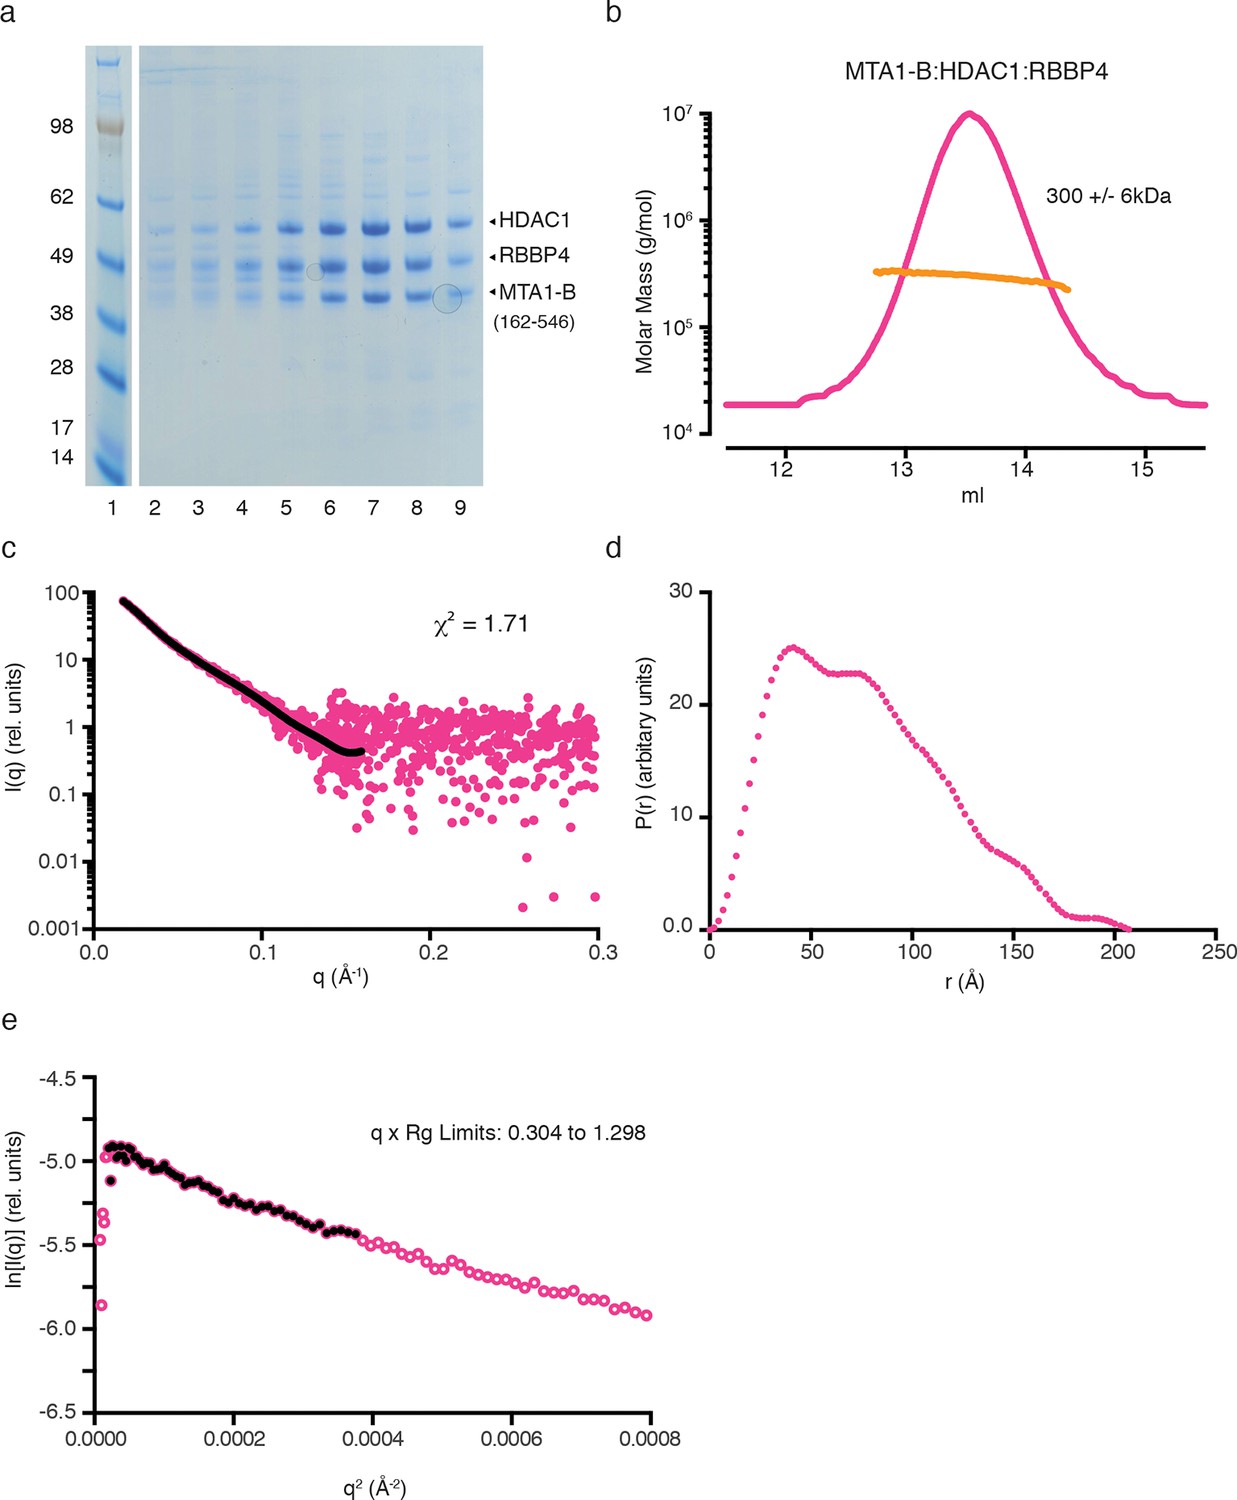
Purification and SAXS analysis of the MTA1-B (162–546):HDAC1:RBBP4 complex.
(a) SDS-PAGE gel showing the purification of MTA1-B:HDAC1:RBBP4 by gel filtration. Peak elution of the complex is in lane 7. (b) The light scattering profile (MALS) and calculated molecular weight of MTA1-B:HDAC1:RBBP4. (c) SAXS data of MTA1-B:HDAC1:RBBP4 with a line of best fit to the scattering superimposed in black. (d) P(r) distribution for MTA1-B:HDAC1:RBBP4 used to determine Dmax. (e) Guinier plot calculated from the scattering data for MTA1-B:HDAC1:RBBP4.
Figure 4 with 1 supplement
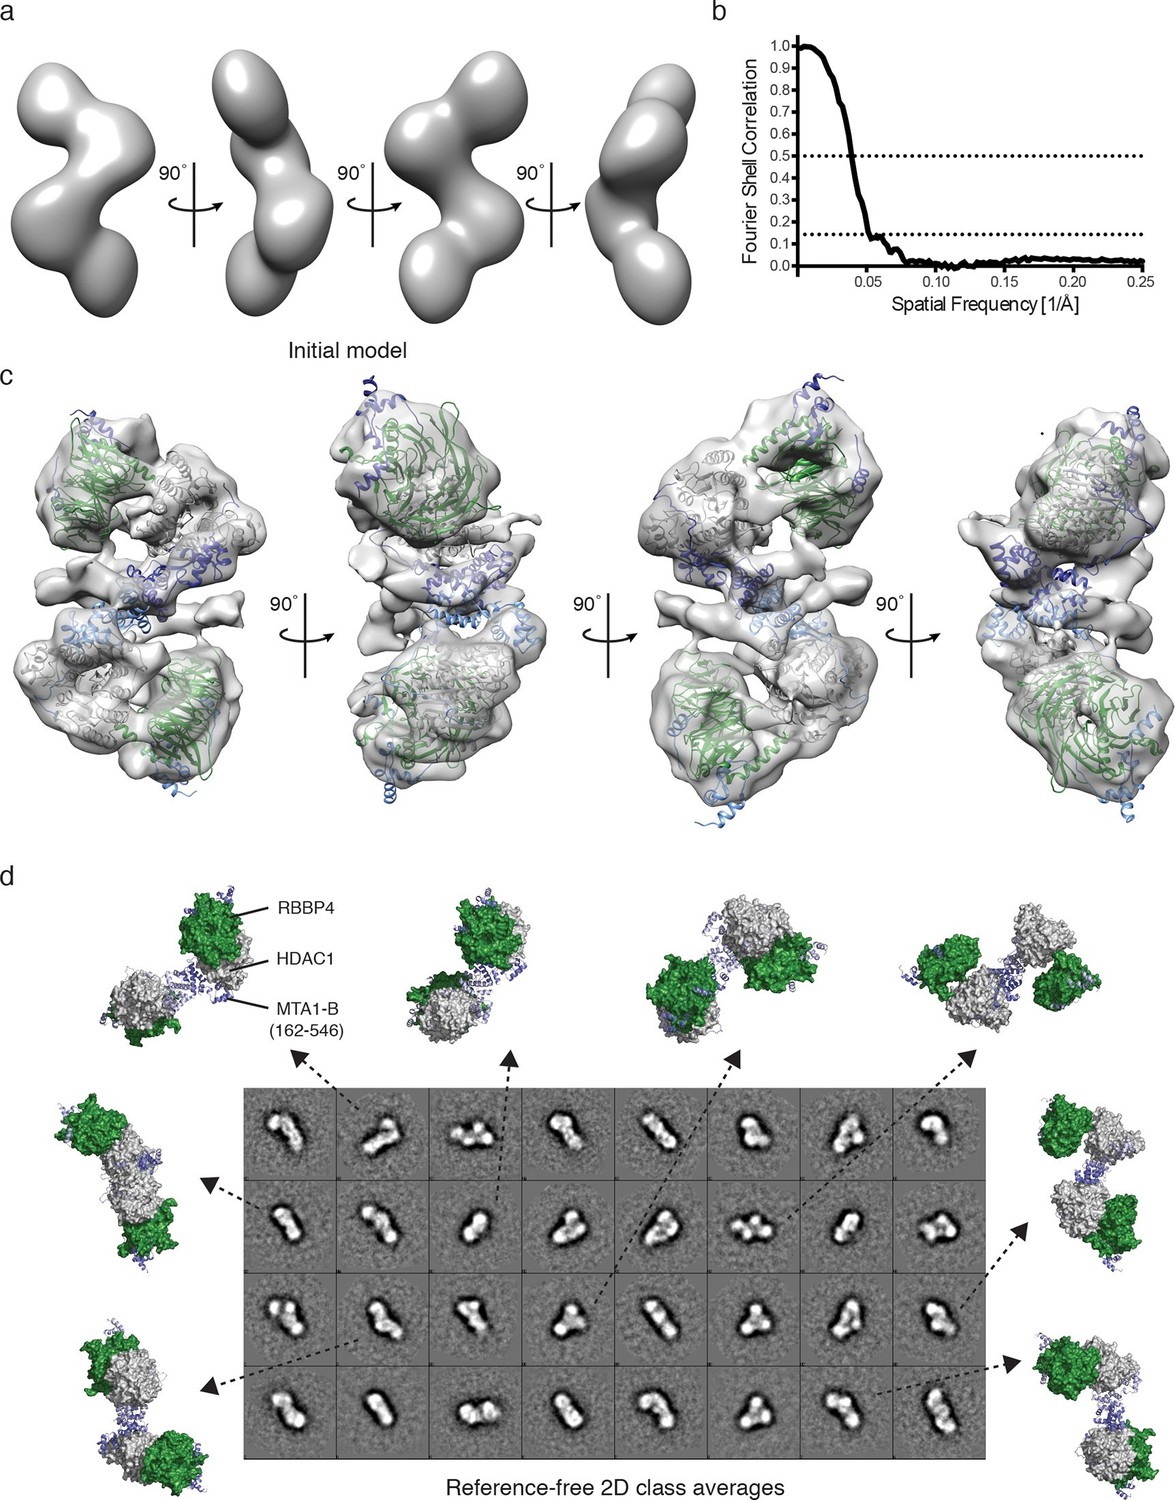
Visualisation of the core NuRD complex by negative-stain electron microscopy.
(a) 60 Å filtered initial model of the MTA1-B (162–546):HDAC1:RBBP4 complex generated from the SAXS and crosslinking data. (b) The resolution of the final EM model was estimated to be 19 Å using the Fourier shell correlation criterion with a cutoff of 0.143 (26 Å using a cutoff of 0.5). (c) Final EM model and fitting after refinement against 17,841 particles. (d) Comparison of different views of the MTA1-B:HDAC1:RBBP4 complex, generated after EM model fitting, with the reference-free 2D class averages. MTA1 is shown in blue, HDAC1 in grey and RBBP4 in green. See Video 2 for a 3D view of the MTA1-B (162–546):HDAC1:RBBP4 complex and Figure 4—figure supplement 1 for class averaged particles and re-projections of the EM model.
Figure 4—figure supplement 1
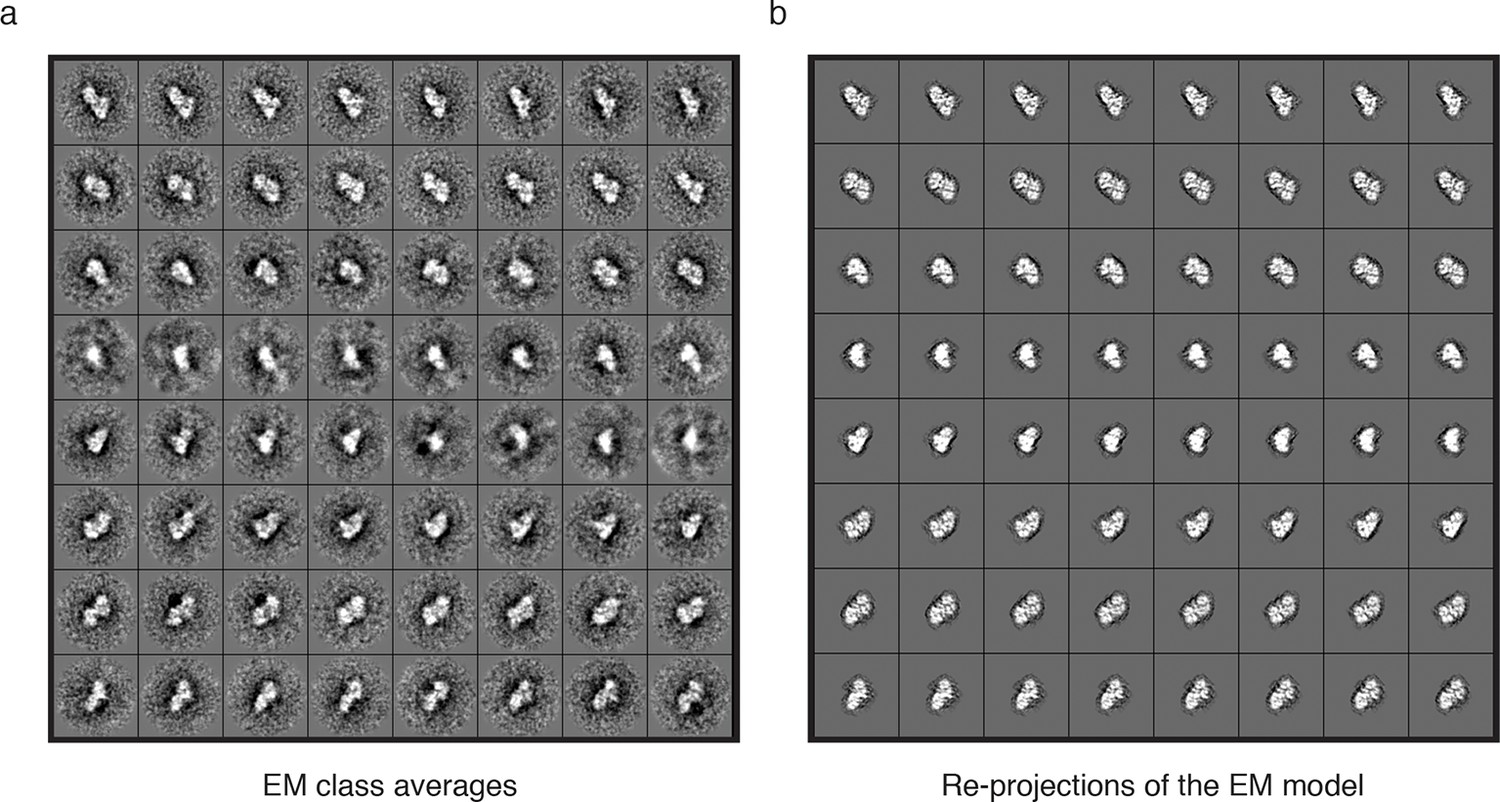
Further analysis of the EM model.
Subset of (a) class averaged particles and (b) matching re-projections of the MTA1-B:HDAC1:RBBP4 complex.
Figure 5
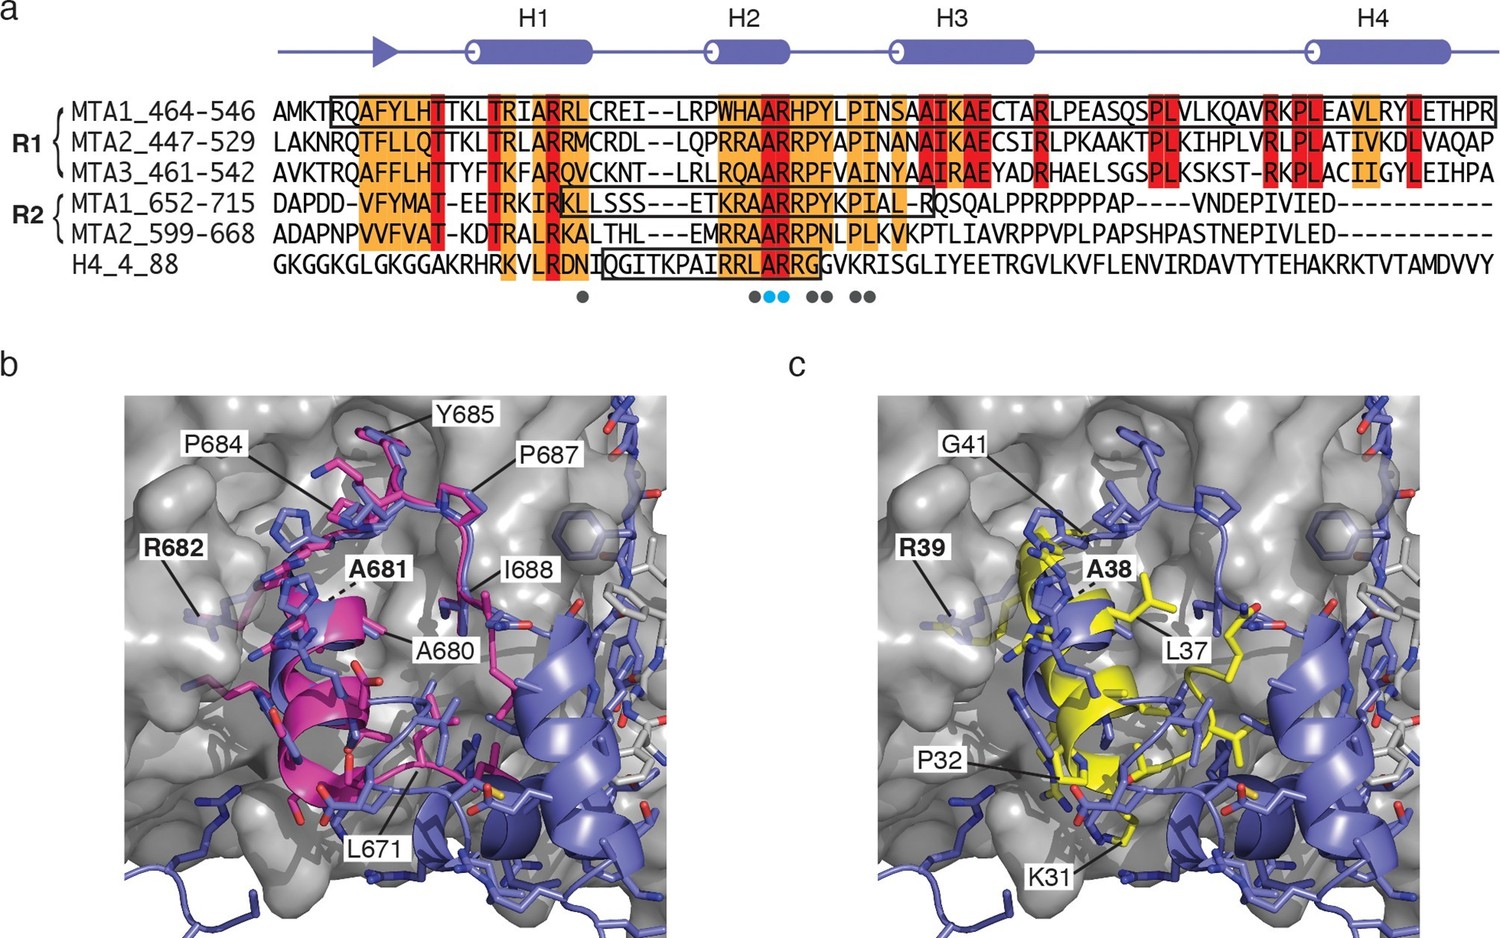
Comparison of the MTA1-R1:RBBP4 structure with other RBBP4 complexes.
(a) The domain structure of MTA1 highlighting the R1 and R2 domains. Below is a sequence alignment of the R1 domains of MTA1/2/3, R2 domains of MTA1/2 and histone H4. Boxes highlight the residues that have been crystallised in complex with RBBP4. Residues coloured red are identical and residues coloured orange are conserved. (b) Overlay of crystal structures of MTA1-R1 domain with a peptide corresponding to the MTA1-R2 domain (671–690) in complex with RBBP4. (c) Overlay of crystal structures of the MTA1-R1 domain with a histone H4 peptide (27–41) in complex with RBBP4.
Figure 6 with 1 supplement
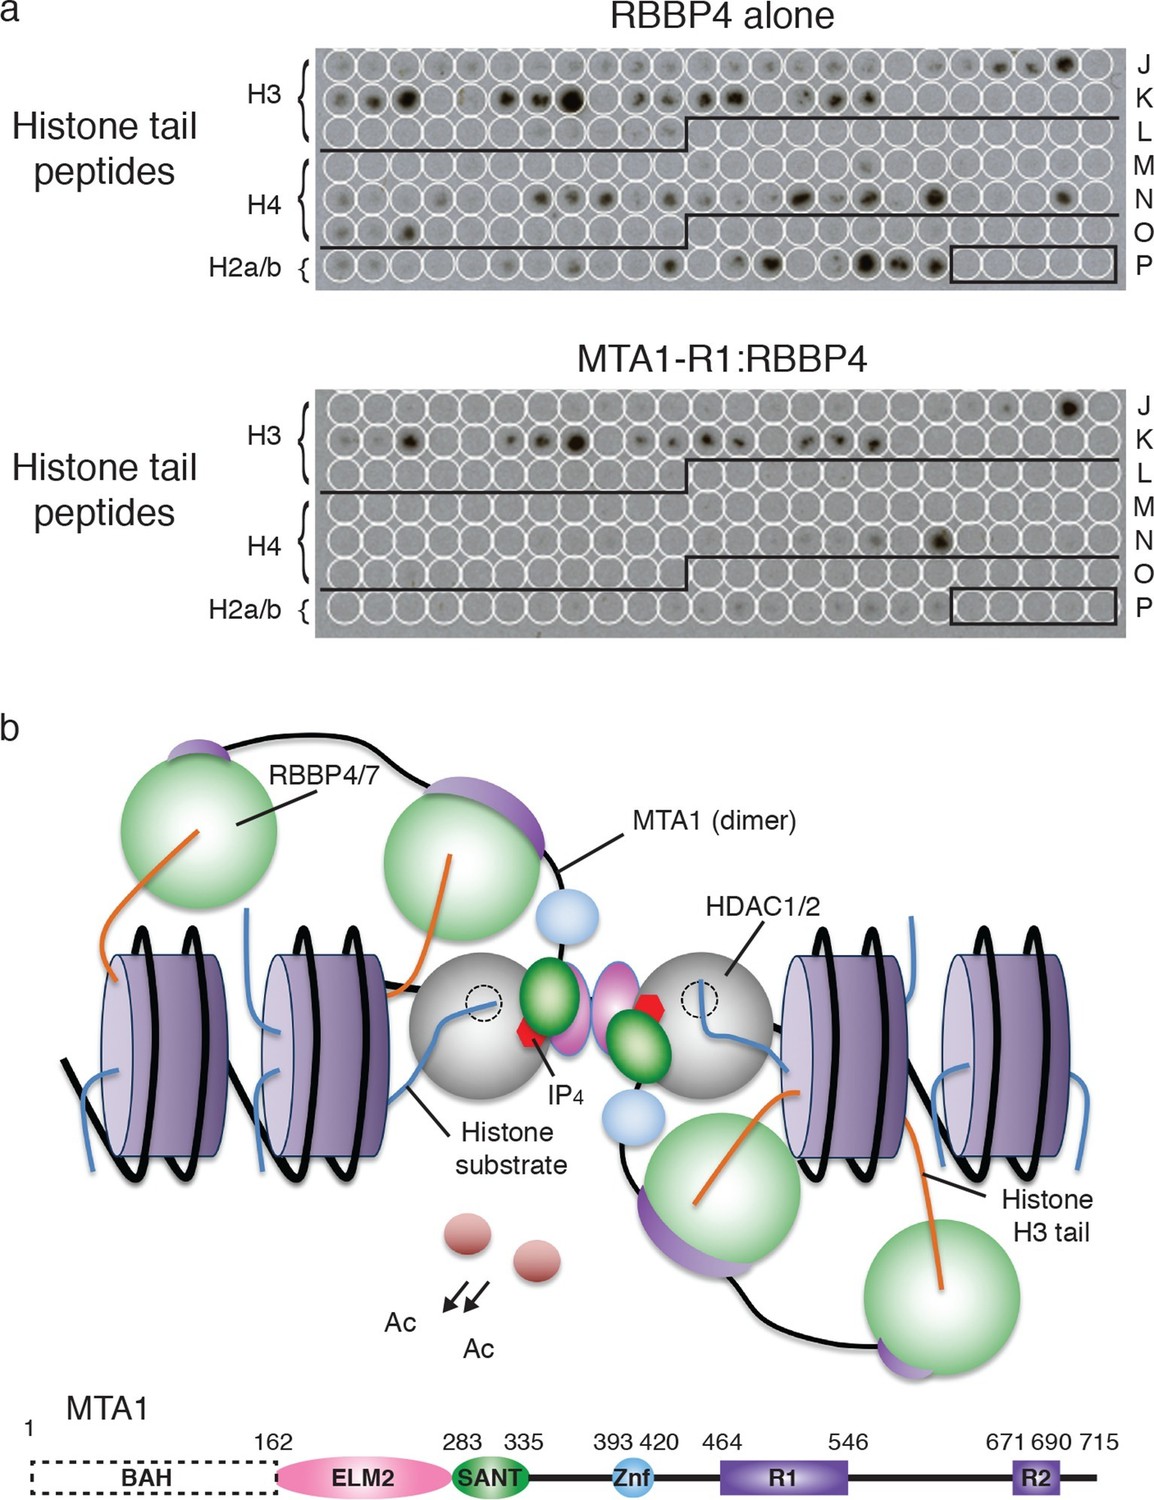
Recruitment of the core NuRD complex to chromatin could be mediated by RBBP4 binding to histone H3.
(a) RBBP4 binds to both histone H3 and histone H4 tail peptides on the MODified histone peptide array whereas the complex of MTA1-R1:RBBP4 is unable to bind to histone H4 tail peptides. MODified histone peptides J1 to P24 are shown. The five negative control peptides (non-histone sequences) are boxed in the right-hand corner. (b) Schematic model for the recruitment of the core NuRD complex to chromatin. Two HDAC1/2 molcules (grey) and four RBBP4/7 molcules (green) are tethered by the ELM2/SANT and R1/R2 domains of MTA1 respectively. MTA1 is coloured according to the schematic representation below. The RBBP4/7 proteins recruit the complex to chromatin through histone H3 tails (orange) on the same or adjacent nucleosomes (purple). The other histone tails would be available for deacetylation by HDAC1/2. The BAH domain of MTA1 is omitted from the model for clarity. See Figure 6—figure supplement 1 for the MODified and duplicate histone peptide arrays and Figure 6—source data 1 for a key to the array.
-
Figure 6—source data 1
Key for the MODified histone peptide array – Rows J1 to P24.
The key includes the identity and post-translational modification state of the histone peptides in the arrays presented in Figure 6a and Figure 6—figure supplement 1. The strength of observed binding is approximated by one or two asterisks.
- https://doi.org/10.7554/eLife.13941.017
Figure 6—figure supplement 1
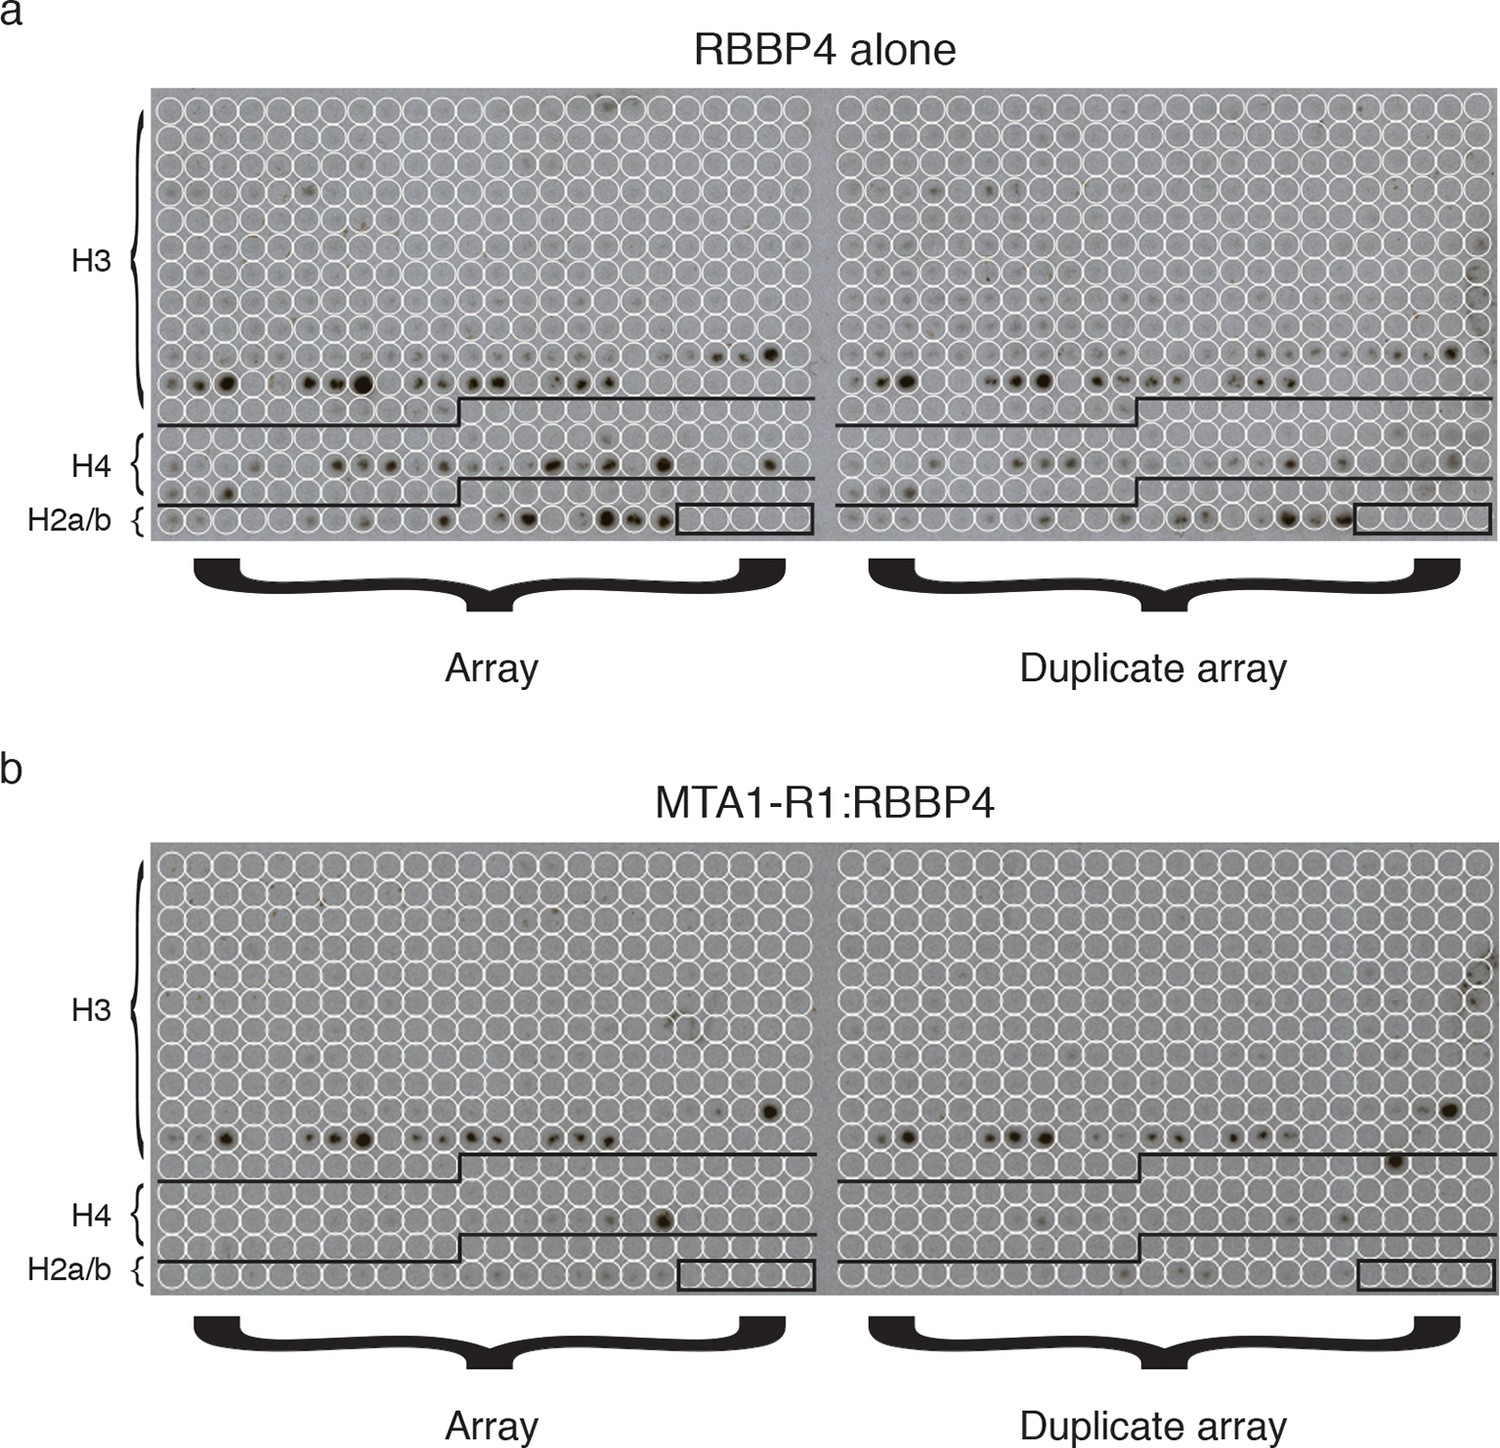
MODified histone peptide array.
Expanded view of the MODified histone peptide array and duplicate array for both (a) RBBP4 alone and (b) the MTA1-R1:RBBP4 complex.
Videos
Video 1
The crystal structure of MTA1-R1 bound to RBBP4 MTA1 (residues 464-546) interacts in three adjacent grooves on the side of RBBP4.
RBBP4 is shown as surface (grey) and MTA1 as cartoon (purple). This video relates to Figure 2.
Video 2
EM structure of the MTA1-B:HDAC1:RBBP4 complex.
Low resolution EM structure (19 Å) of the core NuRD complex is shown contoured at 1. Structures of the dimeric HDAC1:MTA1 (pdb code: 4BKX) and MTA1:RBBP4 (pdb code: 5FXY) are fitted. HDAC1 is shown in grey, RBBP4 in green and MTA1 in blue. This video relates to Figure 4.
Tables
Table 1
Crystallographic data collection and refinement statistics.
Data Collection | MTA1-R1:RBBP4 complex |
Beamline | Diamond I24 |
Space group | P1 21 1 |
Wavelength, Å | 0.96861 |
Cell dimensions | |
a, b, c, Å | 81.29, 150.07, 95.59 |
α, β, γ, ° | 90, 94.54, 90 |
Resolution range, Å* | 95.29–3.2 (3.34–3.2) |
Rmerge* | 0.165 (0.805) |
Rmeas* | 0.176 (0.872) |
CC1/2* | 0.975 (0.552) |
Mean I/σI* | 5.3 (2.0) |
Completeness, %* | 97.7 (98.0) |
Multiplicity* | 4.2 (4.2) |
Refinement | |
Resolution range, Å | 95.29–3.2 |
No. of reflections | 35,054 |
Rwork/Rfree | 0.249/0.291 |
Number of atoms | |
Protein | 14345 |
Water | 0 |
B-factors, Å2 | |
Protein | 90.7 |
Rmsd from ideal values | |
Bond lengths, Å | 0.007 |
Bond angles, ° | 1.053 |
Ramachandran plot | |
Favoured, % | 94.7 |
Allowed, % | 4.6 |
Outliers, % | 0.7 |
Missing residues | MTA1, 464–467, 519–528 |
RBBP4, 1–10, 90–103, 176–179, 412–425 |
-
*The highest resolution shell is shown in parentheses.
Download links
A two-part list of links to download the article, or parts of the article, in various formats.
Downloads (link to download the article as PDF)
Open citations (links to open the citations from this article in various online reference manager services)
Cite this article (links to download the citations from this article in formats compatible with various reference manager tools)
The structure of the core NuRD repression complex provides insights into its interaction with chromatin
eLife 5:e13941.
https://doi.org/10.7554/eLife.13941


