Adult axolotls can regenerate original neuronal diversity in response to brain injury
- Harvard University, United States
- Broad Institute of MIT and Harvard, United States
- Harvard Medical School, United States
Figures
Figure 1 with 1 supplement
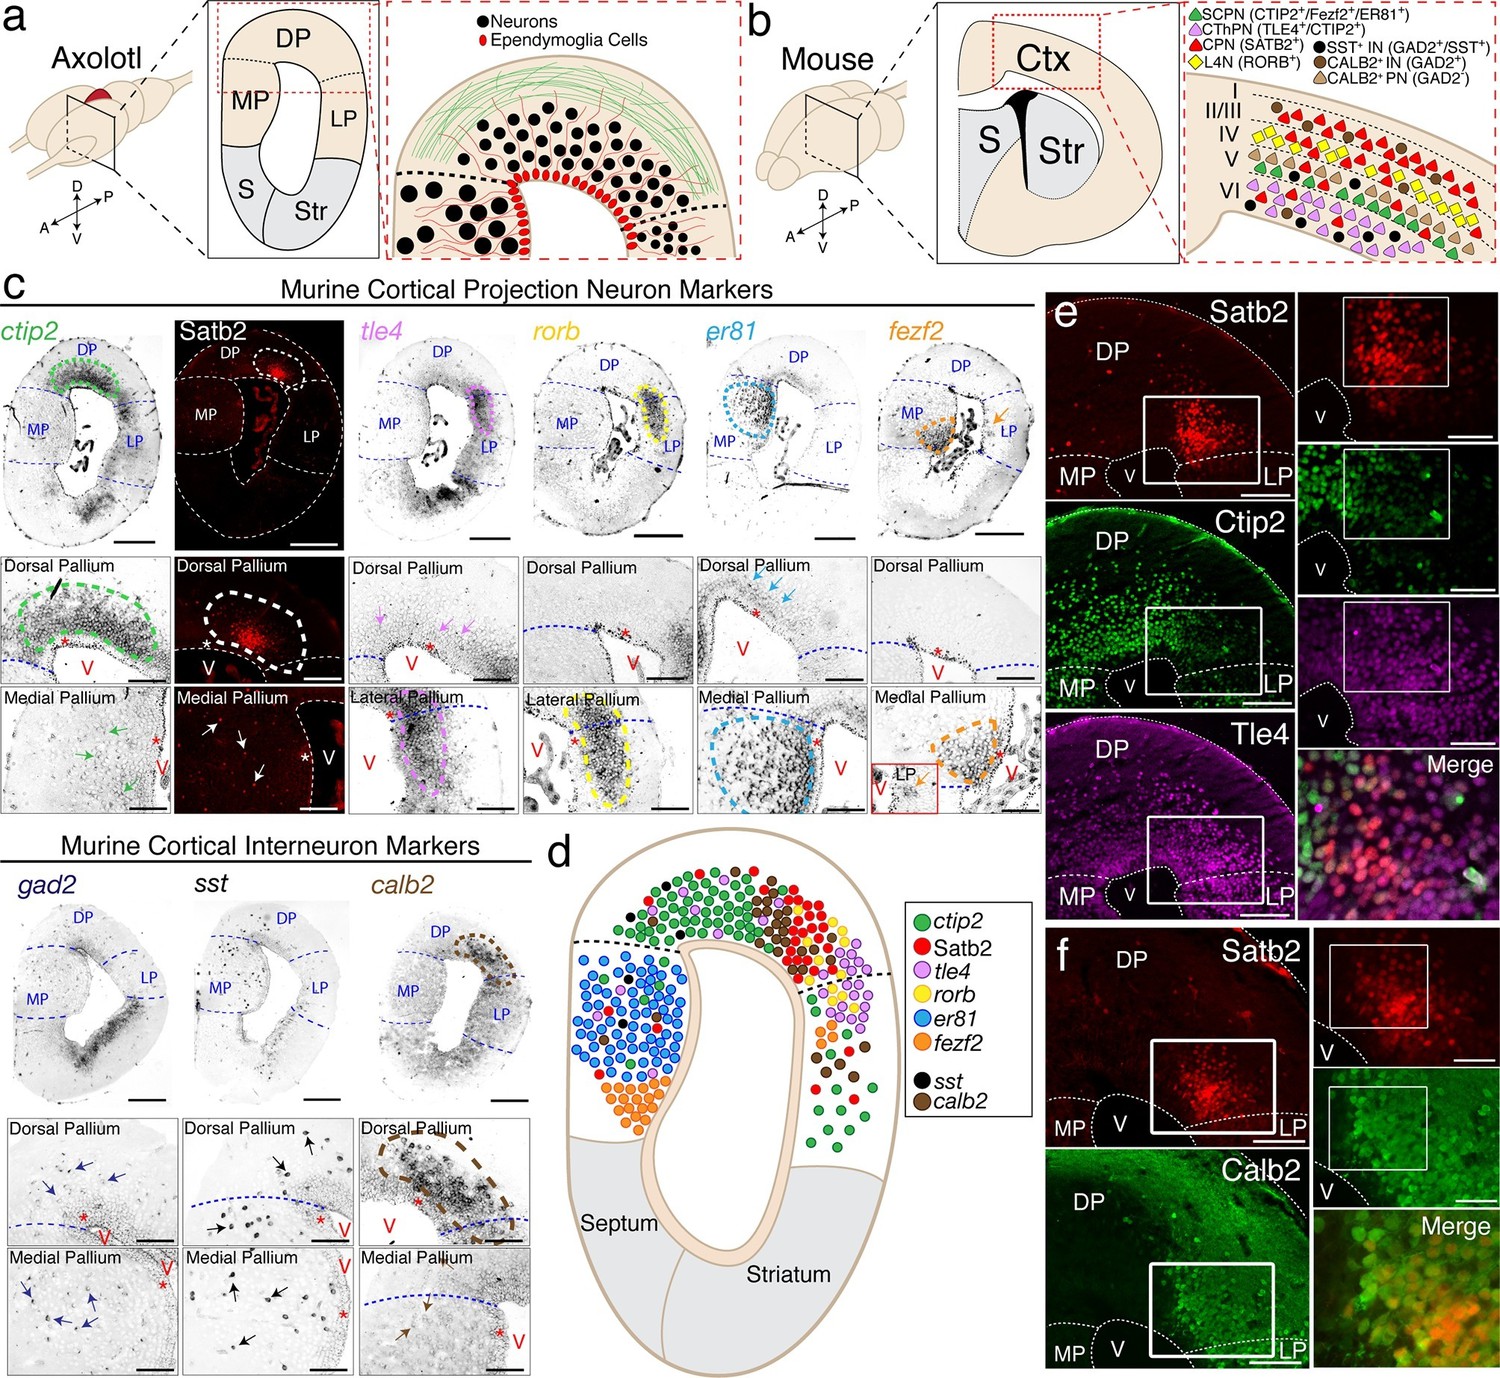
The axolotl pallium contains molecularly diverse neuronal subpopulations.
(a) Schematic representation of the axolotl pallium showing ependymoglia cells (red) lining the ventricle, neurons (black) positioned in the dorsal pallium close to the ventricle, and fiber tracts (green) occupying the region closer to the pia. (b) Schematic representation of cortical neuronal subtypes in the mouse neocortex. Major classes of murine cortical projection neuron subtypes as well as selected classes of cortical interneurons are depicted. (c) In situ hybridization and immunohistochemistry for selected cortical projection neuron and interneuron markers on coronal sections of the adult axolotl pallium. Insets, high-magnification images of regions of marker expression in the dorsal pallium (top panels) and the medial/lateral pallium (bottom panels). (d) Schematic map of the localization of molecularly distinct neuronal subtypes within the adult axolotl pallium. (e) Satb2HI regions in the dorso-lateral pallium are distinctly separate from regions of Ctip2HI and Tle4HI expression, showing a molecular boundary. (f) Satb2HI cells largely coexpress Calb2. A, Anterior; P, Posterior; D, Dorsal; V, Ventral; MP, Medial Pallium; DP, Dorsal Pallium; LP, Lateral Pallium; S, Septum; Str, Striatum; Ctx, Cortex; IN, cortical Interneurons; PN, cortical Projection Neurons; SCPN, Subcerebral Projection Neurons; CThPN, CorticoThalamic Projection Neurons; CPN, Callosal Projection Neurons; L4N, Layer 4 Neurons; SST, Somatostatin; V, Ventricle. Scale bars; 500 μm (c, top panels), 200 μm (c, insets; e and f, left panels), 100 μm (e and f, right panels).
Figure 1—figure supplement 1
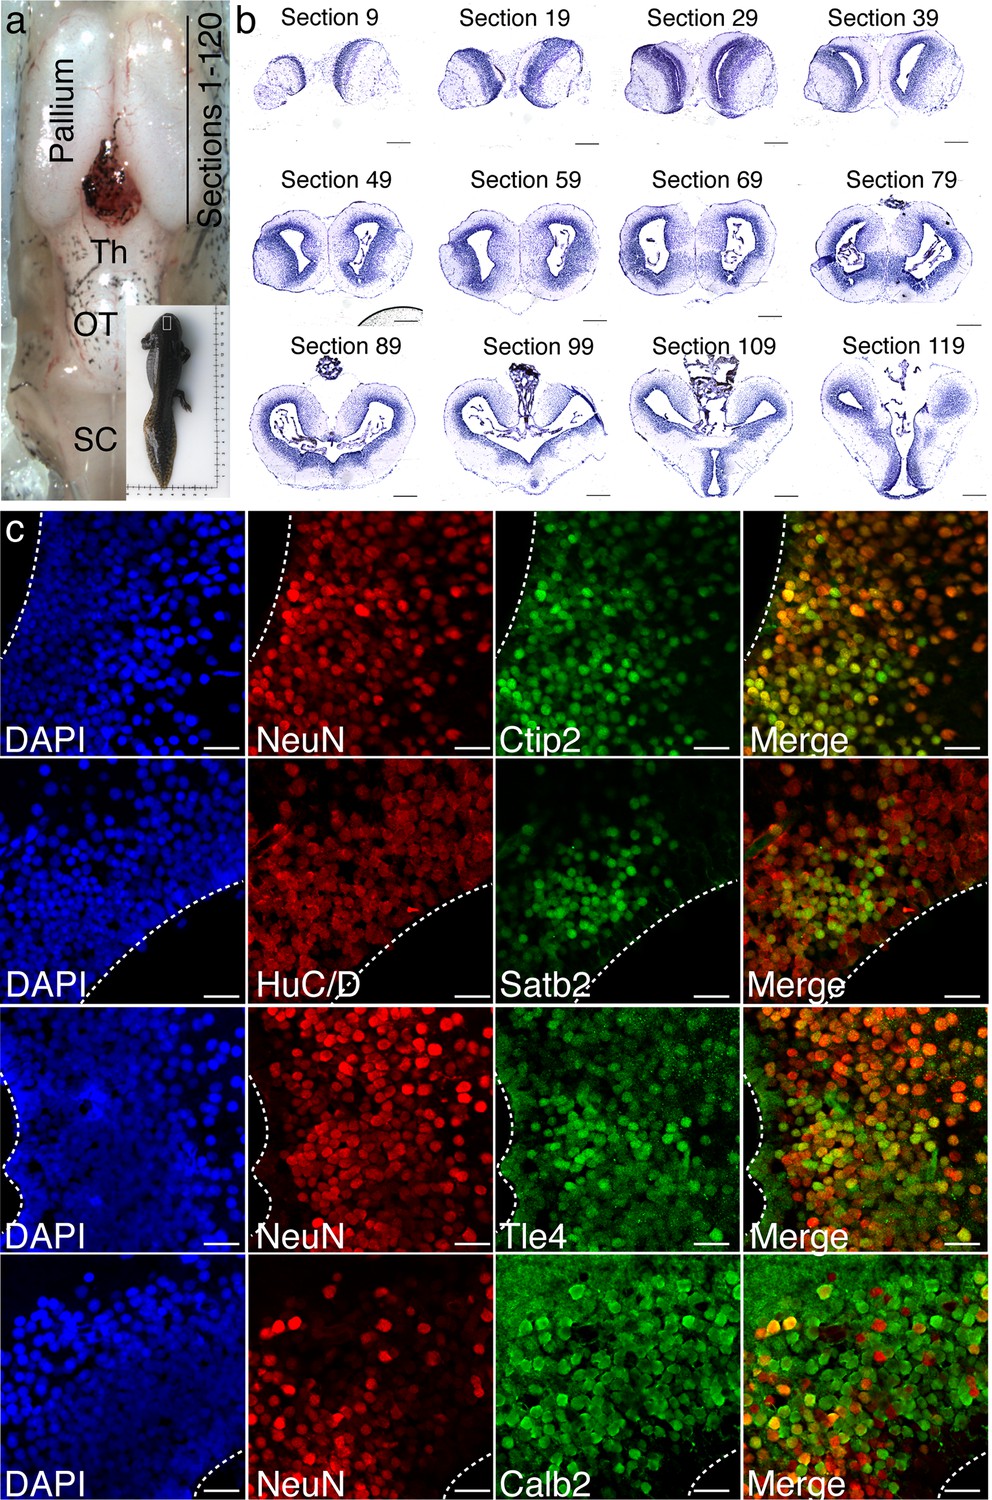
Anatomical map of the axolotl pallium.
(a) Top view of the axolotl brain, with an indication of the section numbering system in the pallium. Inset: Whole-body image of a representative axolotl used in the study. (b) Nissl staining of representative coronal sections spaced at 300 μm. (c) Immunohistochemistry for NeuN or Hu-C/D and neuronal subtype markers, Ctip2, Satb2, Tle4, and Calb2 shows that the majority of neuronal subtype markers colocalize with either NeuN or Hu-C/D. Tle4 is also expressed at low levels in NeuN- ependymoglia cells. Th, Thalamus; OT, Optic Tectum; SC, Spinal Cord. Scale Bars, 500 μm (b), 50 μm (c).
Figure 2 with 2 supplements

Temporal dynamics of successful pallial regeneration after acute mechanical injury.
(a) Location of the injury site in the dorsal pallium, left hemisphere. (b) Representative stereoscope photographs of injured brains at 1, 2, 4, and 11wpi. (c) 3D renderings of in vivo MRI images (top panels) and MRI coronal cross-sections within the injury site (bottom panels) of a representative axolotl brain during a 28-day time course post-injury. (d) Enlarged insets (from the red boxes in c) show three distinct stages of wound closure: stump formation, protrusion (red arrow), and closure. Red dotted lines outline the tissue. (e) The sizes of the injury site (in mm3, see Materials and methods) remain unchanged for the first 14 days, but decrease rapidly within a subsequent four-day period (n=3). (f) Schematic of in vivo BrdU labeling in the early post-injury phase. (g) Time course of BrdU and NeuN immunohistochemistry on coronal sections at 1, 2, and 4wpi shows limited cell proliferation within the first 2 weeks and increased proliferation by 4 wpi. Insets, magnified images at 4wpi (panel g’). (h) Schematic of in vivo BrdU labeling at mid post-injury phases. (i) Immunohistochemistry for BrdU and NeuN on coronal sections at 11wpi shows that a large subset of BrdU+ cells is composed of NeuN+ postmitotic neurons. Insets, magnified images at 11wpi (panel i’). (j) Model of the regenerative process during the first 11 weeks after acute mechanical injury. Wound closure proceeds in 3 distinct stages during the first 4 wpi: stump generation, stump protrusion, and wound closure. Only subsequently, newly proliferated BrdU+ cells populate, in large number, the injured region. By 11wpi, newborn neurons are generated. OB, Olfactory Bulb; Th, Thalamus; OT, Optic Tectum; wpi, weeks post injury; D, Day; LP, Lateral Pallium; MP, Medial Pallium; Str, Striatum; S, Septum. Scale bars; 500 μm (g and i), 100 μm (g’ and i’).
Figure 2—figure supplement 1

4wpi proliferative cells express markers of ependymoglia cells.
(a–h) Immunohistochemistry against Sox2 (a and c), BrdU (b, d, f, and h), and Gfap (e and g) on representative coronal sections of 4wpi pre-metamorphosis animals. This analysis shows that the majority of the BrdU+ nuclei in the injured hemisphere are Sox2+ and Gfap+. (i–l) Immunohistochemistry against Gfap (i), BrdU (j and l), and Sox2 (k) on representative coronal sections of 4wpi post-metamorphosis animals. BrdU+ nuclei in the injured hemisphere are Sox2+ and Gfap+ even after metamorphosis. V, Ventricle. Scale Bars, 500 μm (whole brain images) 200 μm (insets).
Figure 2—figure supplement 2
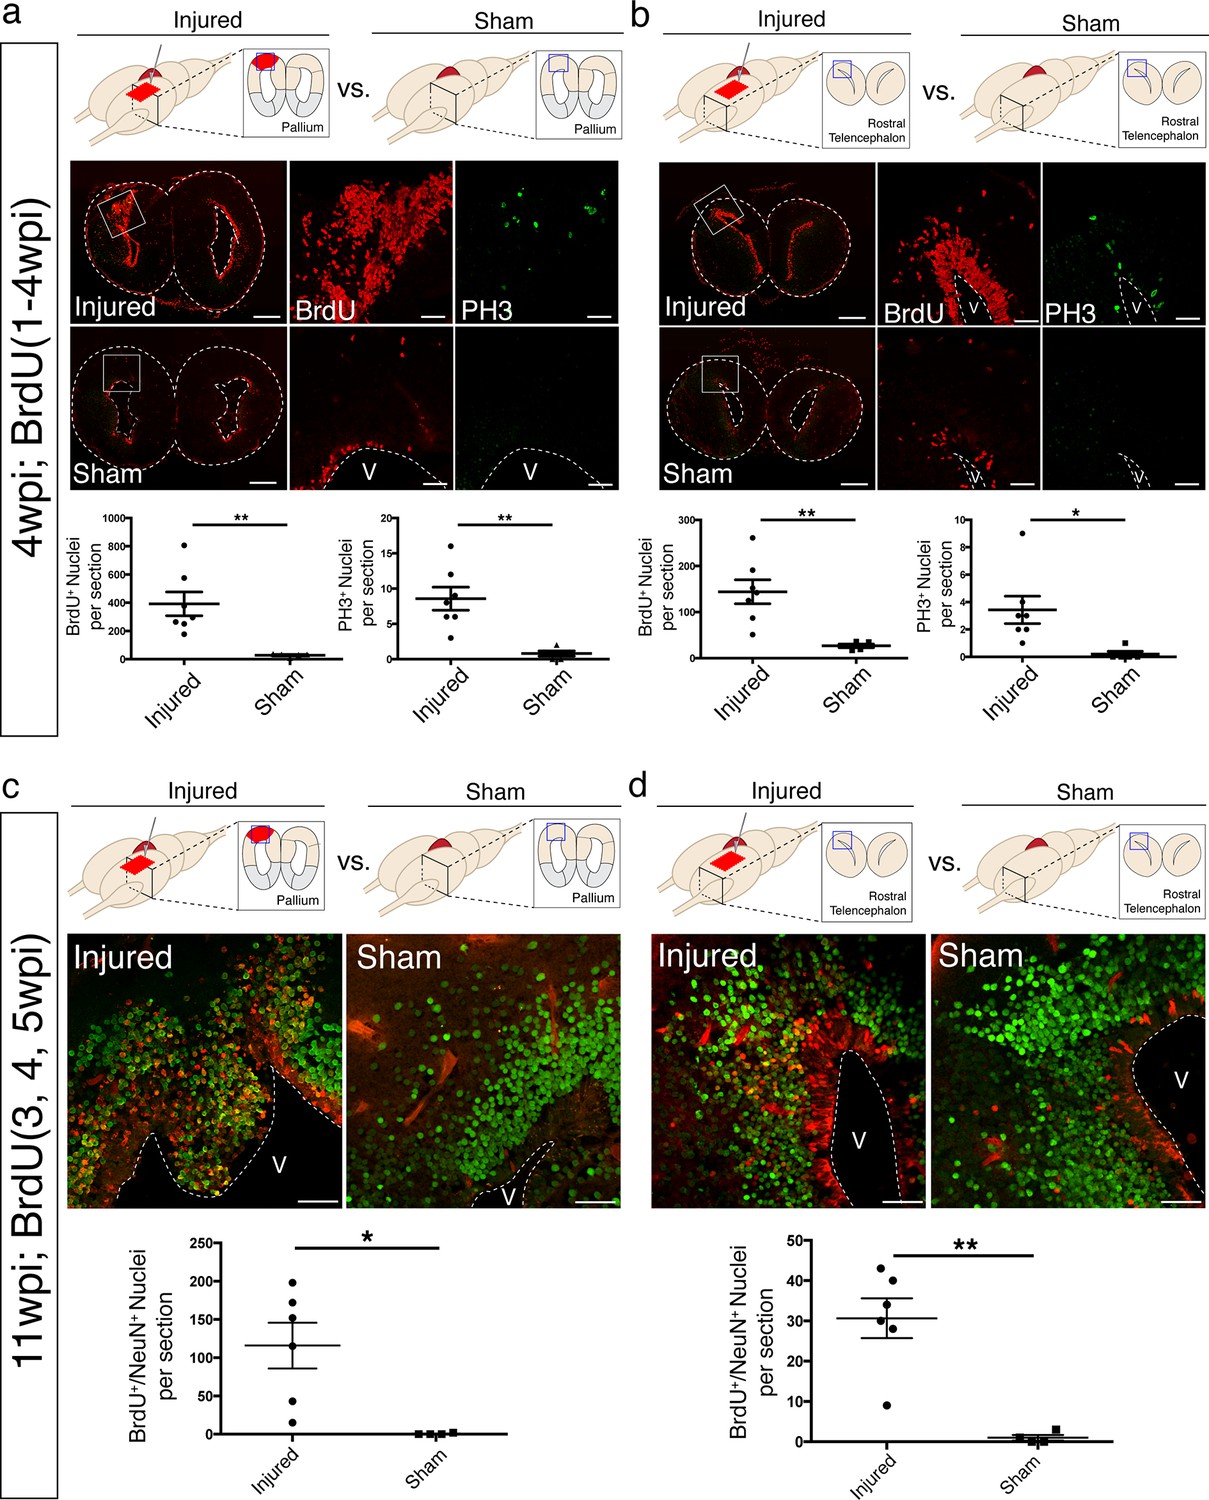
Newborn neurons populate distant, uninjured regions of the brain.
(a, b) An increase in the numbers of BrdU-labeled cells and PH3+ mitotic cells is observed upon injury both at the injury site (dorsal pallium, a) and in regions distal to the injury (rostral telencephalon, b). Upper panels, schematics of the telencephalic regions analyzed in 4wpi injured and sham axolotls (pallium in a, rostral telencephalon in b). Middle panels, representative images used for cell counting. Lower panels, quantification of BrdU+ nuclei and PH3+ nuclei in rostral-caudal matched coronal sections of injured (n=7) and sham (n=5) animals. (c, d) Regeneration of BrdU+/NeuN+ newborn neurons upon injury at both the injury site (dorsal pallium, c) and in regions away from the injury (rostral telencephalon, d) at 11wpi. Upper panels, schematics of the telencephalic regions analyzed in 11wpi injured and sham axolotls (pallium in c, rostral telencephalon in d). Middle panels, representative immunohistochemistry images used for cell counting. Lower panels, quantification of BrdU+/NeuN+ newborn neurons in the injured pallium (c) and rostral telencephalon (d) (n=6) compared to the sham (n=4). V, Ventricle. Scale Bars; 500 μm (a-b, left panels), 50 μm (a-b, right panels, c-d). All results are expressed as the mean ± SEM. *p<0.05, **p<0.01, unpaired, two-tailed Student’s t-test.
Figure 3 with 2 supplements
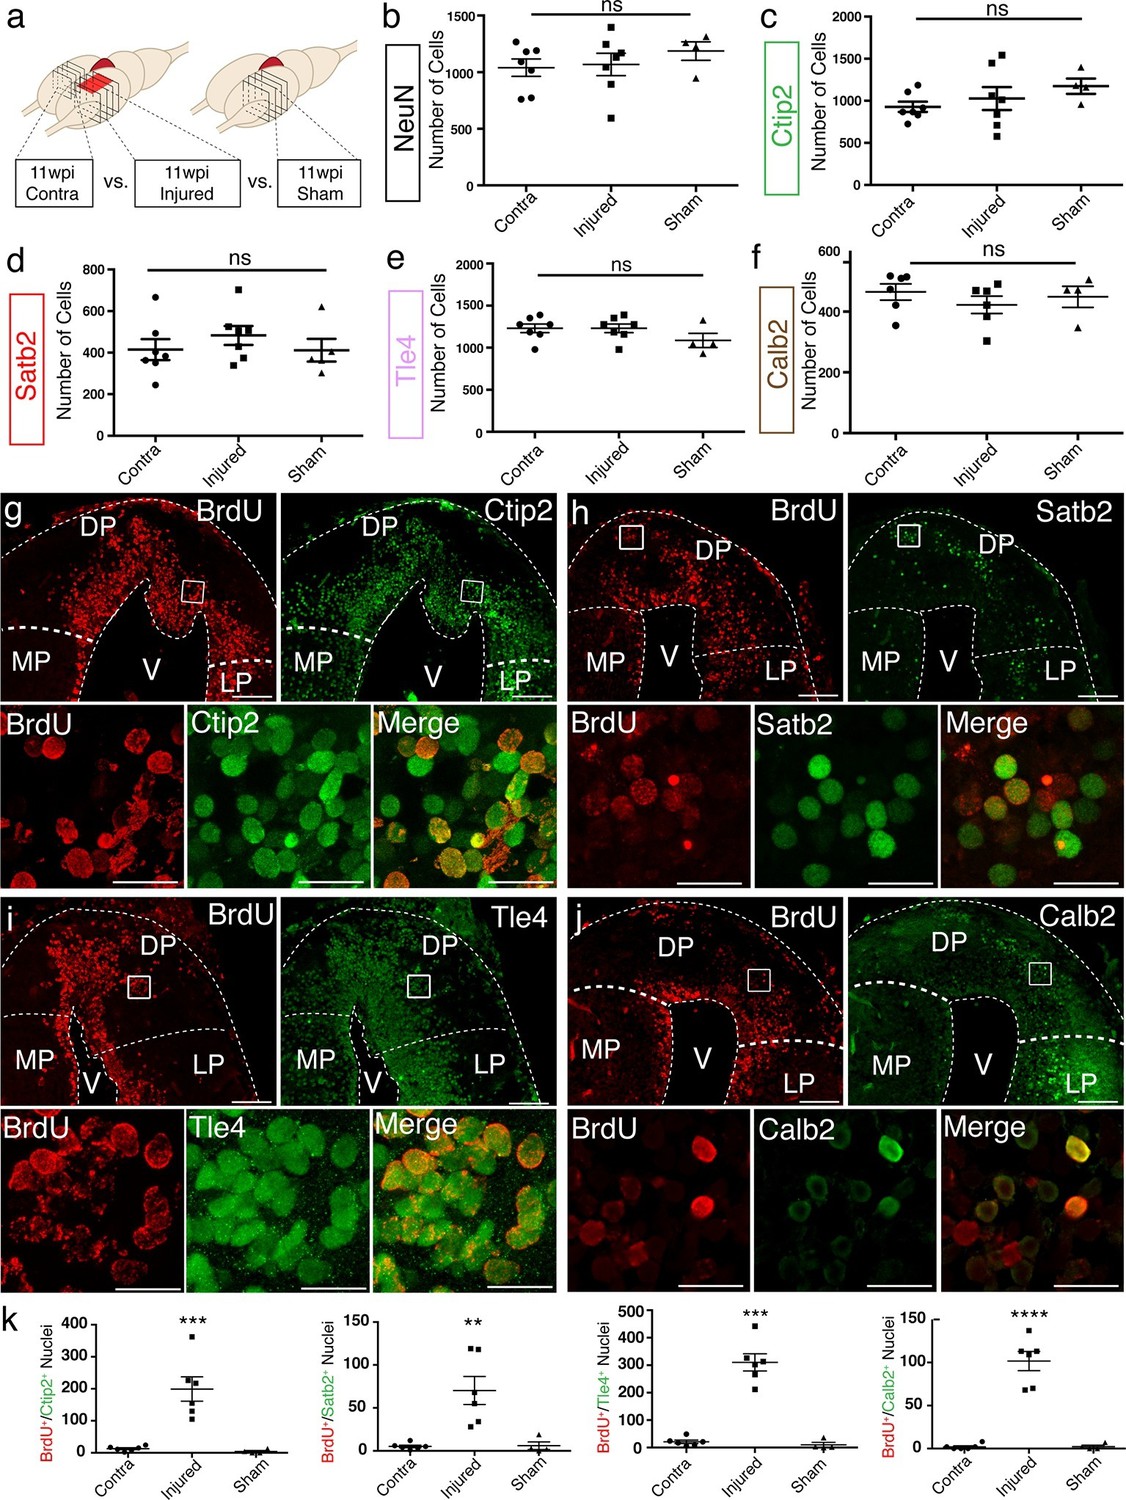
Molecularly diverse neuronal subtypes regenerate in the axolotl pallium.
(a) Schematic of the sections used for quantification (panels b–f and k). Images from 4 consecutive coronal sections, 300 μm apart, and spanning the injury site from contralateral, injured, and sham hemispheres were used for cell counting. (b–f) Quantification of NeuN+, Ctip2+, Satb2+, Tle4+, and Calb2+ nuclei in the region of interest shows no significant differences among contralateral, injured, and sham hemispheres. (g–j) Newborn BrdU+ cells in injured coronal sections co-express Ctip2, Satb2, Tle4, and Calb2, showing that neuronal subtype diversity is replenished upon regeneration; insets, high-resolution confocal images of co-labeled nuclei. (k) Quantification of BrdU+/neuronal subtype-marker+ nuclei in the dorsal pallium of contralateral, injured, and sham hemispheres. LP, Lateral Pallium; DP, Dorsal Pallium; MP, Medial Pallium; V, Ventricle. Scale Bars; 200 μm (g–j, top panels), 20 μm (g–j, bottom panels). All results are expressed as the mean ± SEM. **p<0.01, ***p<0.001, ****p<0.0001; one-way ANOVA with post-hoc Tukey’s multiple comparison test.
Figure 3—figure supplement 1
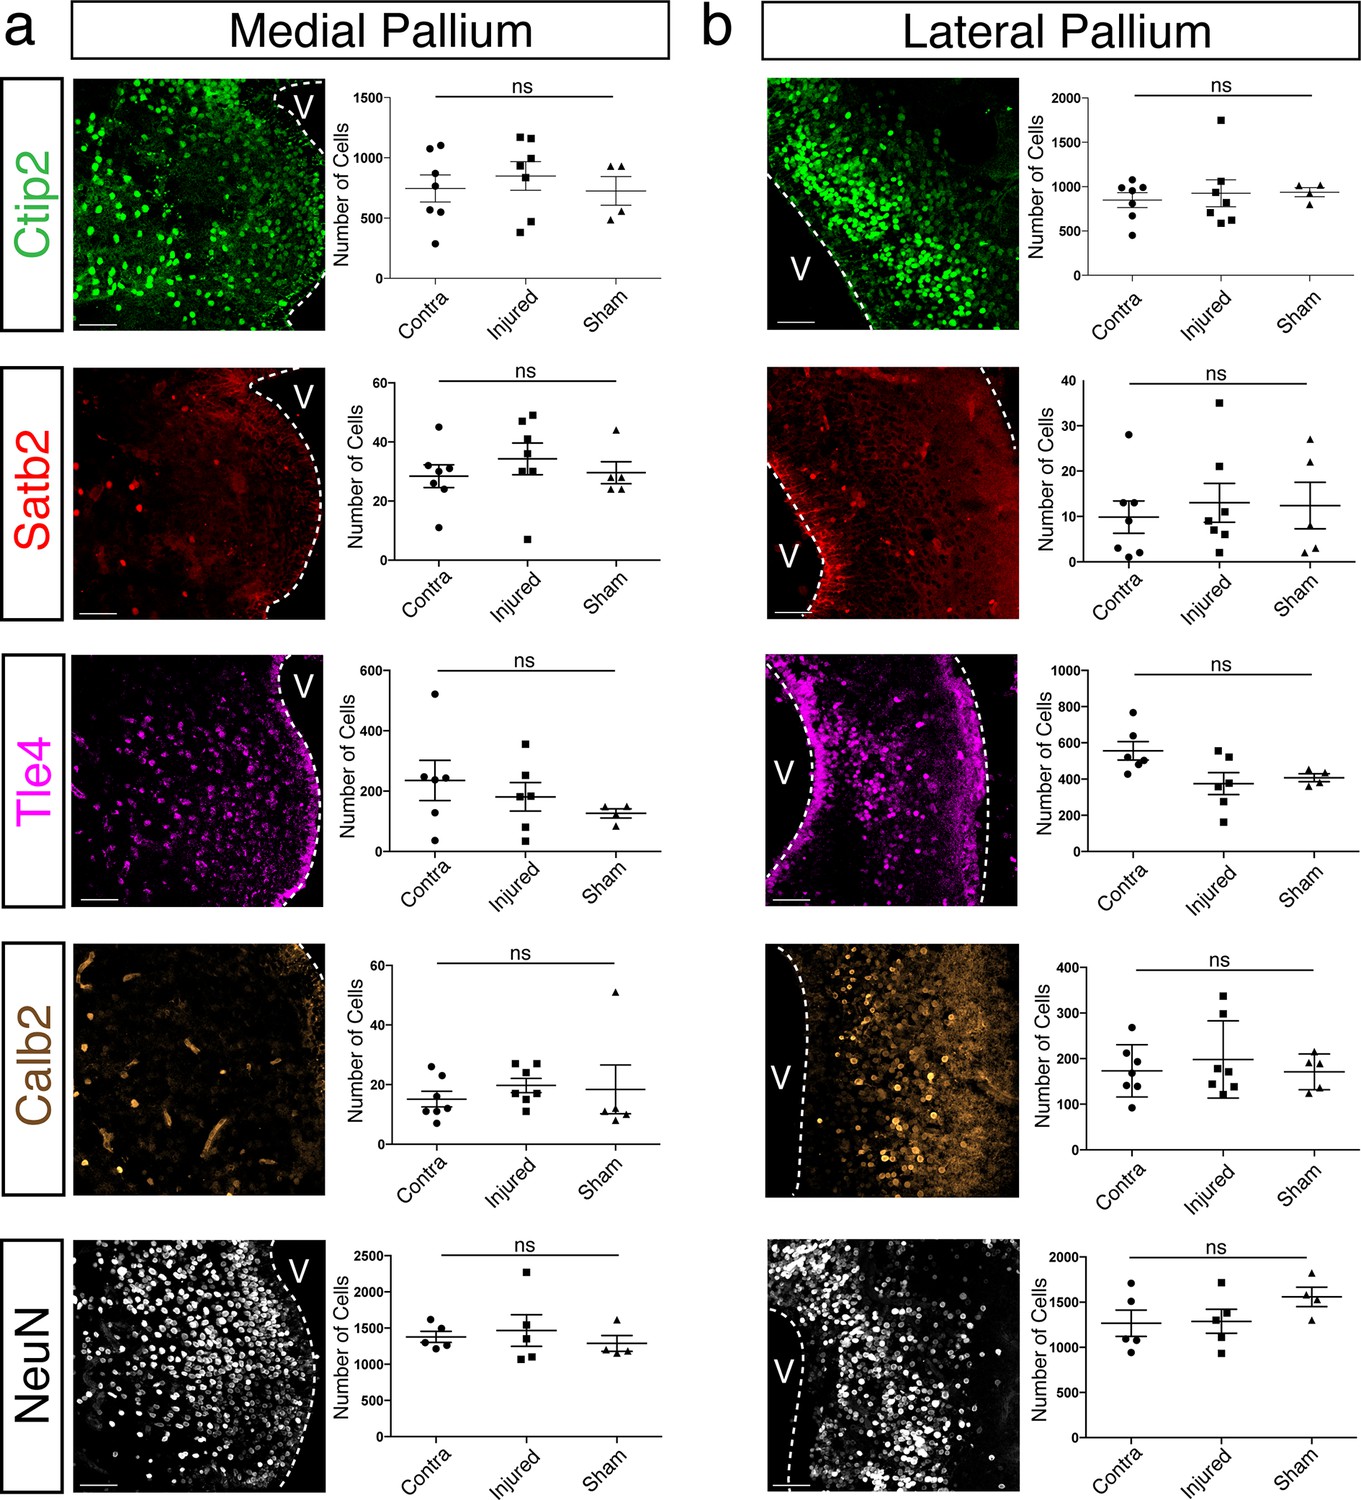
Neuronal subtypes in uninjured regions of the pallium remain unchanged in number at 11wpi.
(a, b) Immunohistochemistry against Ctip2, Satb2, Tle4, Calb2, and NeuN on representative coronal pallium sections of injured 11wpi axolotls, showing the medial pallium (a, left panels) and the lateral pallium (b, left panels). Quantification of Ctip2+-, Satb2+-, Tle4+-, Calb2+-, and NeuN+-nuclei numbers from four sections spaced at 300 μm in the medial pallium (a, left panels) and the lateral pallium (b, right panels). Scale Bars, 50 μm. All results are expressed as the mean ± SEM. One-way ANOVA.
Figure 3—figure supplement 2
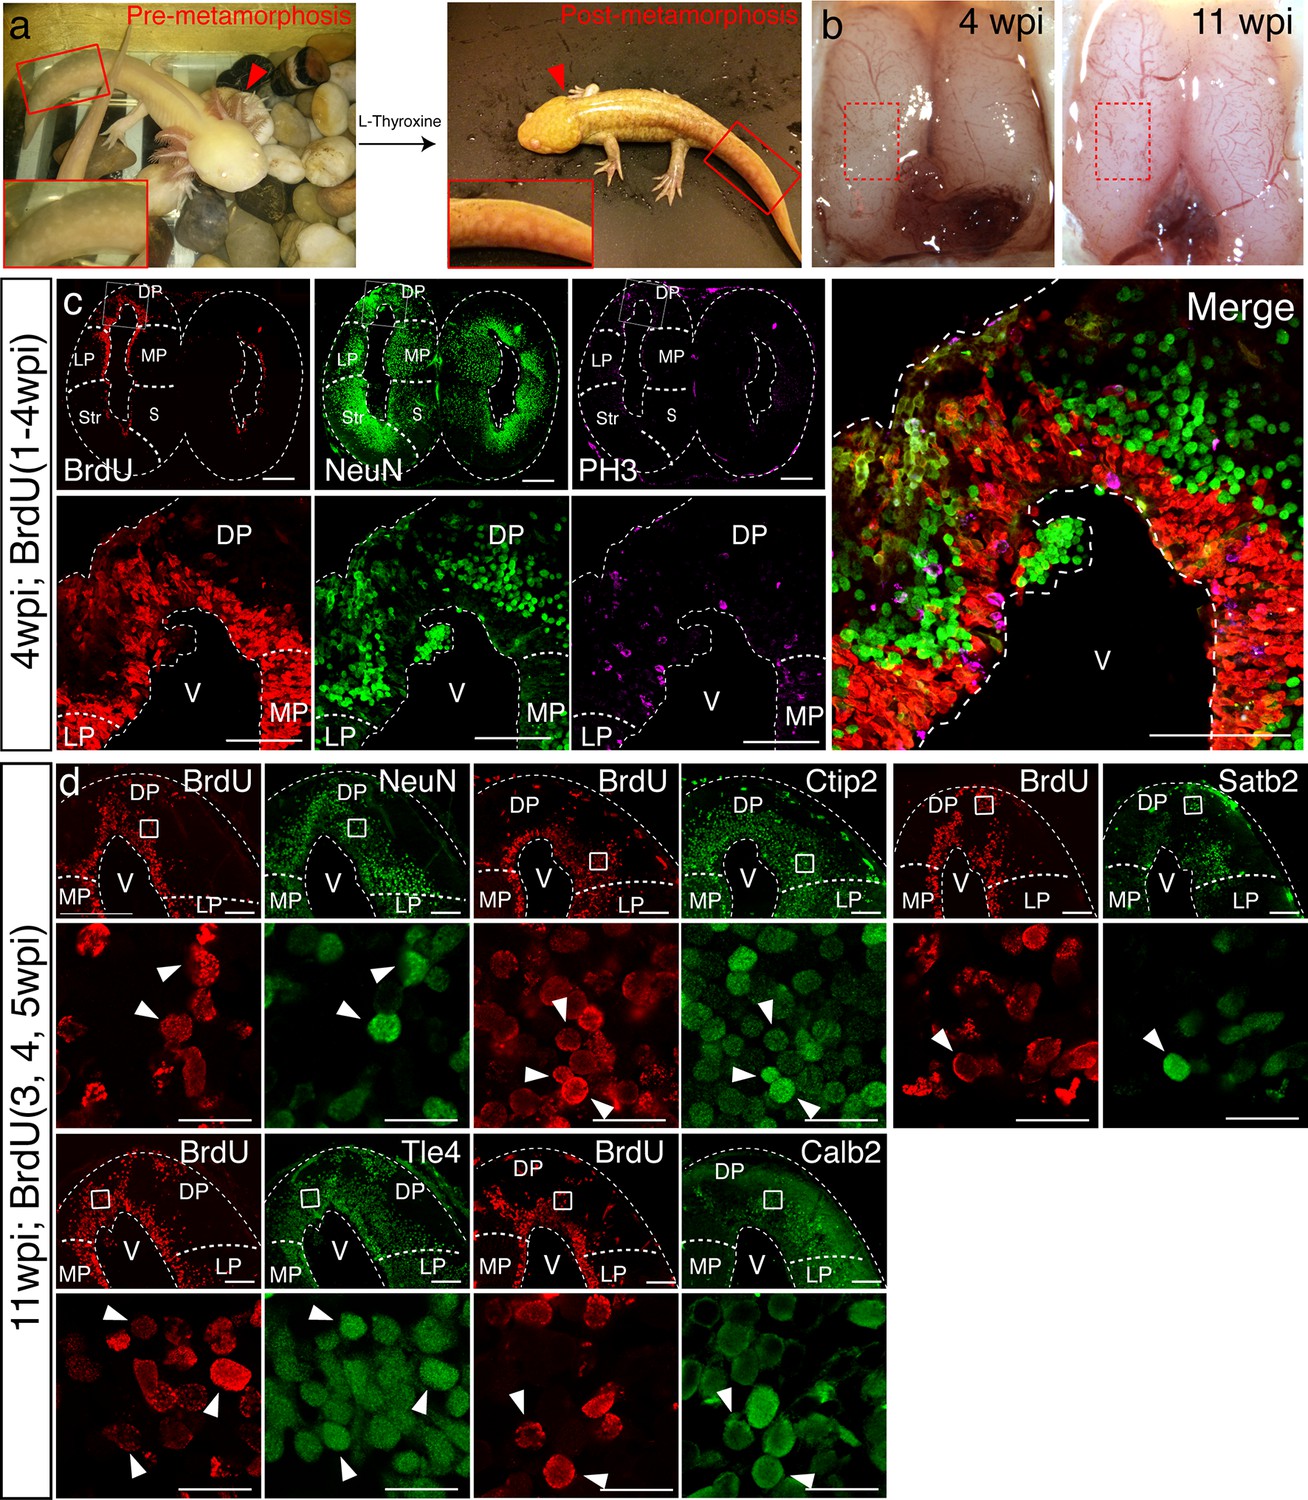
Neuronal diversity in the dorsal pallium is regenerated in post-metamorphic axolotl brain.
(a) Representative images of adult axolotls before and after L-thyroxine-induced metamorphosis. Left, pre-metamorphosis axolotl, inset shows the presence of a tail fin (left panel). Right, post-metamorphosis axolotl, inset shows the lack of a tail fin. Post-metamorphosis axolotls also lack external gills (red arrowhead). (b) Stereoscope images showing the injury sites of the post-metamorphosis axolotls (left hemisphere, red dotted rectangle) at 4wpi and 11wpi. (c) Representative immunohistochemistry images of coronal section show similar localization pattern of BrdU+/PH3+/NeuN- proliferating cells to that of the pre-metamorphosis axolotl in the dorsal pallium. (d) Regenerated cells labeled with BrdU colocalize with neuronal markers NeuN, Ctip2, Satb2, Tle4, and Calb2 as shown in representative injured coronal sections; insets, magnification of co-labeled nuclei (arrowheads). LP, Lateral Pallium; DP, Dorsal Pallium; MP, Medial Pallium; V, Ventricle. Scale Bars; 500 μm (c, top panels), 200 μm (c, bottom panels, d, top panels), 20 μm (d, bottom panels).
Figure 4 with 3 supplements
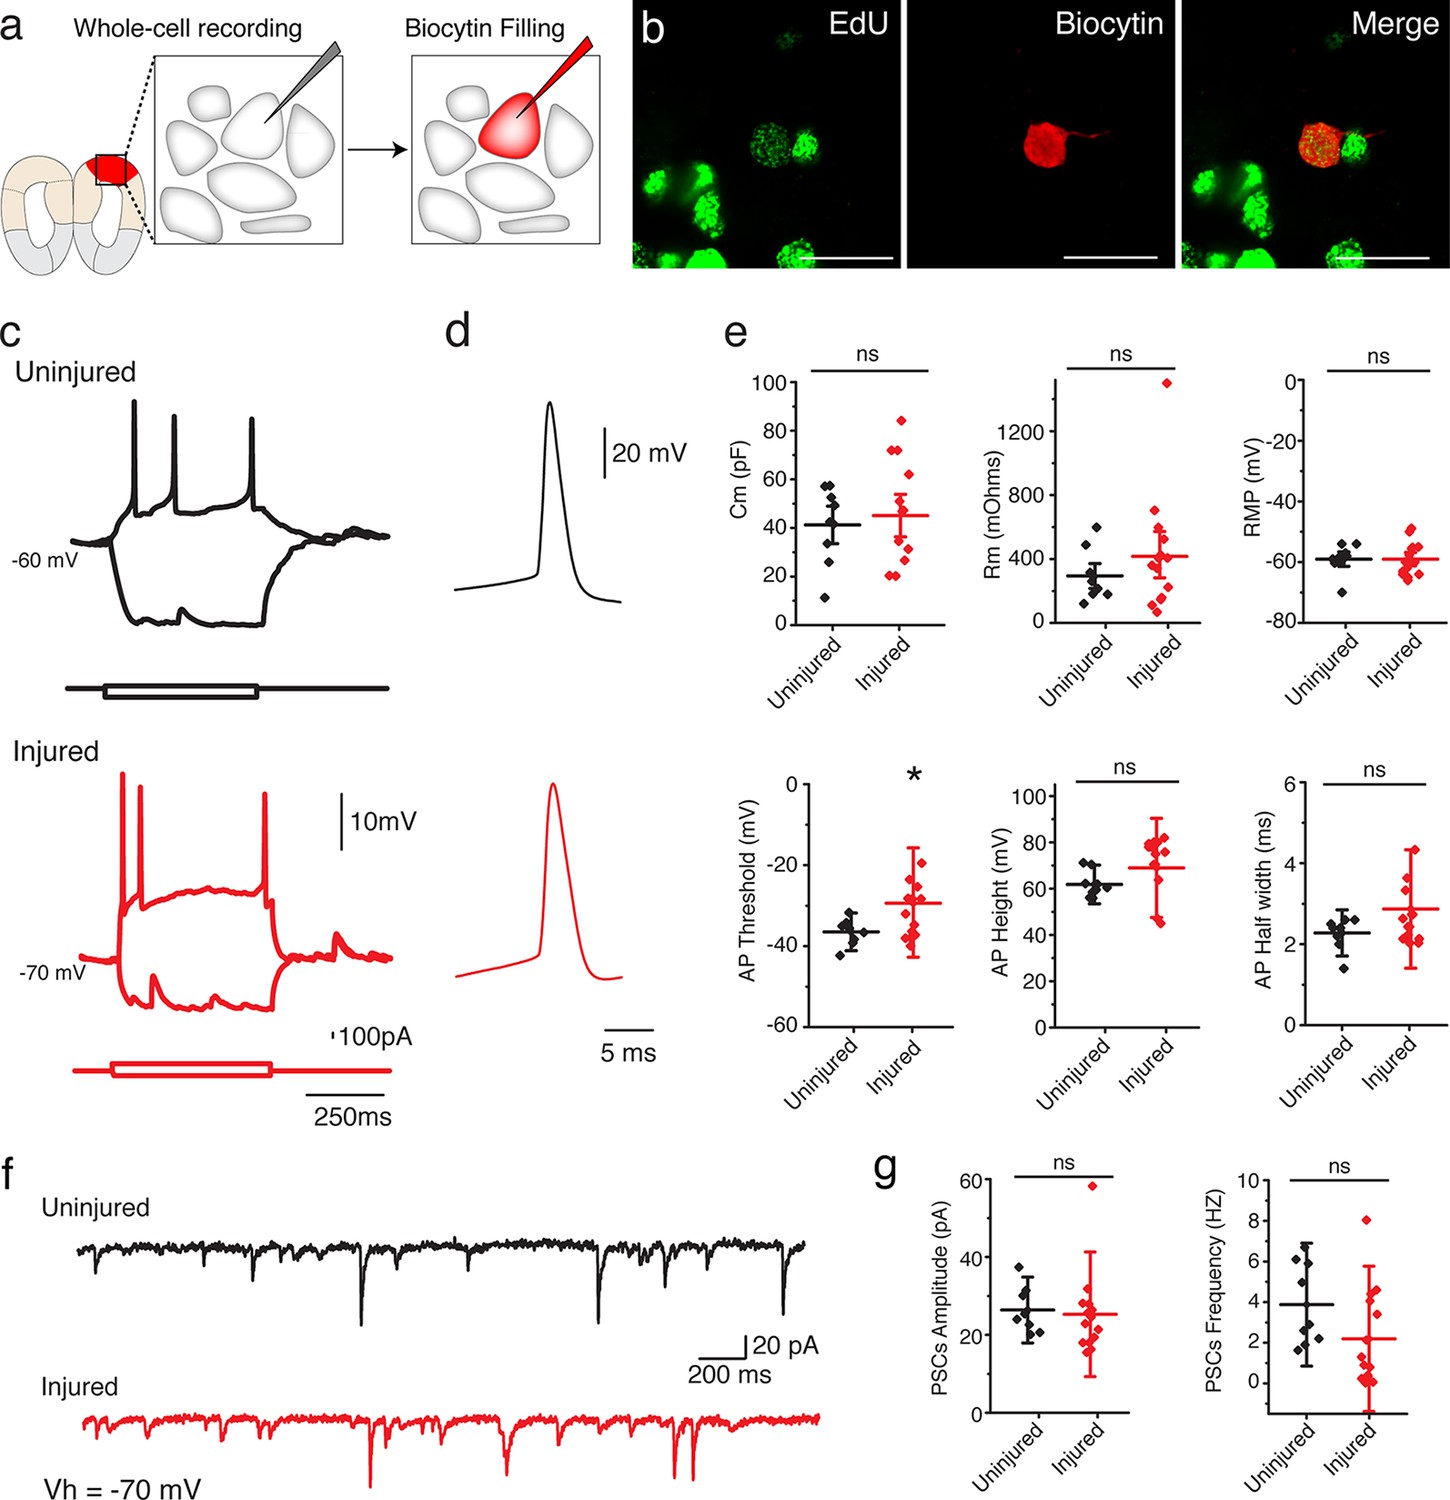
Regenerated neurons show electrophysiological features similar to uninjured pallium neurons and receive afferent input.
(a) Schematic representation of whole-cell patch clamp recording and subsequent biocytin filling. (b) Representative images of EdU+/Biocytin+ neurons in the injured pallium. (c) Representative traces of the membrane voltage changes in response to depolarizing and hyperpolarizing current steps injections of neurons from uninjured and injured animals. (d) Zoom-in of single action potential evoked by a depolarizing current step recorded in neurons of dorsal pallium. (e) Summary of passive and active electrophysiological properties: membrane capacitance (Cm), membrane resistance (Rm), resting membrane potential (RMP), action potential (AP) threshold, AP height and AP half width. (f) Sample traces of spontaneous postsynaptic currents (sPSCs) recorded under voltage clamp (Vh = −70 mV). (g) Summary of sPSCs features in neurons from uninjured and injured animals. All results are expressed as the mean ± SD. *p<0.05; unpaired, two-tailed Student’s t-test.
Figure 4—figure supplement 1
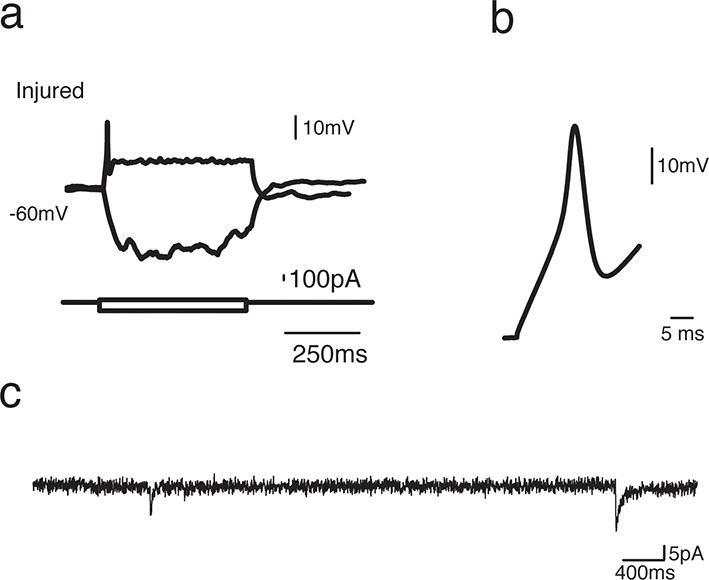
EdU+ neurons in the injured pallium show immature electrophysiological properties.
(a) Changes of the membrane voltage in response to depolarizing and hyperpolarizing current steps injections from an EdU+ neuron recorded in the injured pallium. (b) Zoom-in of single action potential evoked by a depolarizing current step. Broad and short action potential is typical of immature neurons. (c) Sample trace of spontaneous postsynaptic currents (sPSCs) recorded under voltage clamp (Vh=−70 mV).
Figure 4—figure supplement 2
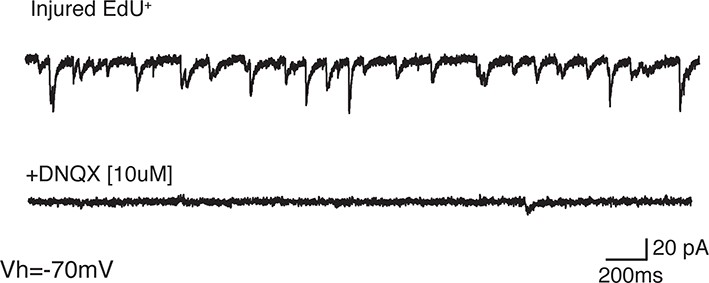
Most sPSCs are abolished by administration of AMPA receptor blocker.
(a) Sample trace of spontaneous postsynaptic currents (sPSCs) recorded under voltage clamp (Vh=−70 mV). (b) Sample trace of the same neuron after application of AMPA receptor blocker, NBQX [10 µM], which abolishes most sPSCs.
Figure 4—figure supplement 3
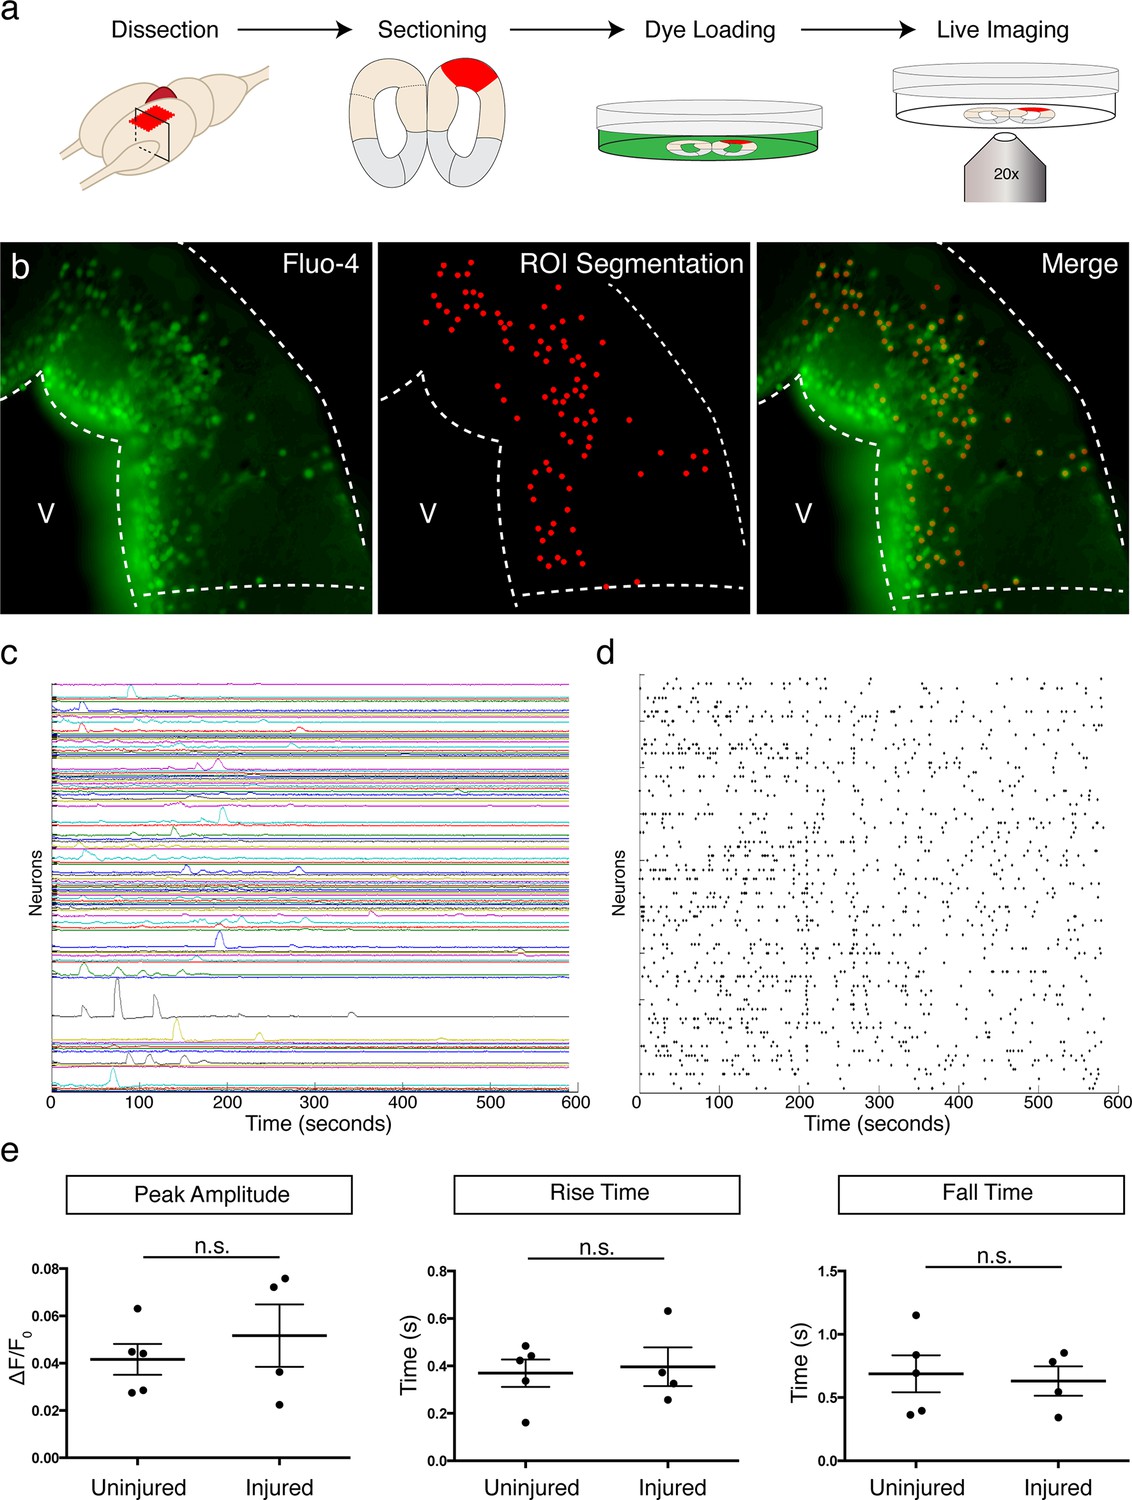
Spontaneous calcium transients in neurons do not differ between injured and control dorsal pallium.
(a) Schematic of ex vivo calcium imaging. (b) Representative image of Fluo-4 staining in the dorsal pallium after dye loading (left panel). Region of interest (ROI) segmentation for individual neurons (middle panel) and merge (right panel). (c) Representative traces of spontaneously generated calcium transients in labeled neurons within dorsal pallium. (d) Raster plot of peaks in traces from panel c. (e) Quantification of the peak amplitude (left panel), rise time (middle panel), and fall time (right panel) in individual neurons shows no significant difference between injured and control dorsal pallium. V, ventricle. All results are expressed as the mean ± SEM. Unpaired, two-tailed Student’s t-test.
Figure 5
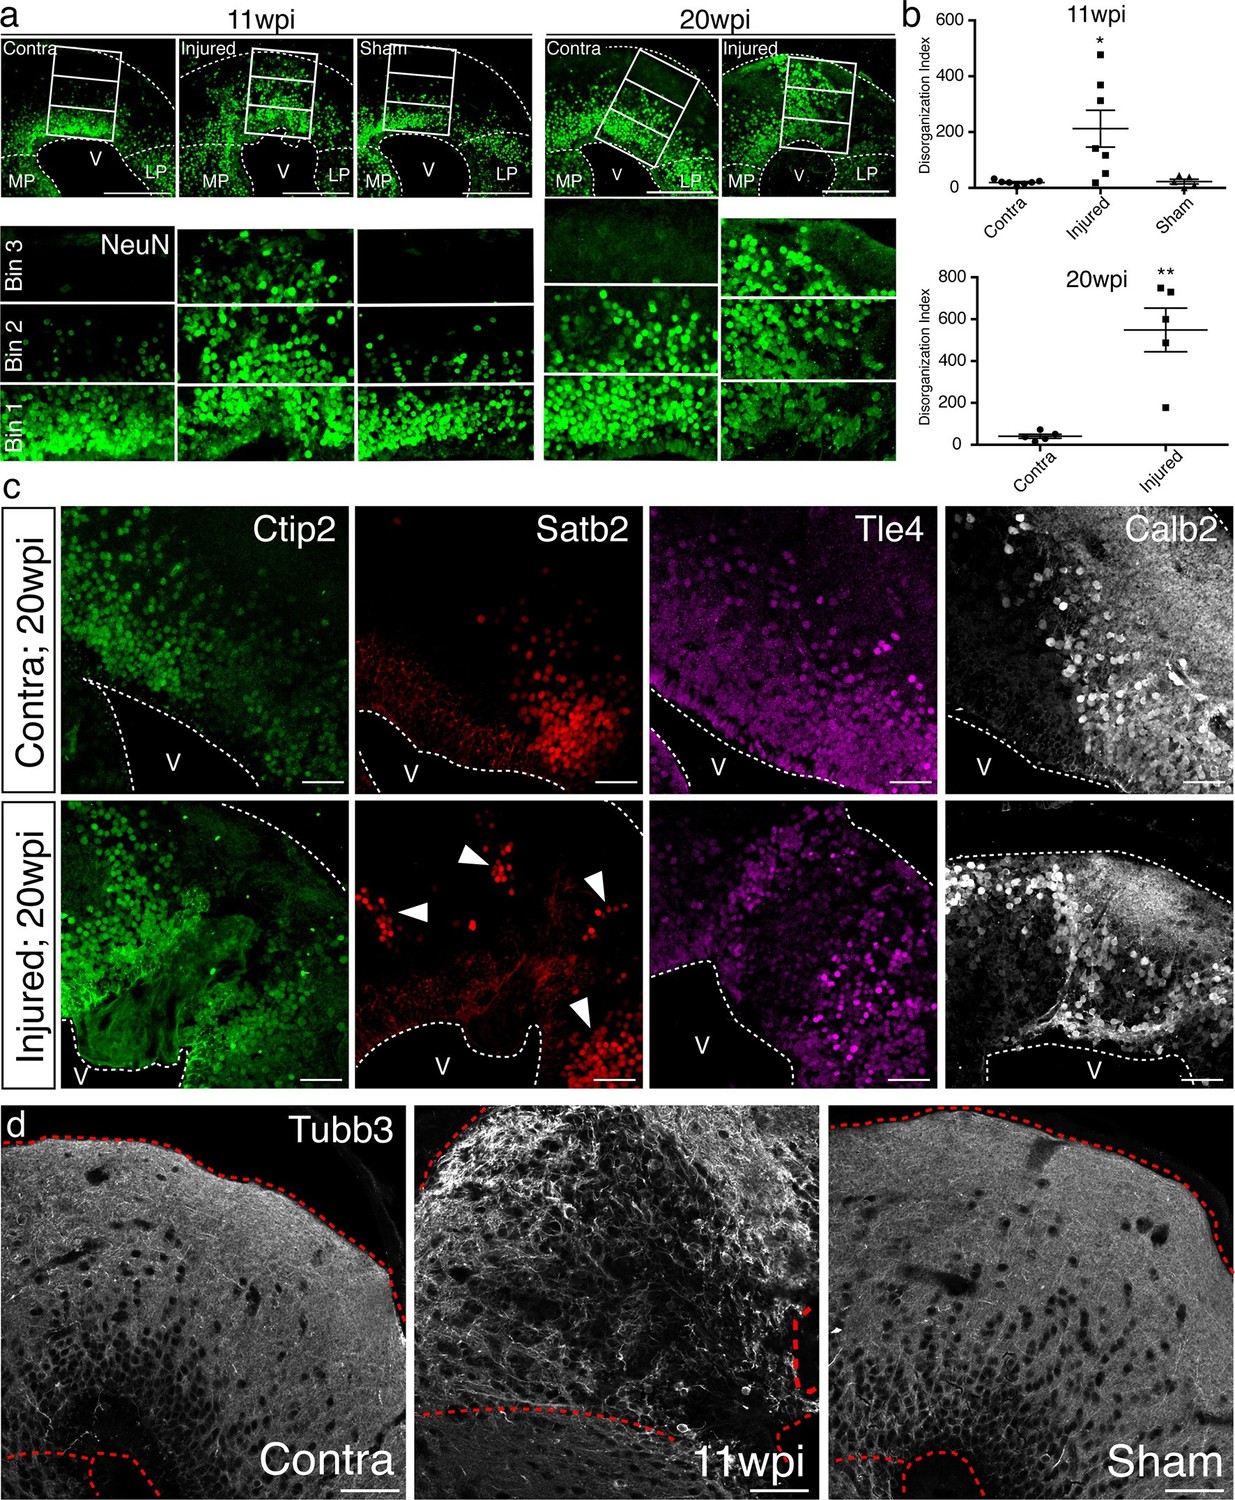
Tissue architecture is disrupted in the regenerated pallium.
(a) The radial distribution of NeuN+ cells within the dorsal pallium is altered after regeneration. Representative immunohistochemistry images of coronal sections of contralateral, injured, and sham hemispheres at 11wpi (left) and 20wpi (right). NeuN+ neurons populate the bin closest to the pia (bin 3) in the injured hemispheres at both time points, in contrast to controls. (b) Quantification of the disorganization index in four consecutive sections of contralateral (11wpi and 20wpi), injured (11wpi and 20wpi), and sham (11wpi) hemispheres. (c) The topography of neuronal subtypes is altered upon regeneration. Representative immunohistochemistry images of coronal sections of contralateral (top panels) and injured (bottom panels) hemispheres at 20wpi. (d) Immunohistochemistry for Tubb3 shows atypical organization of neuronal processes in the 11wpi injured pallium compared to uninjured contralateral and sham controls. LP, Lateral Pallium; MP, Medial Pallium; V, Ventricle. Scale Bars; 400 μm (a), 50 μm (c, d). All results are expressed as the mean ± SEM. *p<0.05, **p<0.01; one-way ANOVA with post-hoc Tukey’s multiple comparison test.
Figure 6 with 1 supplement
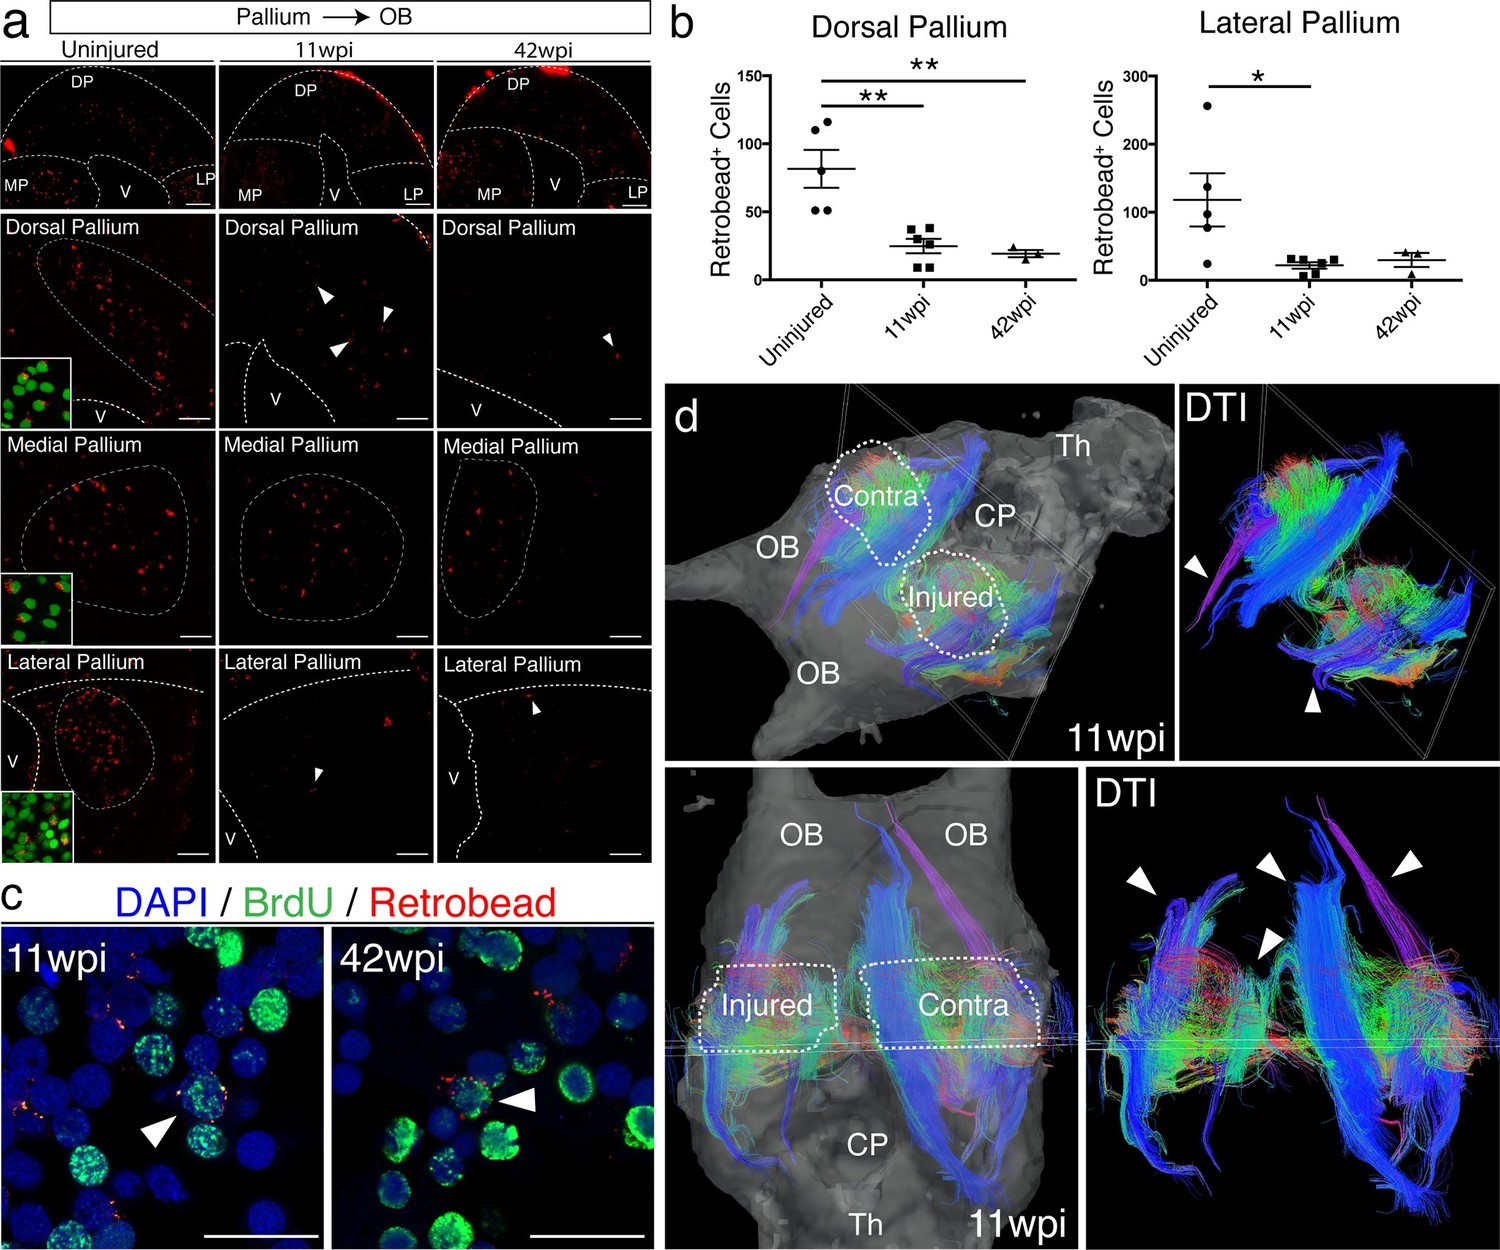
Long-distance projections from the regenerated dorsal pallium are significantly reduced.
(a) Retrograde tracing from the olfactory bulb shows reduced number of labeled cells in the dorsal pallium and lateral pallium at 11wpi (middle panels) and 42wpi (right panels) compared to uninjured control (left panels). Insets, high-magnification images of DAPI (green) and Retrobeads (red). (b) Quantification of the number of Retrobead+ cells in the dorsal and lateral pallium at different time points after injury. (c) Representative immunohistochemistry images of BrdU+/Retrobead+ cells in the regenerated dorsal pallium at 11wpi (left panel) and 42wpi (right panel). (d) ex vivo DTI of 11wpi brains show disruption of fiber tracts (arrowheads) in the injured hemisphere. White dotted lines (left panels) represent regions of interest in injured and contralateral hemispheres. OB, Olfactory Bulb; CP, Choroid Plexus; Th, Thalamus; V, Ventricle; DP, Dorsal Pallium; MP, Medial Pallium; LP, Lateral Pallium. Scale Bars; 50 μm (b), 20 μm (d). All results are expressed as the mean ± SEM. *p<0.05, **p<0.01; one-way ANOVA with post-hoc Tukey’s multiple comparison test.
Figure 6—figure supplement 1
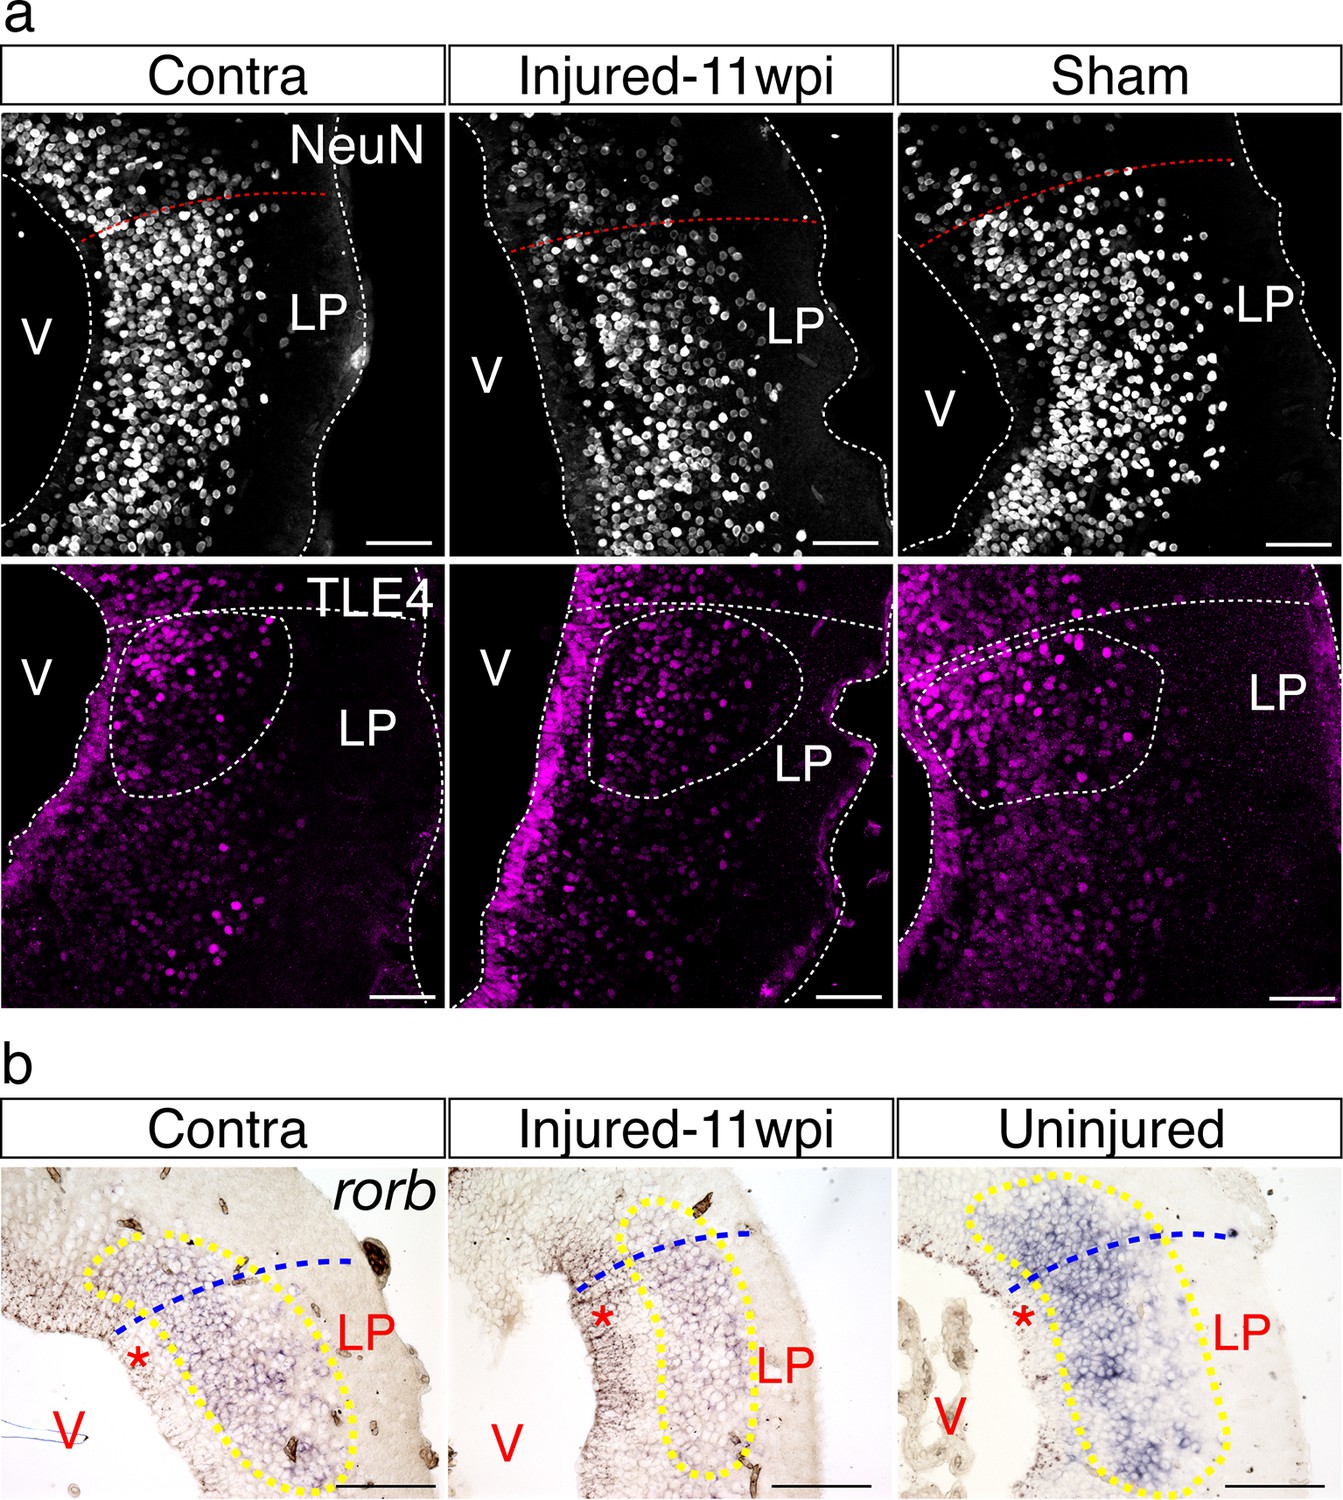
The neuronal topography of the lateral pallium is not disorganized.
(a) Representative immunohistochemistry images of the lateral pallium from contralateral, injured (11wpi), and sham brains, labeled for NeuN (top panels) and Tle4 (bottom panels). (b) Representative in situ hybridization images of rorb on 11wpi injured, contralateral, and uninjured lateral pallium sections. LP, Lateral Pallium; V, Ventricle. Scale Bars; 50 μm (a), 200 μm (b).
Figure 7
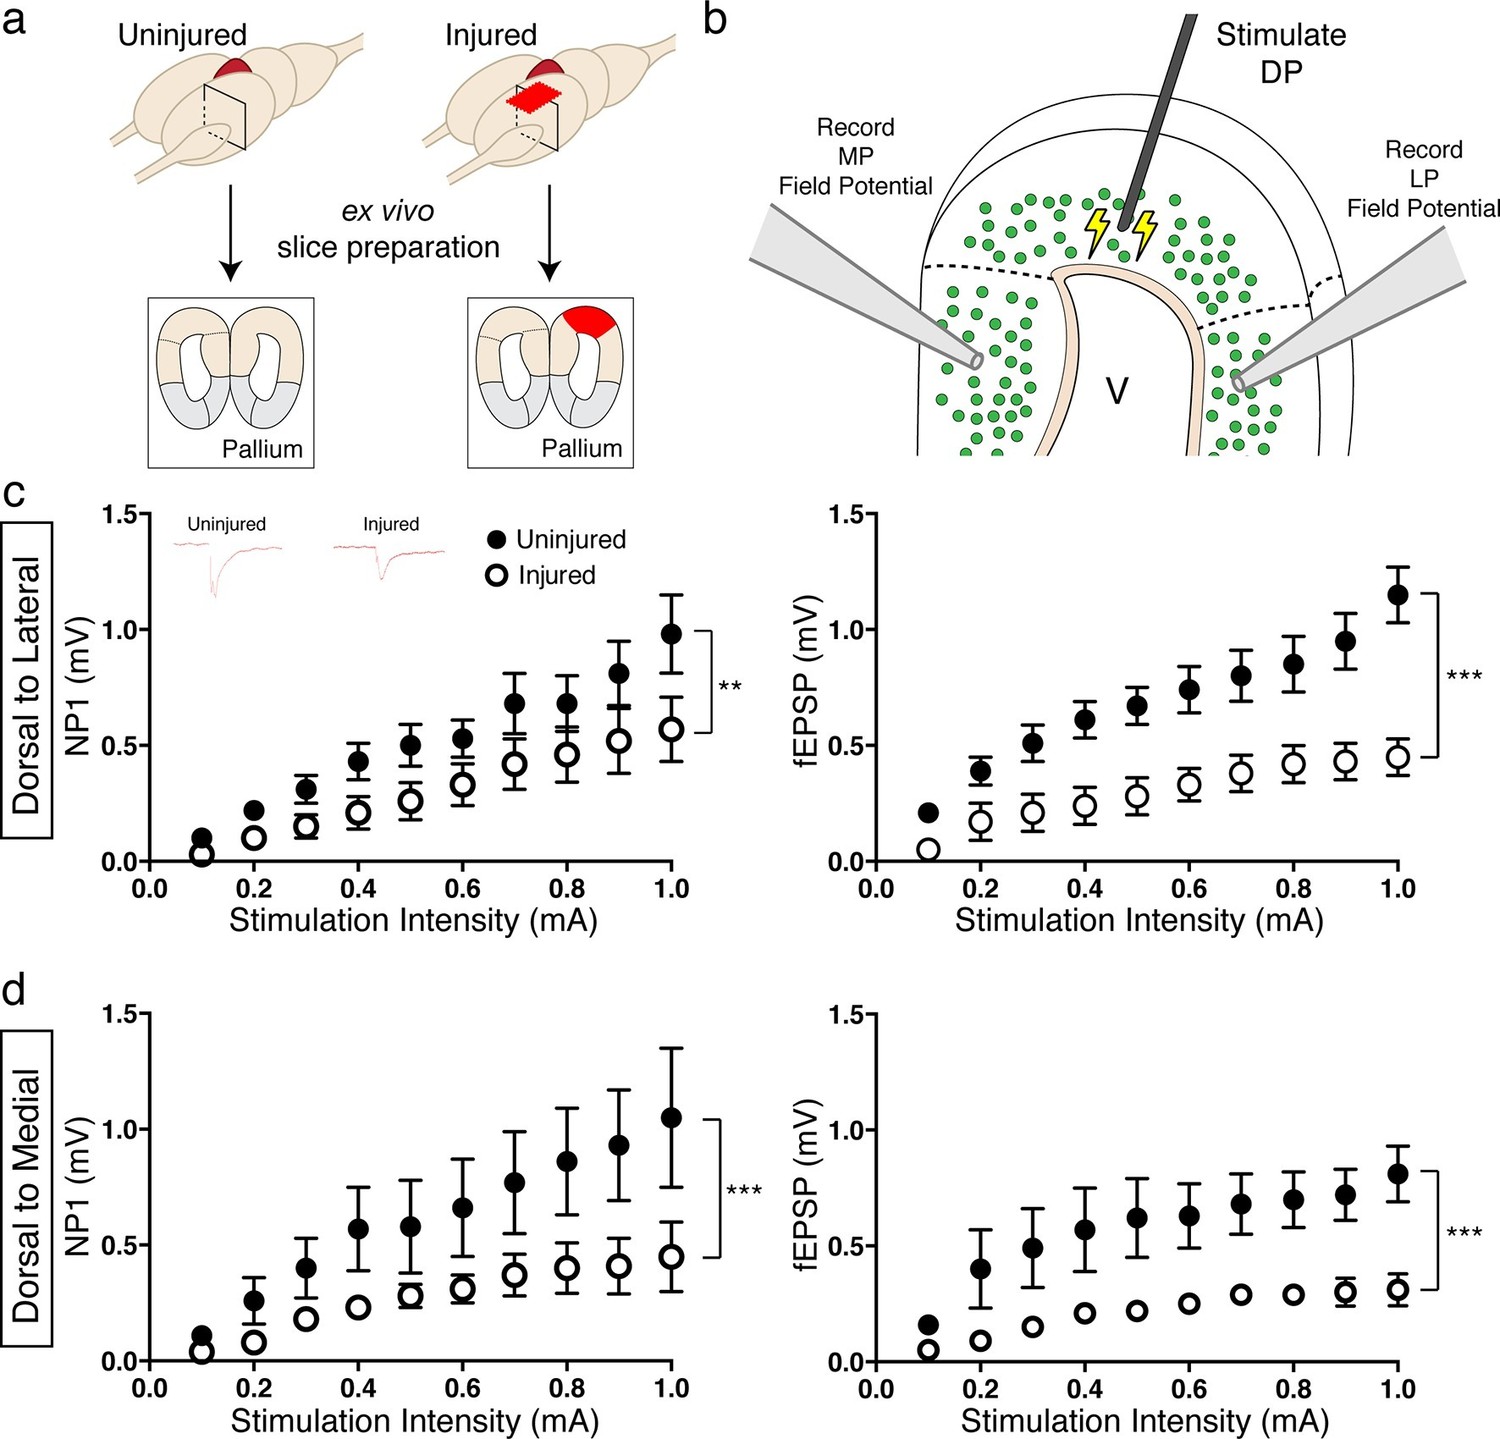
Reduced activation of medial and lateral pallium by regenerated neurons in the dorsal pallium.
(a) Schematic of tissue preparation for slice electrophysiology. (b) Schematic of experimental details showing the location of the stimulation (DP) and the field recording (MP and LP). (c) Dorsal-lateral NP1 and field pop spike amplitude is decreased in injured pallium (n=15 slices; black circles) compared to control pallium (n=15 slices; white circles) as measured by extracellular field recordings. Inset, representative traces for uninjured and injured pallium recordings. (d) Dorsal-medial NP1 and field pop spike amplitude is decreased in injured pallium (n=9 slices; black circles) compared to control pallium (n=9 slices; white circles) as measured by extracellular field recordings. DP, Dorsal Pallium; LP, Lateral Pallium; MP, Medial Pallium; V, Ventricle. All results are expressed as the mean ± SEM. **p<0.005, ***p<0.001; Two-way ANOVA repeated measures with Bonferroni post hoc test.
Videos
Video 1
in vivo MRI reveals temporal dynamics of the first 4 weeks of pallial regeneration.
The 3D surface rendering of MRI images (left panel) shows the gradual wound closure process. The raw MRI images (right panel, red dotted lines outline the tissue) show that within the first 2 weeks, the tissue does not change in shape or trajectory. During the next three time points, three stages of wound closure are observed: stump formation, protrusion, and wound closure, which occur rapidly. The time course of regeneration is in days (bottom panel). D, Day; LP, Lateral Pallium; DP, Dorsal Pallium; MP, Medial Pallium.
Video 2
Calcium imaging in the uninjured dorsal pallium reveals spontaneous calcium transients during homeostasis.
The individual cells labeled by Fluo-4 in the control pallium show spontaneous, transient increase in fluorescence. V, ventricle; DP, Dorsal Pallium.
Video 3
Calcium imaging in the injured dorsal pallium reveals spontaneous calcium transients.
The individual cells labeled by Fluo-4 in the injured pallium show spontaneous, transient increase in fluorescence. V, ventricle; DP, Dorsal Pallium.
Tables
Table 1
Quantification of BrdU+/Neuronal Subtype Marker+ nuclei in contralateral, injured (11wpi), and sham hemispheres. The numbers represent the sum of BrdU+/Neuronal Subtype Marker+ nuclei from four consecutive sections spanning the injury site. All results are expressed as the mean ± SEM.
| Ctip2+/BrdU+ | Satb2+/BrdU+ | Tle4+/BrdU+ | Calb2+/BrdU+ | |
|---|---|---|---|---|
| Contralateral (n=6) | 12.83 ± 3.114 | 5.167 ± 1.537 | 21.00 ± 15.35 | 2.000 ± 1.265 |
| 11wpi Injured (n=6) | 199.2 ± 37.93 | 70.33 ± 16.32 | 310.2 ± 76.54 | 101.7 ± 11.10 |
| Sham (n=4) | 4.250 ± 3.065 | 6.000 ± 4.378 | 10.25 ± 17.21 | 2.250 ± 1.652 |
Table 2
Parameters of electrophysiological properties of neurons in uninjured and injured brains. All results are expressed as the mean ± SD.
| Cm (pF) | Rm (mOhms) | RMP (mV) | Threshold (mV) | AP Height (mV) | Half Width (ms) | |
|---|---|---|---|---|---|---|
| Uninjured (n=9) | 49.3 ± 16.4 | 294.1 ± 155.8 | -59 ± 4 | -36.5 ± 3 | 61.9 ± 5 | 2.3 ± 0.4 |
| Injured (n=14) | 45.1 ± 21.8 | 426.7 ± 361.6 | -59 ± 5 | -30 ± 6 | 68.7 ± 14.3 | 2.7 ± 0.7 |
Download links
A two-part list of links to download the article, or parts of the article, in various formats.
Downloads (link to download the article as PDF)
Open citations (links to open the citations from this article in various online reference manager services)
Cite this article (links to download the citations from this article in formats compatible with various reference manager tools)
Adult axolotls can regenerate original neuronal diversity in response to brain injury
eLife 5:e13998.
https://doi.org/10.7554/eLife.13998


