A novel ciprofloxacin-resistant subclade of H58 Salmonella Typhi is associated with fluoroquinolone treatment failure
- Oxford University Clinical Research Unit, Vietnam
- Patan Academy of Health Sciences, Nepal
- Oxford University, United Kingdom
- The London School of Hygiene and Tropical Medicine, United Kingdom
- The University of Melbourne, Australia
- The Wellcome Trust Sanger Institute, United Kingdom
- Civil Services Hospital, Nepal
- Nagasaki University, Japan
- University of Oxford, United Kingdom
Figures
Figure 1
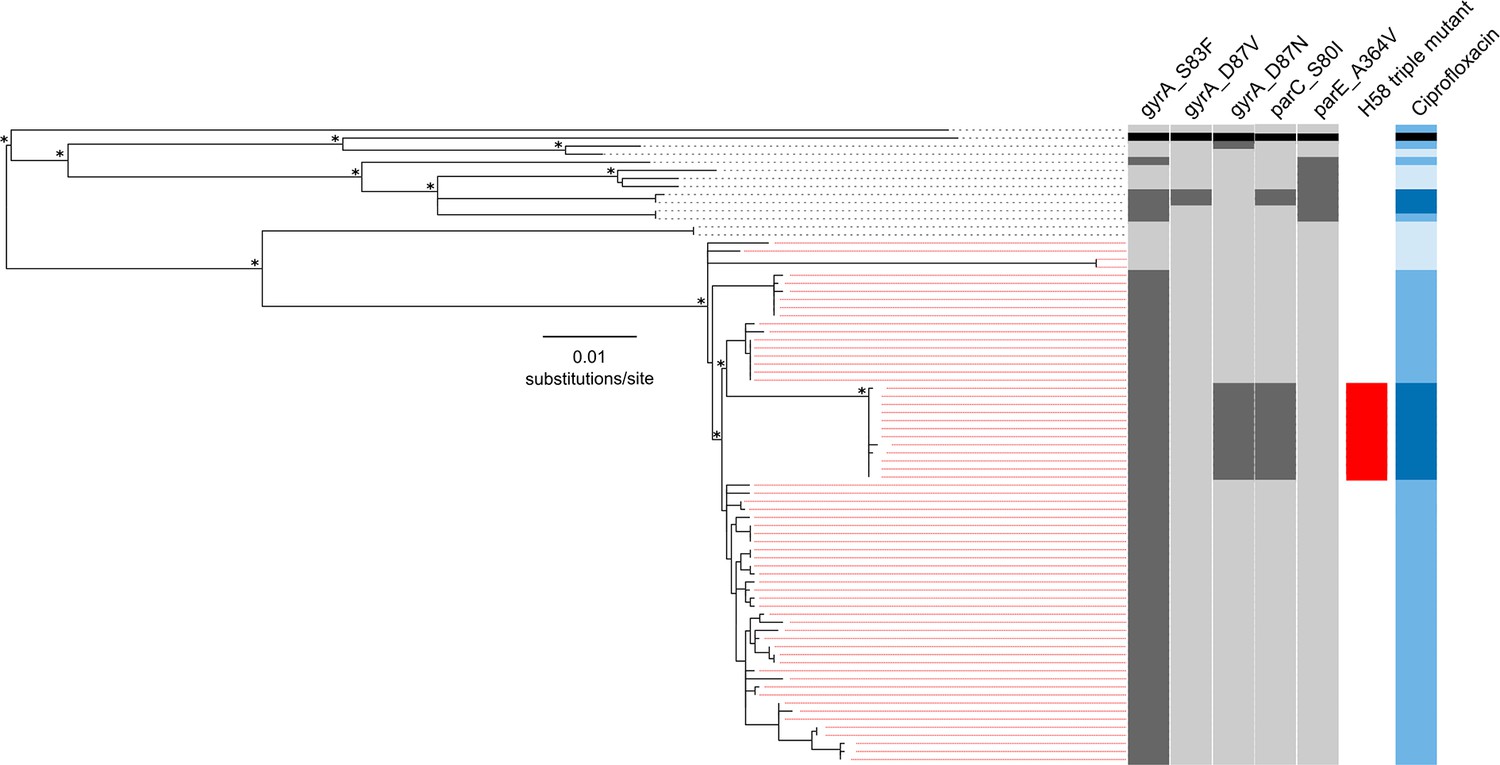
The phylogenetic structure of 78 Nepali Salmonella Typhi isolated during a gatifloxacin versus ceftriaxone randomised controlled trial.
Maximum likelihood phylogeny based on core-genome SNPs of 78 Salmonella Typhi RCT isolates with the corresponding metadata, including the presence of mutations (dark grey) in gyrA (S83F, D87V and D87N), parC (S80I) and parC (A364V) and susceptibility to ciprofloxacin (susceptible, light blue; intermediate, mid-blue and non-susceptible, dark blue) by Minimum Inhibitory Concentration (MIC). The reference strain CT18 was used for context and highlighted by the black boxes. Red lines linking to metadata show isolates belonging to the Salmonella Typhi H58 lineage (with H58 triple mutants highlighted), other lineages (non-H58) are shown with black lines. The scale bar indicates the number of substitutions per variable site (see methods). Asterisks indicate ≥85% bootstrap support at nodes of interest.
Figure 2
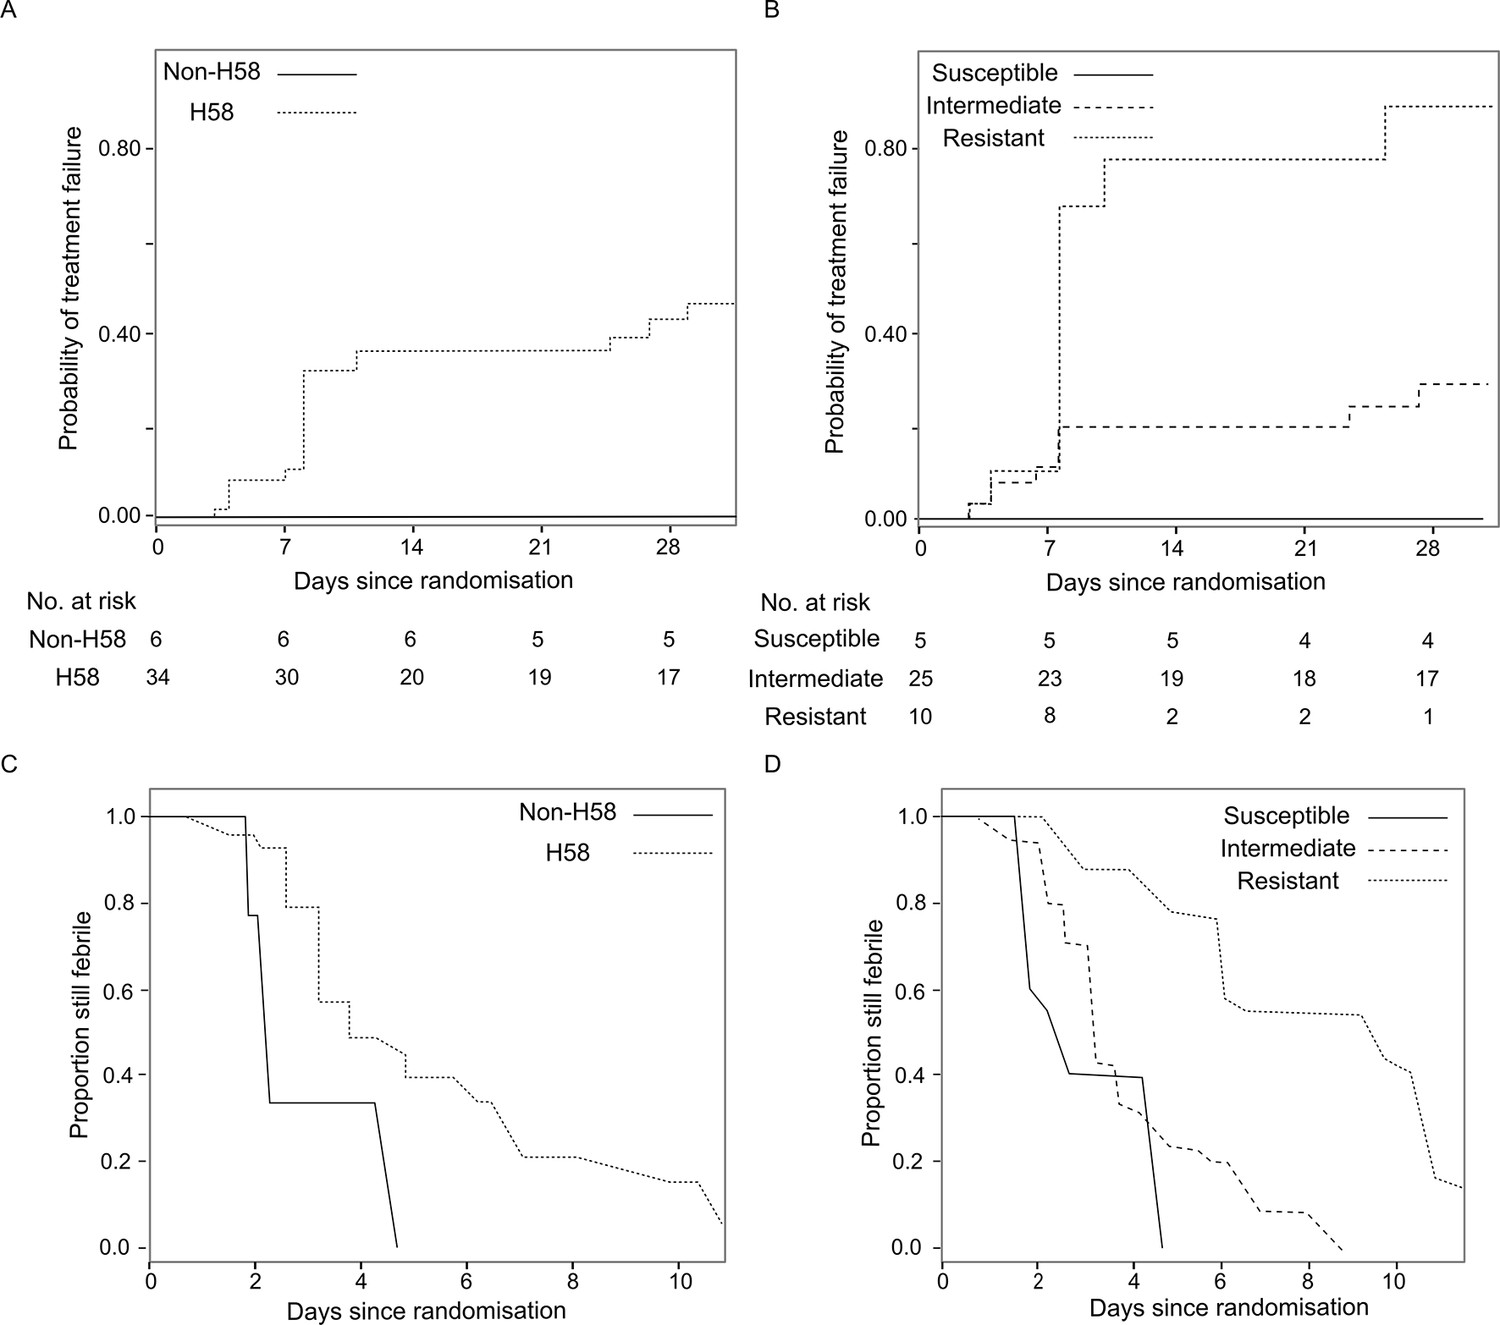
The association of Salmonella Typhi lineage and ciprofloxacin susceptibility with treatment failure and fever clearance time in patients randomised to gatifloxacin.
(A) Kaplan-Meier curve for time to treatment failure by H58 and non-H58 Salmonella Typhi. (B) Kaplan-Meier curve for time to treatment failure by Salmonella Typhi susceptibility group (susceptible, intermediate, resistant to ciprofloxacin). (C) Non-parametric maximum likelihood estimators for interval-censored fever clearance time (see methods) by H58 and non-H58 Salmonella Typhi. (D) Non-parametric maximum likelihood estimators for interval-censored fever clearance time by Salmonella Typhi susceptibility group (susceptible, intermediate, resistant to ciprofloxacin).
Figure 3
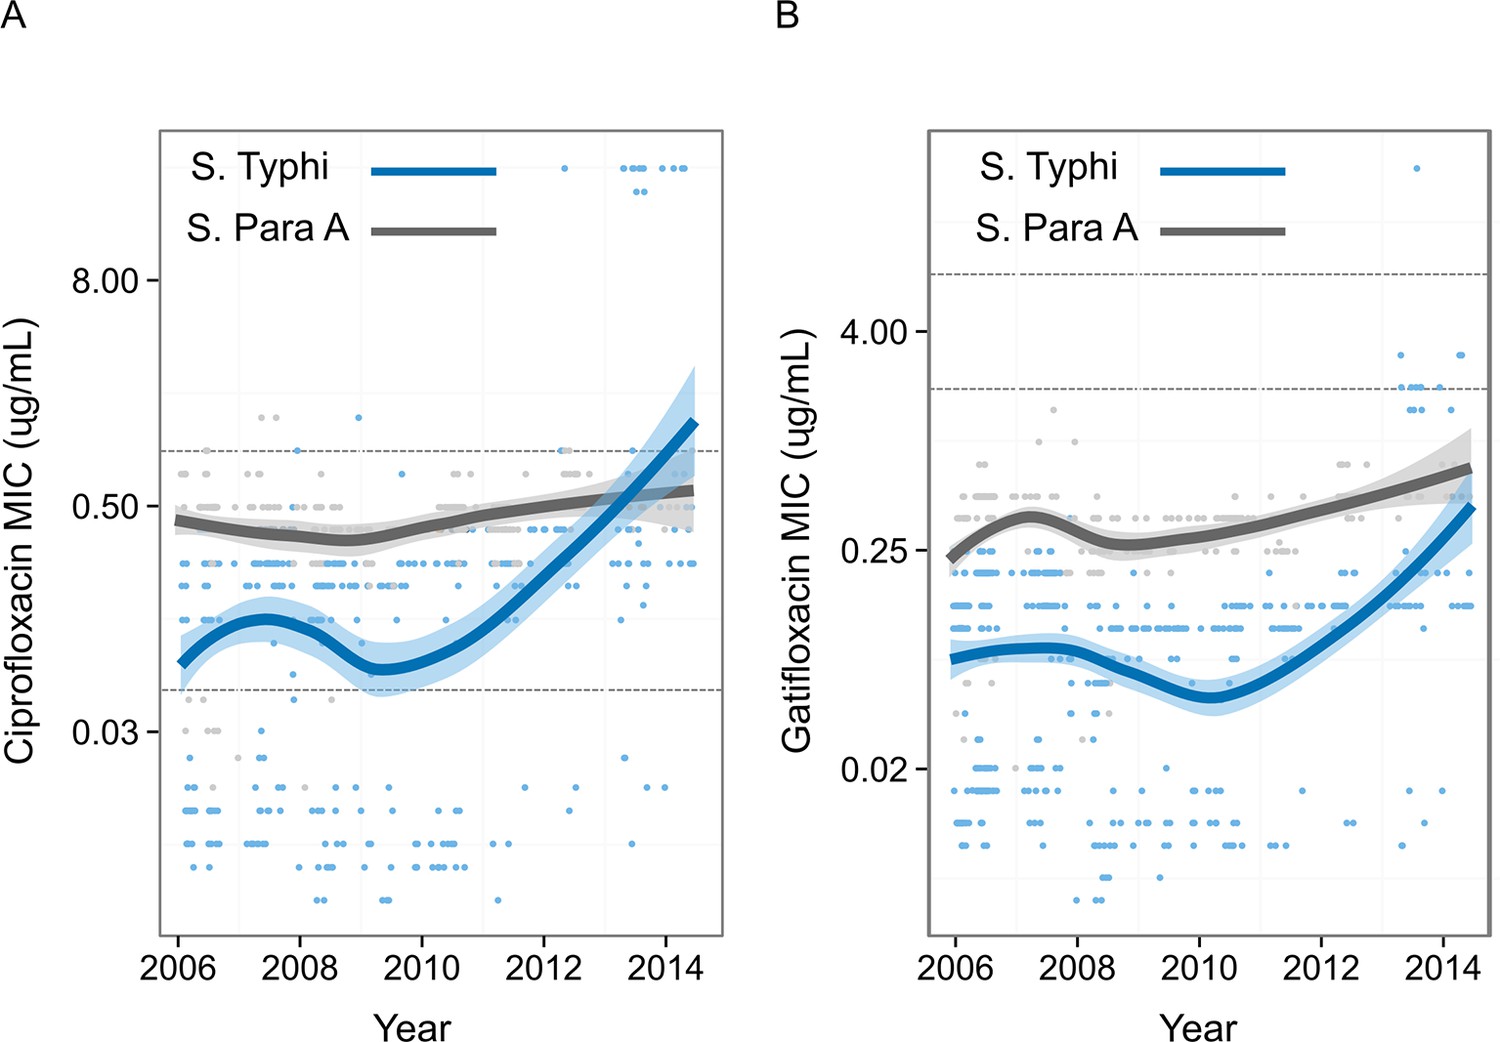
Minimum Inhibitory Concentrations of Nepali Salmonella Typhi and Salmonella Paratyphi against ciprofloxacin and gatifloxacin over ten years.
Minimum Inhibitory Concentrations (μg/ml) for 568 Nepali Salmonella Typhi (blue) and 269 Nepali Salmonella Paratyphi A (grey) against (A) ciprofloxacin and (B) gatifloxacin collected from four randomised controlled trials conducted between 2005–2014 at Patan Hospital in Kathmandu, Nepal (Pandit et al., 2007; Koirala et al., 2013; Arjyal et al., 2011). The smoothed line derived from the generalized additive model showing a non-linear increase in Minimum Inhibitory Concentrations over time, with shading representing the 95% confidence interval. Lower and upper horizontal lines represent the current CLSI cut-offs for susceptible/intermediate and intermediate/resistant, respectively (CLSI, 2012).
Figure 4
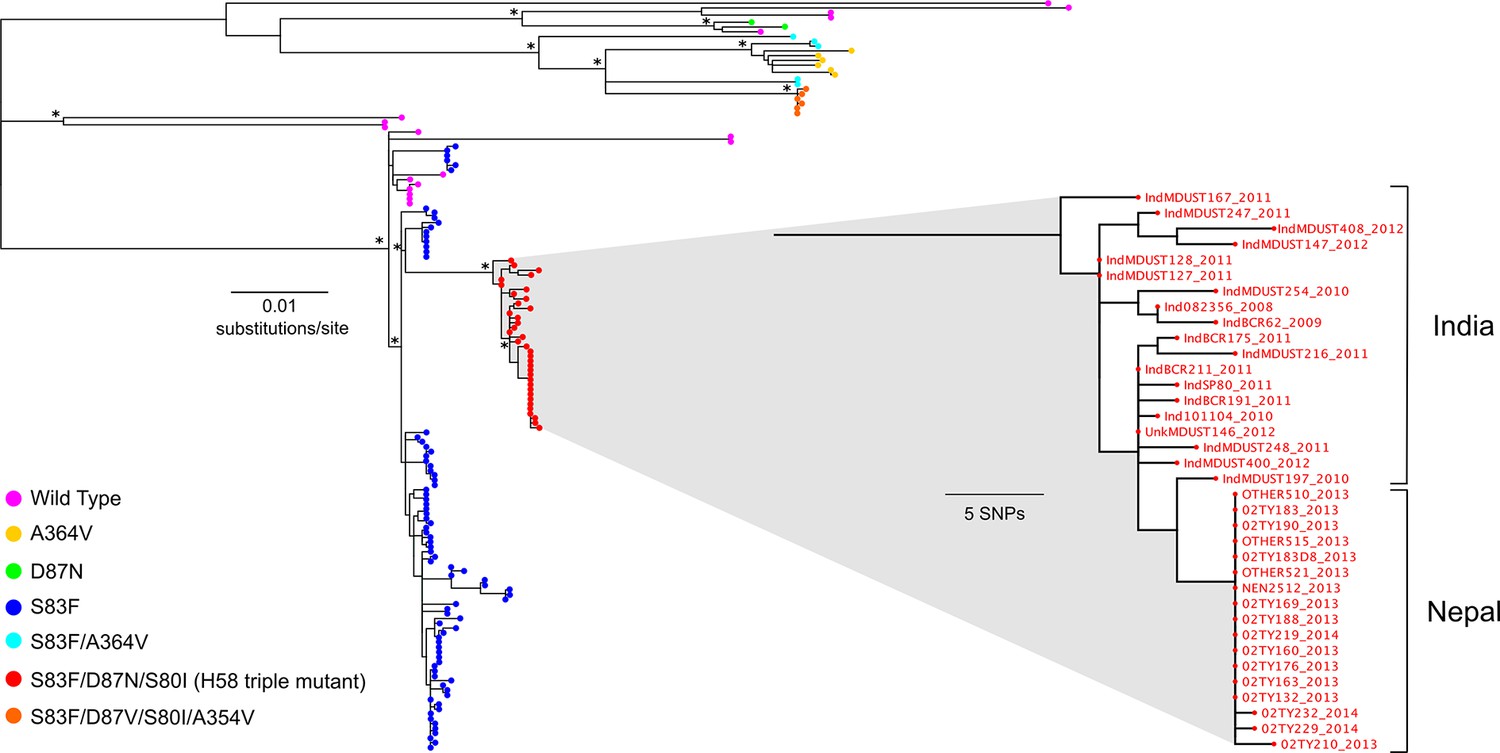
The phylogenetic structure of fluoroquinolone resistant Salmonella Typhi in a regional context.
Maximum likelihood phylogeny based on core-genome SNPs of 136 (78 from the RCT) Salmonella Typhi isolates from Nepal and neighbouring India (Supplementary file 1). Main tree shows the overall phylogenetic structure and the presence of specific combinations of mutations in gyrA (S83F, D87V and D87N), parC (S80I) and parE (A364V). The inset shows a magnified view of the fluoroquinolone-resistant Salmonella Typhi H58 triple mutants from Nepal and their close association with similarly fluoroquinolone-resistant Salmonella Typhi H58 triple mutants from India (Wong et al., 2015). The scale bar on the primary tree indicates the number of substitutions per variable site, while that in the inset indicates genetic distance in number of SNPs (see methods). Asterisks indicate ≥85% bootstrap support at nodes of interest.
Tables
Table 1
Comparison of antimicrobial susceptibility by Salmonella Typhi lineage.
| E test | Non-H58 (N=13) | H58 (N=65) | p value* | ||||
|---|---|---|---|---|---|---|---|
| MIC50 | MIC90 | GM (range) | MIC50 | MIC90 | GM (range) | ||
| Amoxicillin | 0.5 | 1 | 0.77 (0.38–38) | 0.75 | >256 | 1.43 (0.38–>256) | 0.0412 |
| Chloramphenicol | 3 | 4 | 2.7 (1.5–8) | 4 | 12 | 5.7 (2–>256) | 0.0147 |
| Ceftriaxone | 0.06 | 0.06 | 0.06 (0.05–0.13) | 0.09 | 0.19 | 0.11 (0.03–0.64) | 0.0004 |
| Gatifloxacin | 0.13 | 0.25 | 0.06 (0.01–2) | 0.13 | 2 | 0.21 (0.01–3) | 0.1197 |
| Nalidixic acid | >256 | >256 | 21.6 (1–>256) | >256 | >256 | 346.8 (1–>256) | 0.0004 |
| Ofloxacin | 0.25 | 0.75 | 0.24 (0.03–>32) | 0.5 | >3232 | 1.09 (0.03–>32) | 0.0240 |
| Trimethoprim sulphate | 0.02 | 0.05 | 0.03 (0.02–0.05) | 0.05 | 0.32 | 0.09 (0.01–>32) | 0.0016 |
| Ciprofloxacin | 0.13 | 0.75 | 0.11 (0.01–>32) | 0.38 | >32 | 0.80 (0.02–>32) | 0.0051 |
| Ciprofloxacin susceptibility group | 0.0008# | ||||||
| - Susceptible | 6 (46.2%) | 4 (6.2%) | |||||
| - Intermediate | 4 (30.8%) | 48 (73.8%) | |||||
| - Resistant | 3 (23.1%) | 13 (20.0%) | |||||
-
*Comparisons between Salmonella Typhi lineage for MICs and ciprofloxacin susceptibility groups were based on the Wilcoxon rank sum test and Fisher’s exact test. respectively.
-
MIC: minimum inhibitory concentration, measured in µg/ml
-
#p value for comparison of susceptible vs. intermediate/resistant combined between groups by Fisher’s exact test is 0.001.
-
GM: geometric mean, the upper range of the values was determined by multiplying the MIC by 2 if the result was >X (for example, >256 = 256*2 = 512).
Table 2
Summary of time to treatment failure by Salmonella Typhi lineage and ciprofloxacin susceptibility.
| Time to treatment failure | Gatifloxacin (events/N) | Ceftriaxone (events/N) | Hazard ratio of time to failure (95%CI); p value | Heterogeneity test (p value) |
|---|---|---|---|---|
| H58* | 0.020 | |||
| - H58 | 15/34 | 3/31 | 0.19 (0.05, 0.56); p=0.002 | |
| - Non-H58 | 0/6 | 2/7 | 3.87 (0.31, 534.24); p=0.32 | |
| Ciprofloxacin susceptibility group† | 0.08 | |||
| - Susceptible | 0/5 | 1/5 | 2.40 (0.13, 350.21); p=0.57 | |
| - Intermediate | 7/25 | 2/27 | 0.27 (0.05, 0.99); p=0.049 | |
| - Resistant | 8/10 | 2/6 | 0.27 (0.05, 1.01); p=0.052 |
-
*Likelihood ratio test p=0.06 and 0.40 for comparison of time to treatment failure between H58 vs. non-H58 groups in gatifloxacin arm only and in all patients, respectively
-
†Likelihood ratio test p=0.007 for comparison of time to treatment failure between MIC groups in gatifloxacin arm only
Table 3
Summary of fever clearance time by Salmonella Typhi lineage and ciprofloxacin susceptibility.
| Fever clearance time | Gatifloxacin median (IQR) days | Ceftriaxone median (IQR) days | Acceleration factor (95%CI); p value | Heterogeneity test (p value) |
|---|---|---|---|---|
| H58¥ | 0.07 | |||
| - H58 | 5.03 (3.18, 7.21) | 3.07 (1.89 ,4.52) | 1.59 (1.22, 2.09); p=0.0006 | |
| - Non-H58 | 2.87 (2.08, 3.7) | 3.12 (2.2, 4.12) | 0.90 (0.59, 1.36); p=0.61 | |
| Ciprofloxacin susceptibility group‡ | 0.015 | |||
| - Susceptible | 2.96 (2.13, 3.85) | 4.78 (4.01, 5.5) | 0.71 (0.49, 1.02); p=0.07 | |
| - Intermediate | 4.01 (2.76, 5.37) | 2.63 (1.52, 4.05) | 1.31 (0.97, 1.76); p=0.07 | |
| - Resistant | 8.2 (5.99, 10.5) | 3.83 (2.96, 4.7) | 2.23 (1.57, 3.17); p<0.0001 |
-
¥p=0.013 and p=0.029 for comparison of interval censored time to fever clearance between H58 vs. non-H58 groups in gatifloxacin arm only and in all patients, respectively
-
‡p<0.0001 for comparison of interval censored time to fever clearance between MIC groups in gatifloxacin arm only
Additional files
-
Supplementary file 1
Table of Salmonella Typhi isolates and their corresponding sequencing metadata used in this study.
- https://doi.org/10.7554/eLife.14003.010
-
Supplementary file 2
(A) Table of baseline characteristics by Salmonella Typhi lineage.
(B) Table of baseline characteristics grouped by Salmonella Typhi ciprofloxacin susceptibility. (C) Table of treatment failure in detail by Salmonella Typhi lineage in the gatifloxacin treatment group. (D) Table of treatment failure in detail by ciprofloxacin susceptibility in the gatifloxacin treatment group.
- https://doi.org/10.7554/eLife.14003.011
Download links
A two-part list of links to download the article, or parts of the article, in various formats.
Downloads (link to download the article as PDF)
Open citations (links to open the citations from this article in various online reference manager services)
Cite this article (links to download the citations from this article in formats compatible with various reference manager tools)
A novel ciprofloxacin-resistant subclade of H58 Salmonella Typhi is associated with fluoroquinolone treatment failure
eLife 5:e14003.
https://doi.org/10.7554/eLife.14003


