A FRET-based study reveals site-specific regulation of spindle position checkpoint proteins at yeast centrosomes
- German Cancer Research Centre, Germany
- University of Heidelberg, Germany
- Centre for Molecular Biology, Germany
Figures
Figure 1 with 3 supplements
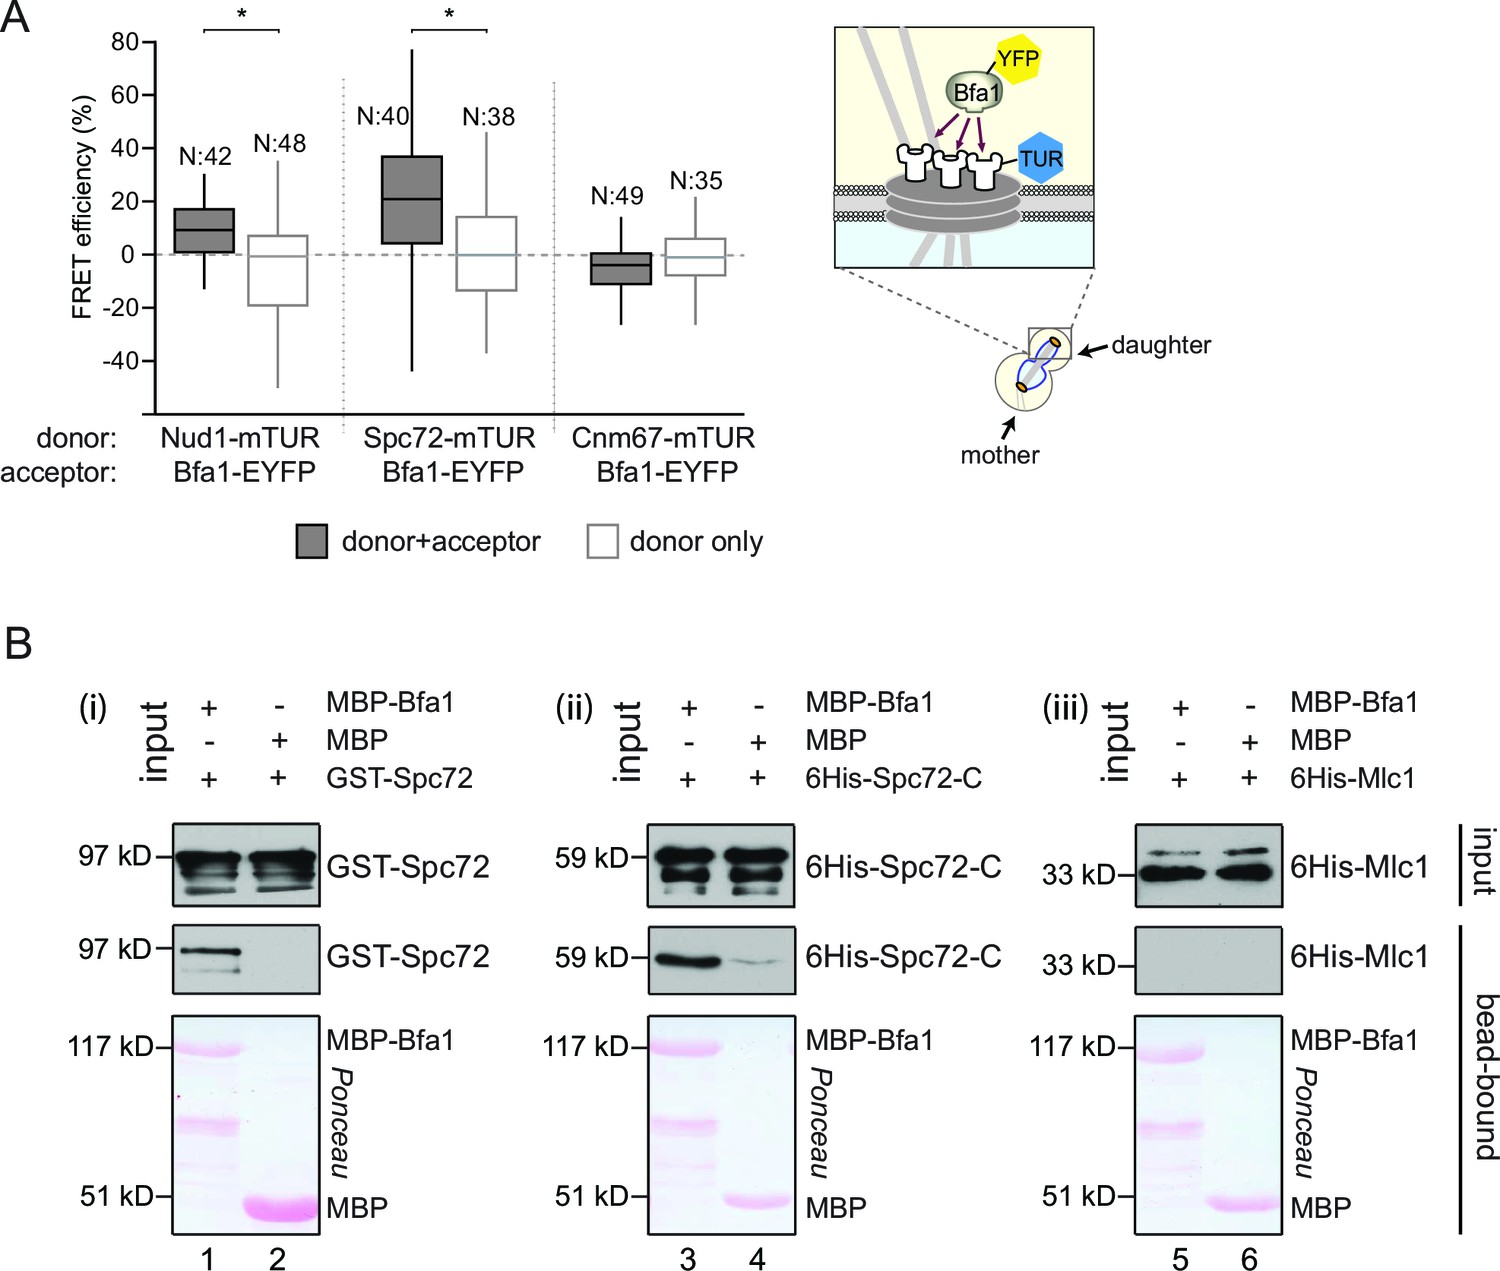
Bfa1 interacts with the SPB outer layer proteins Spc72 and Nud1.
(A) Box-whisker plots representing the distributions of FRET efficiency values for Bfa1 (C-terminally tagged with EYFP) in pair with Nud1, Spc72 or Cnm67 (C-terminally tagged with mTUR) measured at the dSPB as depicted in the cartoon. The FRET data shown here and in subsequent figures are one out of two biological replicates unless otherwise specified. For Box-Whisker plots representing FRET data, the boxes show the lower and upper quartiles, the whiskers show the minimum and maximal values excluding outliers; outliers (not shown) were calculated as values greater or lower than 1.5 times the interquartile range; the line inside the box indicates the median. N is the sample size; asterisks show significant difference according to student’s t-test (p<0.01) and the exact p-values are indicated in the accompanying data file (Figure 1—source data 1). (B) In vitro binding assay of bead bound recombinant MBP-Bfa1 with bacterially purified GST-Spc72 (i), 6His-Spc72-C (codons 231–622) (ii) and 6His-Mlc1 (iii). MBP on beads and 6His-Mlc1 were used as negative controls for in vitro binding reaction. Spc72 was detected with anti-GST antibody; Spc72-C and Mlc1 were detected with anti-6His antibodies after immunoblotting. The Ponceau S stained membrane shows the levels of MBP-Bfa1 and MBP used in the assay. One representative blot out of two independent experiments is shown in each panel.
-
Figure 1—source data 1
Raw data and the calculated FRET efficiencies of Nud1-Bfa1 and Spc72-Bfa1 pairs at SPBs in cycling cells (source data for Figure 1A).
- https://doi.org/10.7554/eLife.14029.004
Figure 1—figure supplement 1
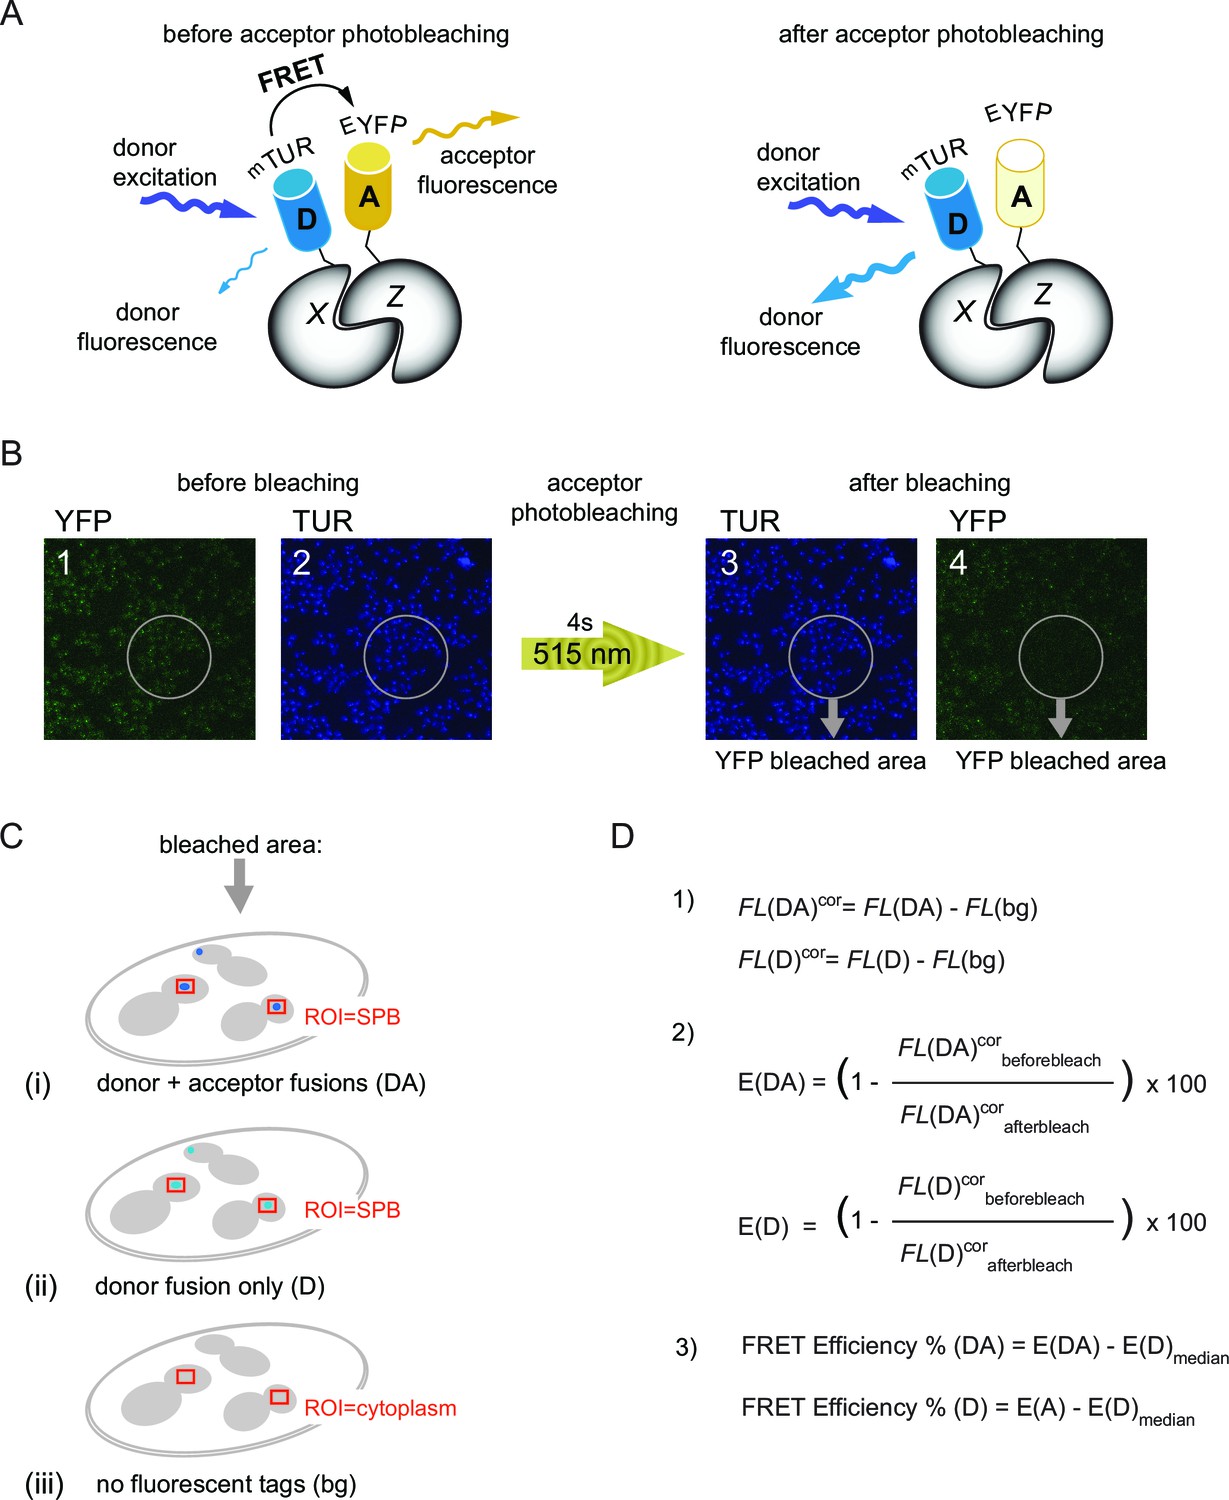
The basic principles of acceptor photobleaching technique to measure FRET.
(A) Schematic representation of FRET between D-donor (mTUR - turquoise fluorescent protein tagged with host protein X) and A-acceptor (EYFP - yellow fluorescent protein tagged with host protein Z). Note that donor fluorescence increases after photobleaching of the acceptor. (B) Experimental setup to measure FRET. The order of image acquisition is indicated from 1 to 4 and the region of photobleaching within the sample field is delineated by grey circles. 515 nm: laser wavelength used for YFP photobleaching. (C) FRET for each protein pair tagged with mTUR and EYFP was calculated using mean fluorescence intensities of three samples: (DA) – with donor and acceptor tagged protein pair (i), (D) - with donor only tag (ii), (bg) - no tag (iii). Fluorecence intensities of donor fluorescence were measured from regions around SPBs indicated with red squares. For untagged cells, a region within the cytoplasm was measured (used for background correction of the signal intensities). (D) Equations used for quantification of FRET efficiency: (1) background correction of the mean fluorescence intensities (FL) where FL(DA), FL(D), FL(bg) are the raw values of mean fluorescence intensities of the donor and acceptor (DA), the donor only (D) and untagged (bg) samples described in Figure 1—figure supplement 1C. FLcor: background corrected values. (2) Calculation of percentage increase in FLcor after acceptor photobleaching for the donor and acceptor pair [E(DA)] and for the donor only control [E(DA)]. (3) Normalization of the E(DA) and E(D) values to the median of E(D) [E(D)median] to obtain the 'FRET efficiency%' shown in the box-whisker plots. FRET for each pair was recognized as positive if the 'FRET efficiency% (DA)' was significantly higher than the 'FRET efficiency% (D)' according to student´s t-test with (p<0.01).
Figure 1—figure supplement 2
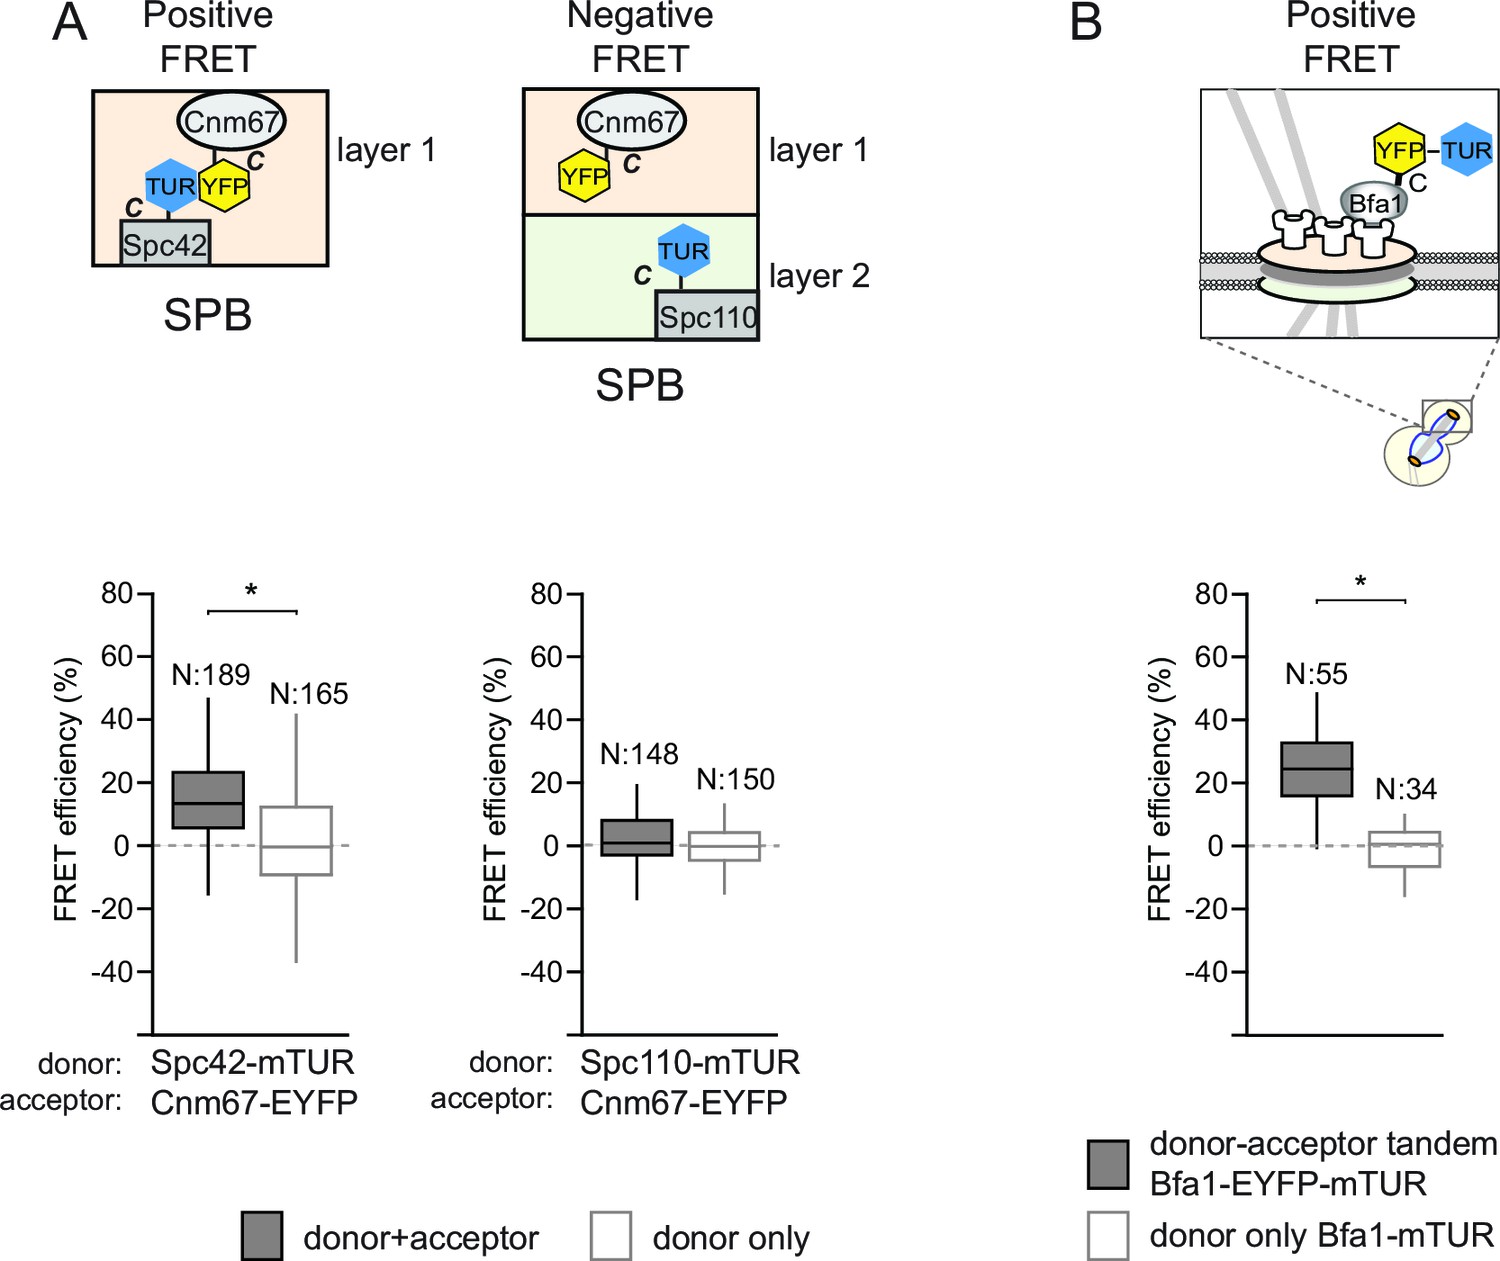
Validation of acceptor photobleaching technique with FRET-positive and FRET-negative controls.
(A–B) Box-Whisker plots representing the distributions of FRET efficiencies measured in pairs of fluorescently tagged proteins: Spc42-Cnm67 (FRET-positive pair) and Spc110-Cnm67 (FRET-negative pair) (A) and in the tandem pair of EYFP and mTUR in fusion with Bfa1 (B). Box-whisker plot is one out of two technical replicates from the same experiment. N: sample size. Asterisks show significant difference according to student’s t-test (p<0.01). See the accompanying data file for exact p-values (Figure 1—figure supplement 2—source data —1 and 2).
-
Figure 1—figure supplement 2—source data 1
Raw and calculated FRET efficiencies of Spc42-Cnm67 and Spc110-Cnm67 pairs at SPBs in cycling cells (source data for Figure 1—figure supplement 2A).
- https://doi.org/10.7554/eLife.14029.007
-
Figure 1—figure supplement 2—source data 2
Raw and calculated FRET efficiencies of Bfa1-EYFP-mTUR tandem pair at SPBs in cycling cells (source data for Figure 1—figure supplement 2B).
- https://doi.org/10.7554/eLife.14029.008
Figure 1—figure supplement 3
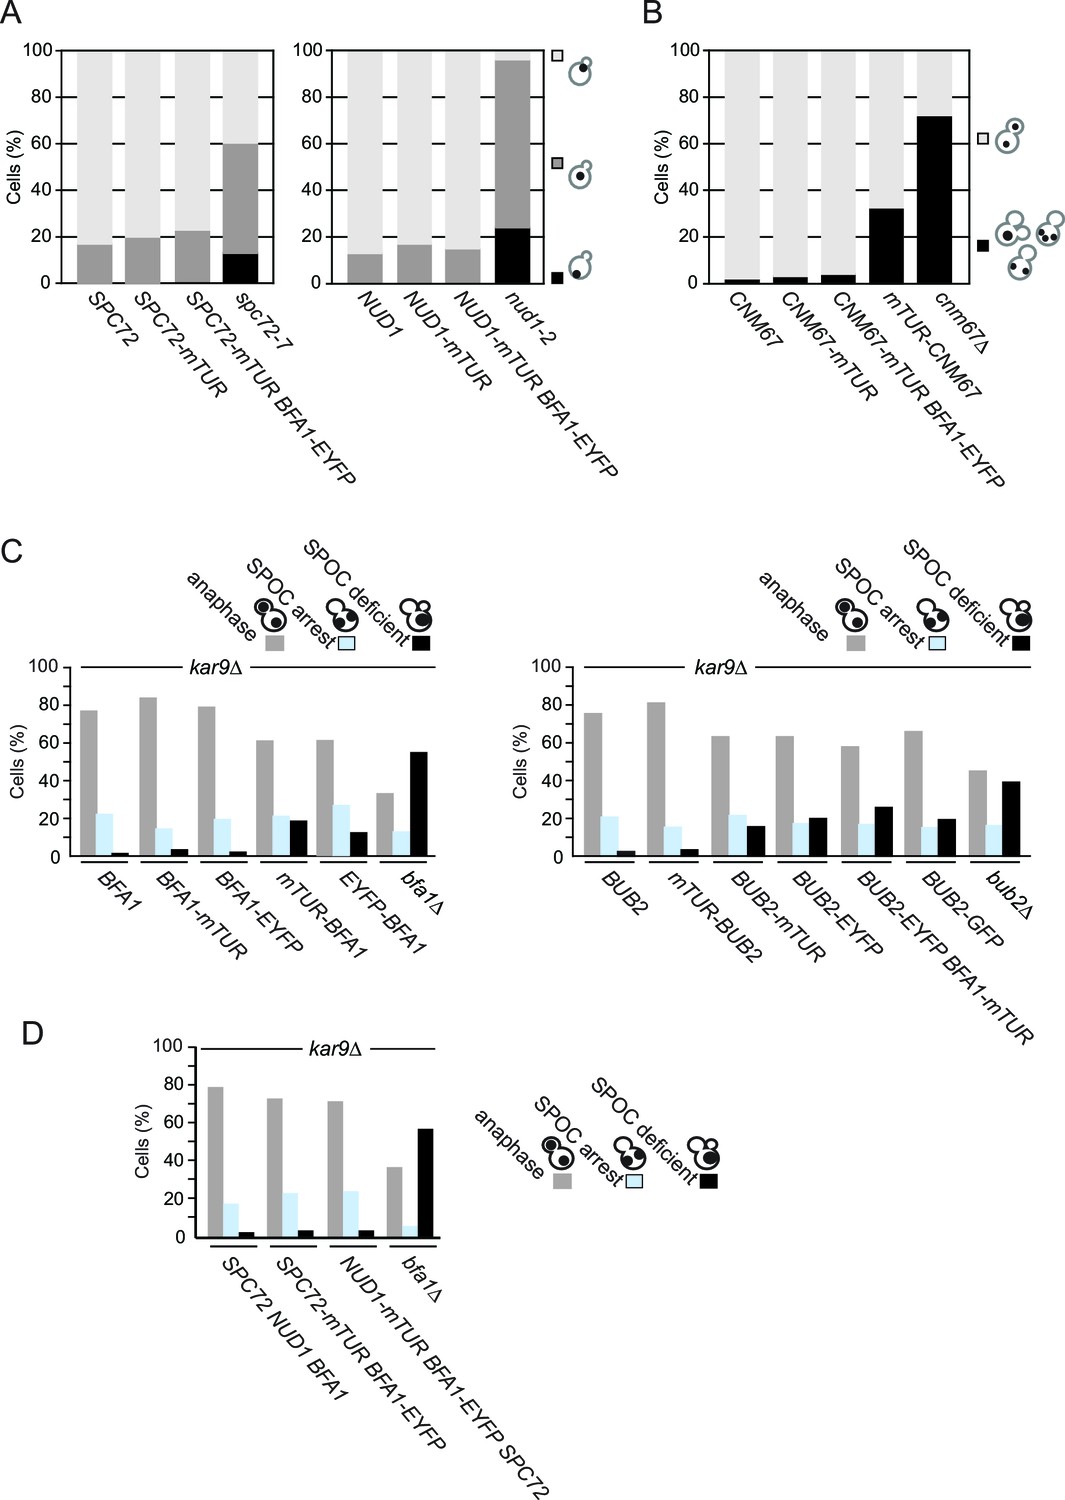
Functionality of tagged SPB proteins and SPOC components.
(A) Fluorescent C-terminal fusions of Nud1 and Spc72 are functional. The indicated cell types were grown at 23°C and then shifted to 30°C for 3 hr before fixation and DAPI staining. Graphs show the percentages of cells with the nuclei positioned as depicted in the cartoon to the left. Light grey bars represent correct nuclear positioning (at the bud neck region). N: 200 cells per strain. (B) Cnm67 fusion proteins are functional. Anaphase nuclear positioning was analyzed for wild type (CNM67) and CNM67 tagged strains as depicted. CNM67 deleted cells have a strong defect in anaphase spindle positioning and were used as a positive control. N: 200 cells per strain. Please note that cnm67∆ doesn’t have nuclear positioning defects early in the cell cycle (Grava et al., 2006) (our unpublished data). (C–D) Functionality of SPOC in kar9∆ cells carrying Bfa1, Bub2 (C) and Nud1, Spc72 (D) fused with the indicated fluorophores. The indicated cell types were grown at 23°C and shifted to 30°C for 3 hr to induce the accumulation of cells with misaligned spindles (blue bars). Black bars indicate the SPOC deficient phenotypes as a result of cell cycle progression despite spindle orientation defects. N: 200 cells per strain. One representative graph out of three independent experiments is shown.
Figure 2 with 1 supplement

Bfa1 interacts with Spc72 and Nud1 at the daughter and mother SPBs.
(A–B) Representative images of metaphase-arrested cells carrying Nud1-mTUR Bfa1-EYFP (A) and Spc72-mTUR Bfa1-EYFP (B). Scale bar: 3 μm. (C–D) Box and Whiskers plots showing FRET efficiency for the indicated Nud1-Bfa1 (C) and Spc72-Bfa1 (D) pairs at the daughter and mother SPBs (dSPB and mSPB) in metaphase-arrested cells. N: sample size. Asterisks show significant difference according to student’s t-test (p<0.01). See the accompanying data files (Figure 2—source data 1 and 2) for exact p-values. (E–F) Scatter plots of FRET efficiencies for Nud1-Bfa1 (E) and Spc72-Bfa1 (F) pairs as a function of Bfa1-EYFP fluorescence intensity values obtained from the dSPB and from the mSPB. N: Sample size. R: r-squared value for the best-fit trendline.
-
Figure 2—source data 1
Raw data and the calculated FRET efficiencies of Nud1-Bfa1 and Spc72-Bfa1 pairs at SPBs in metaphase arrested cells (source data for Figure 2C).
- https://doi.org/10.7554/eLife.14029.011
-
Figure 2—source data 2
Raw data and the calculated FRET efficiencies of the Spc72-Bfa1 pair at the mother and the daughter SPB in metaphase arrested cells (source data for Figure 2D).
- https://doi.org/10.7554/eLife.14029.012
Figure 2—figure supplement 1
FRET analysis of Bfa1 and Bub2.
(A–B) FRET efficiencies of Bfa1-Nud1 (A) and Bfa1-Spc72 (B) in metaphase and anaphase arrested cells. Metaphase arrest is achieved by Cdc20 depletion (Gal1-CDC20) and anaphase arrest was induced by overproduction of nondegradable Clb2 (Gal1-CLB2ΔDB). (C–D) FRET efficiency of mTUR-Bub2 with Nud1-EYFP and Spc72-EYP (C) or with Bfa1 C-terminal fusion (D). Box-whisker plots in C and D are one out of two technical replicates from the same experiment. N: sample size. Asterisks show significant difference according to student’s t-test (p<0.01). See the accompanying data file for exact p-values (Figure 2—figure supplement 1—source data 1–4).
-
Figure 2—figure supplement 1—source data 1
Raw and calculated FRET efficiencies of the Bfa1-Nud1 pair in metaphase and anaphase arrested cells (source data for Figure 2—figure supplement 1A).
- https://doi.org/10.7554/eLife.14029.014
-
Figure 2—figure supplement 1—source data 2
Raw and calculated FRET efficiencies of the Bfa1-Spc72 pair in metaphase and anaphase arrested cells (source data for Figure 2—figure supplement 1B).
- https://doi.org/10.7554/eLife.14029.015
-
Figure 2—figure supplement 1—source data 3
Raw and calculated FRET efficiencies of Bub2-Nud1 and Bub2-Spc72 pairs in cycling cells (source data for Figure 2—figure supplement 1C).
- https://doi.org/10.7554/eLife.14029.016
-
Figure 2—figure supplement 1—source data 4
Raw and calculated FRET efficiencies of Bub2-Bfa1 pair in cycling cells (source data for Figure 2—figure supplement 1D).
- https://doi.org/10.7554/eLife.14029.017
Figure 3 with 1 supplement

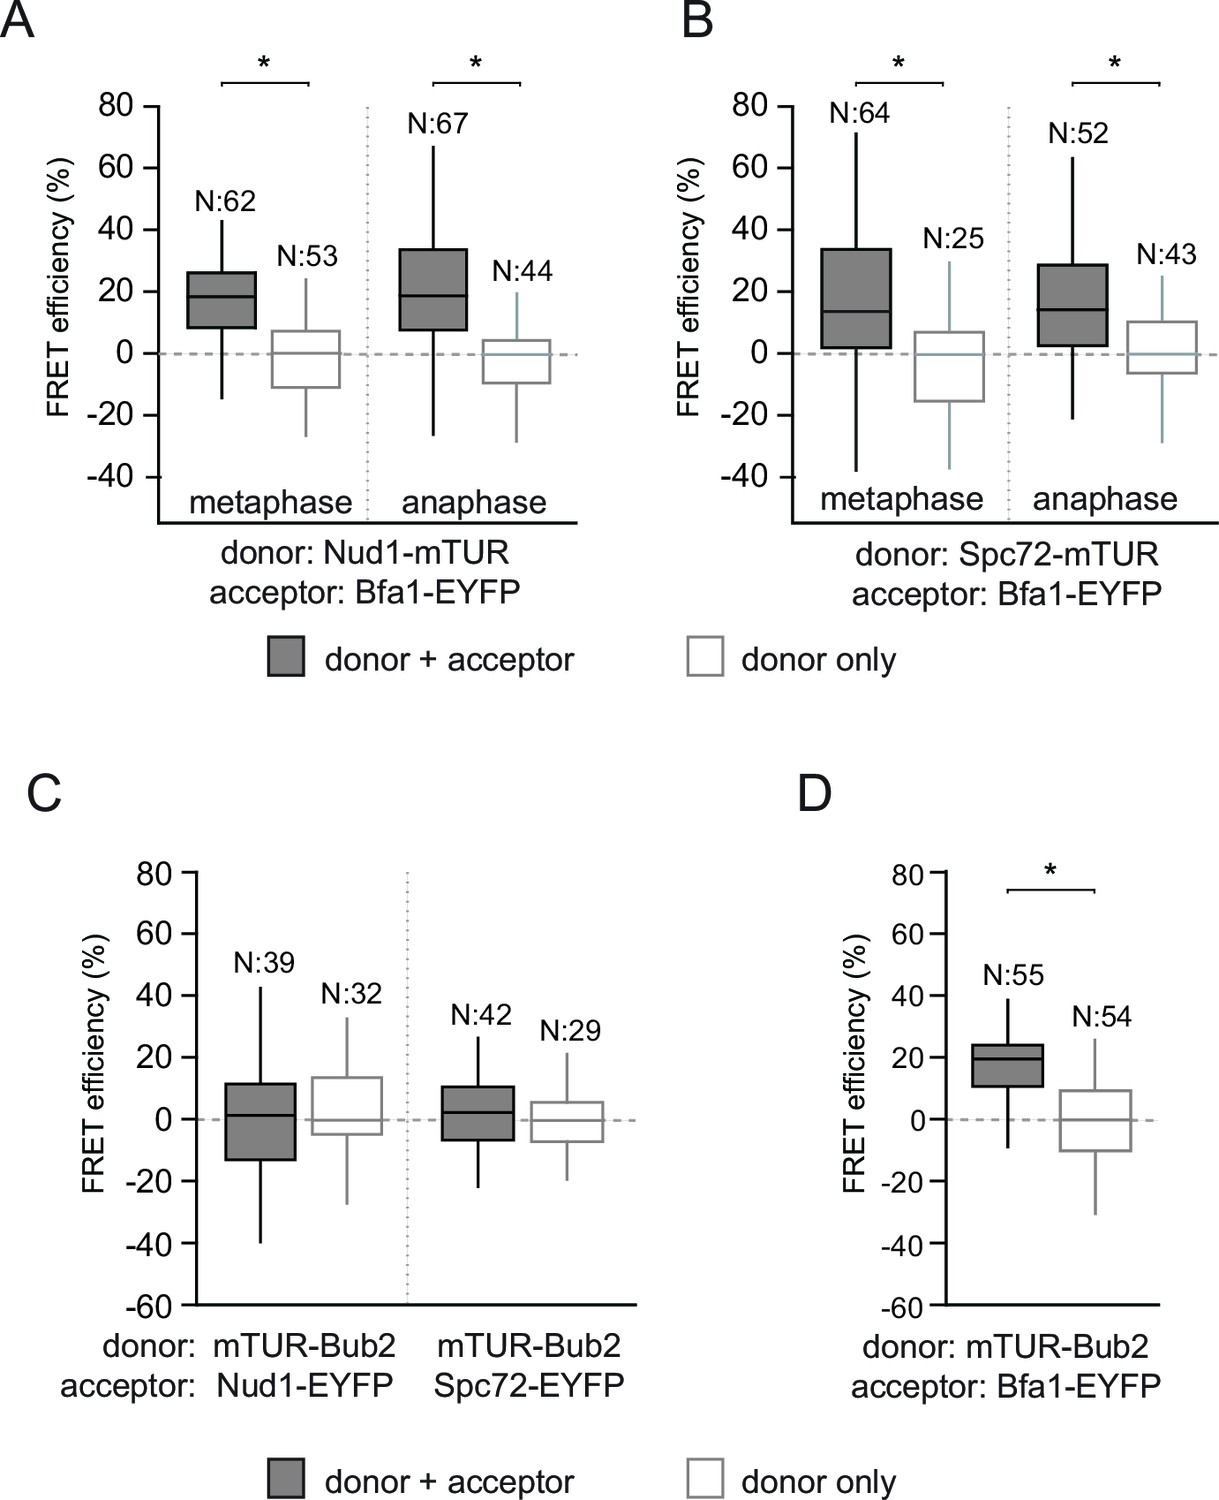
SPOC activation interferes with Bfa1-Spc72 interaction.
(A–B) FRET efficiencies for Nud1-Bfa1 (A) and Spc72-Bfa1 (B) pairs. Cells were arrested in anaphase by clb2△DB overexpression (Gal1-clb2△DB) or by KIN4 overexpression (Gal1-KIN4). (C–D) FRET efficiencies for Spc72-Bfa1 (C) and Nud1-Bfa1 (D) pairs in Gal1-KIN4 (please note that the data for Gal1-KIN4 cells is identical to Figure 3A), Gal1-KIN4 bmh1∆ and bmh1∆ cells grown in galactose medium. (E–F) FRET efficiencies for Nud1-Bfa1 (E) and Spc72-Bfa1 (F) pairs in kar9Δ cells with correct and mis-aligned spindles. (G–H) FRET efficiencies of Nud1-Bfa1 (G) and Spc72-Bfa1 (H) pairs in kar9Δ kin4∆ cells with correct and mis-aligned spindles. Box-whisker plots in G and H are one out of two technical replicates from the same experiment. N: sample size. Asterisks show significant difference according to student’s t-test (p<0.01). See the accompanying data files for exact p-values (Figure 3—source data 1–8).
-
Figure 3—source data 1
Raw data and the calculated FRET efficiencies of Nud1-Bfa1 and Spc72-Bfa1 pairs at SPBs upon KIN4 overexpression (source data for Figure 3A).
- https://doi.org/10.7554/eLife.14029.019
-
Figure 3—source data 2
Raw data and the calculated FRET efficiencies of the Spc72-Bfa1 pair at SPBs upon KIN4 overexpression, and CDC20 depletion (source data for Figure 3B).
- https://doi.org/10.7554/eLife.14029.020
-
Figure 3—source data 3
Raw data and the calculated FRET efficiencies of the Spc72-Bfa1 pair in the presence and absence of BMH1 (source data for Figure 3C).
- https://doi.org/10.7554/eLife.14029.021
-
Figure 3—source data 4
Raw data and the calculated FRET efficiencies of the Nud1-Bfa1 pair in the presence and absence of BMH1 (source data for Figure 3D).
- https://doi.org/10.7554/eLife.14029.022
-
Figure 3—source data 5
Raw data and the calculated FRET efficiencies of the Nud1-Bfa1 pair in kar9∆ cells with normally aligned or misaligned spindles (source data for Figure 3E).
- https://doi.org/10.7554/eLife.14029.023
-
Figure 3—source data 6
Raw data and the calculated FRET efficiencies of the Spc72-Bfa1 pair in kar9∆ cells with normally aligned or misaligned spindles (source data for Figure 3F).
- https://doi.org/10.7554/eLife.14029.024
-
Figure 3—source data 7
Raw data and the calculated FRET efficiencies of the Nud1-Bfa1 pair in kar9∆ kin4∆ cells with normally aligned or misaligned spindles (source data for Figure 3G).
- https://doi.org/10.7554/eLife.14029.025
-
Figure 3—source data 8
Raw data and the calculated FRET efficiencies of the Spc72-Bfa1 pair in kar9∆ kin4∆ cells with normally aligned or misaligned spindles (source data for Figure 3H).
- https://doi.org/10.7554/eLife.14029.026
Figure 3—figure supplement 1
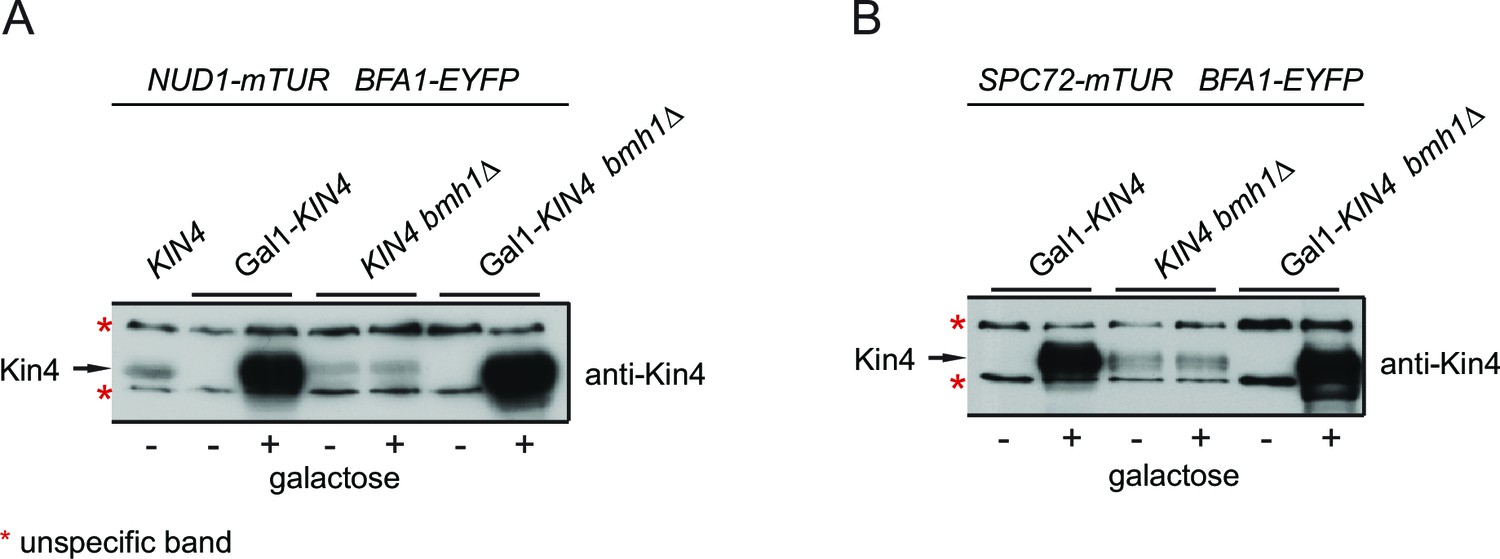
Controls for Kin4 overproducing cells used in FRET experiments.
KIN4 expression levels in samples used for the FRET analysis shown in Figure 3A–D. Total cell lysates from the indicated strains grown in the presence (+) or in the absence of galactose (-). Kin4 levels were detected using anti-Kin4 antibody.
Figure 4
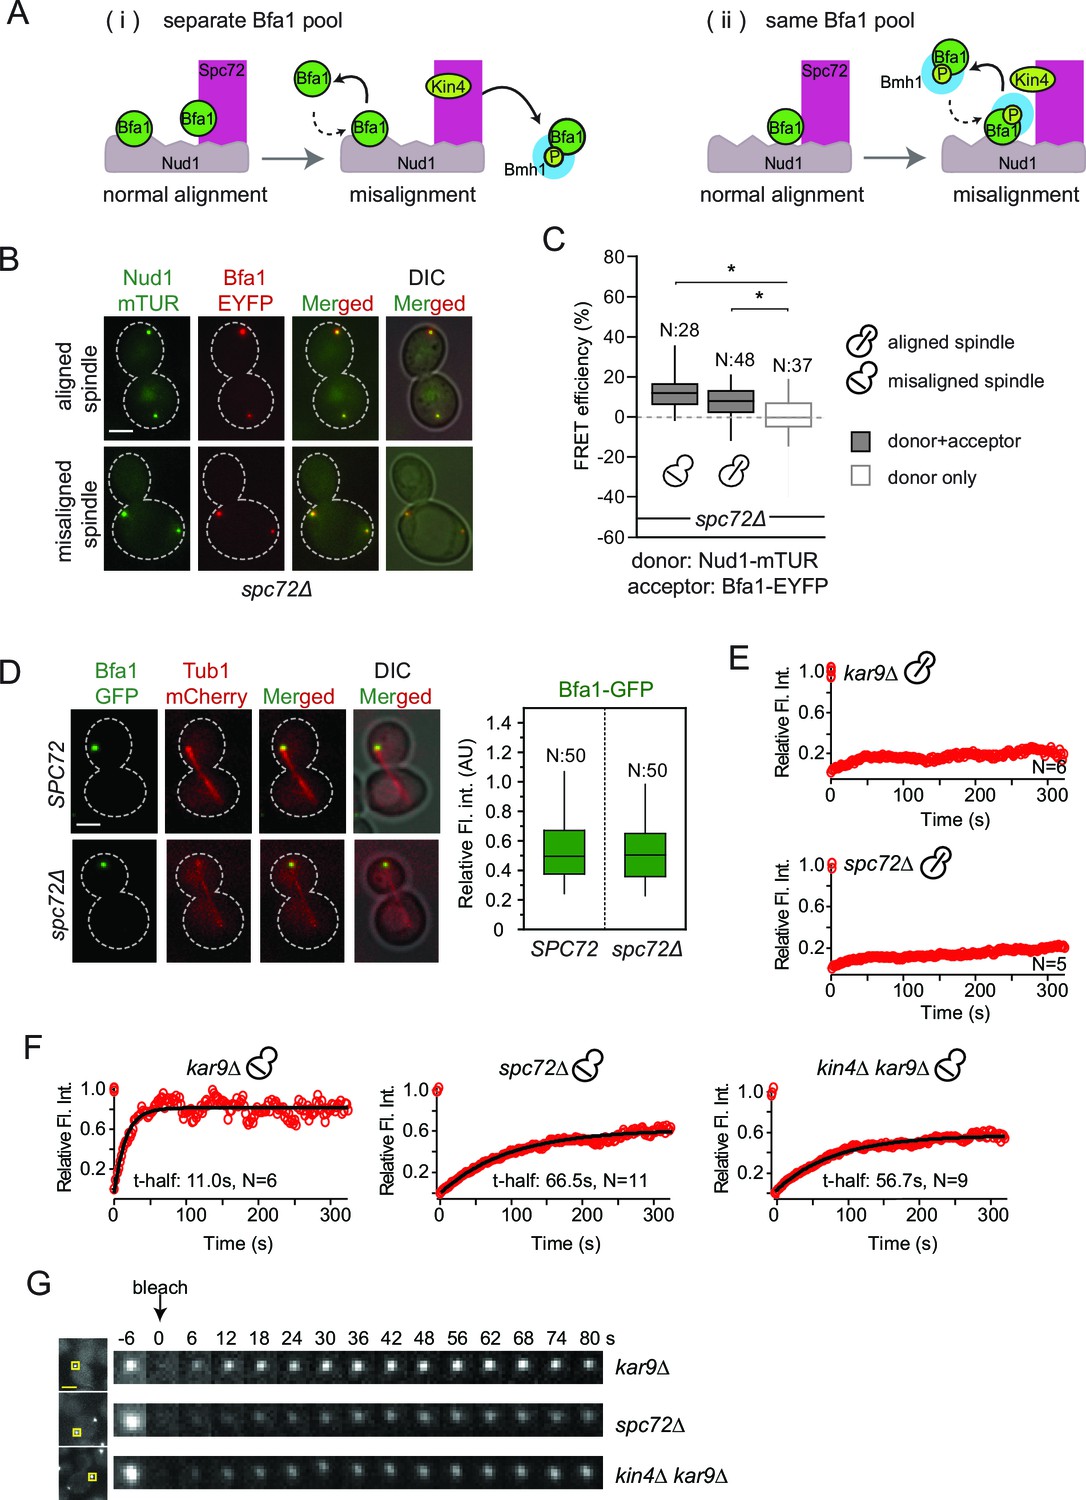
Bfa1-SPB binding dynamics in the absence of Spc72.
(A) Schematic representation of two possible mechanisms for Bfa1 binding at the SPB. i: Bfa1 is recruited as two separate pools. ii: Bfa1 associates simultaneously with Nud1 and Spc72. Dashed arrows indicate dynamic binding. (B–C) Representative still images and FRET efficiencies for spc72Δ NUD1-mTUR BFA1-EYFP cells with aligned and misaligned spindle. Box-whisker plot is one out of two technical replicates from the same experiment. N: sample size. Asterisks show significant difference according to student’s t-test (p<0.01). See the accompanying data file for exact p-values (Figure 4—source data 1). (D) Representative still images and mean fluorescence intensities of Bfa1-GFP localized at the dSPB during anaphase in SPC72 (pRS-SPC72 spc72Δ) and spc72Δ cells carrying mCherry-TUB1. Box-whisker plot is one out of two technical replicates from the same experiment. See the source file (Figure 4—source data 2) for the raw data. (E-F) FRAP analysis of Bfa1-GFP at the SPBs in cells with correctly aligned (E) and misaligned spindles (F). The black line depicts the best-fit single exponential curve for each data set. Data represent the mean of “N” sized sample. t-half: half recovery time. The graphs show the average fluorescence recovery curves for the corresponding strains. See the accompanying data file for individual curves and raw data (Figure 4—source data 3 and 4). Data represented in E is one out of two biological replicates. Data for spc72∆ in F is one out of two biological replicates. Data for kar9∆ and kin4∆ kar9∆ comes from one experiment, whose results are in concordance with published data (Caydasi et al., 2014; Caydasi and Pereira, 2009). (G) Representative still images of (F). Photobleached SPB is marked with squares. Time-lapse series show 3-fold enlarged photobleached regions at the indicated time points. Time zero is the first image taken after photobleaching. Scale bar: 3 μm.
-
Figure 4—source data 1
Raw data and the calculated FRET efficiencies of the Nud1-Bfa1 pair in spc72∆ cells with normally aligned or misaligned spindles (source data for Figure 4C).
- https://doi.org/10.7554/eLife.14029.029
-
Figure 4—source data 2
Raw and normalized mean fluorescence intensities of Bfa1-GFP at SPBs of spc72∆ and SPC72 cells (source data for Figure 4D).
- https://doi.org/10.7554/eLife.14029.030
-
Figure 4—source data 3
Raw and normalized FRAP data of Bfa1-GFP at the SPBs of spc72∆ and kar9∆ cells with normally aligned spindles.
FRAP curves for individual cells are also presented (source data for Figure 4E).
- https://doi.org/10.7554/eLife.14029.031
-
Figure 4—source data 4
Raw and normalized FRAP data of Bfa1-GFP at the SPBs of spc72∆ and kar9∆ cells with misaligned spindles.
FRAP curves for individual cells are also presented (source data for Figure 4F).
- https://doi.org/10.7554/eLife.14029.032
Figure 5
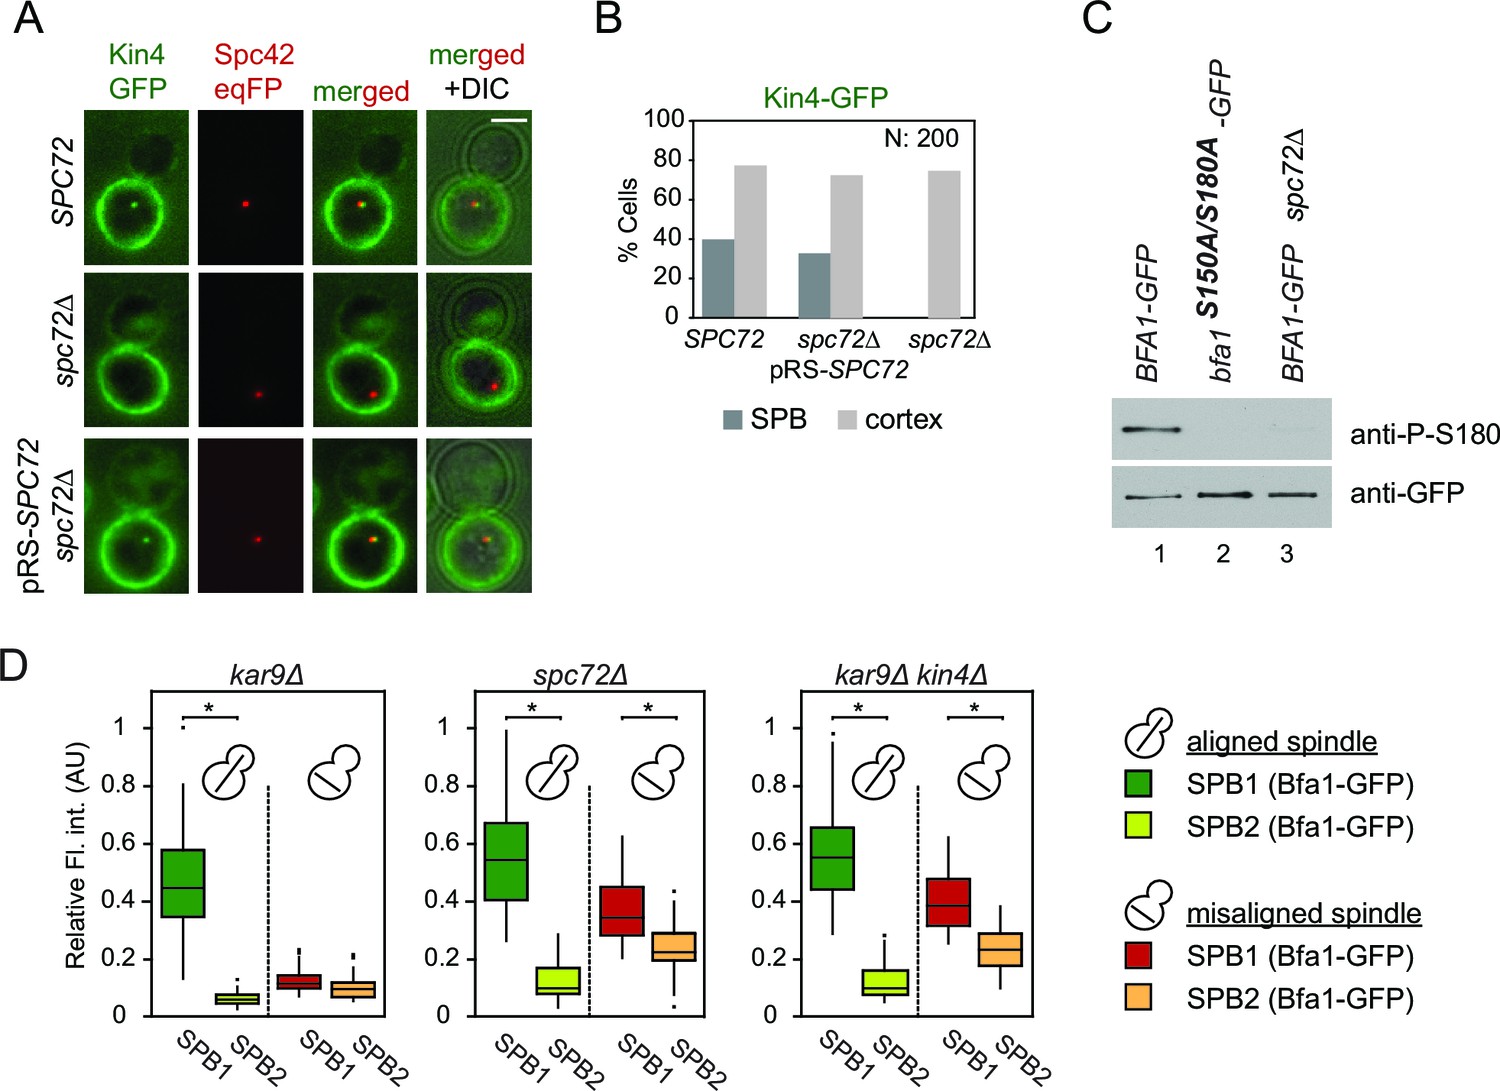
Lack of Spc72 interferes with Kin4 localization and functioning at the SPB.
(A) SPB localization of Kin4-GFP in SPC72 (pRS-SPC72 spc72∆) and spc72∆ cells carrying the SPB marker SPC42-eqFP. Cells were arrested in metaphase with nocodazole. (B) Quantification of (A). (C) Immunoblots showing Bfa1 phosphorylation by Kin4 at S180 residue. Bfa1-GFP was immunoprecipitated from indicated strains. Total amount of immunoprecipitated Bfa1-GFP and Bfa1-GFP that is phosphorylated at S180 were detected by anti-GFP and anti-P-S180 antibodies respectively. Bfa1S180A/S150A served as a control for the specificity of anti-P-S180 antibody. A representative blot out of three independent experiments is shown. (D) Box and Whisker plots of Bfa1-GFP fluorescence intensity at SPBs in kar9Δ, spc72Δ and kar9Δ kin4Δ cells with correctly and mis-aligned spindles. Within the same cell, the SPB with stronger and weaker Bfa1 fluorescence intensity were classified as SPB1 and SPB2, respectively. The maximum Bfa1-GFP fluorescence intensity of each data set was normalized to 1. The boxes show the lower and upper quartiles, the whiskers show the minimum and maximal values excluding outliers; outliers (shown as dots) were calculated as values greater or lower than 1.5 times the interquartile range; the line inside the box indicates the median. For each box, 33 SPBs were quantified. Asterisks show significant difference according to student’s t-test (p<0.01). See the accompanying data file for exact p-values (Figure 5—source data 1).
-
Figure 5—source data 1
Raw and normalized mean fluorescence intensities of Bfa1-GFP at SPBs of spc72∆ and kar9∆ cells with normally aligned or misaligned spindles (source data for Figure 5D).
- https://doi.org/10.7554/eLife.14029.034
Figure 6 with 1 supplement
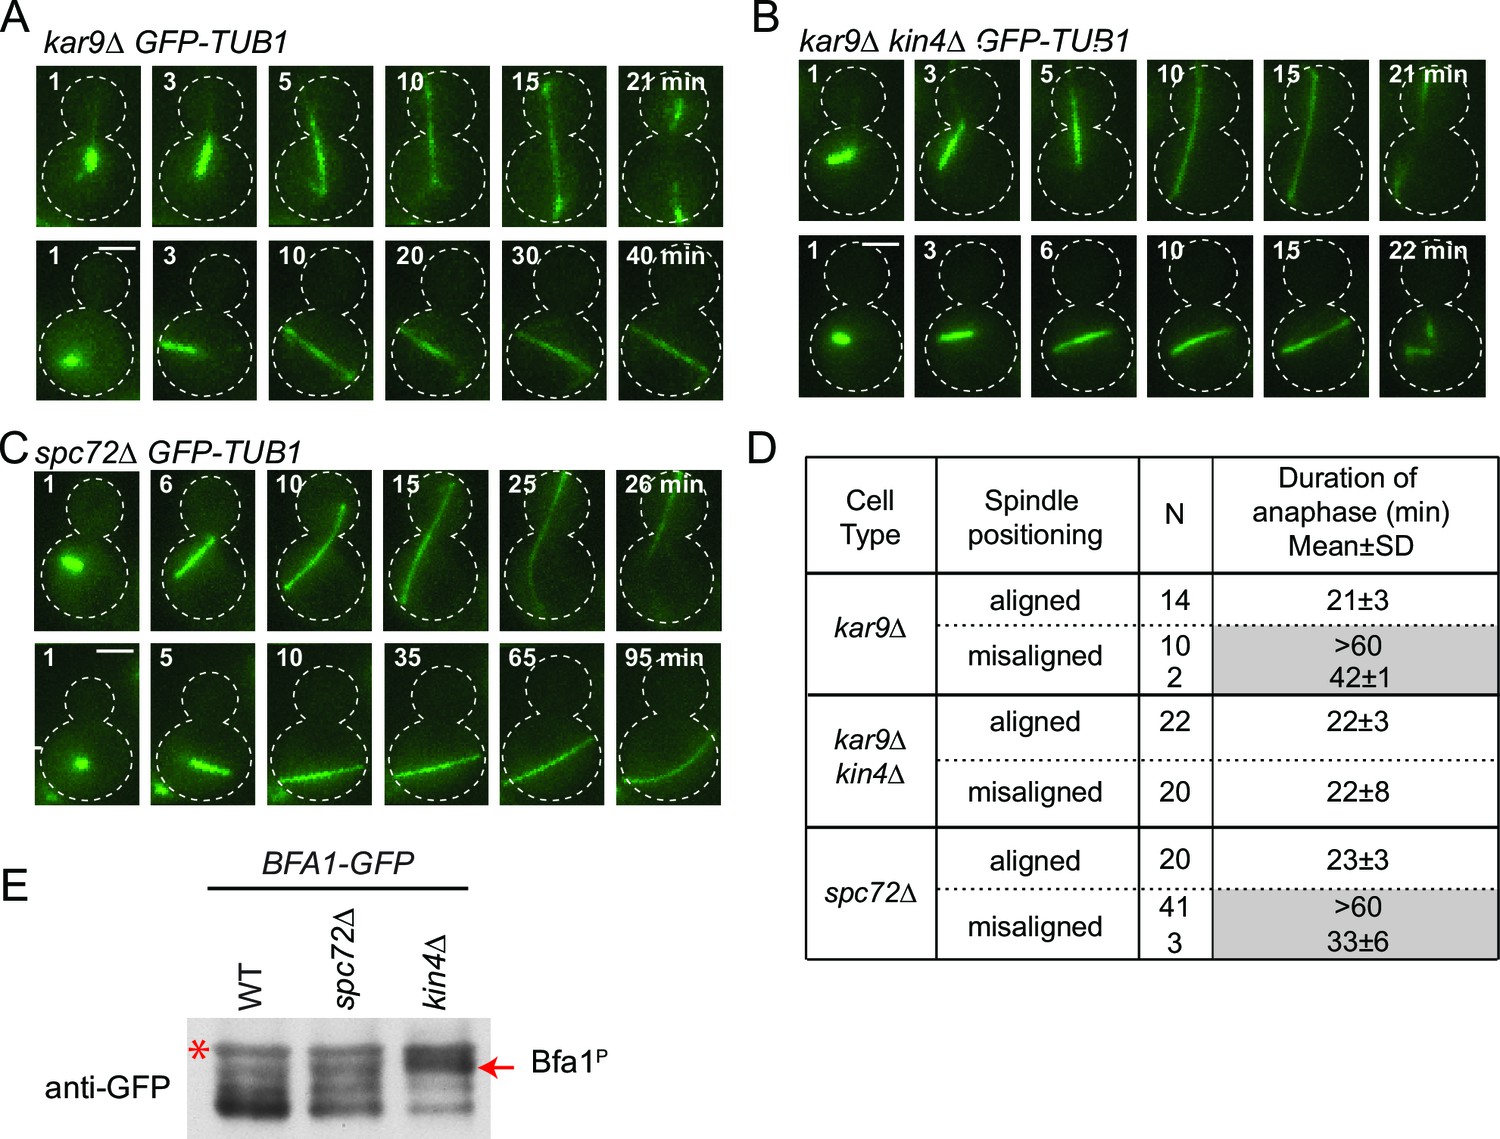
spc72∆ cells are SPOC proficient (A–C) Representative time-lapse images of kar9Δ (A), kar9Δ kin4Δ (B) and spc72Δ (C) cells carrying GFP-TUB1.
Time is given in minutes from the start of the inspection. Scale bar 3 µm. (D) Comparison of anaphase duration in kar9Δ, kar9Δ kin4Δ and spc72Δ cells with aligned and misaligned spindles. N: number of cells observed from each category. Mean anaphase duration is given in minutes. SD: Standard deviation. (E) Immunoblot showing Bfa1 mobility shift. Indicated strains were released from G1-block (alpha-factor arrest) in nocodazole containing medium. Samples were collected after 3 hr. Bfa1-GFP was detected in the total cell extracts of indicated strains using anti-GFP antibody. The arrow indicates the hyper-phosphorylated form of Bfa1. Asterisks indicate an unspecific band detected by the anti-GFP antibody. A representative blot out of three independent experiments is shown.
Figure 6—figure supplement 1
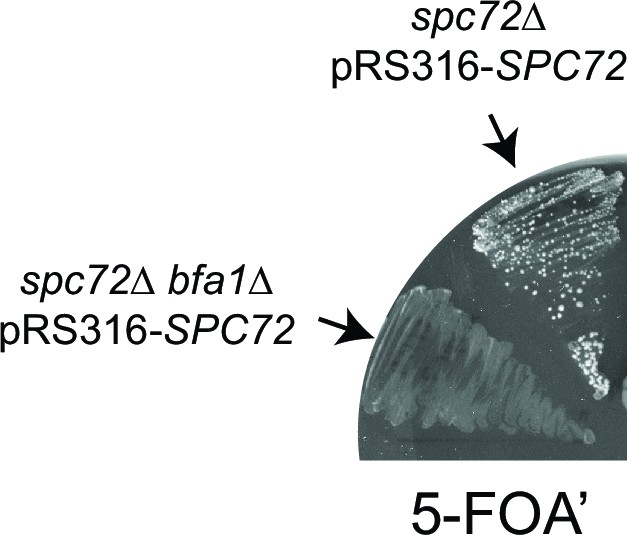
Effect of Bfa1 on the growth of spc72∆ cells.
spc72∆ pRS316-SPC72 and spc72∆ bfa1∆ pRS316-SPC72 cells were patched on 5-FOA’ containing plates to allow selection of cells that lost the URA3-based plasmid carrying wild type SPC72 (pRS316-SPC72).
Figure 7
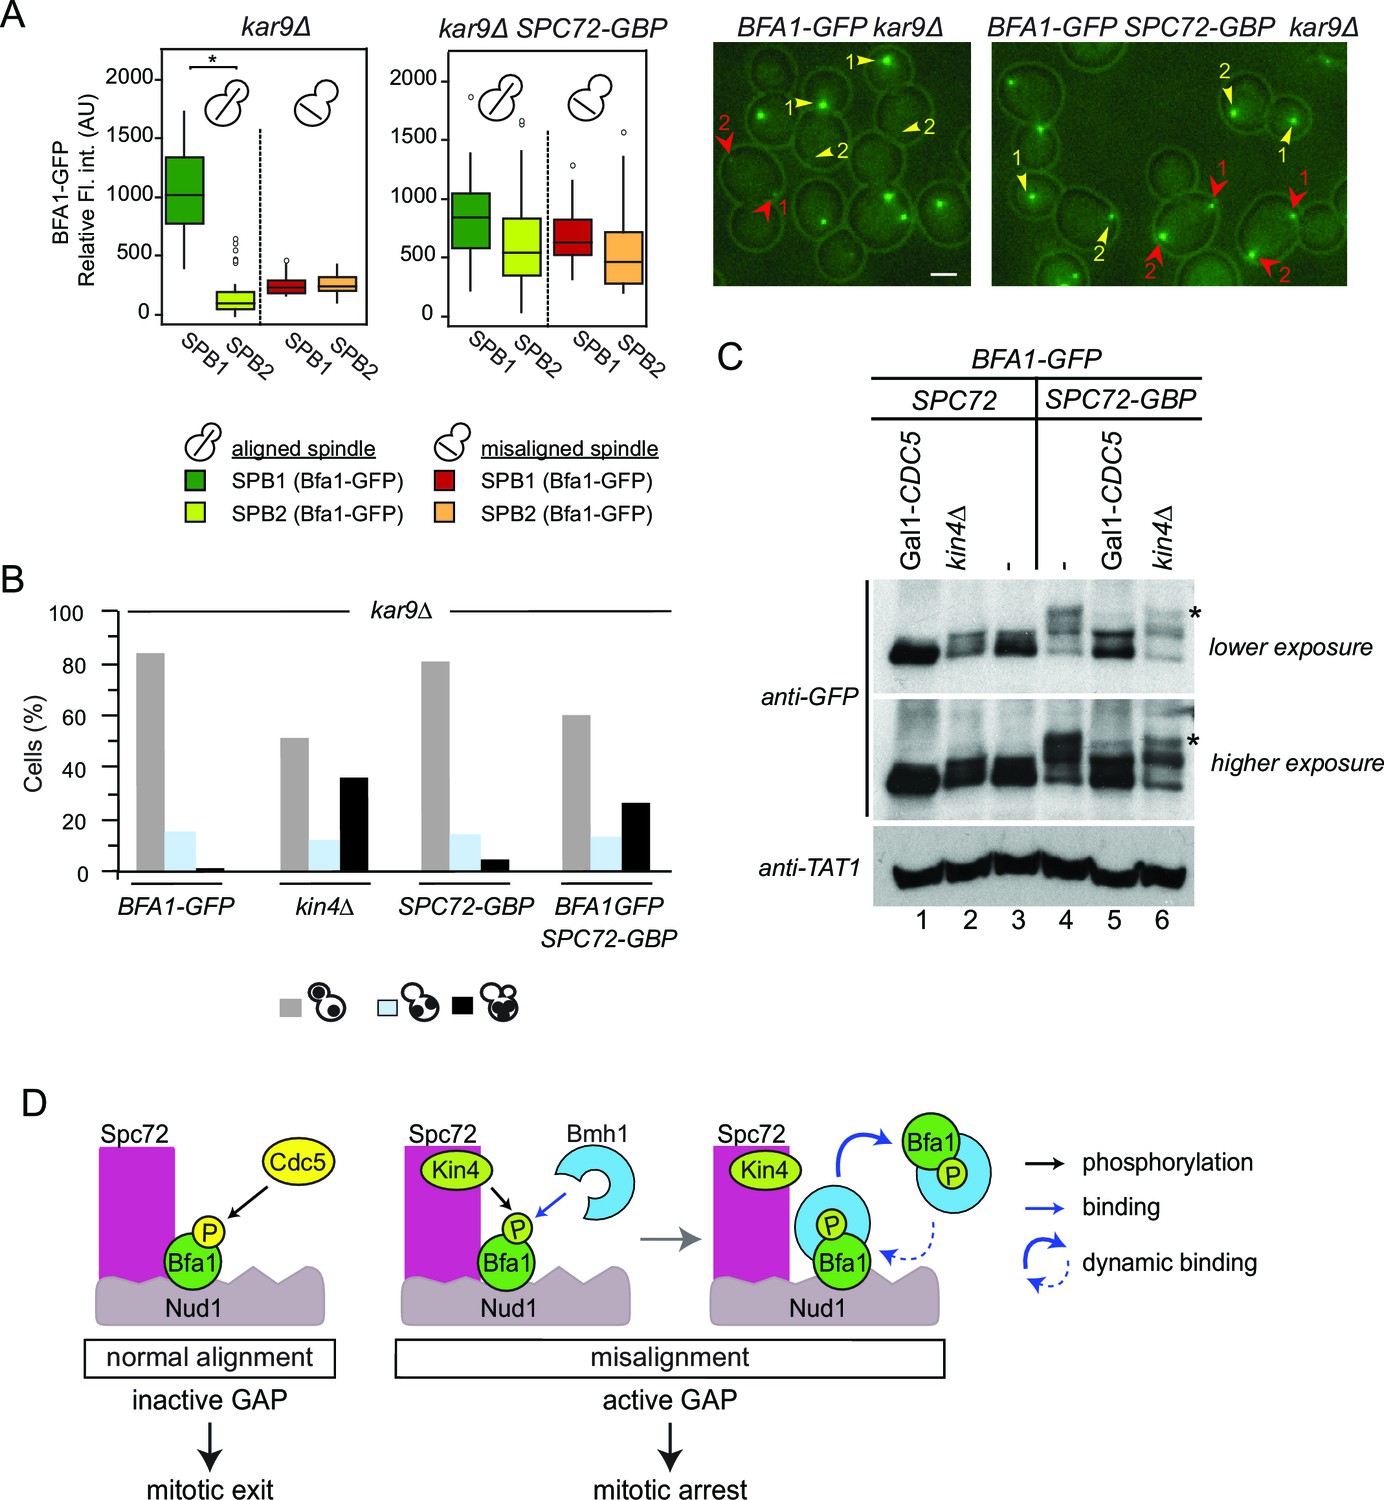
Bfa1-Spc72 interaction provokes Cdc5 phosphorylation of Bfa1 (A) Still images (right) and the SPB-bound mean fluorescence intensities (left) of Bfa1-GFP in kar9∆ and SPC72-GBP kar9∆ cells.
SPB1 indicates the SPB closer to bud where SPB2 is the SPB closer to the mother cell compartment. Yellow or red arrows point the two SPBs in a cell with a normally aligned or misaligned spindle respectively. The numbers 1 and 2 next to the arrows indicate SPB1 and SPB2 respectively. Scale bar: 3 µm. In the Box-Whisker plots showing Bfa1-GFP mean fluorescence intensities, the boxes show the lower and upper quartiles, the whiskers show the minimum and maximal values excluding outliers; circles represent the outliers calculated as values greater or lower than 1.5 times the interquartile range; the line inside the box indicates the median. Asterisks show significant difference according to student’s t-test (p<0.001). Sample sizes for kar9∆ cells were 49 and 23, whereas sample sizes for kar9∆ SPC72-GBP cells were 38 and 14 for each SPB with normal and misaligned spindles respectively. See the accompanying data file for exact p-values (Figure 7—source data 1). (B) SPOC integrity of the indicated cell types. Cells were grown at 23°C and shifted to 30°C for 3 hr to induce the accumulation of cells with misaligned spindles (blue bars). Black bars show the percentage of multi-nucleated phenotypes, which indicates SPOC deficiency N: 100 cells per strain. A representative plot out of three biological replicates is shown. (C) Immunoblot showing Bfa1-GFP mobility shift. Indicated strains arrested in G1 using alpha-factor and released in alpha-factor free, nocodazole containing YPDA medium. Samples were collected after 2.5 hr. Gal1-CDC5 bearing strains were grown and G1-arrested in raffinose and galactose containing medium. Releasing from G1 block in glucose containing medium repressed the Gal1 promoter to maintain Cdc5 depletion. Bfa1-GFP was detected in the total cell extracts of the indicated strains using anti-GFP antibody. Anti-TAT1 antibody was used to detect tubulin as a loading control. Asterisks indicate the hyper-phosphorylated form of Bfa1. A representative blot out of three independent experiments is shown. (D) Model for SPOC activation and Bfa1-SPB remodeling. When the mitotic spindle is correctly aligned, Bfa1 molecules are stably in contact with Nud1 and Spc72, where Cdc5 can phosphorylate and thereby inactivate Bfa1. When the spindle misaligns, Kin4 binds to Spc72 to phosphorylate Bfa1 (Maekawa et al., 2007). Kin4 phosphorylated Bfa1 is recognized by Bmh1 (Caydasi et al., 2014). Bmh1-bound Bfa1 disconnects from Spc72 but remains associated with Nud1, although dynamically. Cdc5 cannot phosphorylate Bfa1 when Bfa1 is disconnected from Spc72.
-
Figure 7—source data 1
Raw and normalized mean fluorescence intensities of Bfa1-GFP at SPBs of SPC72 kar9∆ and SPC72-GBP kar9∆ cells with normally aligned or misaligned spindles (source data for Figure 7A).
- https://doi.org/10.7554/eLife.14029.038
Figure 8
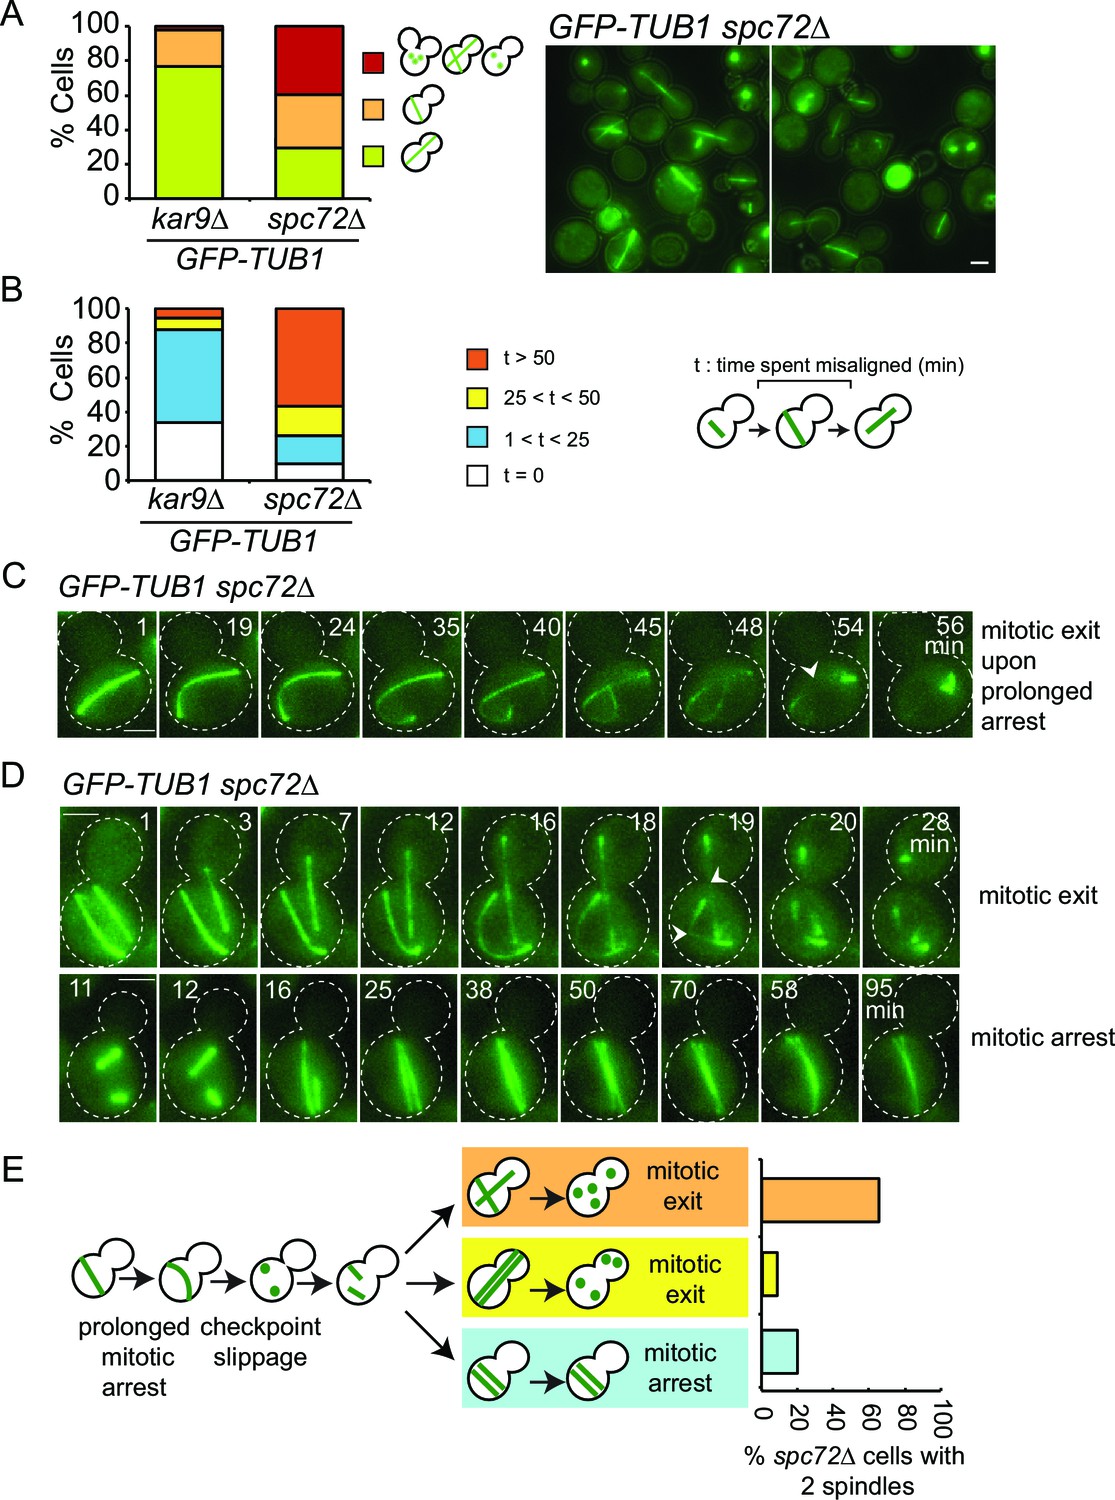
SPOC slippage in spc72∆ cells (A) Population analysis of GFP-TUB1 kar9∆ and GFP-TUB1 spc72∆ cells.
Percentage of cells with single or multiple spindles is indicated in the left panel. Representative images of GFP-TUB1 spc72∆ cells are shown in the right panel. Fixed samples were used for analysis (N>100). Note that the presence of more than one GFP-TUB1 signal in cells is an indication of multiple nuclei. (B) Duration of spindle misalignment in kar9∆ GFP-TUB1 and spc72∆ GFP-TUB1 cells. Time-lapse series were used for analysis (N: 99 for kar9∆, N: 54 for spc72∆). The time elapsed between the anaphase onset and spindle orientation in the mother to daughter direction was recorded as the time spent misaligned (t). T=0 indicates that no spindle misalignment was observed in anaphase. (C) Representative images from time-lapse series of a GFP-TUB1 spc72∆ cell with a mis-aligned spindle that exited mitosis after prolonged arrest. Time point one (min) is the first time point after the start of the time-lapse. Please note that the cell depicted here had a misaligned anaphase spindle already at time point one. Spindle breakdown (t=54) is an indication of mitotic exit. (D) Representative images from time-lapse series of GFP-TUB1 spc72∆ cells with two spindles. In the upper panel, one spindle stays misaligned while the other one re-aligns in the mother-daughter direction. In this cell, both spindles broke at t=19, indicating mitotic exit. In the lower panel, both spindles stay misaligned during the course of the experiment. Mitotic exit was not observed in this cell. (E) Diagram depicting the fate of an spc72∆ cell with a misaligned spindle. Upon prolonged spindle misalignment, mitotic exit occurs (checkpoint slippage). The binucleated cell enters a second cell cycle with two nuclei, each forming a spindle. The two spindles could both misalign (lower panel) or correctly align (middle panel). These two events are rare (graph in the right panel). Alternatively, one of the two spindles could stay misaligned while the other is correctly aligned (upper panel). This occurs more frequently (graph in the right panel). The frequencies of each three scenarios plotted on the right were calculated based on time-lapse analysis of GFP-TUB1 spc72∆ cells (N: 15 cells). Arrowheads indicate the point of spindle breakage. Scale bar: 3 µm. Data represented is a collection of two independent experiments.
Additional files
-
Supplementary file 1
Table of yeast strains and plasmids.
Descriptions of the yeast strains and plasmids used in this study are listed in this file.
- https://doi.org/10.7554/eLife.14029.040
Download links
A two-part list of links to download the article, or parts of the article, in various formats.
Downloads (link to download the article as PDF)
Open citations (links to open the citations from this article in various online reference manager services)
Cite this article (links to download the citations from this article in formats compatible with various reference manager tools)
A FRET-based study reveals site-specific regulation of spindle position checkpoint proteins at yeast centrosomes
eLife 5:e14029.
https://doi.org/10.7554/eLife.14029


