Molecular basis for multimerization in the activation of the epidermal growth factor receptor
- University of California, Berkeley, United States
- Howard Hughes Medical Institute, University of California, Berkeley, United States
- University of Akron, United States
- Lawrence Berkeley National Laboratory, United States
- Helen Wills Neuroscience Institute, University of California, Berkeley, United States
Figures
Figure 1

Schematic diagrams of EGFR structure.
(A) The canonical model for the monomer to dimer transition in EGFR that is triggered by ligand binding (Kovacs et al., 2015a; Lemmon et al., 2014). (B) Domain boundaries in human EGFR. The residue numbers do not include the 24 residue signal sequence.
Figure 2
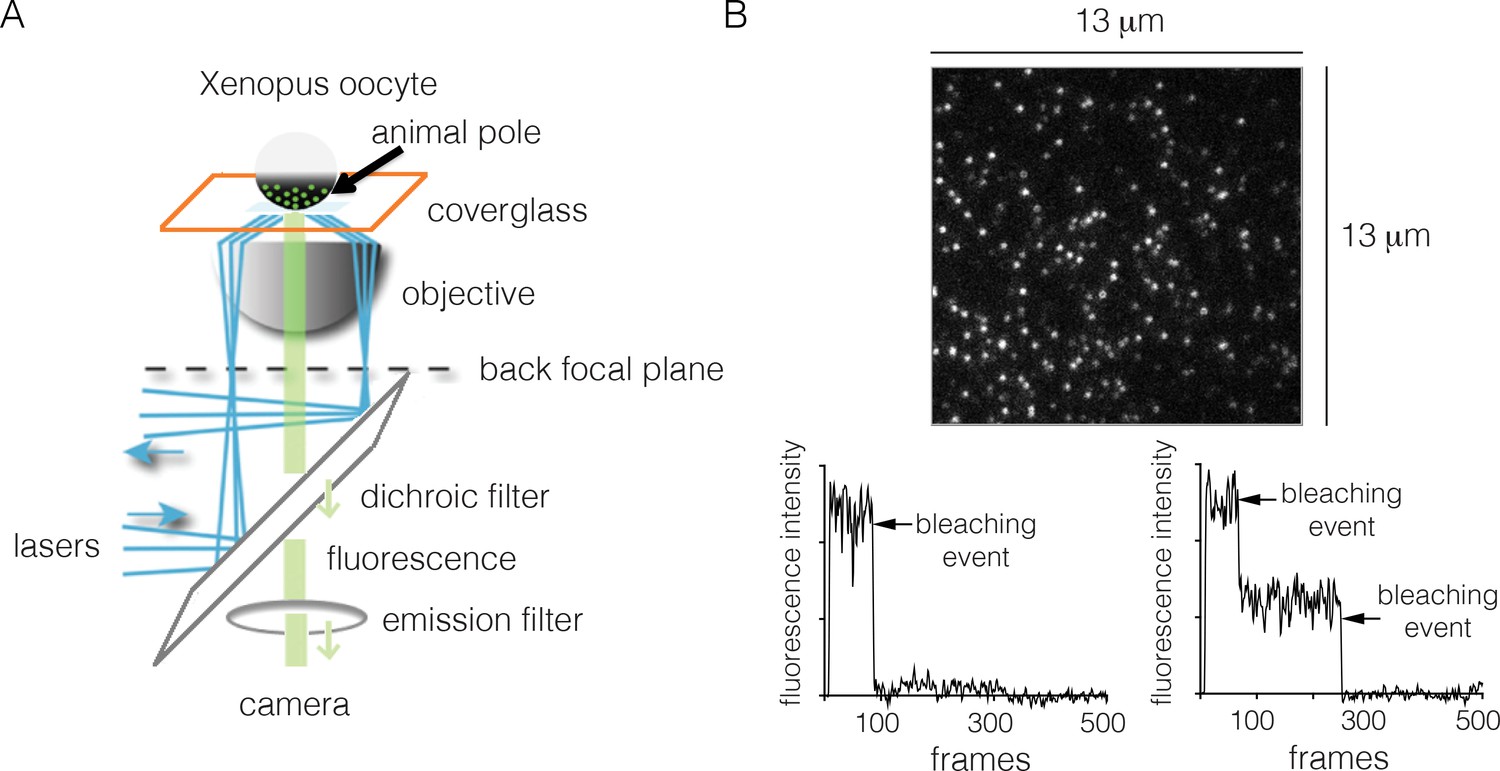
Monitoring the stoichiometry of human EGFR in Xenopus oocytes by photobleaching.
(A) Schematic diagram illustrating the analysis of transiently-transfected EGFR by TIRF microscopy. A single oocyte is placed on a glass coverslip for observation and evanescent wave excitation is elicited by total internal reflection of the laser beam. The bright spots represent fluorescence from the EGFP fused to the C-terminus of EGFR. (B) Representative photobleaching traces of individual spots for EGFR without EGF. Image above shows a single image from a movie of the field of view. The two graphs show examples of one-step (left) and two-step (right) photobleaching. Frames collected at 20 Hz over 25 s.
Figure 3
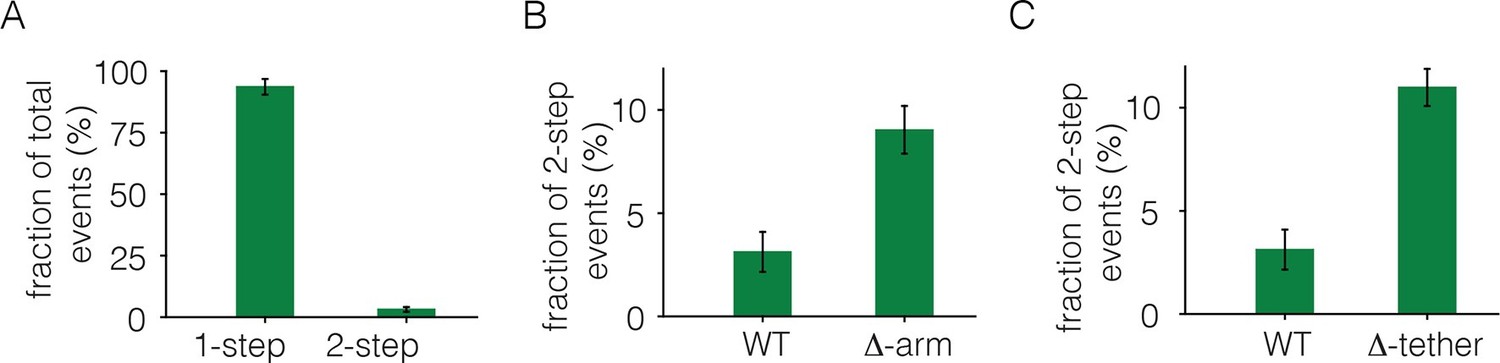
Analysis of photobleaching events for EGFR without EGF, in the Xenopus assay.
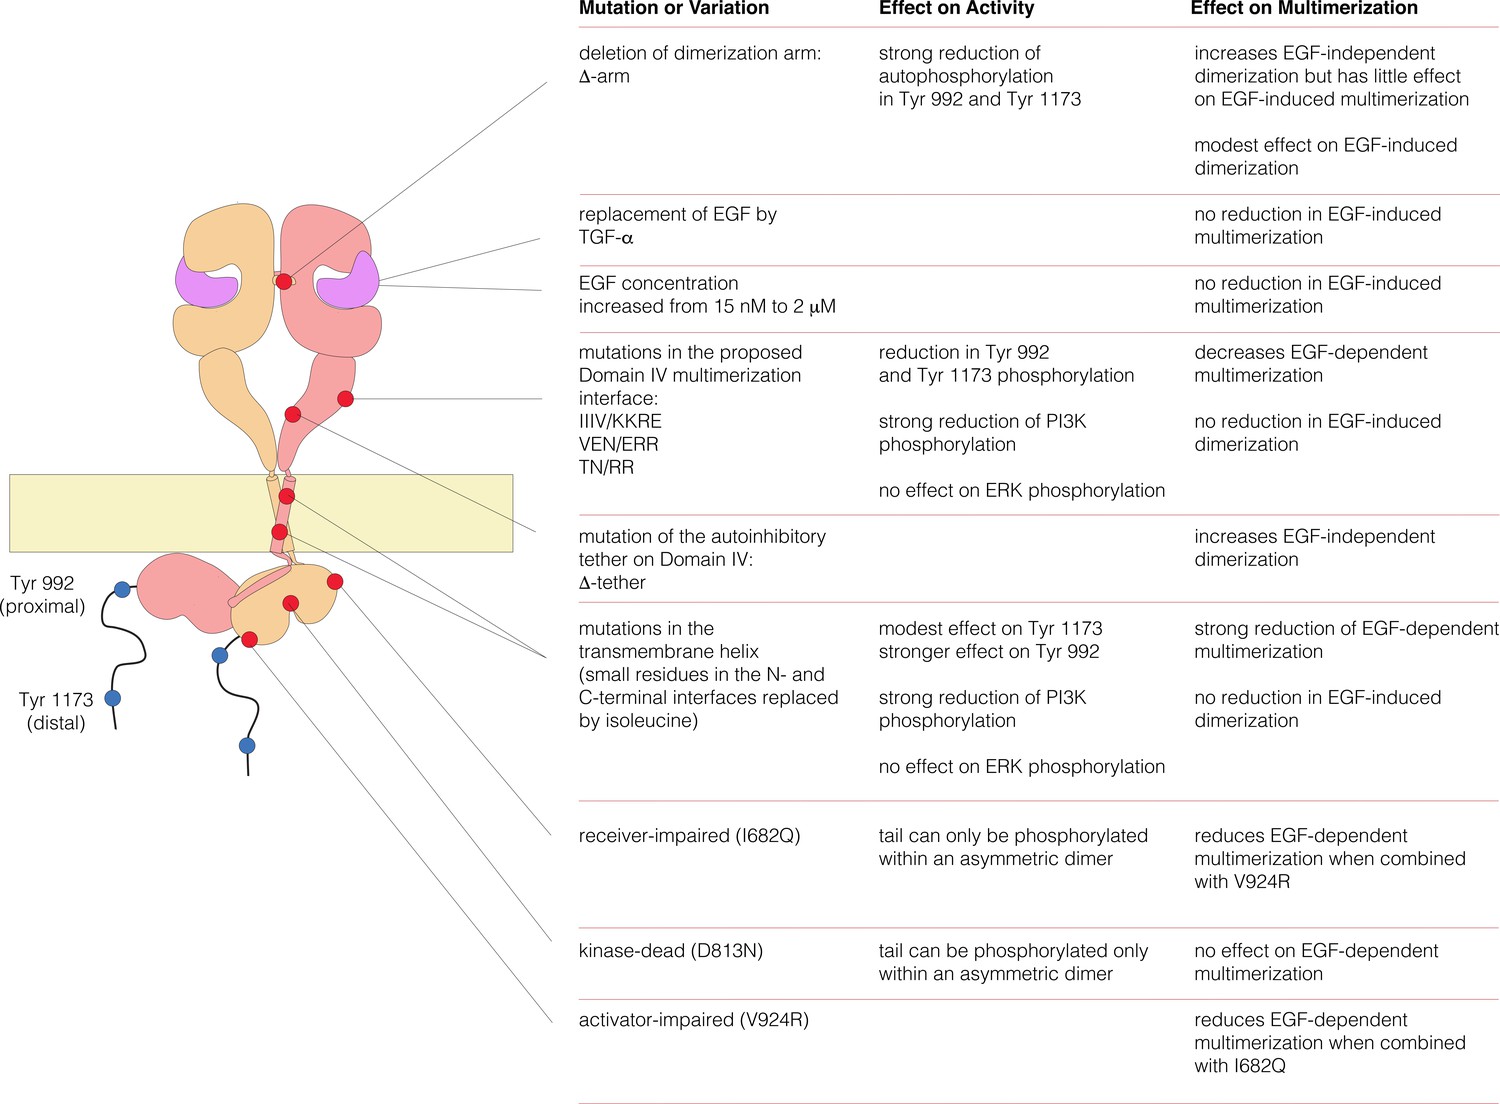
(A) Histogram of one-step and two-step photobleaching events for wild-type EGFR in the absence of EGF. This histogram represents the number of counted events. For subsequent analysis, the fraction of two-step events (3%) seen for a monomer control protein (Claudin-16) in a similar experiment at a comparable density was subtracted from the fraction of two-step events seen for EGFR and EGFR variants. The fraction of two-step photobleaching events for wild-type EGFR (WT) is compared to that for mutants. (B) Δ-arm, deletion of the dimerization arm, residues 242 to 259. (C) Δ-tether, mutation in Domain IV that breaks the autoinhibitory interaction, (D563A, H566A and deletion of residues 575 to 585).
Figure 4
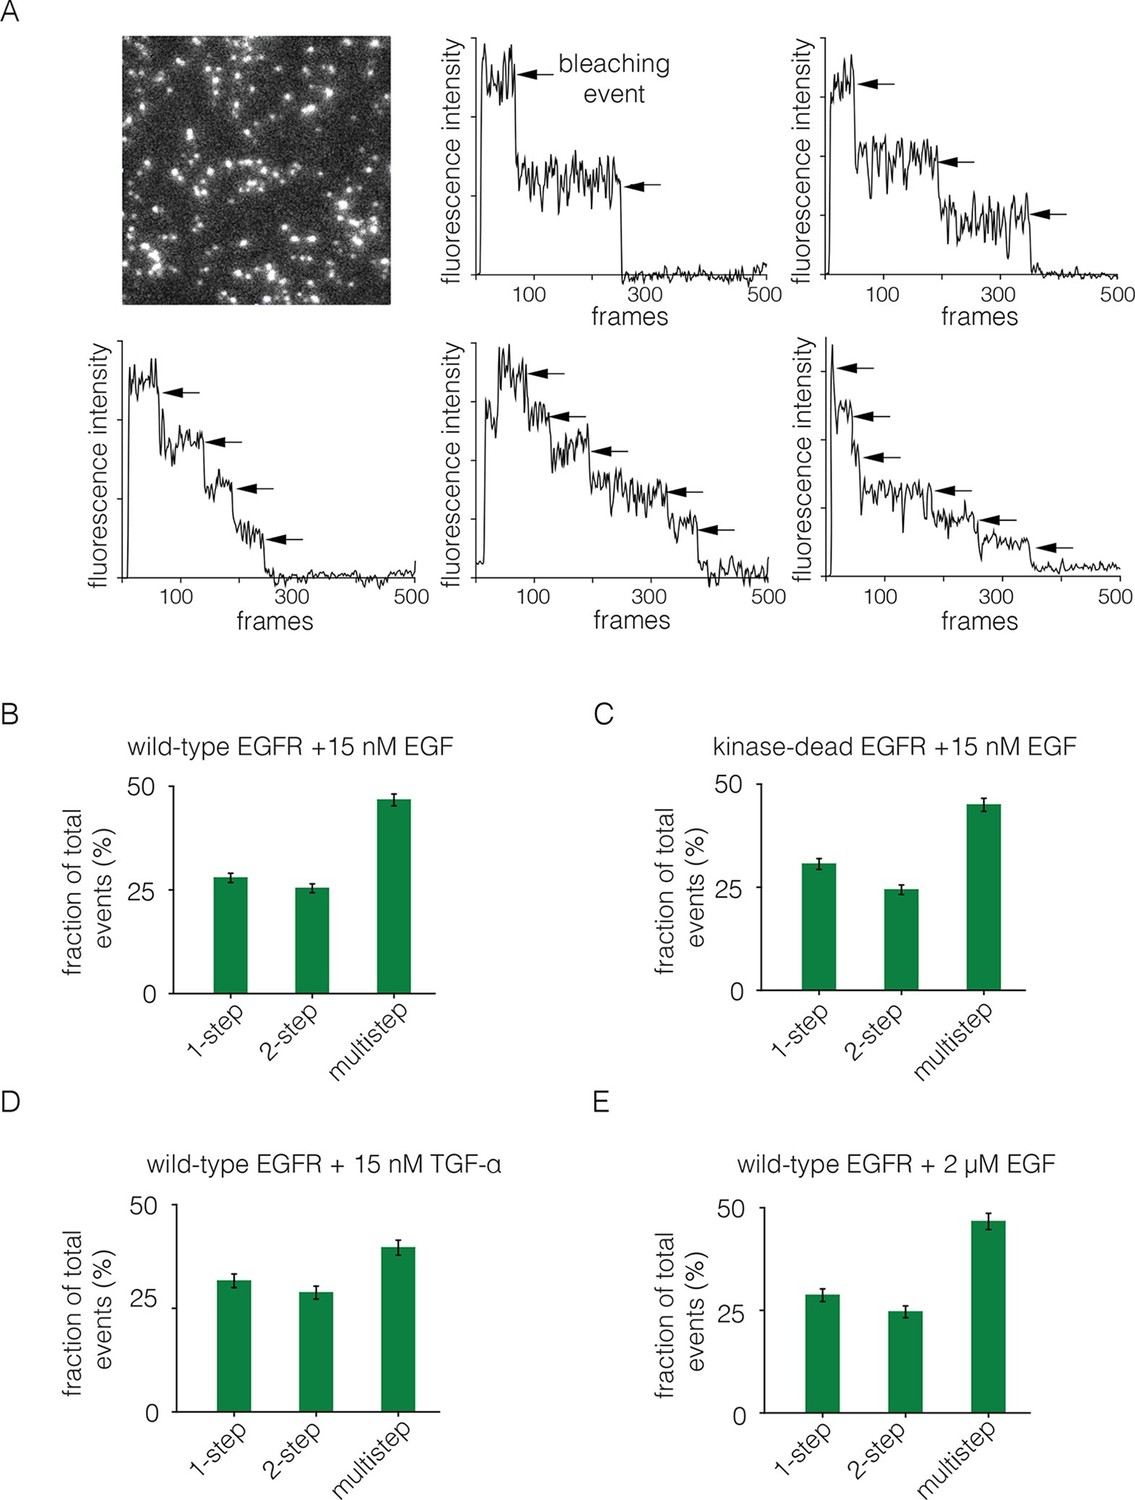
Analysis of photobleaching events for EGFR in the presence of EGF.
(A) TIRF image of a Xenopus oocyte expressing EGFR, 2 mins after addition of 15 nM EGF. Five representative photobleaching traces are shown, in which two to six photobleaching events can be identified. Traces with more than two steps are denoted 'multistep'. (B) Histogram showing the fraction of one-step, two-step and multistep photobleaching events for wild-type EGFR in the presence of 15 nM EGF. (C) As in B, for a kinase-dead mutant of EGFR (D813N). (D) As in B, for TGF-α as the ligand, at a concentration of 15 nM. (E) As in B, but for a 133-fold higher concentration of EGF (2 μM).
Figure 5 with 1 supplement
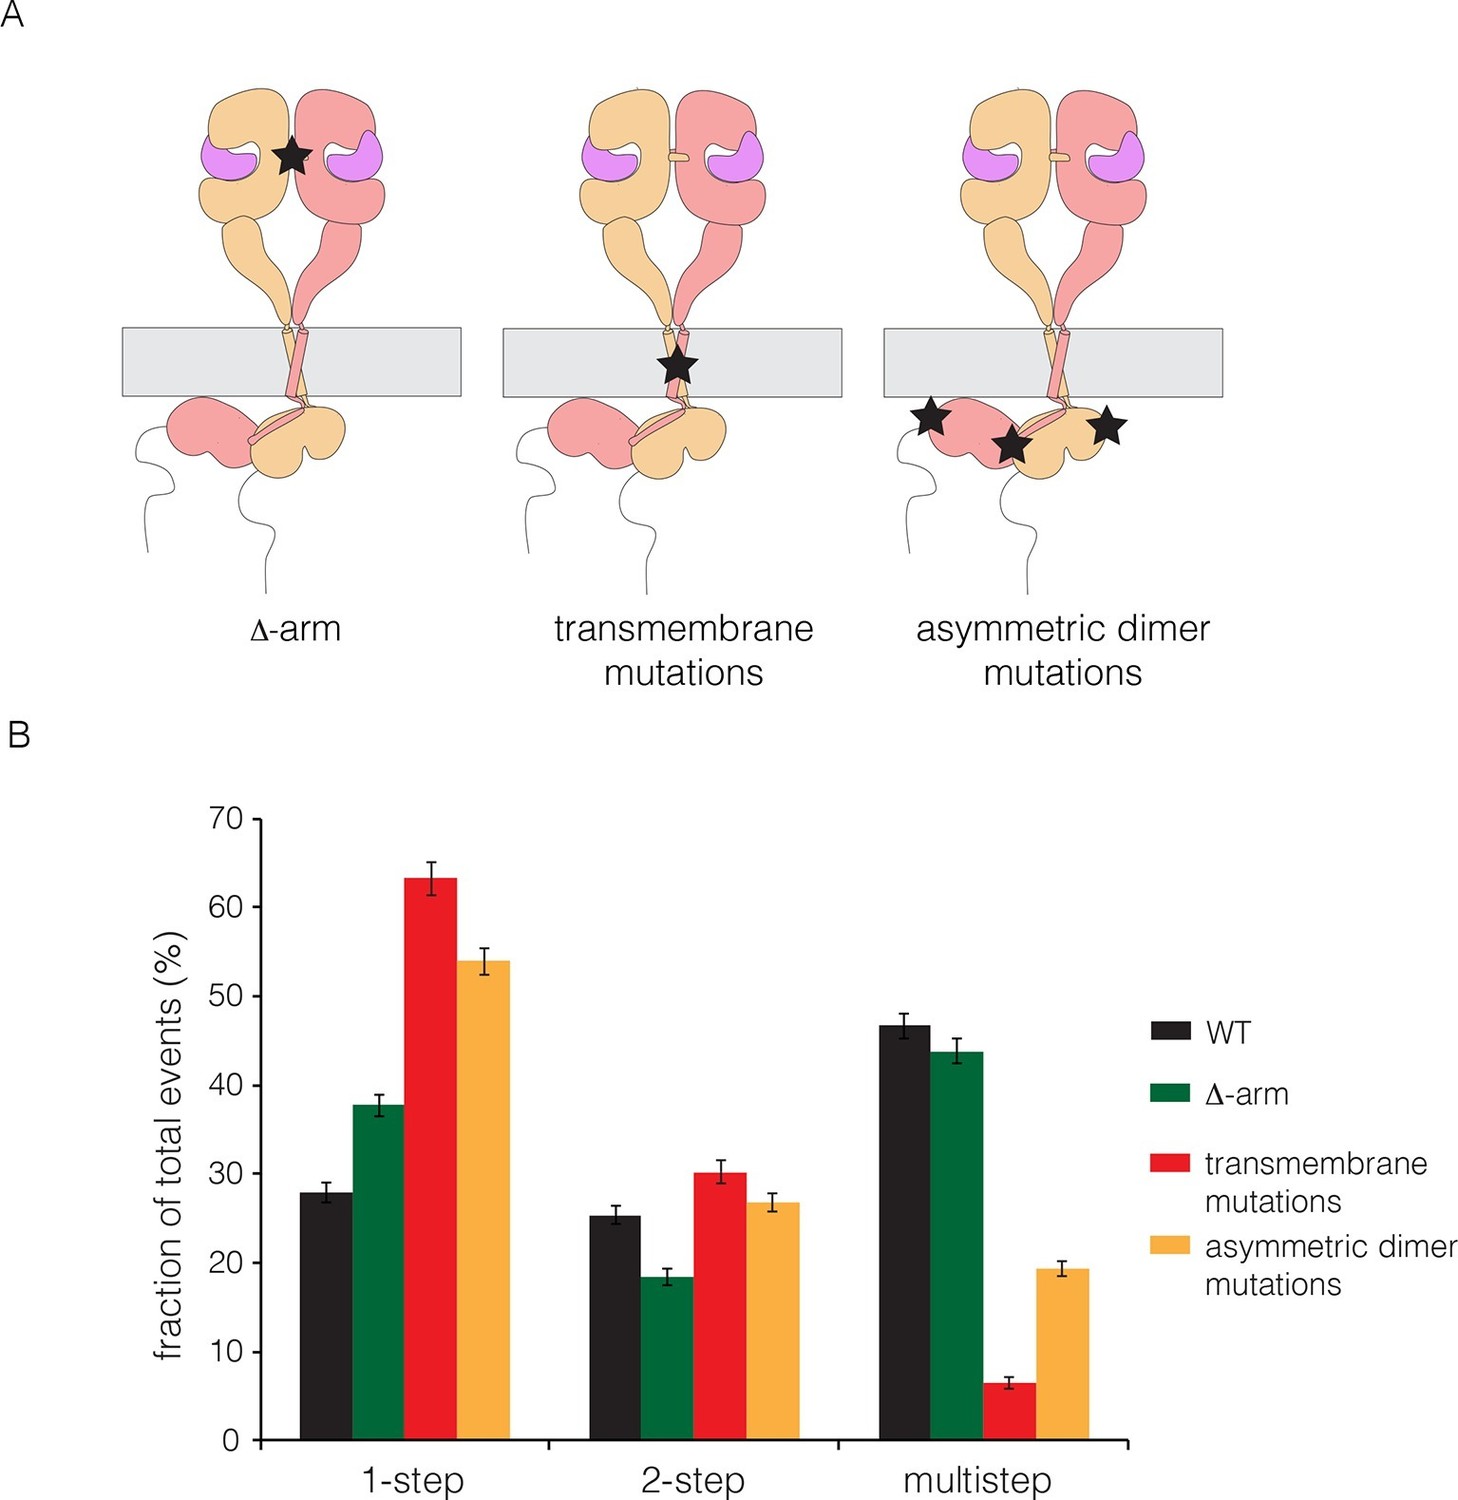
Effects on multimerization of mutations in EGFR that also affect dimerization.
(A) Schematic diagram showing the locations of mutations with respect to the EGFR dimer. Δ-arm, deletion of the dimerization arm of the extracellular module. TM, mutations in the transmembrane helix (Thr 624, Gly 625, Gly 628, Gly 629, Ala 637 and Gly 641 are all replaced by isoleucine). Asymmetric dimer interface mutations combine the mutations I682Q in the N-lobe and V924R in the C-lobe of the kinase domain. (B) Histogram showing the fraction of one-step, two-step and multistep photobleaching events in Xenopus oocytes for wild-type and mutant EGFRs.
Figure 5—figure supplement 1
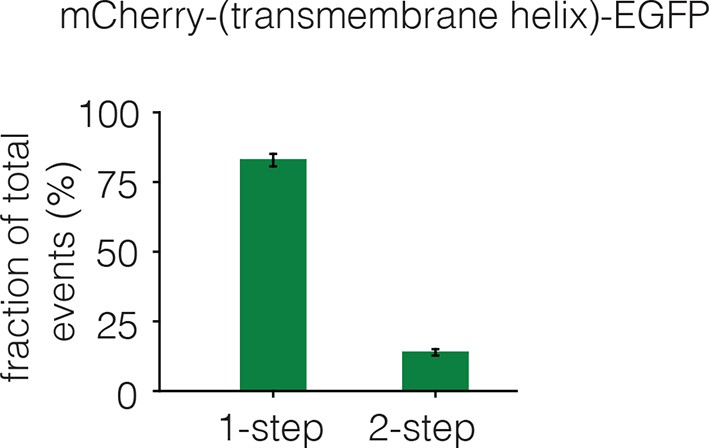
Dimerization of the isolated transmembrane helix.
The EGFR transmembrane helix was fused to mCherry at the N-terminus and to EGFP at the C-terminus. The fraction of one-step and two-step photobleaching events of EGFP in Xenopus oocytes is shown for this construct. No multistep photobleaching events were observed.
Figure 6
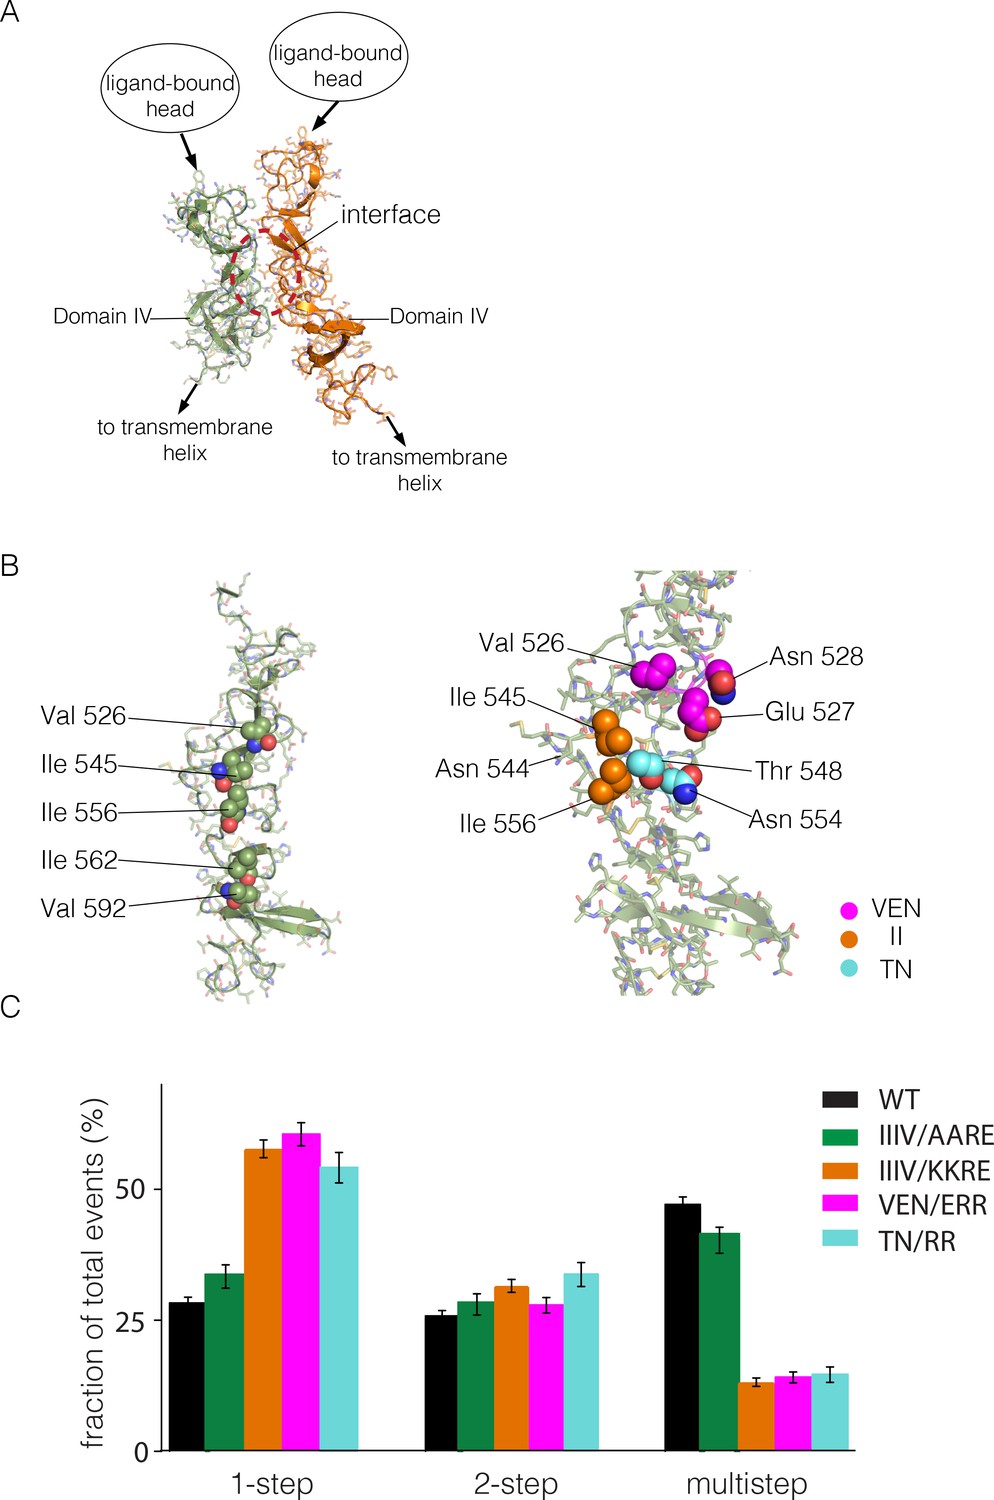
Identification of a possible interface between the Domain IV legs of two EGFR molecules.
(A) A representative dimer generated by ClusPro from a docking calculation done using a single isolated Domain IV. The interface between the two domains is not involved in dimerization, and is on the opposite face of the domain with respect to the interface involved in autoinhibitory tethering. (B) Residues on Domain IV that were mutated to examine their effects on multimerization and activity. (C) Histogram of the fractions of one-step, two-step and multistep photobleaching events in Xenopus oocytes for wild-type and mutant EGFR. IIIV/AARE: I545A, I556A, I562R and V592E. IIIV/KKRE: I545K, I556K, I562R and V592E. VEN/ERR: V526E, E527R and N528R. TN/RR: T548R and N554R.
Figure 7 with 1 supplement
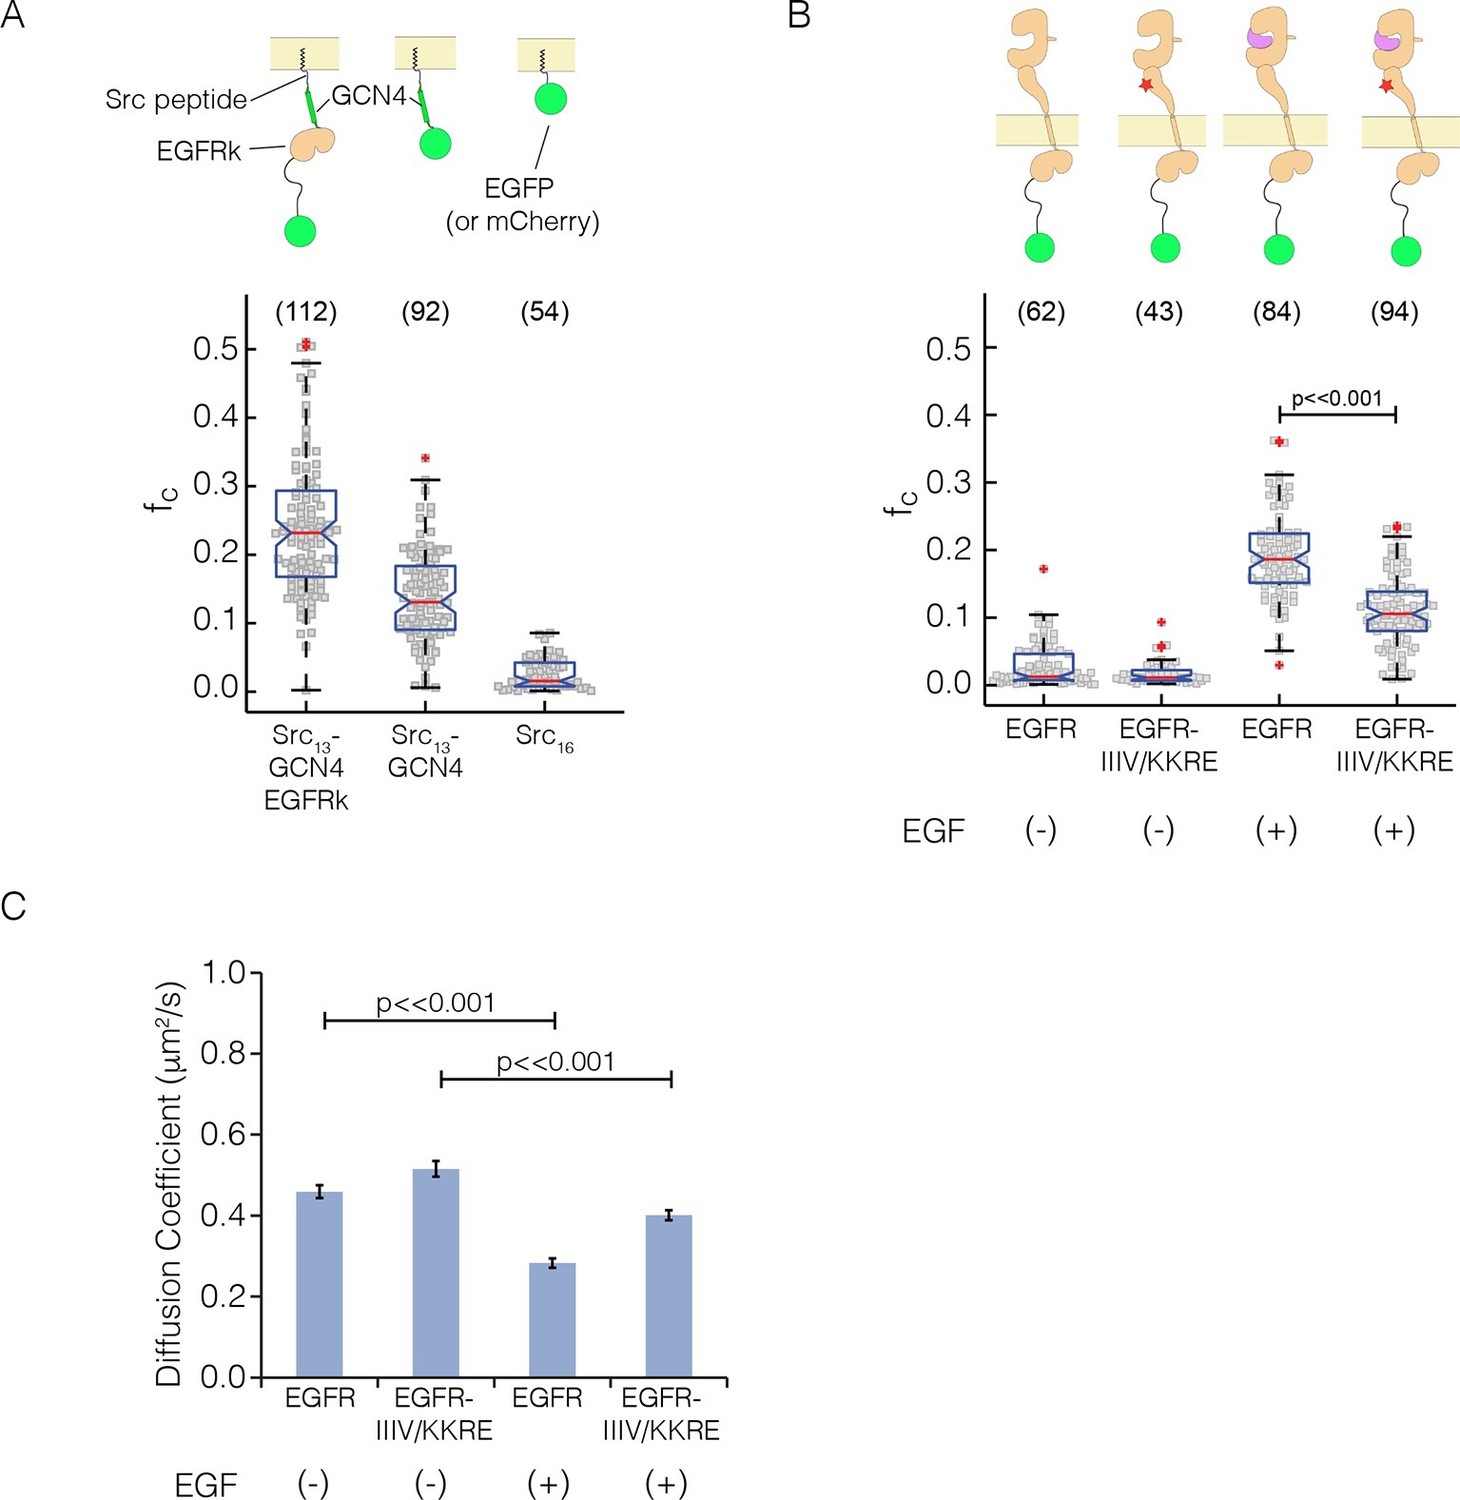
Pulsed-interleaved excitation fluorescence cross-correlation spectroscopy (PIE-FCCS) data for EGFR expressed in COS-7 cells.
For each protein, EGFP and mCherry fusions are coexpressed via transient transfection, and the cross-correlation between them is calculated for individual cells and reported as a fraction correlated, fc, indicated in the scatter plot. The red line represents the median value of the distribution, with the box enclosing the 25–75 percentile and the whiskers the entire distribution. Outliers are indicated by a red cross. (A) Data for control constructs, shown schematically at the top of the panel. These constructs are localized to the membrane by a thirteen residue N-terminal sequence from c-Src, and have either EGFP or mCherry fused to the C-terminus, as described (Endres et al., 2013). A multimer control, Src13-GCN4-EGFRk, is a construct with the coiled-coil segment of GCN4 joined to the N-terminus of the kinase domain of EGFR. The dimer control, Src13-GCN4, contains just the coiled-coil segment of GCN4 in addition to the membrane tag and the fluorescent protein. The monomer control, Src16, contains only the membrane localization sequence and the flurescent protein. Note that the cross-correlation values for multimeric Src13-GCN4-EGFRk are higher than that for the dimer control, as previously reported (Marita et al., 2015). (PIE-FCCS data for these controls were collected previously on the same instrument, and are reproduced here with permission.) (B) Relative cross-correlation values for full-length EGFR constructs, with and without the addition of EGF: EGFR, wild-type EGFR; and EGFR-IIIV/KKRE, an EGFR quadruple mutant (I545K, I556K, I562R and V592E). (C) Protein mobility from PIE-FCCS data. The mobility of each construct in the plasma membrane is directly measured with PIE-FCCS and converted to an effective diffusion coefficient for comparison. The diffusion coefficients of EGFR and EGFR-IIIV/KKRE before ligand stimulation are 0.46 ± 0.02 and 0.52 ± 0.02 μm2/s respectively ( ± standard error). These values are consistent with monomeric, single pass transmembrane proteins in the plasma membrane (Marita et al., 2015). Upon stimulation with EGF, the diffusion coefficient of EGFR-IIIV/KKRE drops to 0.40 ± 0.01 μm2/s, consistent with a monomer-dimer transition. For wild-type EGFR, EGF stimulation causes the diffusion coefficient to be reduced significantly more than for the mutant, to 0.28 ± 0.01 μm2/s, consistent with the formation of multimers.
Figure 7—figure supplement 1
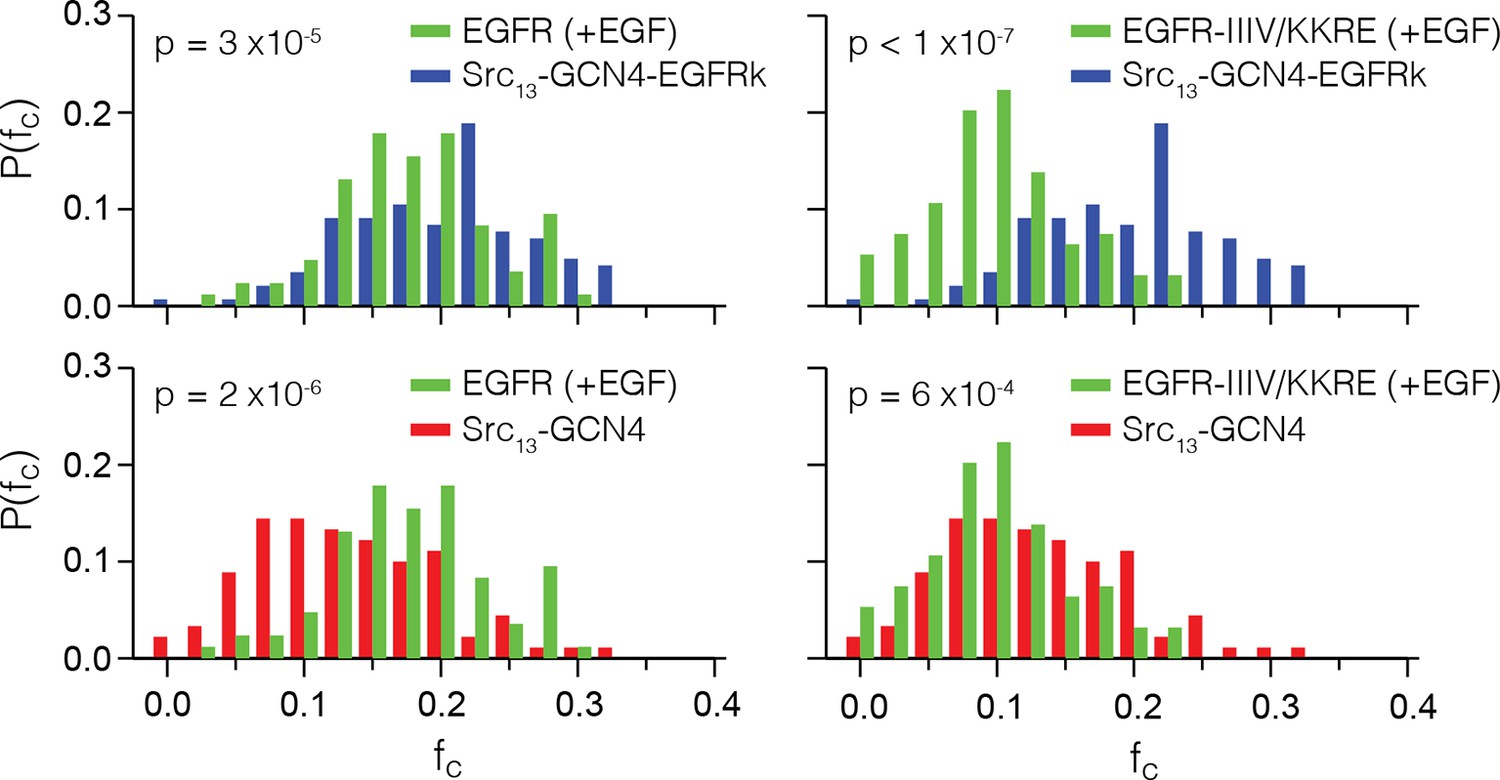
Distributions of fc values for EGFR (+EGF), EGFR-IIIV/KKRE (+EGF) and the two positive controls, Src13-GCN4-EGFRk and Src13-GCN4.
The fc data from Figure 7A and B is binned at increments of 0.025, normalized, and displayed to compare both receptors to both of the positive controls. Each pairwise comparison is statistically significant (p<0.001, by two-sample Student’s t-test), with the p-values displayed in each plot. For EGFR (+EGF) the distribution of fc lines up much more closely with the multimer control than the dimer control. For EGFR-IIIV/KKRE (+EGF) the fc distribution compares more favorably with the dimer control.
Figure 8 with 2 supplements
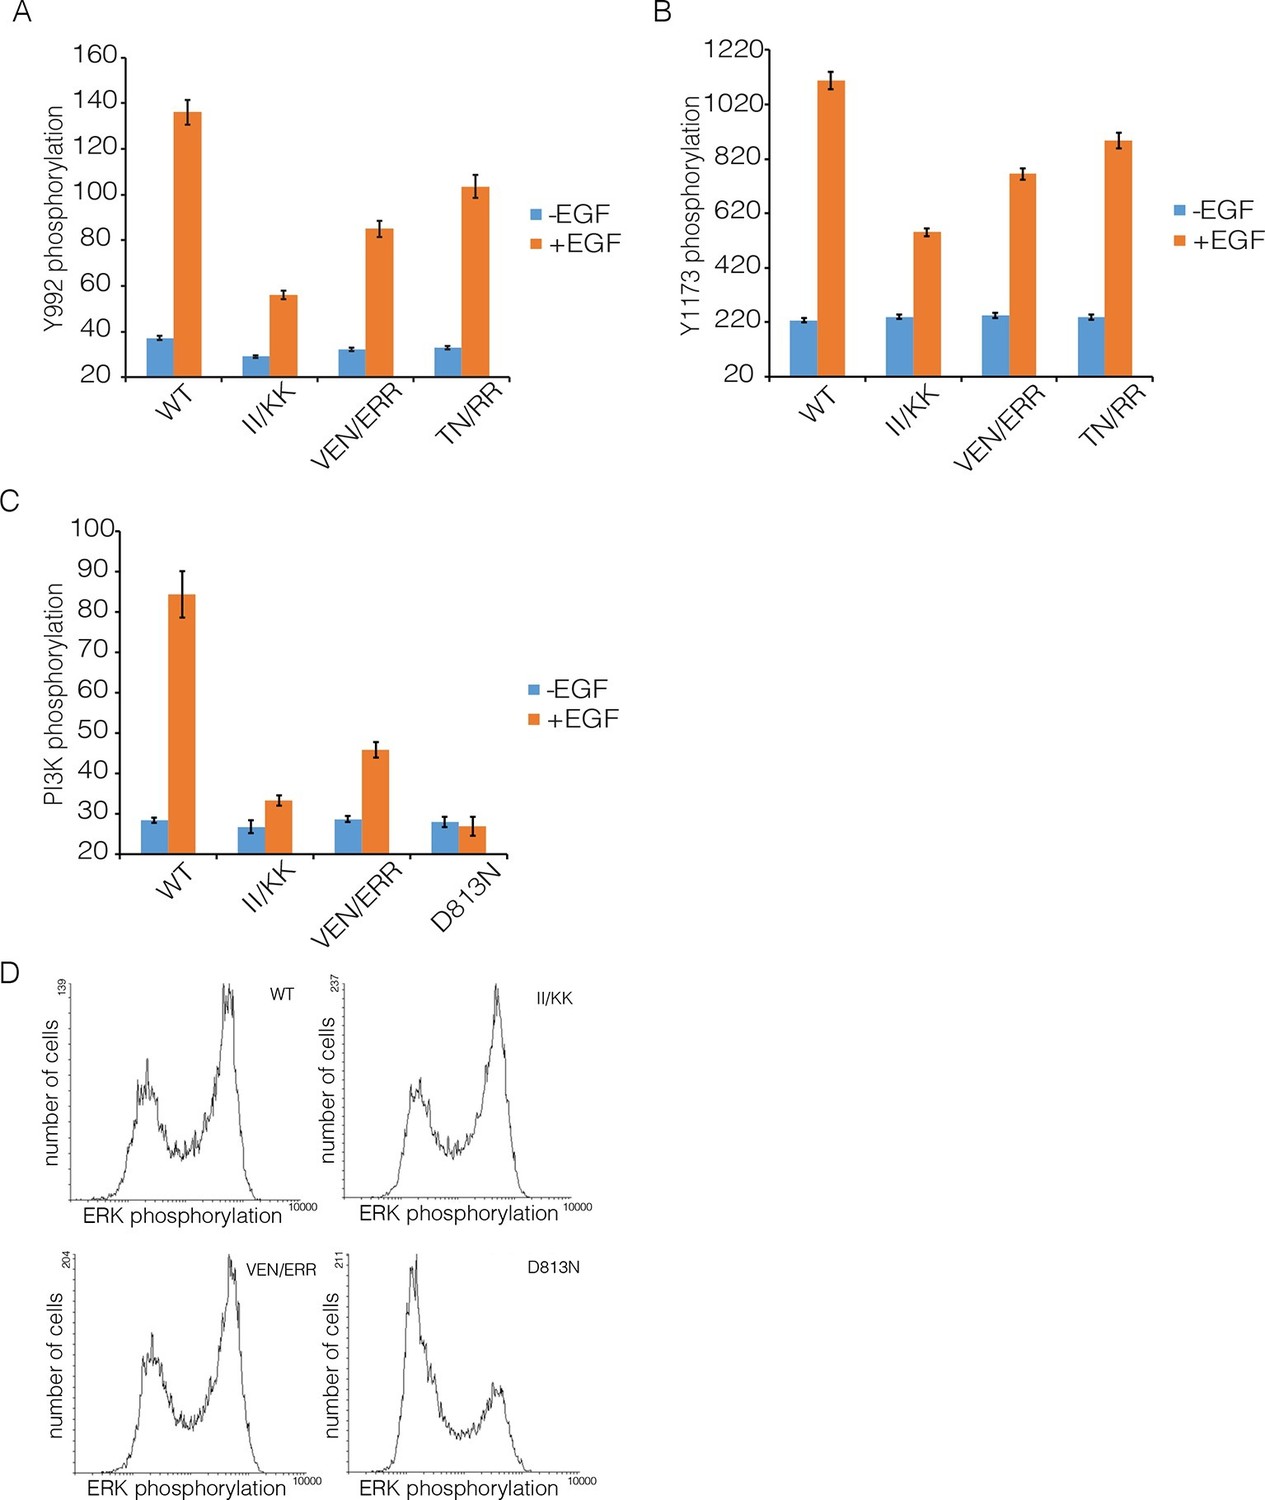
Effect of Domain IV mutations on phosphorylation of EGFR and two effector proteins.
Wild-type (WT) or mutant EGFR was transfected into HEK293T cells, and phosphorylation was measured using FACS. The EGFR mutants are: II/KK (I545K, I556K); VEN/ERR (V526E, E527R and N528R); TN/RR (T548R and N554R). (A) Phosphorylation of a proximal site (Tyr 992) in EGFR. The bar graph shows the average phosphorylation level from cells expressing an intermediate level of EGFR, selected based on the whole range of EGFR expression in the FACS analysis, with (orange) and without (blue) the addition of EGF. (B) As in Panel A, for a distal site (Tyr 1173) in EGFR. (C) As in Panels A and B, for phosphorylation of PI3K. In addition to two mutations in Domain IV (II/KK and VEN/ERR), the phosphorylation levels for a kinase-dead EGFR variant (D813N) are shown. (D) Phosphorylation of ERK. The levels of phosphorylated ERK (pERK) show a bimodal distribution, with cells tending to have either low or high levels of pERK. The data are best represented as a histogram of cell numbers with different levels of pERK, as described (Kovacs et al., 2015b). Note that the response of two Domain IV mutants (II/KK and VEN/ERR) resembles that of the wild-type EGFR. For comparison, data for kinase-dead EGFR (D813N) show a reduced population of cells with high levels of pERK.
Figure 8—figure supplement 1
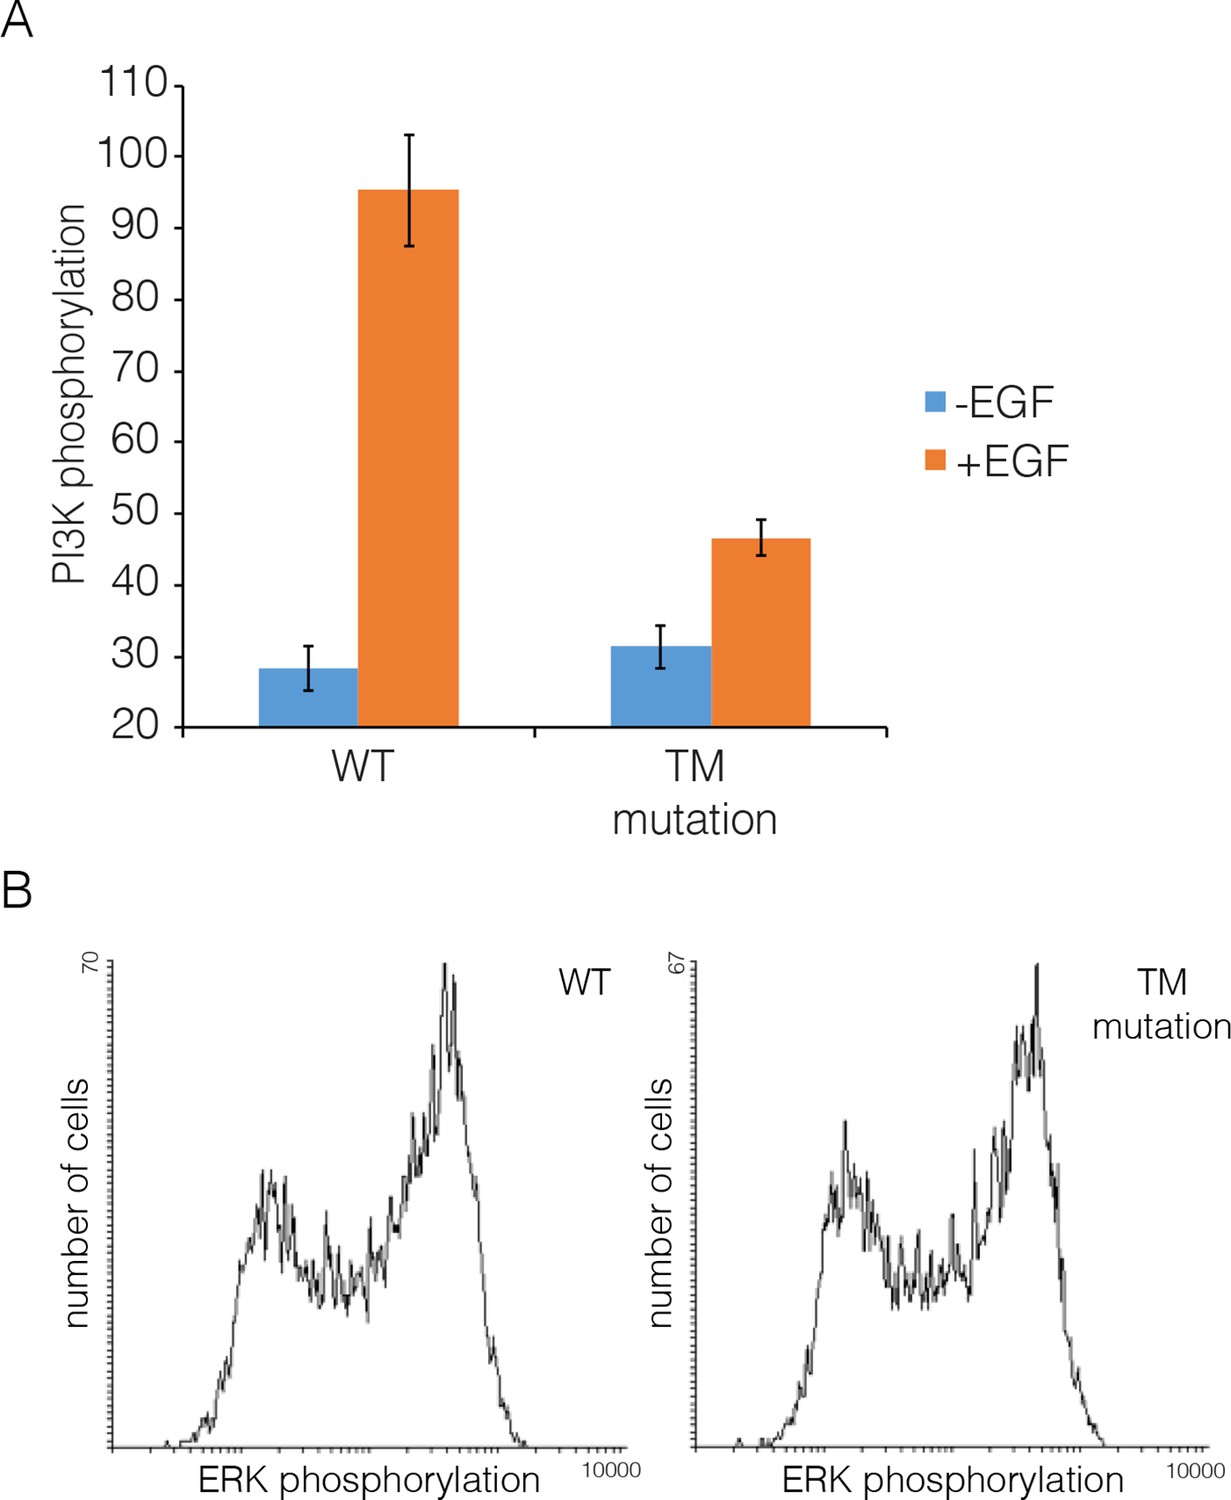
Transmembrane helix mutations.
Effect on PI3K and ERK phosphorylation of mutation in the transmembrane helix (Thr 624, Gly 625, Gly 628, Gly 629, Ala 637 and Gly 641 are all replaced by isoleucine; compare with Figure 5). Data for PI3K and for ERK are shown as in Figure 8.
Figure 8—figure supplement 2
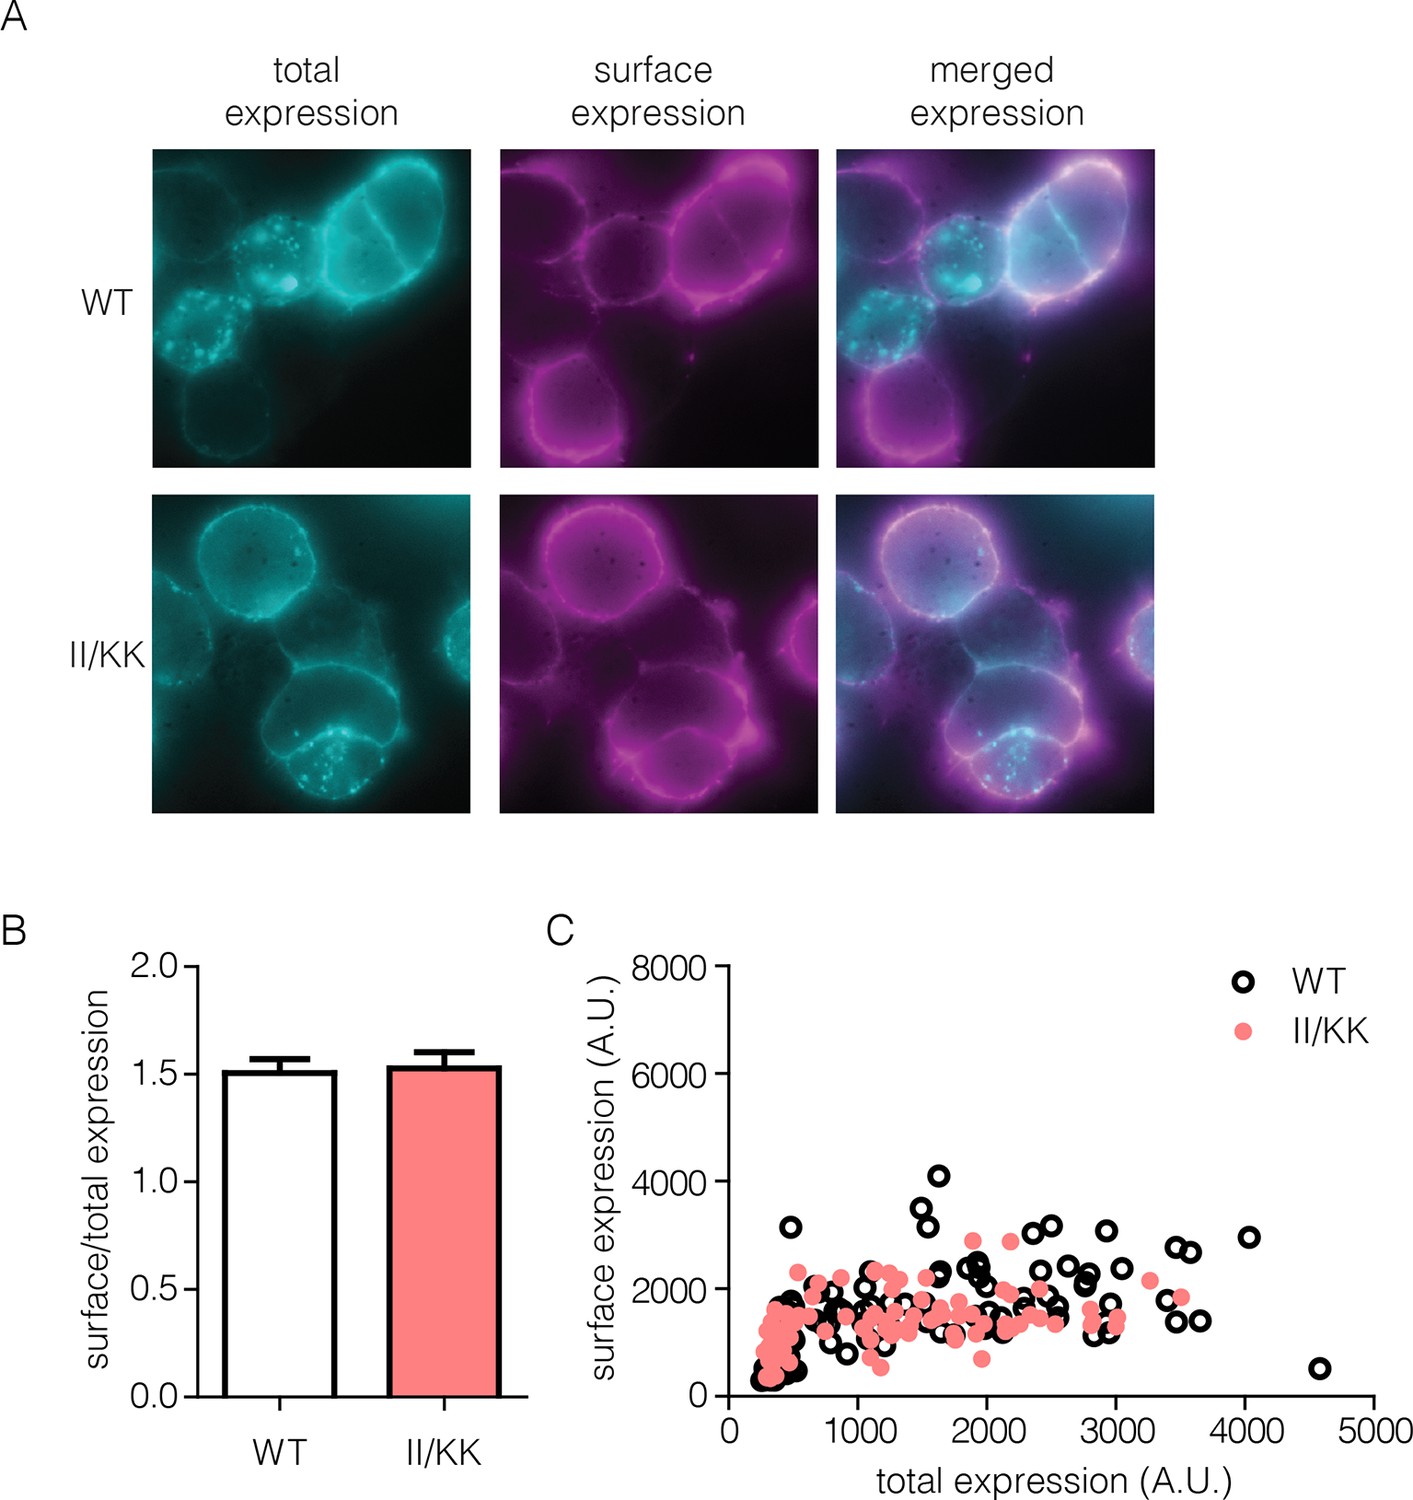
Surface expression of wild-type EGFR and II/KK mutant.
(A) Total receptor (cyan) show some intracellular stores of receptor but very efficient trafficking of wild-type and II/KK (I545K/I556K) EGFR to the cell surface (magenta). (B) Quantification of surface/total ratio of approximately 100 cells from three independent experiments (error bars are SEM from N=3). The ratio is calculated from integrated fluorescence intensity values from each channels. (C) Representative data from one independent experiment show plot of raw total versus surface values. Each point is a region of interest (ROI), which is roughly equivalent to one cell.
Figure 9
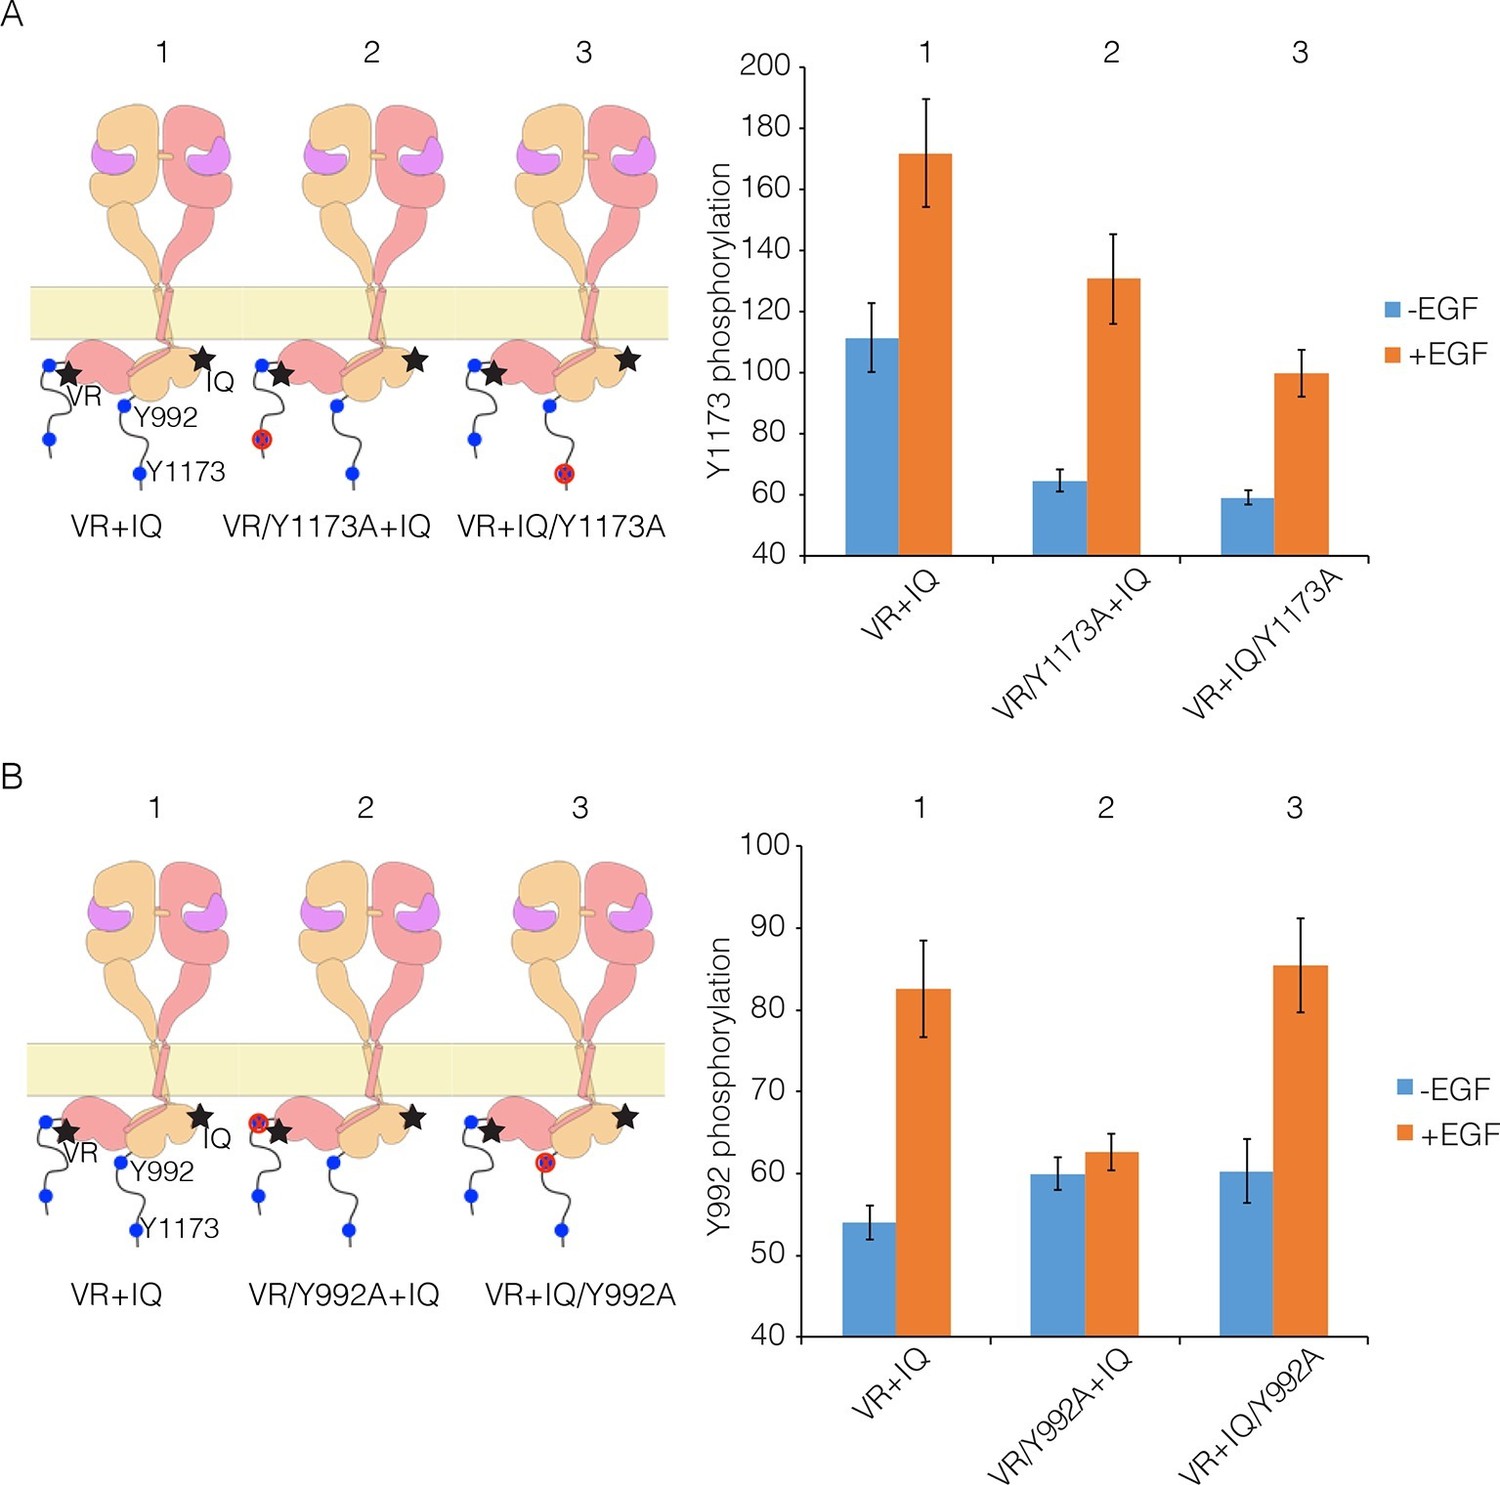
Proximal and distal tail phosphorylation of EGFR in co-transfections with activator-impaired and receiver-impaired mutants.
In these experiments, activator-impaired EGFR (V924R; denoted VR; salmon subunit) is fused to EGFP at the C-terminus and receiver-impaired EGFR (I682Q; denoted IQ; yellow subunit) is fused to mCherry. Phosphorylation is measured after co-transfection of both constructs, with and without EGF. (A) Tyr 1173, located in the distal portion of the tail, is present in both tails (denoted 1), in only the tail of receiver-impaired EGFR (denoted 2) or in only the activator-impaired tail (denoted 3). The bar graphs show phosphorylation levels for Tyr 1173. (B) As in Panel A, for a site in the proximal part of the tail, Tyr 992. Note that addition of EGF leads to only a very small increase in phosphorylation of Tyr 992 when the kinase bearing that residue is receiver-impaired.
Figure 10

Lateral phosphorylation of the tail of EGFR.
Top) Schematic of kinase-active EGFR (Enzyme-EGFR) that is co-transfected with a kinase-dead variant (D813N; Substrate-EGFR), as shown in the schematic diagram. Tyr 1173 in Enzyme-EGFR is replaced by alanine. Four variants of substrate-EGFR are used: (1) kinase-dead EGFR, with no other mutations, denoted DN, (2) kinase-dead EGFR that is also receiver-impaired, IQ/DN, (3) kinase-dead EGFR that is also activator-impaired, DN/VR, and (4) kinase-dead EGFR that is also activator- and receiver-impaired, IQ/DN/VR. Bottom) Bar graph showing phosphorylation levels for Tyr1173, with and without EGF. Note that Substrate-EGFR that is activator-impaired shows no increase in phosphorylation above the basal level upon EGF addition.
Figure 11 with 4 supplements
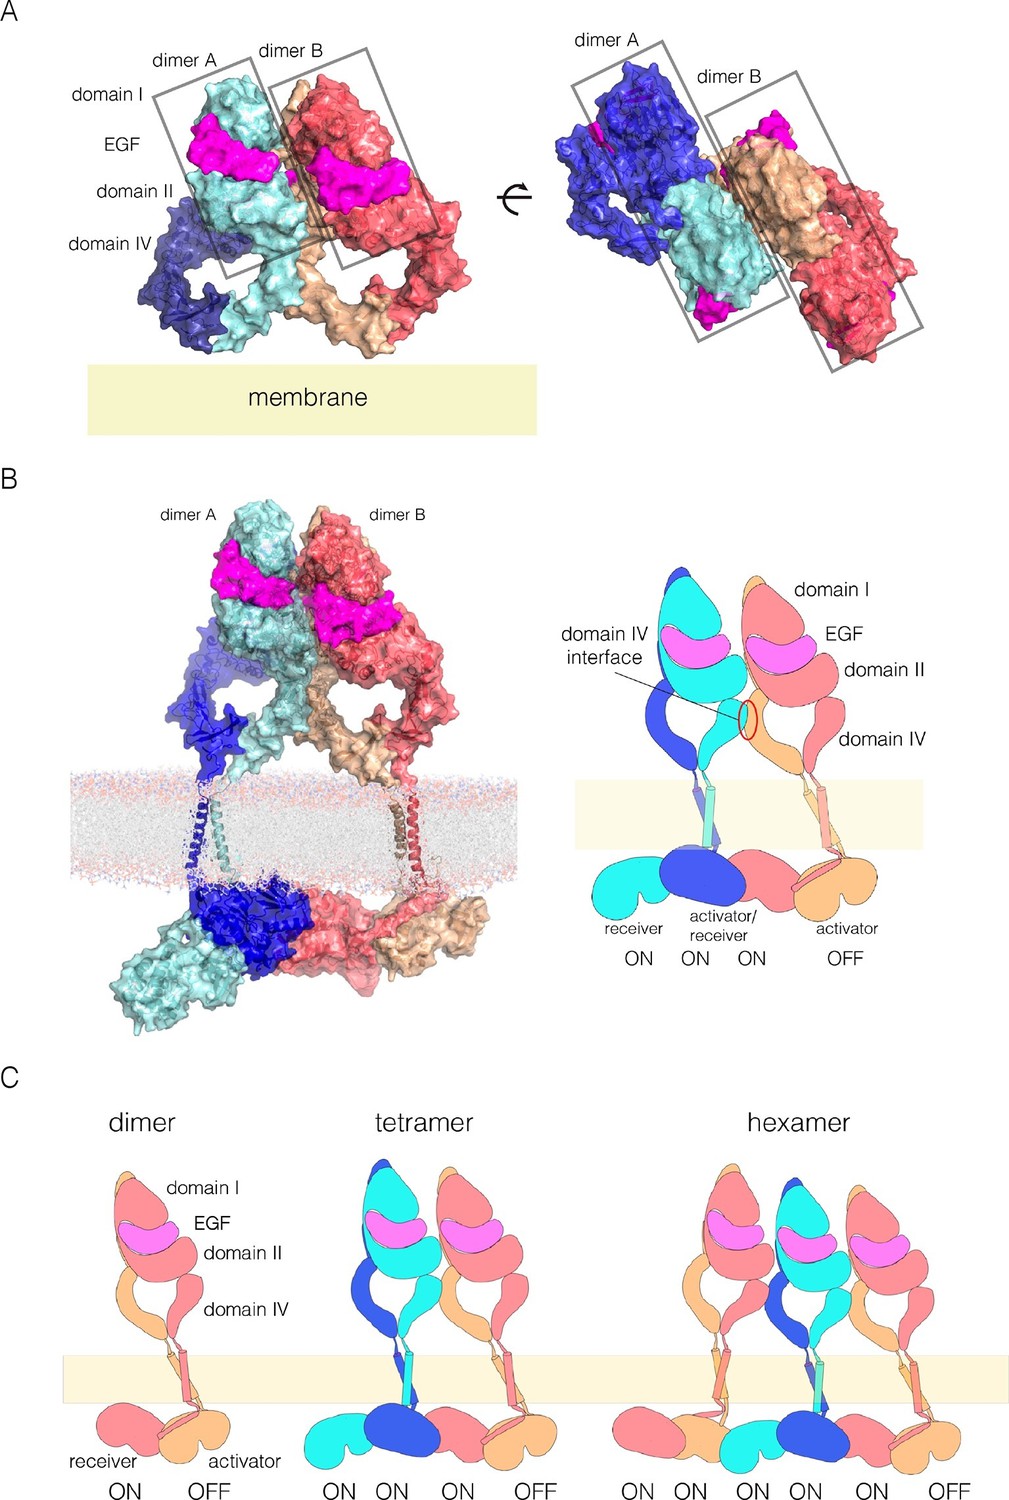
A model for EGFR multimerization.
(A) Two orthogonal views of a tetramer of extracellular modules, selected manually from ClusPro solutions for docking dimers (PDB code: 3NJP) with the constraint that the residues in Domain IV that affect multimerization are located at the interface between dimers. (B) A model for an EGFR tetramer, generated by connecting the model shown in Panel A to the structure of the dimeric transmembrane helices (PDB code 2M20) and a chain of kinase domains (PDB codes: 2GS6 and 3GOP). A schematic representation of the tetramer is shown on the right. (C) Schematic diagram indicating how higher-order multimers might be generated by repeating the interactions used to generate the model for the tetramer.
Figure 11—figure supplement 1
Summary of EGFR variants studied in this work and their effects on EGFR activity and multimerization.
EGFR autophosphorylation in Tyr 992 and Tyr 1173, and the phosphorylation of PI3K and ERK were monitored by FACS assay using mammalian cells. To analyze the EGFR stoichiometry, with or without EGF, stepwise photobleaching counting experiments were done in Xenopus oocytes and PIE-FCCS data was measured in mammalian cells.
Figure 11—figure supplement 2
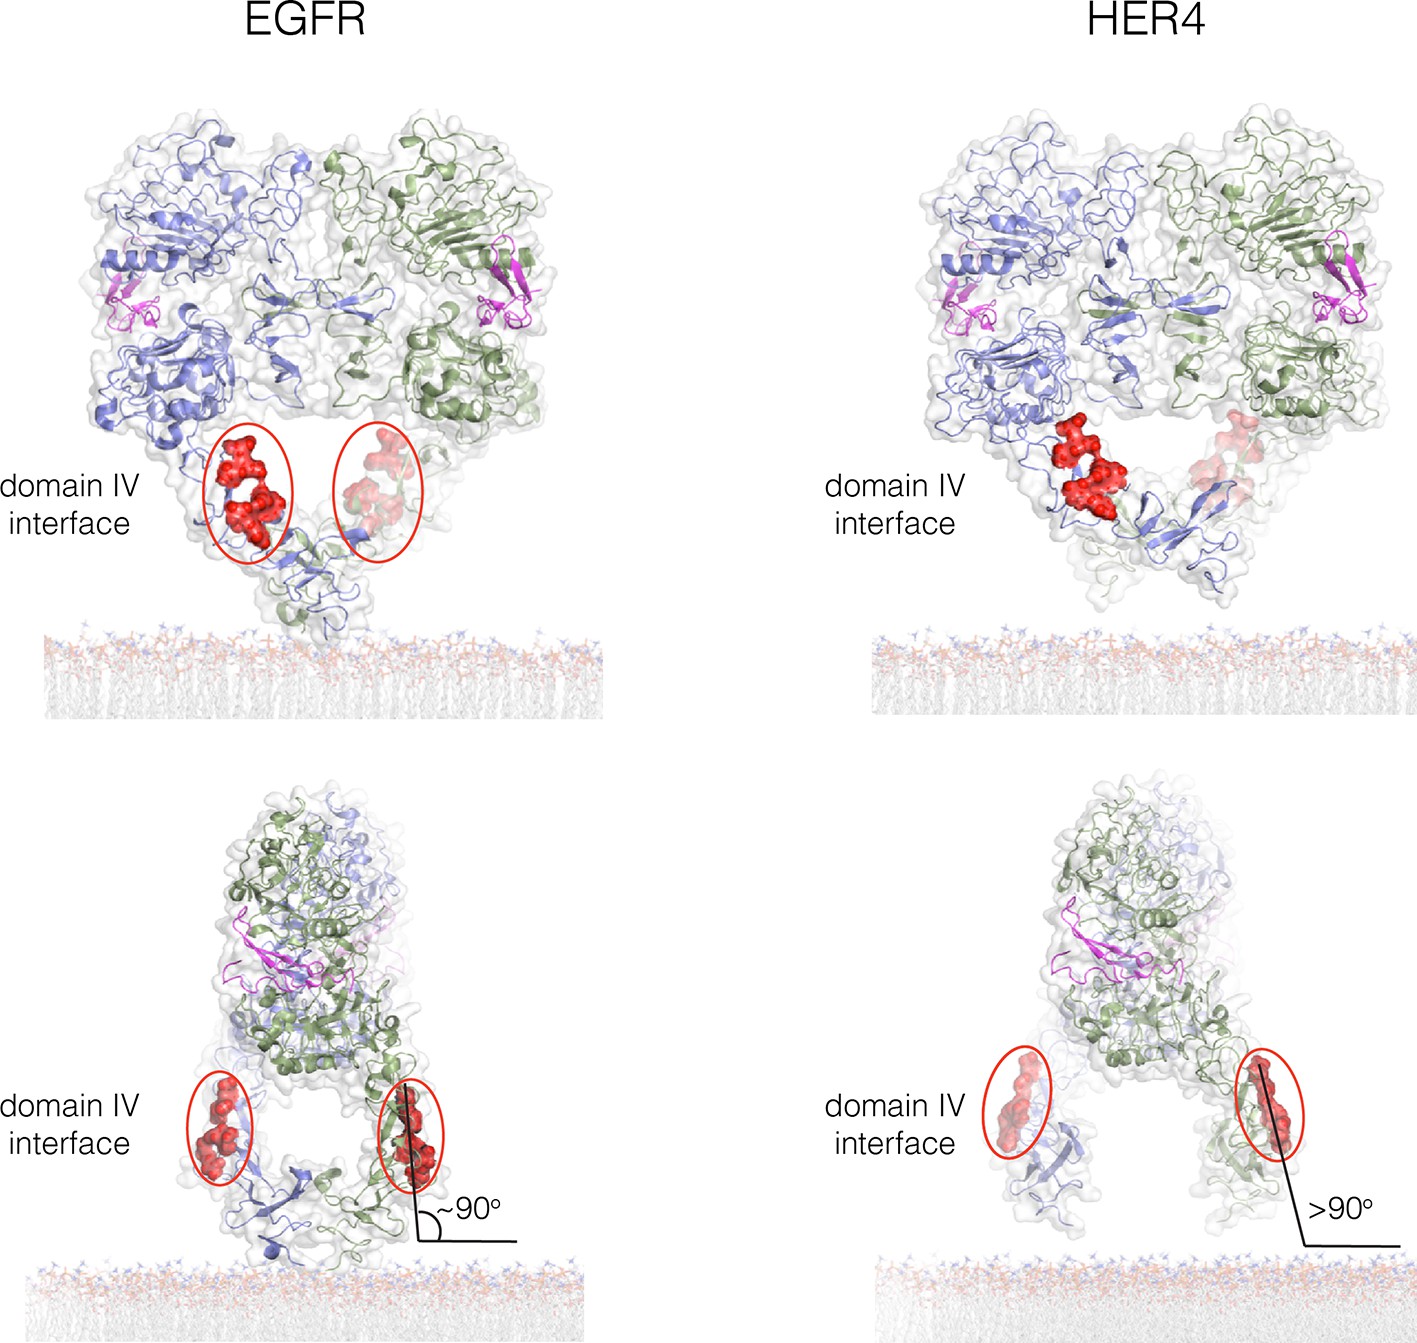
The Domain IV interface in crystal structures of the extracellular dimers of EGFR (left; PDB code 3NJP) and HER4 (right; PDB code 3U7U).
Two orthogonal views of each structure are shown. The C-terminal tips of the extracellular module are close together in EGFR, and further apart in HER4. When the extracellular module is aligned symmetrically with respect to the membrane plane, the configuration of Domain IV in EGFR has the Domain IV multimer interface nearly vertical to the membrane plane. This allows stacking interactions between dimers to be perpetuated while retaining connection to a planar membrane. If the tips are splayed apart, as in the HER4 structure, then stacking between dimers would generate a rotation away from the membrane. For this reason, we used the structure of EGFR to generate a model for the tetramer.
Figure 11—figure supplement 3
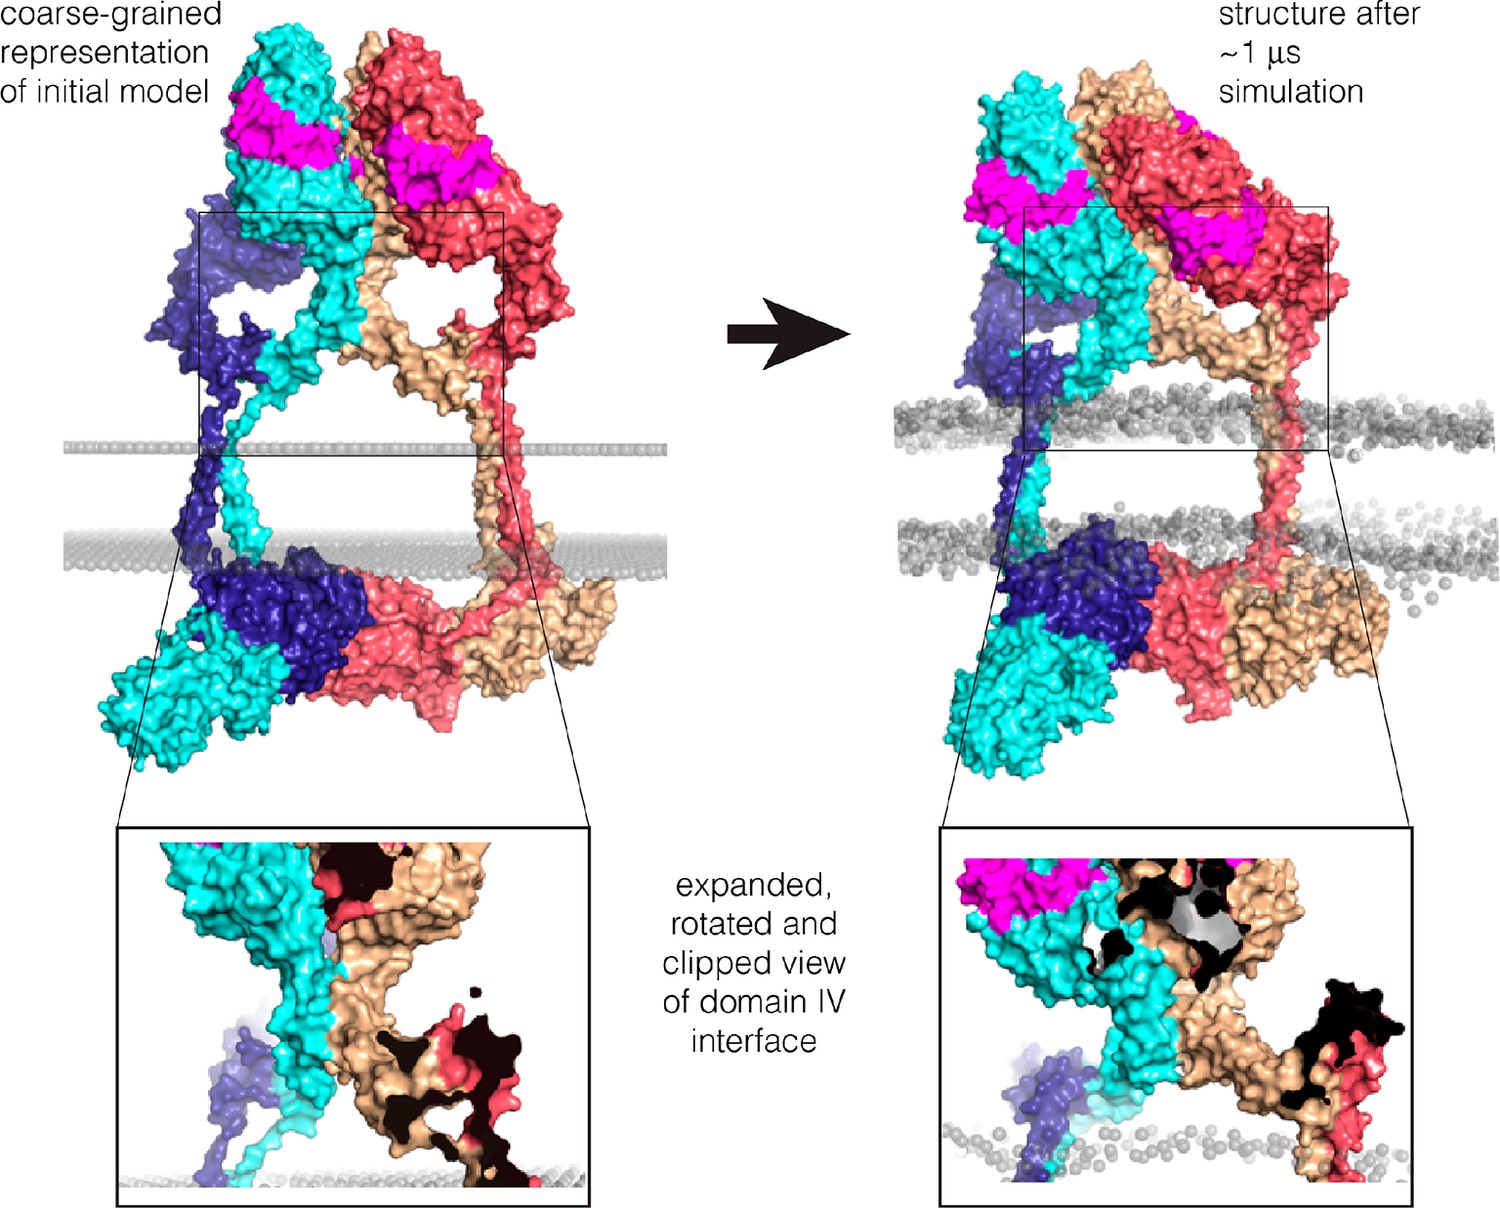
Coarse-grained molecular dynamics simulation in a lipid bilayer.
The model shown in Figure 11B was converted to a coarse-grained representation (Marrink et al., 2007) and inserted in an lipid bilayer, as shown on the left. A 1 μs molecular dynamics trajectory was generated, and a representative structure towards the end of the trajectory is shown on the right. The Domain IV interface and the interfaces between kinase domains remain stable during the trajectory (see Figure 11—figure supplement 4).
Figure 11—figure supplement 4
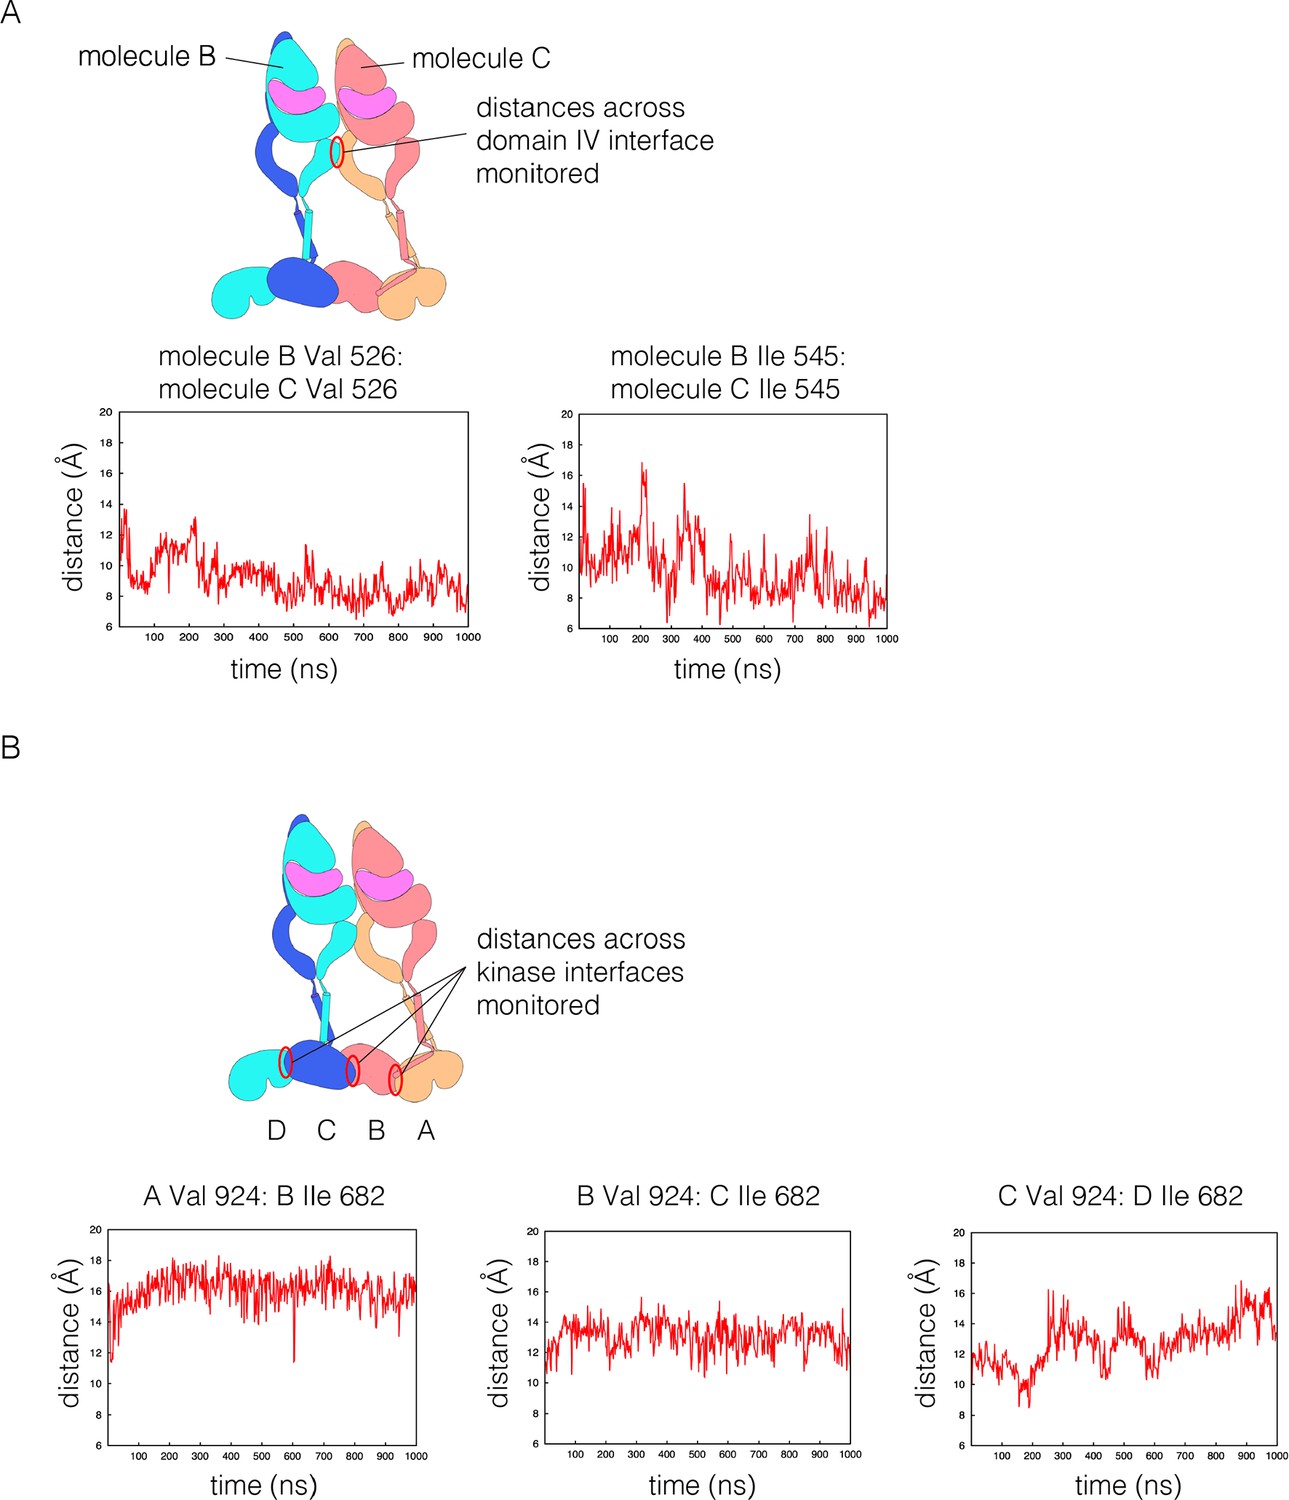
Structural integrity of the tetramer model in coarse-grained molecular dynamics simulation.
(A) The distance between two pairs of residues across the Domain IV simulation are shown over the length of the trajectory. (B) The distance between two residues that are across from each other at each of the three kinase dimer interfaces is shown over the length of the trajectory. For this analysis, the kinases are denoted A, B, C and D, as shown in the schematic diagram. A and B are linked by a juxtamembrane latch, as are C and D. No juxtamembrane latch was included between kinases B and C. The displacement between kinases C and D is larger, as a consequence, but all three interfaces are stable.
Download links
A two-part list of links to download the article, or parts of the article, in various formats.
Downloads (link to download the article as PDF)
Open citations (links to open the citations from this article in various online reference manager services)
Cite this article (links to download the citations from this article in formats compatible with various reference manager tools)
Molecular basis for multimerization in the activation of the epidermal growth factor receptor
eLife 5:e14107.
https://doi.org/10.7554/eLife.14107


