Modulation of anxiety and fear via distinct intrahippocampal circuits
- McLean Hospital, United States
- Harvard Medical School, United States
- The University of Tennessee Health Science Center, United States
- Yale School of Medicine, United States
- Russian Academy of Sciences, Russia
- University of Zurich, Switzerland
Figures
Figure 1 with 5 supplements
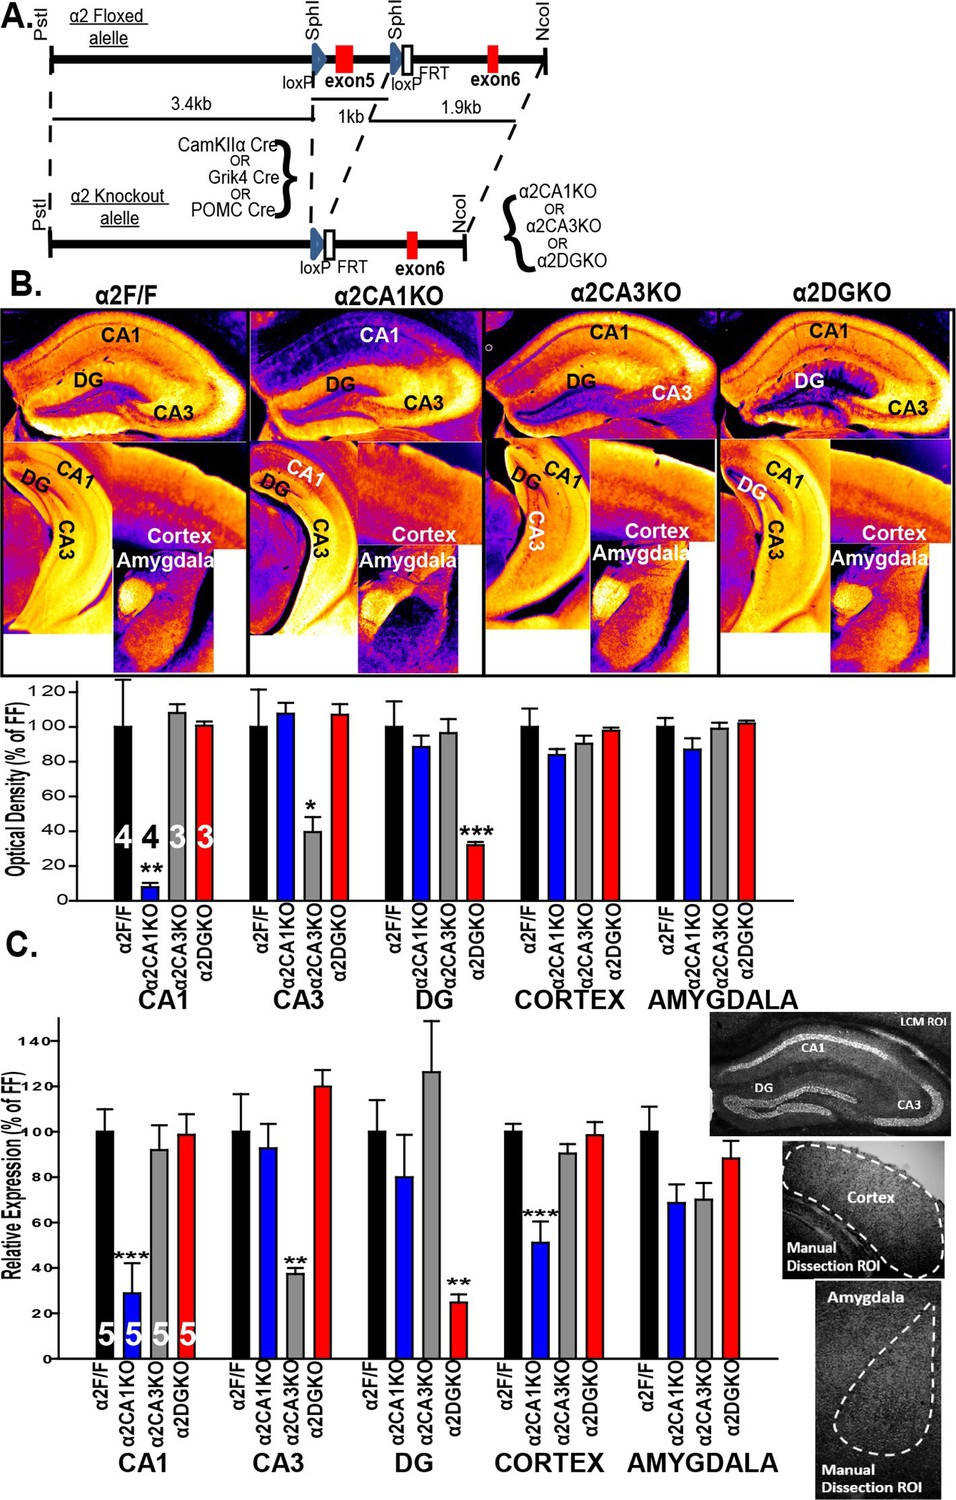
Targeted reduction of α2 expression in CA1, CA3 or DG.
(A) Generation of the α2F/F control and α2CA1KO, α2CA3KO, α2DGKO mice. (B) Top: False color images showing the α2 staining intensity in immunohistochemically stained sections. Cooler colors = less staining. Bottom: Semi-quantitative comparisons of α2 staining. (C) α2 mRNA expression (see sample ROI’s on the right), expressed as% of α2F/F control.*p<0.05, **p<0.01, ***p<0.001 compared to corresponding α2F/F group.
Figure 1—figure supplement 1
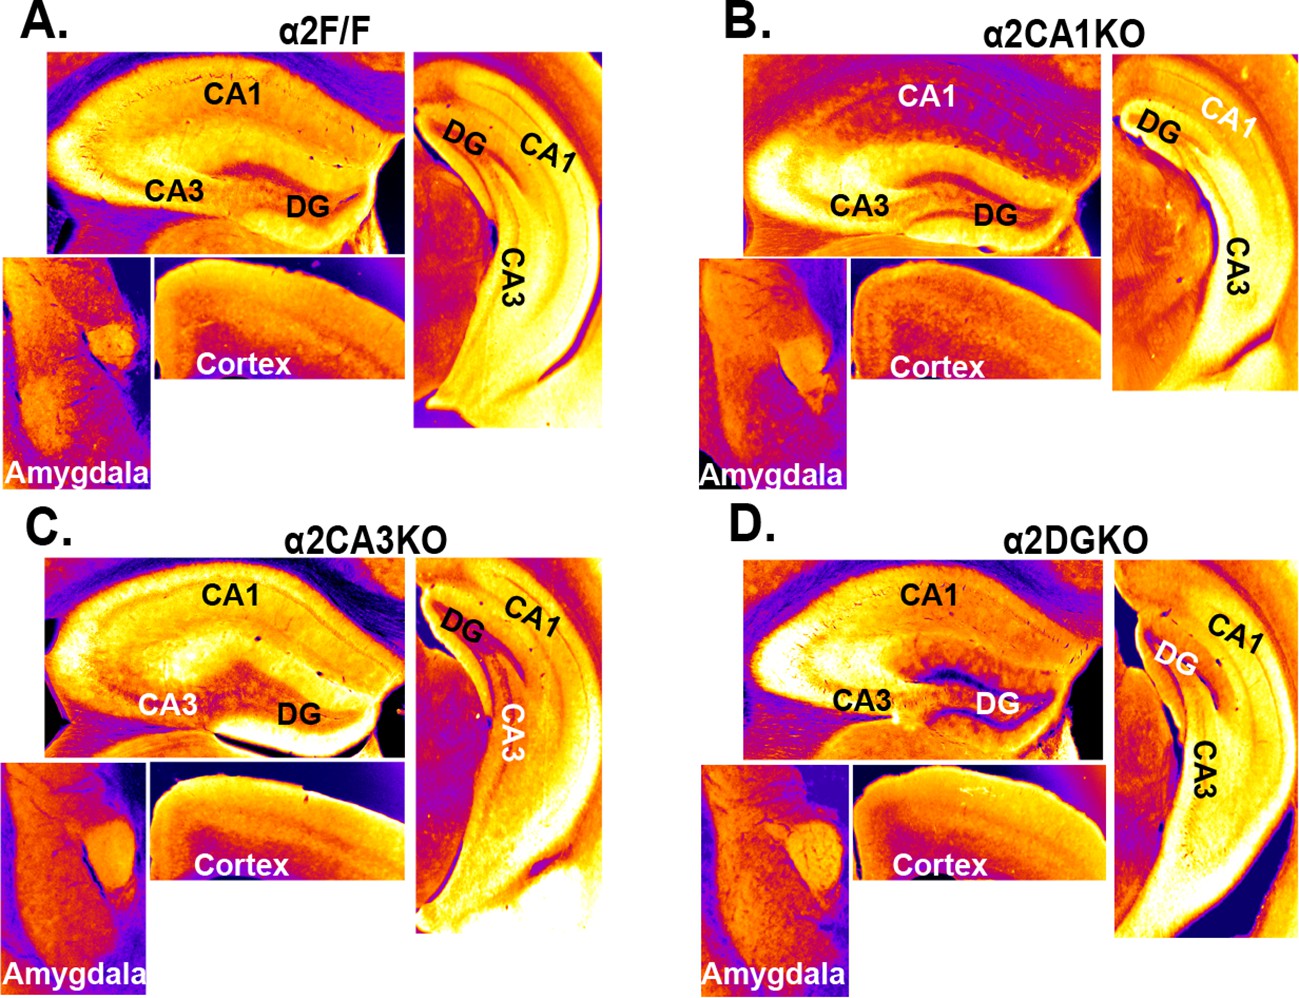
Immunohistochemical localization of GABAAR α2 subunits in conditional knockout mice bred on a 129X1/SvJ background.
(A) False color images showing α2 staining intensity in immunohistochemically stained sections in α2F/F mice.Cooler colors = less staining. (B) Same as A for α2CA1KO, (C) Same as A for α2CA3KO, (D) Same as A for α2DGKO.
Figure 1—figure supplement 2
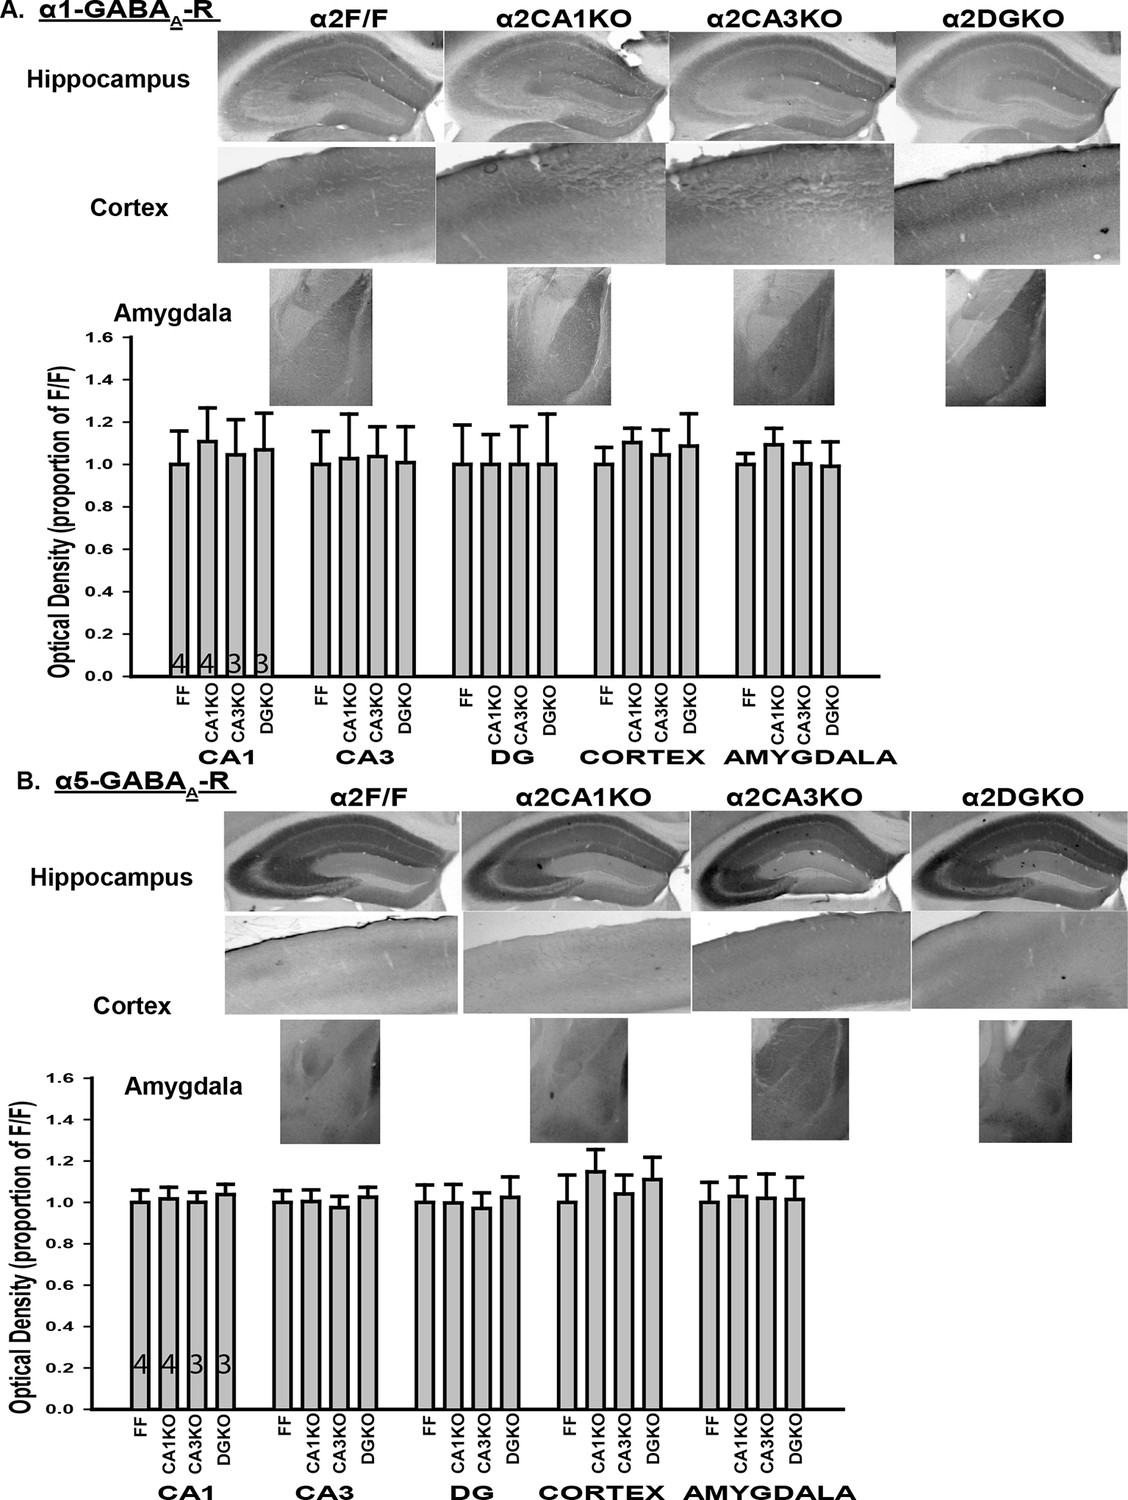
Expression of α1 and α5 subunits in conditional knockout mice.
(A) Top: Representative gray-scale images showing the α1 staining intensity in immunohistochemically stained sections from the hippocampus, cortex and the amygdala of α2F/F, α2CA1KO, α2CA3KO and α2DGKO mice. Bottom: Semi-quantitative comparisons of α1 staining intensity between α2F/F, α2CA1KO, α2CA3KO and α2DGKO mice in CA1, CA3, DG, cortex and the amygdala. (B) Same as A for α5.
Figure 1—figure supplement 3
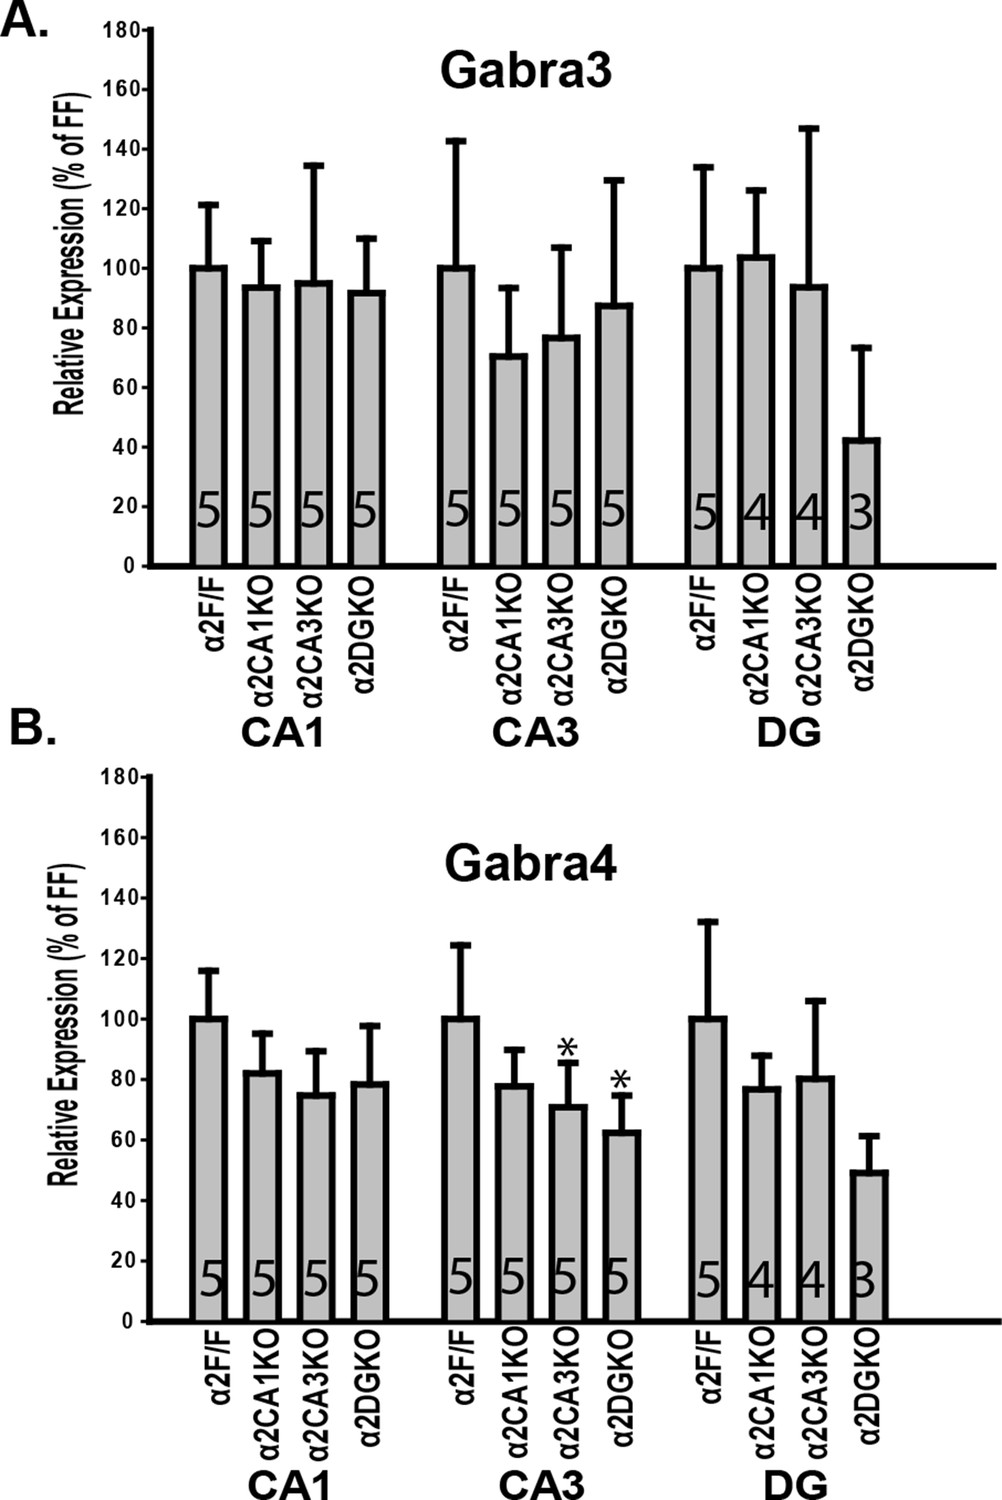
Expression of α3 and α4 mRNA in conditional knockout mice.
(A) Gabra3 expression in CA1, CA3, DG, cortex and the amygdala of α2F/F, α2CA1KO, α2CA3KO and α2DGKO mice expressed as percentage of α2F/F control. (B) Same as A for Gabra4. *p<0.05 in comparison to the corresponding α2F/F control group.
Figure 1—figure supplement 4
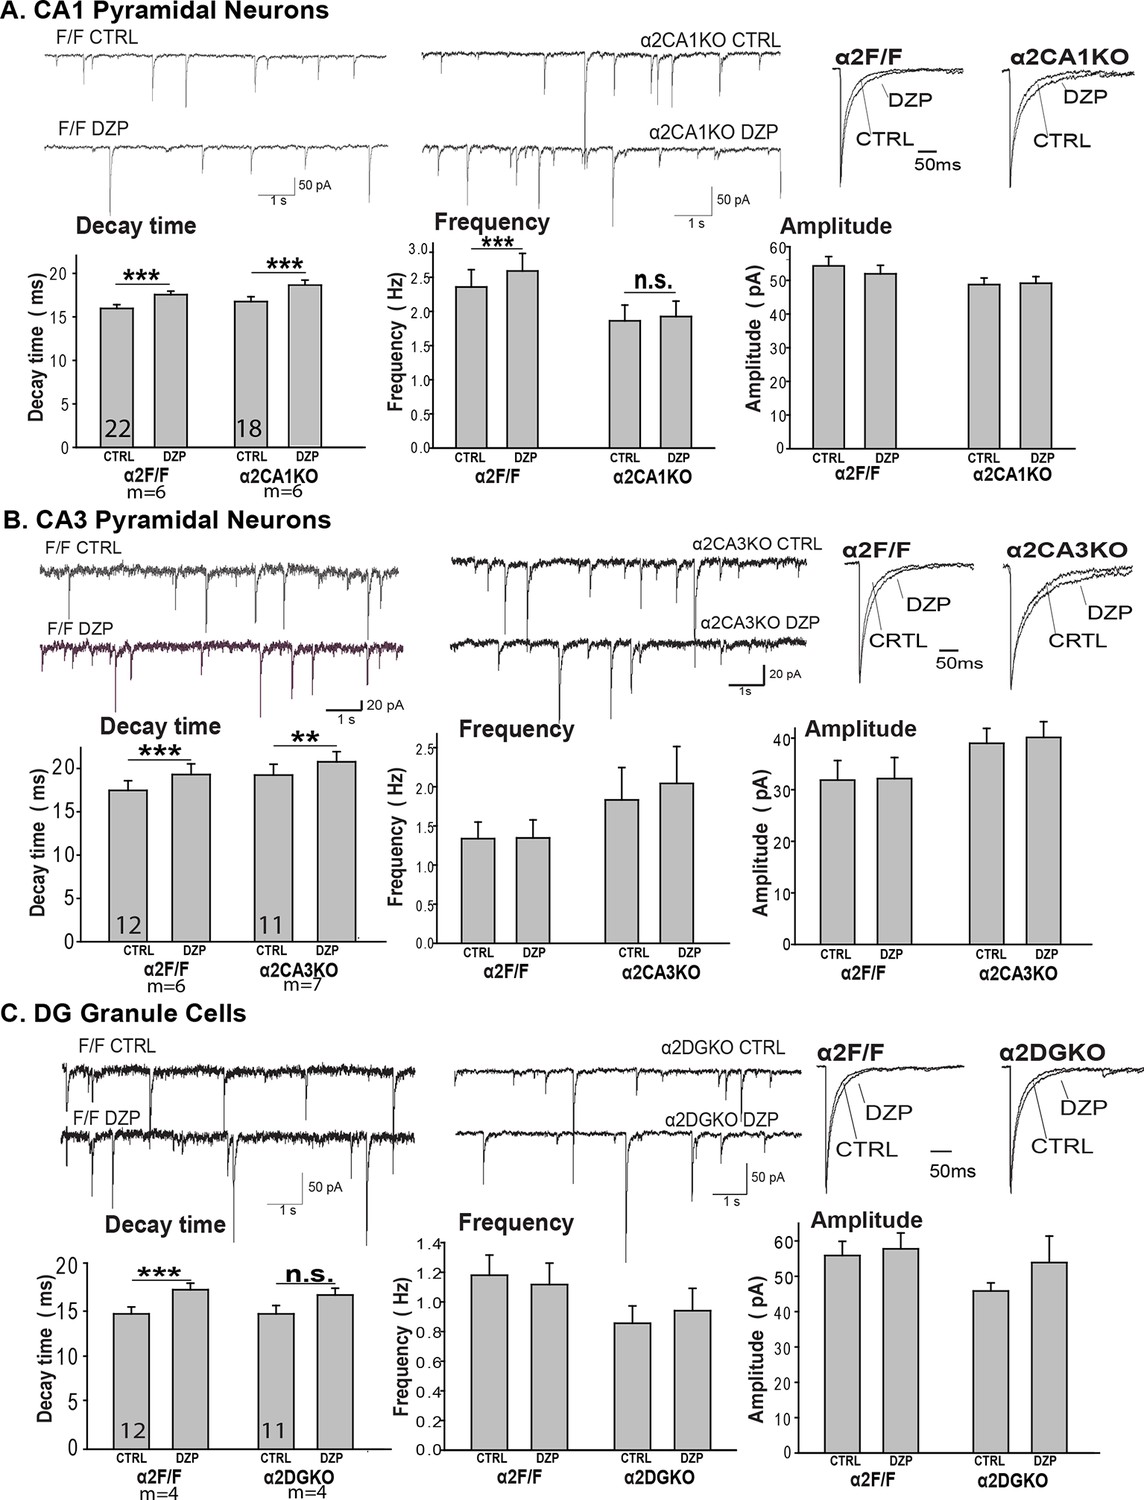
Miniature inhibitory postsynaptic currents.
Mean ( ± S.E.M.) decay time, frequency, amplitude of mIPSCs recorded from (A) the CA1 pyramidal neurons in α2CA1KO and α2F/F sections, (B) the CA3 pyramidal neurons in α2CA3KO and α2F/F sections, (C) the DG granule cells in α2DGKO and α2F/F sections. **p<0.01, ***p<0.001. CTRL=vehicle-treated, DZP=diazepam-treated.
Figure 1—figure supplement 5
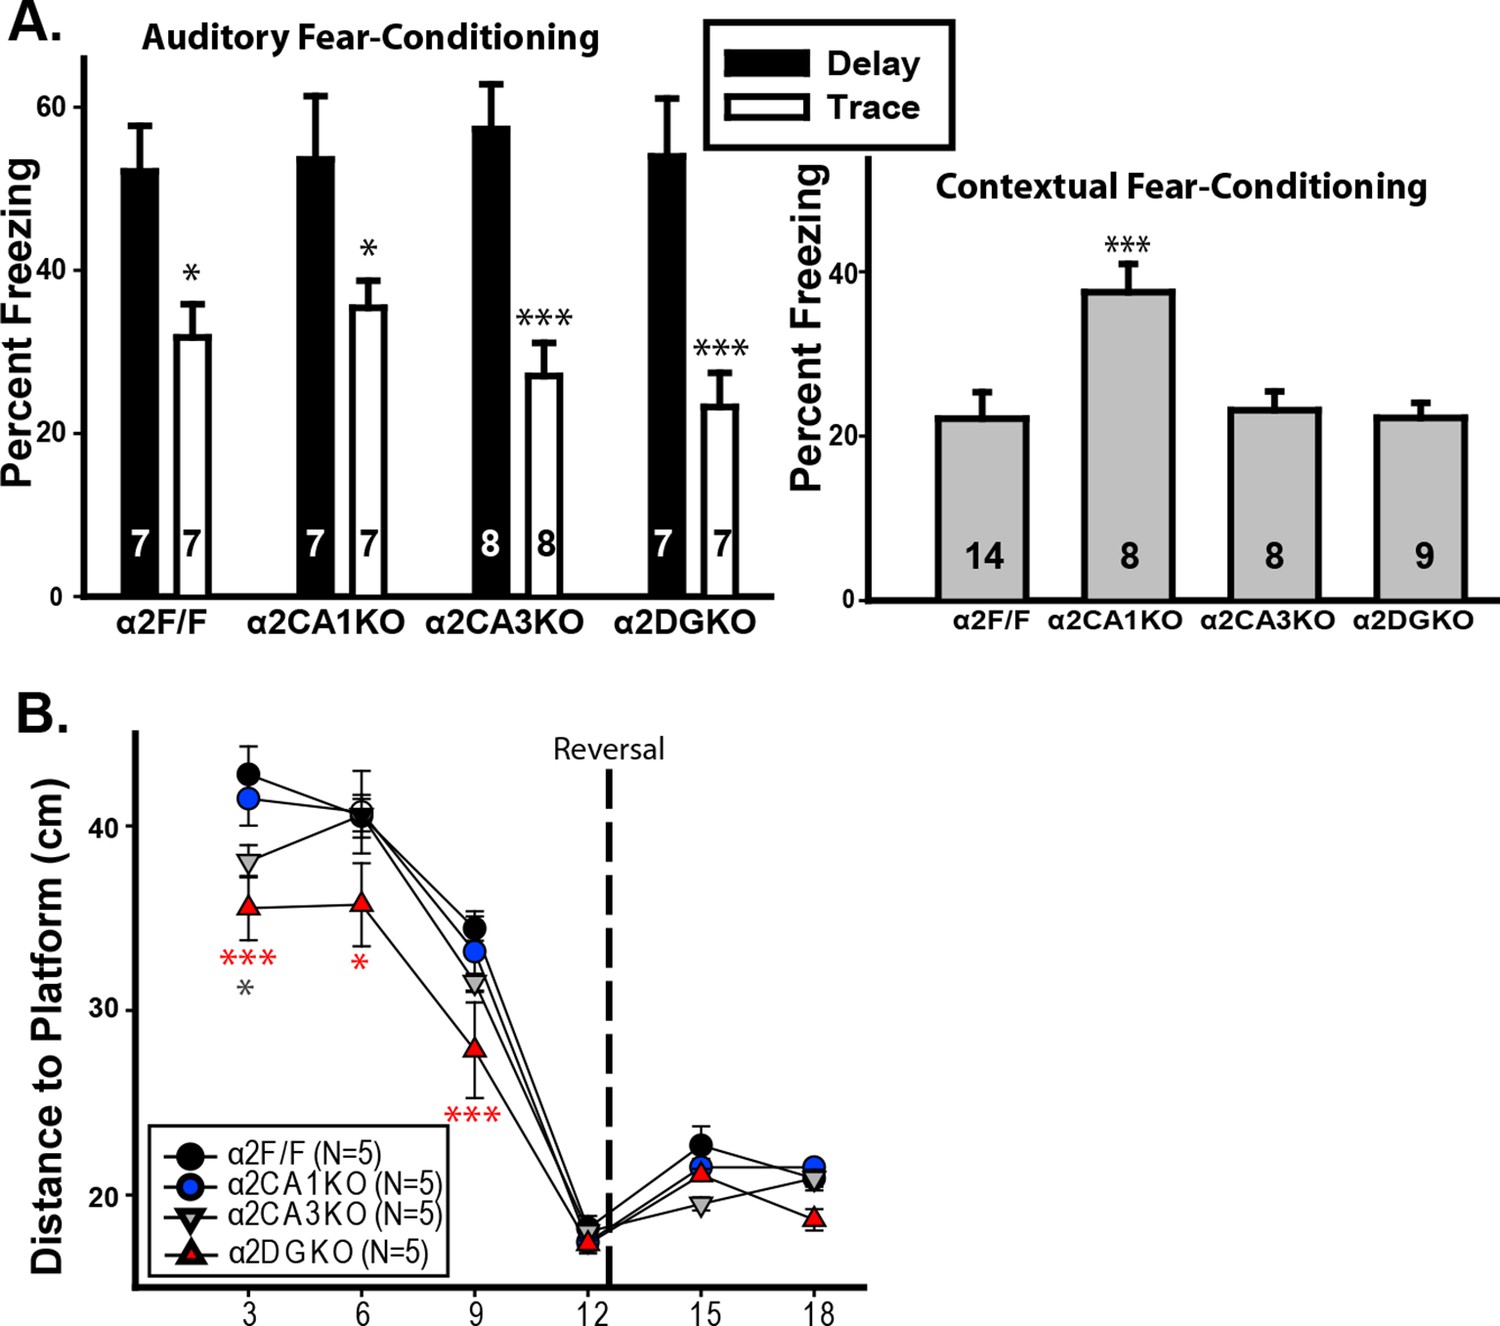
Tests of hippocampal function.
(A) Mean ( ± S.E.M.) percentage of time spent freezing during the tone 24 hr after auditory fear-conditioning using a delay (black) or trace (white) protocol.*p<0.05, ***p<0.001, different from the corresponding delay group. No significant differences were found in planned pair-wise comparisons of the genotypes within the trace-conditioned groups or within the delay-conditioned groups. (B) Mean ( ± S.E.M.) percentage of time spent freezing during re-exposure to the context 24 hr after contextual fear-conditioning. ***p<0.001, different from α2F/F. (C) Mean ( ± S.E.M.) distance to platform during probe trials. *p<0.05, ***p<0.001, different from α2F/F; gray: α2CA3KO, red: α2DGKO.
Figure 2 with 1 supplement
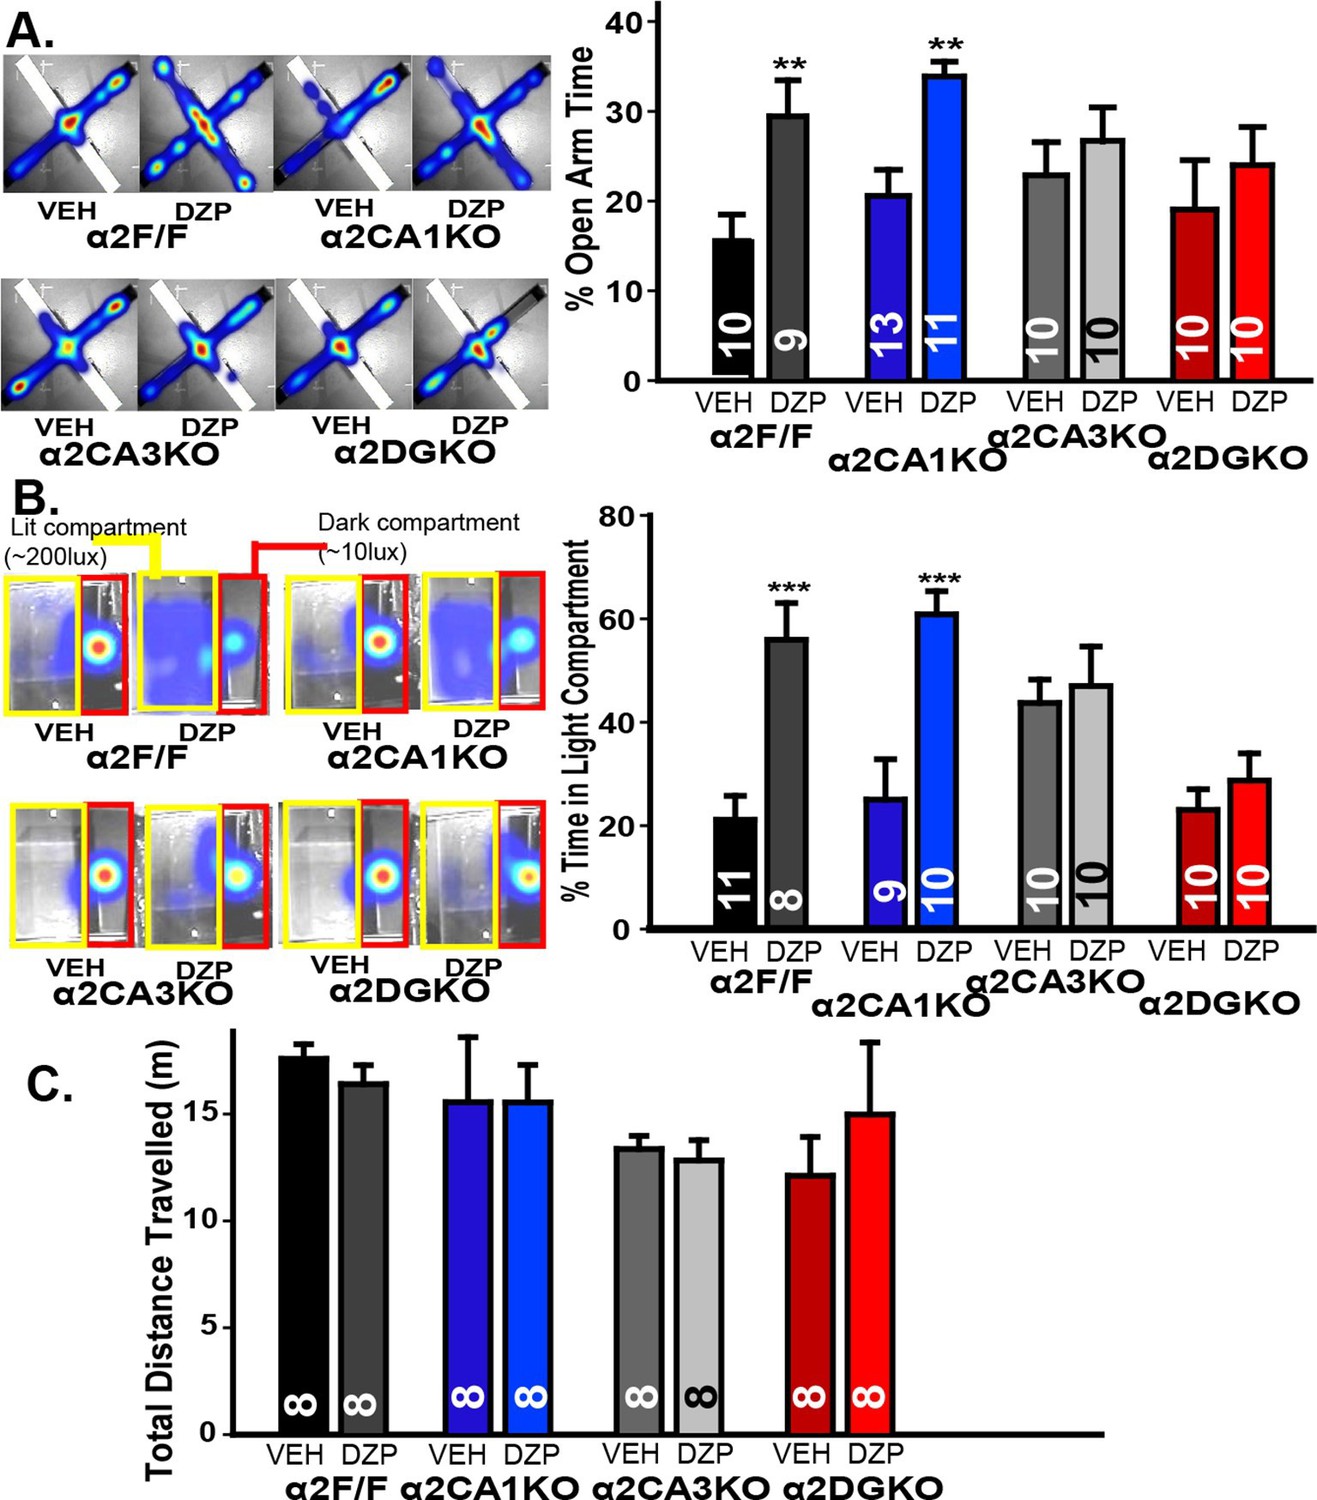
Behavioral tests of anxiety and locomotor activity.
(A) Left: Activity heat maps on the EPM of representative α2F/F, α2CA1KO, α2CA3KO and α2DGKO mice treated with vehicle or diazepam. Right: Percentage (Mean ± S.E.M.) of time spent in the open arms of the EPM. (B) Left: Activity heat maps on the LDB of representative α2F/F, α2CA1KO, α2CA3KO and α2DGKO mice treated with vehicle or diazepam. The dark (red) and lit (yellow) compartments of the box are outlined for ease of visualization. Right: Percentage (Mean ± S.E.M.) of time spent in the lit compartment of the LDB. (C) Mean ( ± S.E.M.) distance travelled in the open field.
-
Figure 2—source data 1
Raw data for elevated plus maze and light/dark box figures.
- https://doi.org/10.7554/eLife.14120.011
Figure 2—figure supplement 1
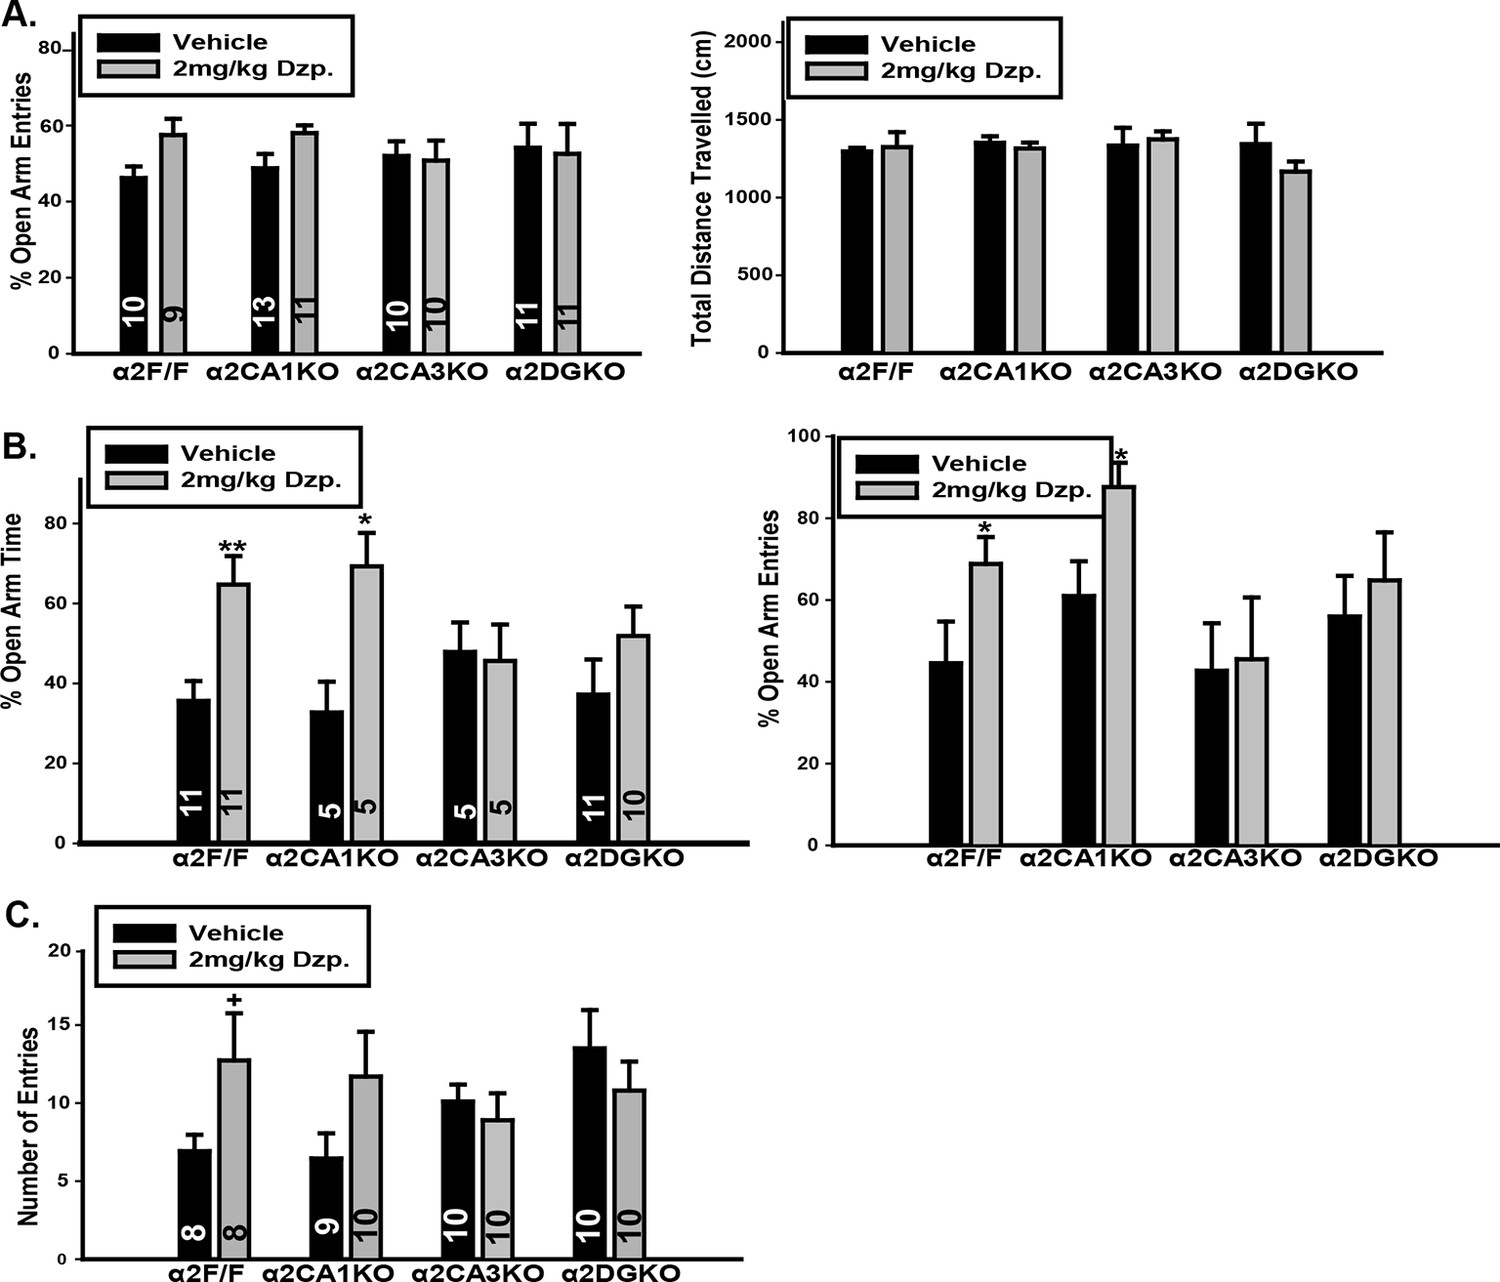
Additional measures in tests of anxiety-like behavior.
(A) Left: Percentage of entries into the open arms in elevated plus maze in F/F control, α2CA1KO, α2CA3KO and α2DGKO mice bred on the C57BL/6J background. Right: Total distance travelled in the elevated plus maze. (B) Left: Percentage of time spent in the open arms, Right: Percentage of entries into the open arms in F/F control, α2CA1KO, α2CA3KO and α2DGKO mice bred on the 129x1/SvJ background. (C) Number of entries into the light compartment in light/dark box in F/F control, α2CA1KO, α2CA3KO and α2DGKO mice bred on the 129×1/SvJ background. +p<0.06, *p<0.05, **p<0.01 in comparison to the corresponding vehicle group.
Figure 3 with 1 supplement
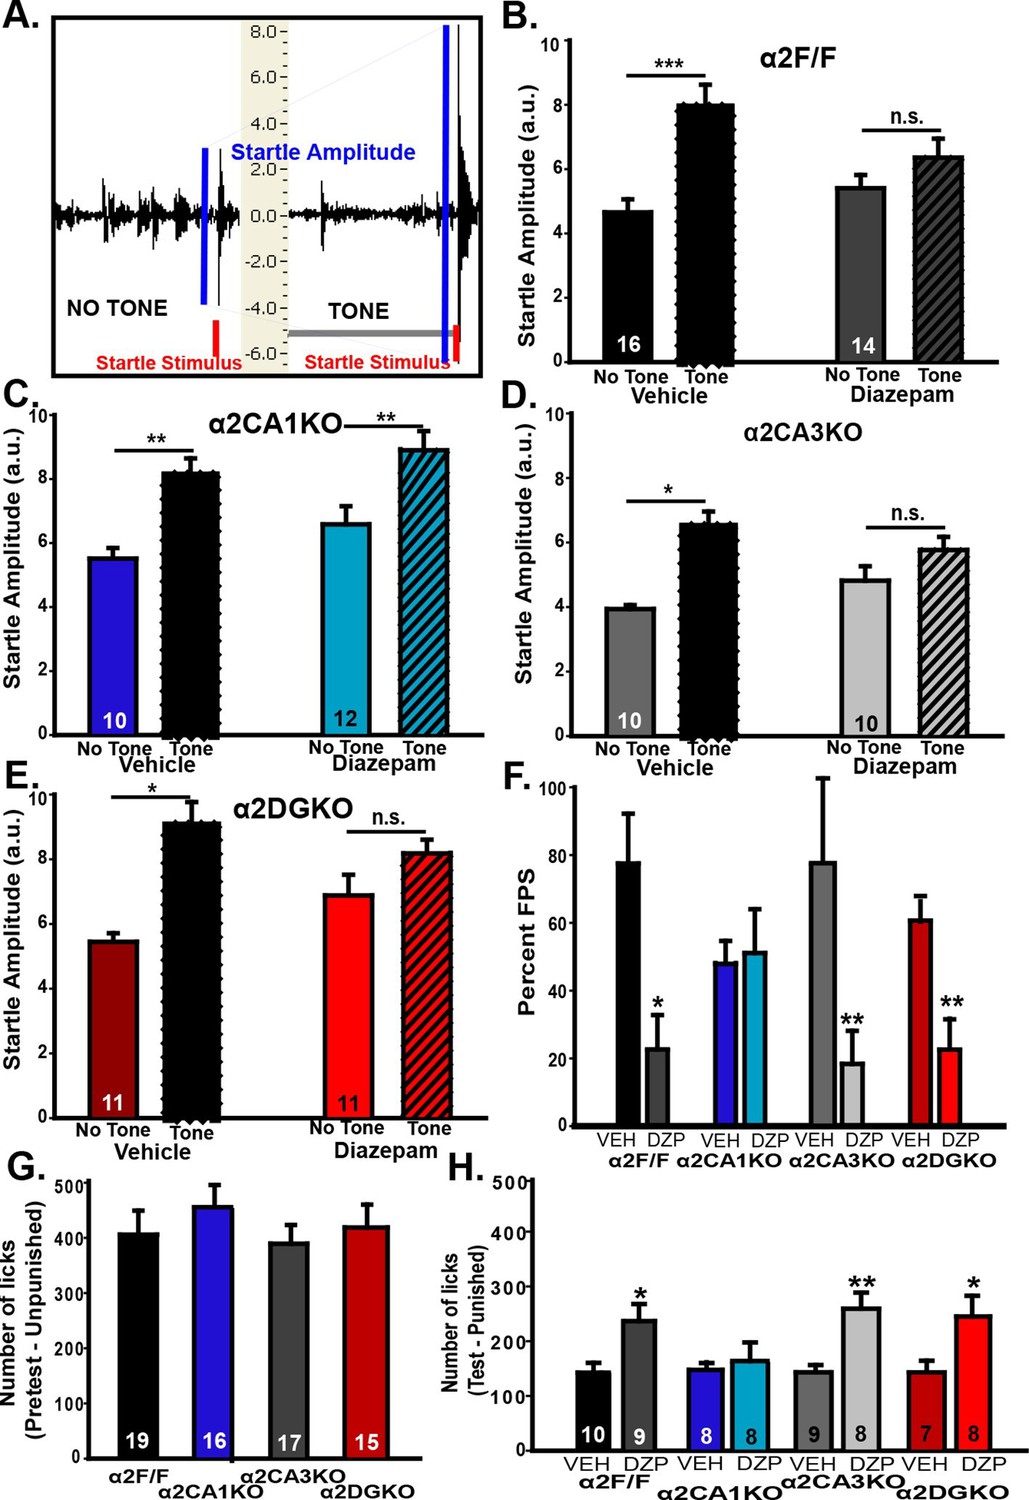
Behavioral tests of fear.
(A) Representative recordings of “Startle Stimulus Only” and “Tone + Startle Stimulus” trials in a α2F/F control mouse treated with vehicle. The increased startle amplitude in “Tone + Startle” trials represents fear-potentiation of the startle response. (B-E) Mean ( ± S.E.M.) startle amplitude in “No Tone” and “Tone” startle trials in vehicle and diazepam-treated (B) α2F/F, (C) αCA1KO, (D) α2CA3KO, (E) α2DGKO mice. (F) Mean ( ± S.E.M.) percent FPS in trials preceded by the tone. Asterisks represent significant difference from the corresponding vehicle group. (G) Mean ( ± S.E.M.) number of licks recorded in the pretest session of the VCT where drinking is not punished (This session does not involve drug administration). (H) Mean ( ± S.E.M.) number of licks recorded in the test session where every 20th lick is punished in vehicle- or diazepam-treated mice. Asterisks represent significant difference from the corresponding vehicle group. *p<0.05, **p<0.01, ***p<0.001.
-
Figure 3—source data 1
Raw data for fear-potentiated startle and Vogel conflict test figures.
- https://doi.org/10.7554/eLife.14120.015
Figure 3—figure supplement 1

Additional measures in tests of fear-related behavior.
(A-D) Mean (± S.E.M.) startle amplitude in response to different intensities of white noise bursts measured in arbitrary units based on the displacement of load cells during the first three days (Habituation sessions) of the FPS experiment in (A) α2F/F, (B) α2CA1KO, (C) α2CA3KO, (D) α2DGKO mice. (E) Mean ( ± S.E.M.) shock sensitivity measured by the average motion registered during 0.4 mA shocks. (F) Mean ( ± S.E.M.) number of unpunished licks on test day in vehicle- and diazepam-treated α2F/F control mice.
Figure 4 with 1 supplement
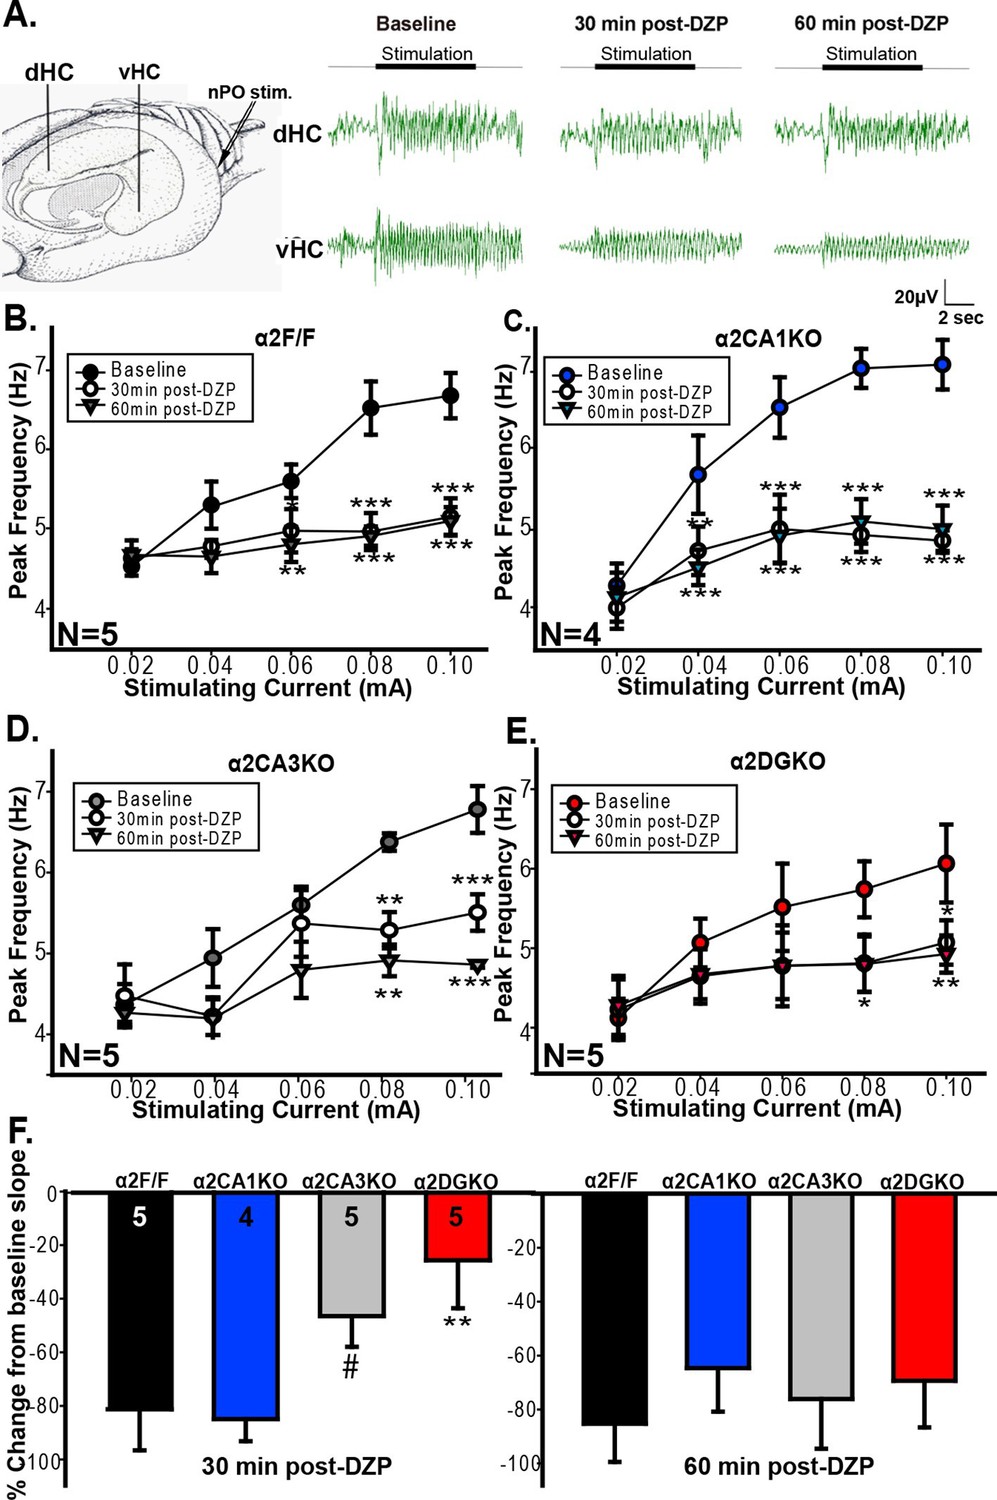
Evoked theta oscillations in the vHPC.
(A) Stimulation and recording sites and representative traces showing vHPC theta activity before and after diazepam injection in a α2F/F mouse. (B-E) Mean ( ± S.E.M.) peak frequency in the theta range at different stimulation intensities before (Baseline), and 30 min (30min post-DZP) and 60 min (60min post-DZP) following diazepam injection in (B) α2F/F, (C) α2CA1KO, (D) α2CA3KO, (E) α2DGKO mice. Asterisks represent significant difference from the baseline at the given stimulating current, with top ones for 30 min and the lower ones for 60 min post-injection. (F) Change from baseline slope in the stimulation intensity – peak frequency function 30 min (left) or 60 min following diazepam injection.#p<0.09, *p<0.05, **p<0.01, ***p<0.001 compared to corresponding α2F/F group.
-
Figure 4—source data 1
Raw data for peak frequency and stimulation intensity – peak frequency slope figures.
- https://doi.org/10.7554/eLife.14120.019
Figure 4—figure supplement 1

Frequency and power of theta range oscillations.
A-D Mean ( ± S.E.M.) peak frequency in the theta range in dHPC recorded before, 30min after and 60min after diazepam administration in (A) α2F/F, (B) α2CA1KO, (C) α2CA3KO, (D) α2DGKO mice.**p<0.01, ***p<0.001 compared to pre-diazepam baseline at the given stimulating current. (E) Mean ( ± S.E.M.) change from baseline slope in the stimulation intensity – peak frequency function for dHPC recordings 30 min (left) or 60 min following diazepam injection,*p<0.05 compared to corresponding α2F/F group. (F) Mean ( ± S.E.M.) theta power in the vHPC normalized to baseline power 60 min following diazepam injection. (G) Same as F for dHPC recordings. *p<0.05 compared to corresponding α2F/F group.
Tables
Table 1
Results of omnibus statistical tests of experiments for the general characterization of α2CA1KO, α2CA3KO and α2DGKO mice.
| 1. Immunohistochemistry | ||||||
| One-Way ANOVA; Factor: Genotype | ||||||
| α2 Subunit | α1 Subunit | α5 Subunit | ||||
| CA1 | F(3,10)=9.44 | P=0.003 | F(3,9)=0.08 | p=0.97 | F(3,9)=0.10 | p=0.96 |
| CA3 | F(3,10)=5.05 | P=0.02 | F(3,9)=0.01 | p=0.99 | F(3,9)=0.13 | p=0.94 |
| DG | F(3,10)=9.08 | P=0.003 | F(3,9)=0.00 | p=1.00 | F(3,9)=0.06 | p=0.98 |
| Cortex | F(3,10)=1.90 | p=0.19 | F(3,9)=0.01 | p=0.83 | F(3,9)=0.01 | p=0.99 |
| Amygdala | F(3,10)=1.28 | p=0.34 | F(3,9)=0.21 | p=0.89 | F(3,9)=0.36 | p=0.78 |
| 2. Quantitative PCR | ||||||
| One-Way ANOVA; Factor: Genotype | ||||||
| α2 Subunit | α3 Subunit | α4 Subunit | ||||
| CA1 | F(3,16)=10.66 | p<0.001 | F(3,16)=0.10 | p=0.96 | F(3,16)=2.48 | p=0.1 |
| CA3 | F(3,16)=10.53 | p<0.001 | F(3,16)=0.67 | p=0.58 | F(3,16)=4.74 | p=0.02 |
| DG | F(3,16)=7.32 | p=0.003 | F(3,12)=1.96 | p=0.17 | F(3,12)=2.90 | p=0.08 |
| Cortex | F(3,16)=15.69 | p<0.001 | ||||
| Amygdala | F(3,16)=3.01 | p=0.06 | ||||
| 3. Slice Electrophysiology | ||||||
| Two-Way Mixed Factorial ANOVA; Factors: Genotype (between-subjects), Drug (within-subjects) | ||||||
| CA1 | Amplitude | Frequency | Decay Time | |||
| Genotype | F(1,38)=1.83 | p=0.18 | F(1,38)=2.80 | p=0.10 | F(1,38)=1.94 | p=0.17 |
| Drug | F(1,38)=1.49 | p=0.23 | F(1,38)=9.38 | p=0.004 | F(1,38)=107.96 | p<0.001 |
| Genotype x Drug Interaction | F(1,38)=2.91 | p=0.09 | F(1,38)=3.11 | p=0.08 | F(1,38)=0.82 | p=0.37 |
| CA3 | Amplitude | Frequency | Decay Time | |||
| Genotype | F(1,21)=2.36 | p=0.14 | F(1,21)=1.85 | p=0.19 | F(1,21)=0.95 | p=0.34 |
| Drug | F(1,21)=0.66 | p=0.42 | F(1,21)=0.09 | p=0.77 | F(1,21)=30.54 | p<0.001 |
| Genotype x Drug Interaction | F(1,21)=0.21 | p=0.65 | F(1,21)=1.90 | p=0.18 | F(1,21)=0.25 | p=0.62 |
| DG | Amplitude | Frequency | Decay Time | |||
| Genotype | F(1,21)=1.50 | p=0.23 | F(1,21)=1.58 | p=0.22 | F(1,21)=0.01 | p=0.91 |
| Drug | F(1,21)=2.58 | p=0.12 | F(1,21)=1.58 | p=0.22 | F(1,21)=47.42 | p<0.001 |
| Genotype x Drug Interaction | F(1,21)=0.54 | p=0.47 | F(1,21)=1.33 | p=0.26 | F(1,21)=0.30 | p=0.59 |
| 4. Tests of Hippocampal Function | ||||||
| Delay – Trace Fear Conditioning | ||||||
| Two-Way Factorial ANOVA; Factors: Genotype (between-subjects), Condition (between-subjects) | ||||||
| % Freezing | ||||||
| Genotype | F(3,49)=0.38 | p=0.77 | ||||
| Condition | F(1,49)=41.57 | p<0.001 | ||||
| Genotype x Cond. Interaction | F(3,49)=0.71 | p=0.55 | ||||
| Contextual Fear Conditioning | ||||||
| One-Way ANOVA; Factor: Genotype (between-subjects) | ||||||
| % Freezing | ||||||
| Genotype | F(3,35)=5.47 | p=0.003 | ||||
| Morris Water Maze | ||||||
| Two-Way Factorial ANOVA; Factors: Genotype (between-subjects), Day (within-subjects) | ||||||
| Time to platform | ||||||
| Genotype | F(3,80)=5.17 | p=0.01 | ||||
| Day | F(5,80)=244.12 | p<0.001 | ||||
| Genotype x Day Interaction | F(5,80)=1.36 | p=0.19 | ||||
Table 2
Results of omnibus statistical tests of measured parameters in behavioral tests of anxiety and general locomotion.
| 1. Elevated Plus Maze (C57BL/6J) | ||||||
| Two-Way Factorial ANOVA; Factors: Genotype (between-subjects), Drug (between-subjects) | ||||||
| % Open Arm Time | % Open Arm Entries | Distance Travelled | ||||
| Genotype | F(3,75)=1.41 | p=0.25 | F(3,75)=0.13 | p=0.94 | F(3,75)=0.85 F(3, 69) = 1.11 | p=0.47 |
| Drug | F(1,75)=16.48 | p<0.001 | F(3,75)=2.33 | p=0.13 | F(3,75)=0.61 | p=0.44 |
| Genotype x Drug Interaction | F(3,63)=1.54 | p=0.21 | F(3,75)=1.47 | p=0.23 | F(3,75)=1.13 | p=0.34 |
| 1’. Elevated Plus Maze (129X1/SvJ) | ||||||
| Two-Way Factorial ANOVA; Factors: Genotype (between-subjects), Drug (between-subjects) | ||||||
| % Open Arm Time | % Open Arm Entries | Distance Travelled | ||||
| Genotype | F(3,55)=0.17 | p=0.92 | F(3,55)=1.59 | p=0.20 | F(3,55)=1.17 | p=0.33 |
| Drug | F(1,55)=11.49 | P=0.001 | F(1,55)=3.4649 | p=0.07 | F(1,55)=1.28 | p=0.29 |
| Genotype x Drug Interaction | F(3,55)=2.28 | p=0.09 | F(3,55)=0.50 | p=0.69 | F(3,55)=0.82 | p=0.49 |
| 2. Light / Dark Box | ||||||
| Two-Way Factorial ANOVA; Factors: Genotype (between-subjects), Drug (between-subjects) | ||||||
| % Time in Light | Entries to Light | |||||
| Genotype | F(3,73)=5.03 | p=0.003 | F(3,73)=0.84 | p=0.48 | ||
| Drug | (F(1,73)=26.00 | p<0.001 | F(1,73)=1.45 | p=0.23 | ||
| Genotype x Drug Interaction | F(3,73)=5.53 | p=0.002 | F(3,73)=2.17 | p=0.09 | ||
| 3. Open Field | ||||||
| Two-Way Factorial ANOVA; Factors: Genotype (between-subjects), Drug (between-subjects) | ||||||
| Distance Travelled | ||||||
| Genotype | F(3,56)=1.78 | p=0.16 | ||||
| Drug | F(1,56)=0.04 | p=0.84 | ||||
| Genotype x Drug Interaction | F(3,56)=0.43 | p=0.73 | ||||
Table 3
Results of omnibus statistical tests of measured parameters in behavioral tests of fear.
| 1. Fear-Potentiated Startle | ||||
|---|---|---|---|---|
| Within-Genotype Comparisons | ||||
| Two-Way Factorial ANOVA; Factors: Tone/No Tone (within-subjects), Drug (between-subjects) | ||||
| α2F/F | α2CA1KO | |||
| Tone | F(1,28)=33.75 | p<0.001 | F(1,20)=49.17 | p<0.001 |
| Drug | F(1,28)=0.30 | p=0.59 | F(1,20)=0.51 | p=0.48 |
| Tone x Drug Interaction | F(1,28)=9.95 | p=0.004 | F(1,20)=0.02 | P=0.89 |
| α2CA3KO | α2DGKO | |||
| Tone | F(1,18)=16.60 | p<0.001 | F(1,20)=54.46 | p<0.001 |
| Drug | F(1,18)=0.09 | p=0.77 | F(1,20)=0.73 | p=0.40 |
| Tone x Drug Interaction | F(1,18)=5.16 | p=0.04 | F(1,20)=10.24 | p=0.01 |
| Between-Genotype Comparisons | ||||
| Two-Way Factorial ANOVA; Factors: Genotype (between-subjects), Drug (between-subjects) | ||||
| % FPS | ||||
| Genotype | F(3,86)=1.17 | p=0.91 | ||
| Drug | F(1,86)=16.69 | p<0.001 | ||
| Genotype x Drug Interaction | F(3,86)=2.44 | p=0.07 | ||
| 2. Vogel Conflict Test | ||||
| Pretest (Unpunished) Drinking | ||||
| One-Way ANOVA; Factor: Genotype (between-subjects) | ||||
| Number of licks | ||||
| Genotype | F(3,63)=0.63 | p=0.60 | ||
| Test (Punished) Drinking | ||||
| Two-Way Factorial ANOVA; Factors: Genotype (between-subjects), Drug (between-subjects) | ||||
| Number of licks | ||||
| Genotype | F(3,59)=1.00 | p=0.40 | ||
| Drug | F(1,59)=14.57 | p<0.001 | ||
| Genotype x Drug Interaction | F(3,59)=1.21 | p=0.31 | ||
Table 4
Omnibus statistical tests of measured parameters in in vivo LFP recordings collected from ventral and dorsal hippocampus.
| VENTRAL HIPPOCAMPUS | ||||
|---|---|---|---|---|
| 1. Peak Theta Frequency | ||||
| Two-Way ANOVA; Factors: Stimulation intensity (within-subjects), Time before/after drug (within-subjects) | ||||
| α2F/F | α2CA1KO | |||
| Stimulation intensity | F(4,32)=9.13 | p<0.001 | F(4,24)=18.12 | p<0.001 |
| Time after drug | F(2,32)=22.98 | p<0.001 | F(2,24)=37.01 | p<0.001 |
| Stimulation x Time | F(8, 32)=4.27 | p<0.001 | F(8,24)=9.07 | p<0.001 |
| α2CA3KO | α2DGKO | |||
| Stimulation intensity | F(4,32)=8.14 | p<0.001 | F(4,32)=3.84 | P=0.02 |
| Time after drug | F(2,32)=6.14 | P=0.02 | F(2,32)=2.47 | P=0.15 |
| Stimulation x Time | F(8, 32)=3.14 | P=0.01 | F(8, 32)=6.63 | p<0.001 |
| 2. Stimulation Intensity – Theta Frequency Slope | ||||
| One-Way ANOVA; Factor: Genotype (between-subjects) | ||||
| 30min post-diazepam | 60min post-diazepam | |||
| Genotype | F(3,15)=3.94 | p=0.03 | F(3,73)=0.84 | p=0.48 |
| 3. Normalized Power | ||||
| One-Way ANOVA; Factor: Genotype (between-subjects) | ||||
| 60min post-diazepam | ||||
| Genotype | F(3,15)=4.65 | p=0.02 | ||
| DORSAL HIPPOCAMPUS | ||||
| 4. Peak Theta Frequency | ||||
| Two-Way ANOVA; Factors: Stimulation intensity (within-subjects), Time before/after drug (within-subjects) | ||||
| α2F/F | α2CA1KO | |||
| Stimulation intensity | F(4,32)=8.19 | p<0.001 | F(4,32)=5.29 | p=0.01 |
| Time after drug | F(2,32)=31.65 | p<0.001 | F(2,32)=3.03 | p<0.11 |
| Stimulation x Time | F(8,32)=8.87 | p=0.003 | F(8,32)=1.89 | p=0.10 |
| α2CA3KO | α2DGKO | |||
| Stimulation intensity | F(4,40)=19.19 | p<0.001 | F(4,32)=8.86 | p<0.001 |
| Time after drug | F(2,40)=27.08 | p<0.001 | F(2,32)=9.25 | p=0.01 |
| Stimulation x Time | F(8,40)=4.30 | p<0.001 | F(8,32)=2.39 | p=0.04 |
| 5. Stimulation Intensity – Theta Frequency Slope | ||||
| One-Way ANOVA; Factor: Genotype (between-subjects) | ||||
| 30min post-diazepam | 60min post-diazepam | |||
| Genotype | F(3,17)=2.97 | p=0.14 | F(3,17)=4.32 | p=0.02 |
| 6. Normalized Power | ||||
| One-Way ANOVA; Factor: Genotype (between-subjects) | ||||
| 60min post-diazepam | ||||
| Genotype | F(3,15)=1.02 | p=0.41 | ||
Download links
A two-part list of links to download the article, or parts of the article, in various formats.
Downloads (link to download the article as PDF)
Open citations (links to open the citations from this article in various online reference manager services)
Cite this article (links to download the citations from this article in formats compatible with various reference manager tools)
Modulation of anxiety and fear via distinct intrahippocampal circuits
eLife 5:e14120.
https://doi.org/10.7554/eLife.14120


