Peripheral optogenetic stimulation induces whisker movement and sensory perception in head-fixed mice
- Rutgers, The State University of New Jersey, United States
Figures
Figure 1 with 2 supplements
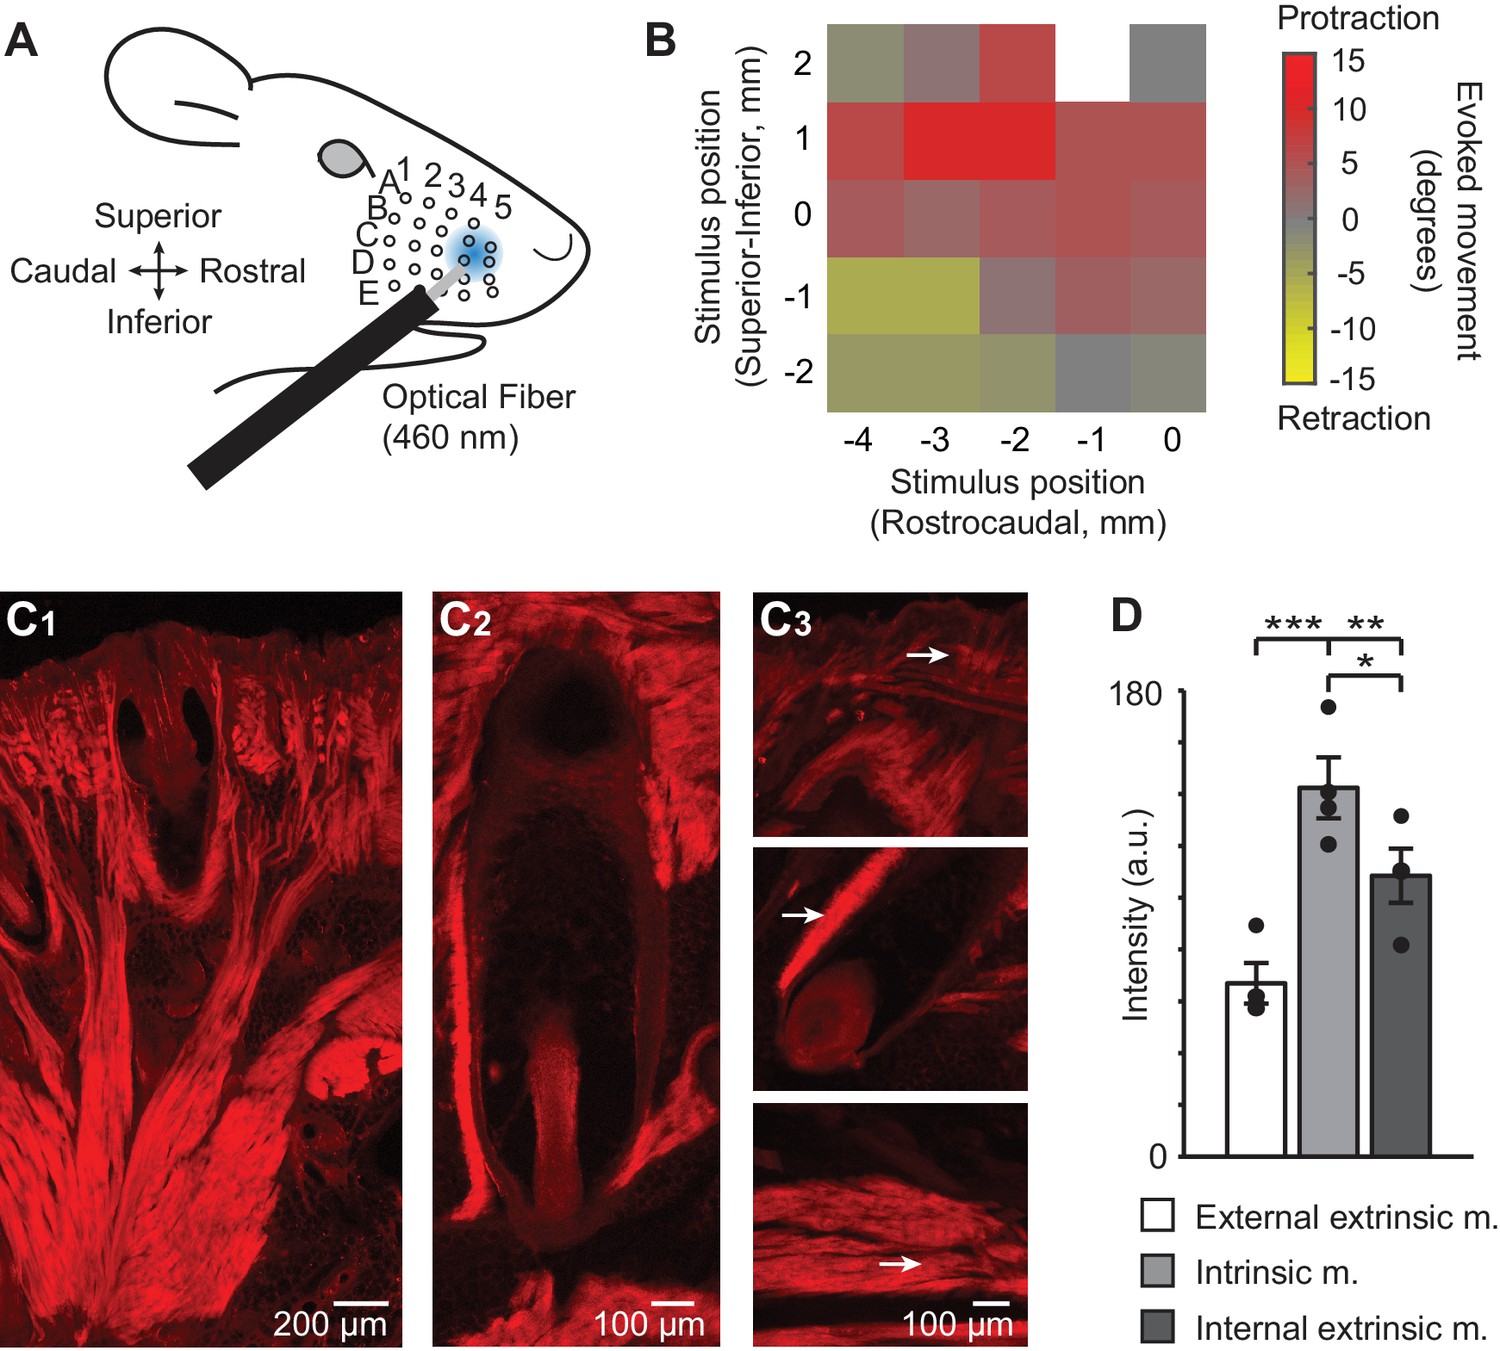
ChR2/tdTomato expression in whisker pad muscles and optical activation of whisker movements in Emx1-Cre;Ai27D mice.
(A) Illustration of experimental setup showing the position of 460 nm light spot on the whisker pad used for optogenetic stimulation. (B) Example color map from one mouse (isoflurane anesthesia, 0.8–1.5%) showing the direction of movement (rostral or caudal) of whisker B2 evoked by optogenetic whisker pad stimulation at different locations on the pad. The maximum amplitude of whisker movement in degrees is color coded for each position tested. White pixel indicates location with no measurement. Whisker protractions evoked by rostral optical stimulation were the focus of the present study. (C1) Intrinsic and extrinsic muscles of the whisker pad exhibit tdTomato fluorescence, as seen in histological sections. Photomicrographic montage of tdTomato fluorescence in a coronal section of the mystacial pad. Scale bar 200 µm. (C2) Photomicrographic montage of tdTomato fluorescence in a whisker follicle in a transverse section. Scale bar 100 µm. (C3) Representative photomicrographs of tdTomato fluorescence used for quantification (as in D). Arrows point to regions of quantification for the external extrinsic protractor muscles (top; pars maxillaris superficialis and pars maxillaris profunda of M. nasolabialis profundus), intrinsic follicular muscle (middle), and internal extrinsic retractor muscles (bottom; pars media superior and pars media inferior of M. nasolabialis profundus) following the terminology of Haidarliu et al., 2015. Scale bar 100 µm. (D) Summary of ChR2/tdTomato fluorescence intensity. Fluorescence intensity was lowest in external extrinsic muscle and highest in intrinsic muscle. Bars are mean ± SEM and individual data points are plotted. ***p<0.001, **p<0.01, *p<0.05.
Figure 1—figure supplement 1
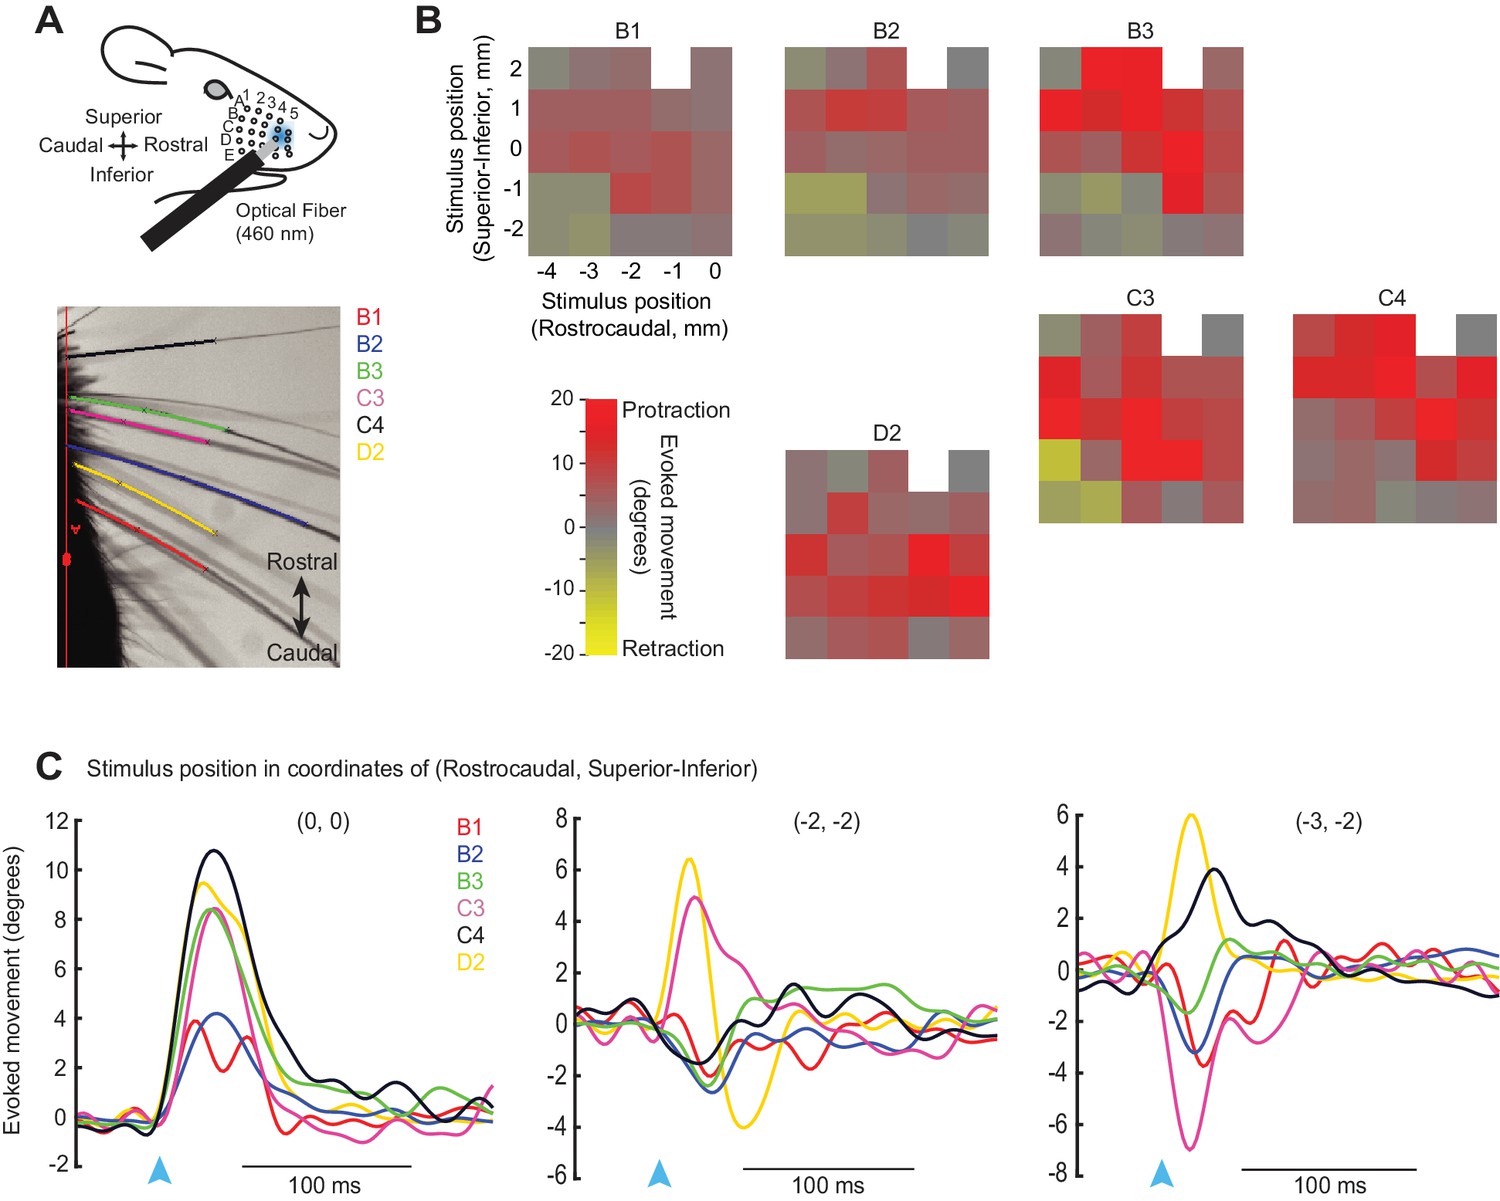
Analysis of retraction and protraction movements for individual whiskers.
(A) Schematic of experiment as in Figure 1, with video image of tracked whiskers. (B) Color maps showing the peak whisker movement evoked by a 20 ms, 460 nm light spot located at various positions on the whisker pad. For each colormap, the identity of the tracked whisker is indicated above. The origin (0, 0) was defined a rostral area near the C4/D4 whiskers that evoked reliable protractions; this site was used in most additional experiments in this study. Stimulation of caudal-inferior sites, on the other hand, evoked mixed movement types in different whiskers, evident as diverse (yellow/red) colors on the color maps. (C) Time courses of movements evoked for 6 tracked whiskers (B1, B2, B3, C3, C4, D2) at each of three stimulation sites on the whisker pad, including the rostral protraction area (0, 0) and two caudal-inferior areas [(-2, -2) and (-3, -2)]. Note that movements measured as near-zero for some whiskers at some sites (e.g., C4 at -2, -2) might result from co-contraction of different muscle types that cause opposing retractions and protractions.
Figure 1—figure supplement 2
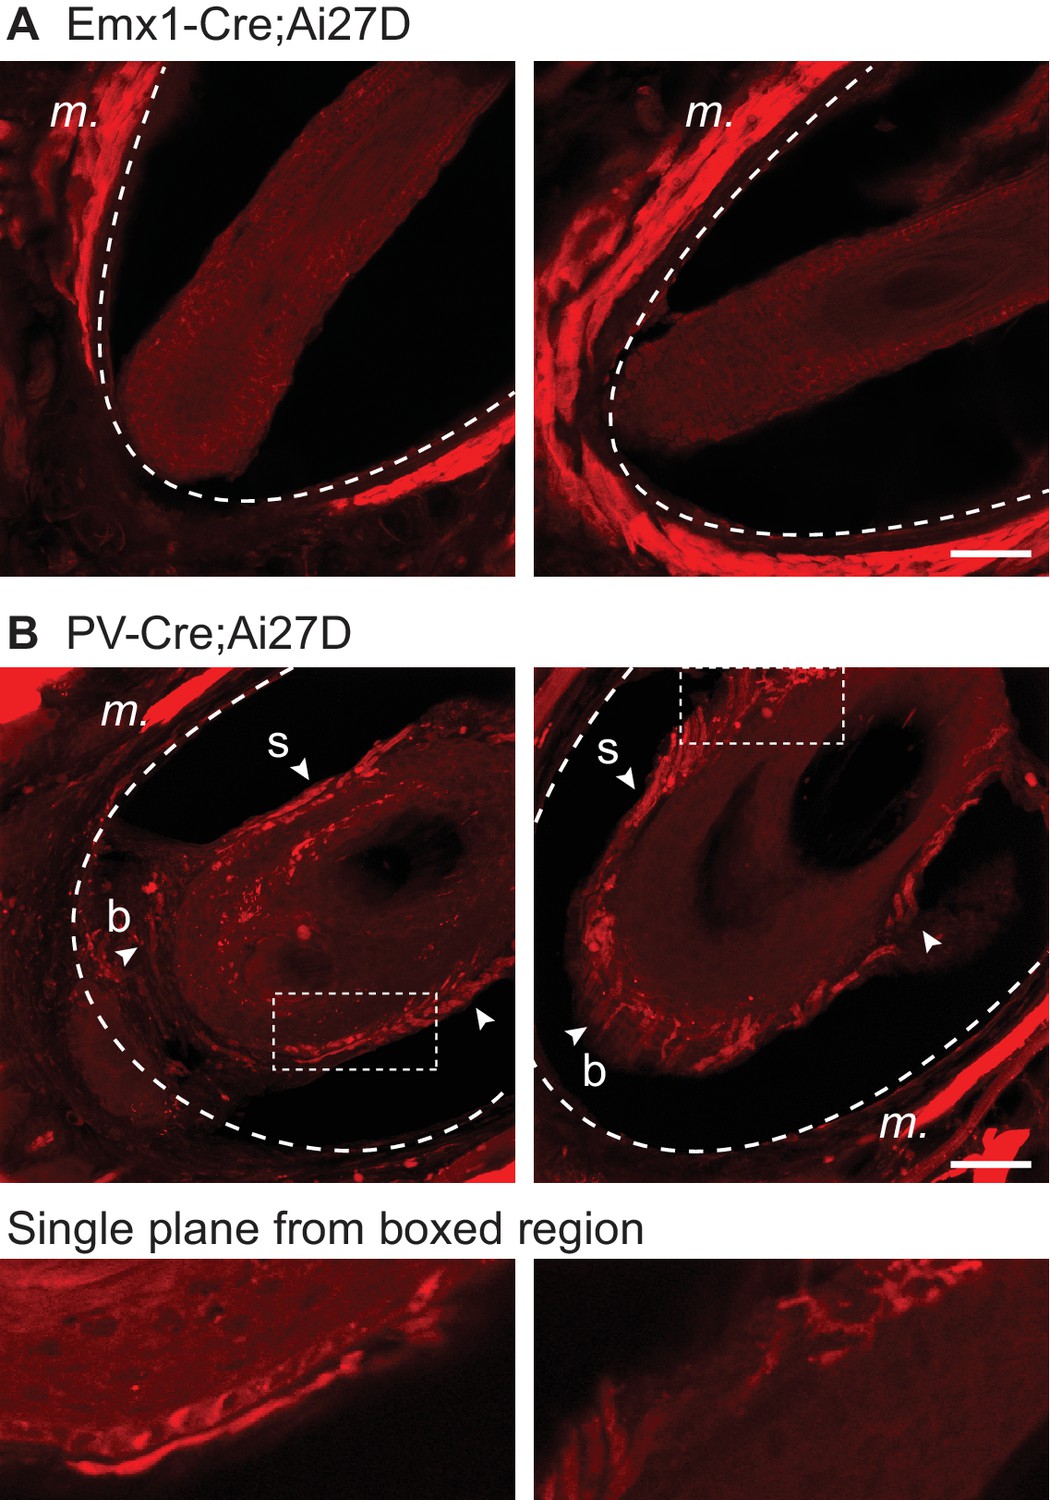
Absence of ChR2/tdTomato expression in vibrissal nerve fibers of EMX-cre;Ai27D mice.
(A) Example images of two whisker follicles in an Emx1-Cre;Ai27D mouse. Expression of ChR2/tdTomato was present in intrinsic muscle (m.) surrounding the follicle, but was not observed in nerve fibers innervating the follicle. (B).Example images of two whisker follicles in a parvalbumin (PV)-Cre;Ai27D mouse. In contrast to the Emx1 results, PV mice showed a profusion of ChR2/tdTomato expression in follicular nerves, consistent with previous results (Sakurai et al., 2013). Dotted curved lines indicate the interior or the cavernous sinus. Arrowheads indicate ChR2/tdTomato expression in nerve fibers and/or nerve endings at the whisker shaft (s) and base (b). Images below are from single focal planes (not z-projections) at boxed regions. Each image in A and B is a maximum z-projection of 20 focal planes at 1 µm spacing in coronal sections. Scale bar, 50 µm.
Figure 2
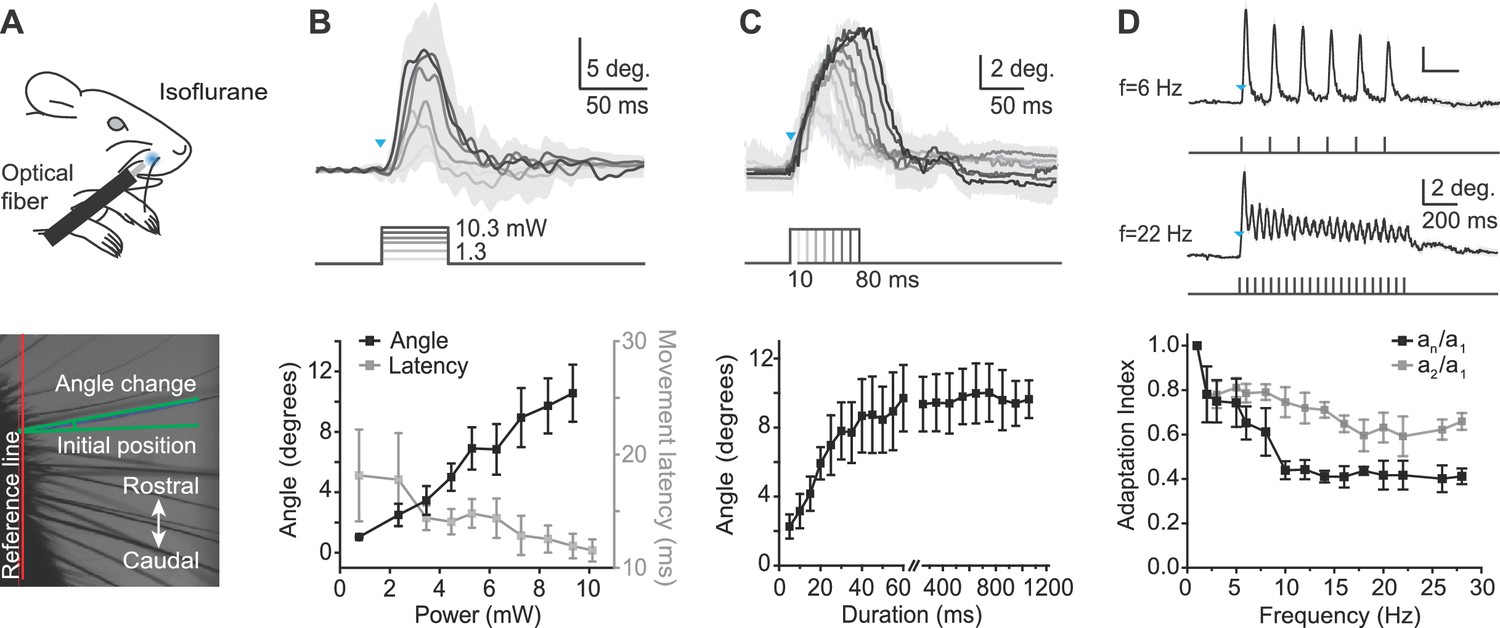
Characterization of whisker movements evoked by optogenetic whisker pad stimulation.
(A) Top: Illustration of experiment setup (isoflurane anesthesia, 0.8–1.5%). Rostral whisker pad illumination (460 nm) was used to evoke whisker protractions (positive angle values). Bottom: Image of whiskers under infrared illumination as used for whisker tracking. Angle changes of individual whiskers were measured relative to the initial position (green lines). (B) Relationship between light intensity and evoked whisker protractions. Top: Example traces from one mouse (mean ± SD of single trial for n = 4 whiskers). Blue triangle indicates the onset of the light stimulation. Intensities: 1.3, 3.1, 4.1, 6.5, 8.4, 10.3 mW. Duration of stimuli, 50 ms. Bottom: amplitude of evoked angle change (left axis) and movement latency (right axis) vs. light intensity (bin size, 1 mW; mean ± SEM; n = 4 mice). (C) Relationship between light duration and evoked whisker protractions. Top: Example traces from one mouse (mean ± SD of 10 trials). Blue triangles indicates the onset of the light stimulation. Durations: 10–80 ms at 9.94 mW intensity. Bottom: amplitude of evoked angle change vs. light duration (mean ± SEM; n = 4 mice; note gap in axis between 60 and 250 ms and difference in x-axis scaling for 5–60 ms and 250–1200 ms). (D) Adaptation of evoked whisker protractions to optical pulse frequency. Top: two example traces from one mouse at 6 Hz and 22 Hz stimulation (9.94 mW). Blue triangle indicates the onset of the light stimulation. Bottom: Adaptation indexes (black: an/a1, ratio of last to first response amplitude; gray, a2/a1, ratio of second to first response amplitude) plotted versus stimulus frequency (mean ± SEM; n=3 mice).
-
Figure 2—source data 1
Data for Figure 2B.
- https://doi.org/10.7554/eLife.14140.007
-
Figure 2—source data 2
Data for Figure 2C.
- https://doi.org/10.7554/eLife.14140.008
-
Figure 2—source data 3
Data for Figure 2D.
- https://doi.org/10.7554/eLife.14140.009
Figure 3
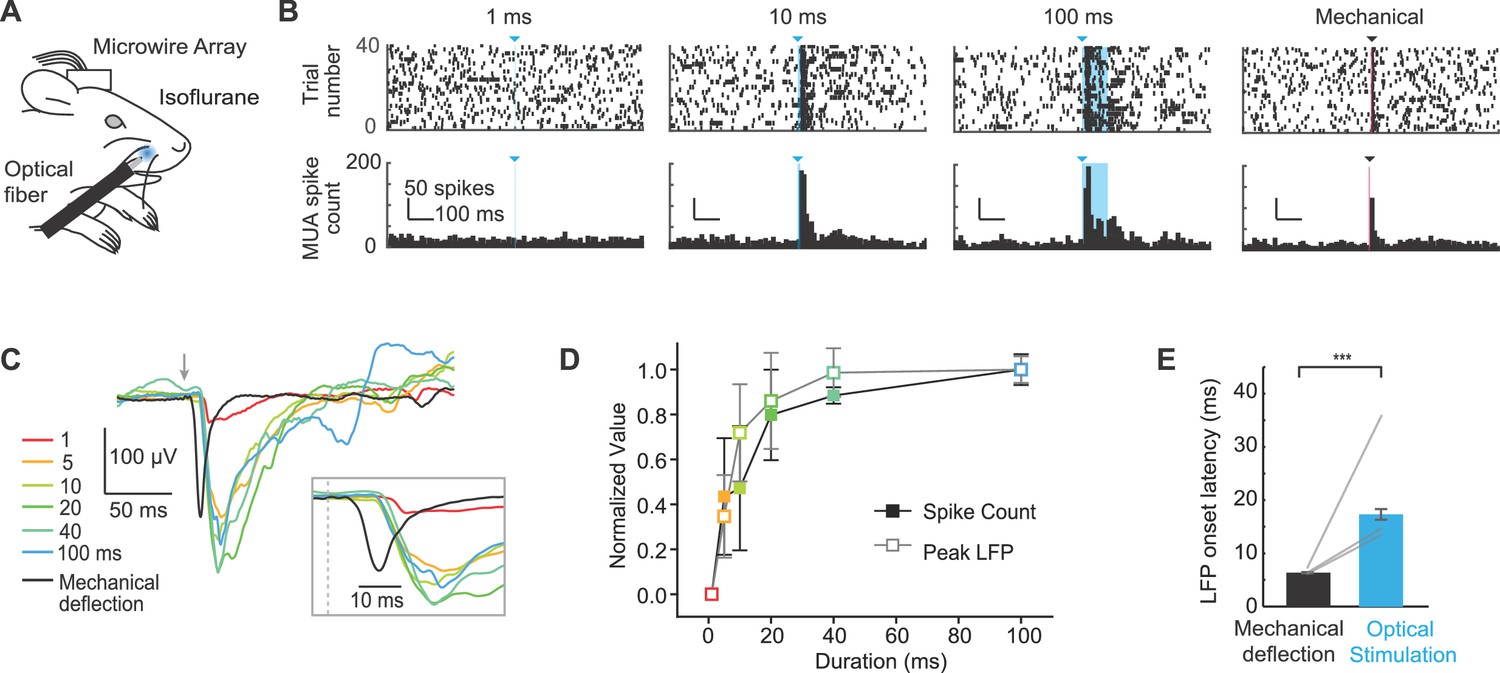
Extracellular recordings of S1 activity in response to optogenetic whisker pad stimulation.
(A) Illustration of experiment setup (isoflurane anesthesia, 0.8–1.5%), including chronically implanted microwire array. (B) Example peri-stimulus time histograms (PSTHs; bin size, 10 ms) for one mouse displayed ± 0.5 s relative to stimulation onset. Blue triangles and lines denote onset of 460 nm light stimulation; black triangle and line denotes onset of mechanical whisker stimulation. (C) Example local field potentials (LFPs) from one channel in response to optical whisker pad stimulation of various durations (1–100 ms) and mechanical stimulation of whisker C3. Each trace is the mean of 30 trials. (D) Peak LFP and maximum spike count (mean ± SEM, n = 3 mice), normalized to the maximum response for each channel. The channel that showed the largest response was selected from each mouse. (E) Comparison of LFP response latency for peripheral optical stimulation and mechanical whisker stimulation (shortest latency channel selected for each mouse). Bar graphs show mean (n = 3 mice) and lines connect individual subjects. Mean latency was 17.3 ± 1.0 ms (mean ± SEM) for 20–100 ms optical stimuli and 6.5 ± 0.1 ms (mean ± SEM) for mechanical whisker stimulation. ***p<0.001.
-
Figure 3—source data 1
Data for Figure 3D.
- https://doi.org/10.7554/eLife.14140.011
Figure 4
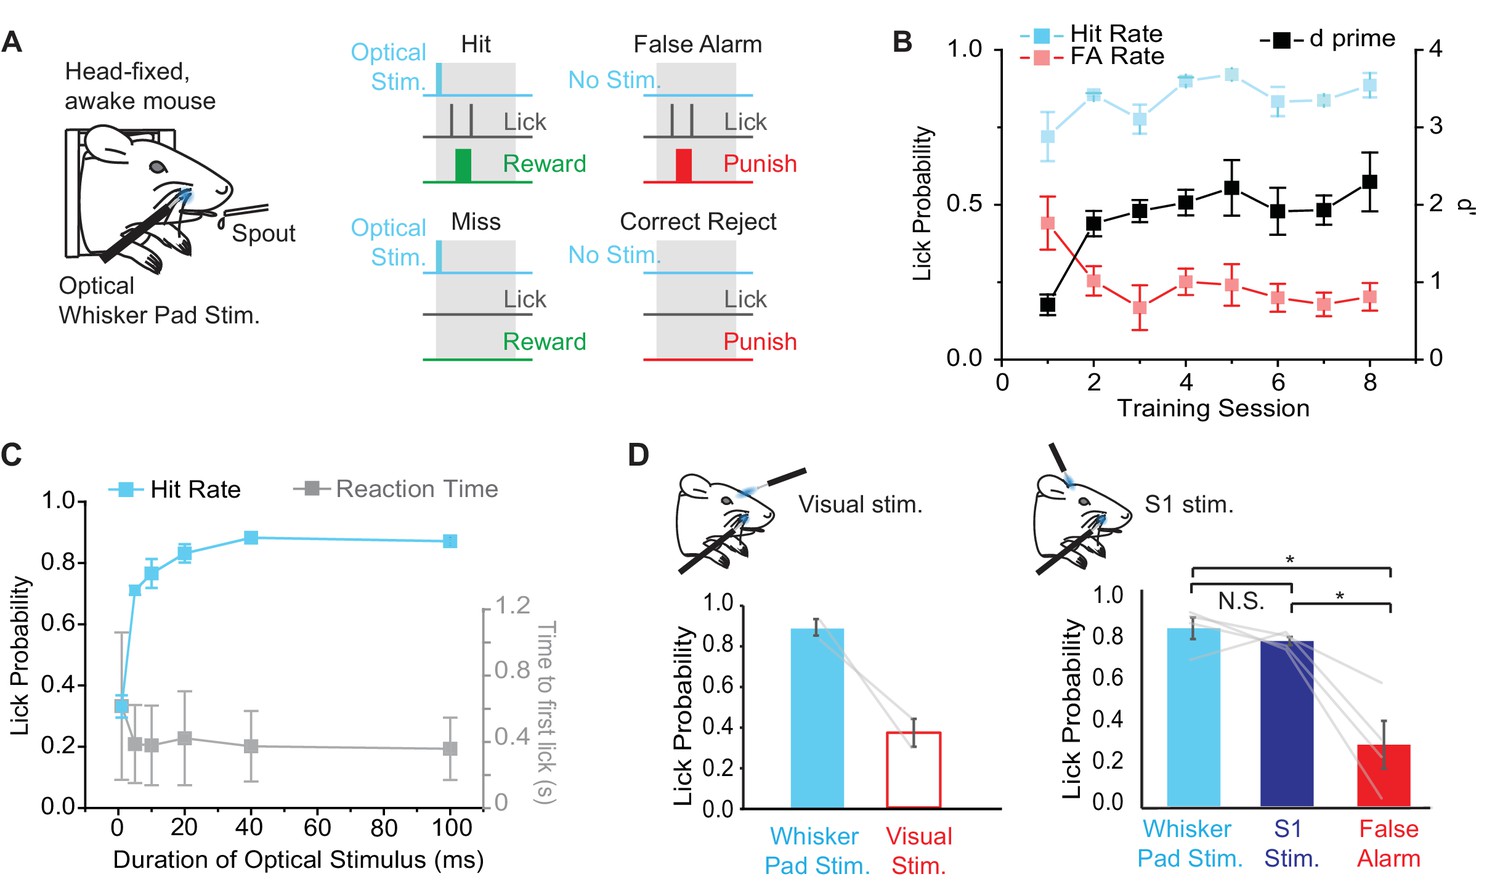
Behavioral performance in mice trained to detect optogenetic stimulation of the whisker pad.
(A) Illustration of the behavioral task. Water deprived, head-fixed mice were rewarded with water for licking within a 2 s response window (gray boxes) after optical stimulation (460 nm) of the rostral whisker pad (Hit trials). Licking in the absence of stimulation resulted in a False Alarm (FA) and punishment (tone and/or 2M salt water). (B) Changes in behavioral performance with training. A maintained Hit rate (blue) and reduced FA rate (red) accounted for the increase in performance (d’; black) over sessions (mean ± SEM, n = 4 mice). Note that learning curves for 2 of 4 mice are shown from the time of introduction of salt water punishment for FA and are aligned to first learning session (d’>1). (C) Dependence of Hit rate (left axis) and reaction time (right axis) on stimulation duration. In expert mice, optical whisker pad stimuli of various durations were included randomly on 10% of trials during behavioral sessions (mean ± SEM; n = 4 mice). (D) A second optical fiber delivered either visual stimulation (left) or S1 optogenetic stimulation (right) on a random 10% of trials (100 ms duration for all stimuli). Lick probability was reduced for visual stimuli (left), but not S1 stimulation (right). *p<0.05; N.S., not significant.
-
Figure 4—source data 1
Data for Figure 4B.
- https://doi.org/10.7554/eLife.14140.013
-
Figure 4—source data 2
Data for Figure 4C.
- https://doi.org/10.7554/eLife.14140.014
Videos
Video 1
Whisker movements in response to a light pulse at whisker pad position (0, 0), as in Figure 1—figure supplement 1.
The blue square at the upper right indicates the timing of optogenetic stimulation (20 ms, 460 nm). The original sampling rate of 500 frames per second was slowed to 25 frames per second for display.
Video 2
Whisker movements in response to a light pulse at whisker pad position (-3, -2), as in Figure 1—figure supplement 1.
The blue square at the upper right indicates the timing of optogenetic stimulation (20 ms, 460 nm). The original sampling rate of 500 frames per second was slowed to 25 frames per second for display.
Video 3
Whisker movements in response to a light pulse at whisker pad position (-2, -2), as in Figure 1—figure supplement 1.
The blue square at the upper right indicates the timing of optogenetic stimulation (20 ms, 460 nm). The original sampling rate of 500 frames per second was slowed to 25 frames per second for display.
Download links
A two-part list of links to download the article, or parts of the article, in various formats.
Downloads (link to download the article as PDF)
Open citations (links to open the citations from this article in various online reference manager services)
Cite this article (links to download the citations from this article in formats compatible with various reference manager tools)
Peripheral optogenetic stimulation induces whisker movement and sensory perception in head-fixed mice
eLife 5:e14140.
https://doi.org/10.7554/eLife.14140


