Cellular resolution circuit mapping with temporal-focused excitation of soma-targeted channelrhodopsin
- Max Planck Florida Institute for Neuroscience, United States
Figures
Figure 1 with 3 supplements
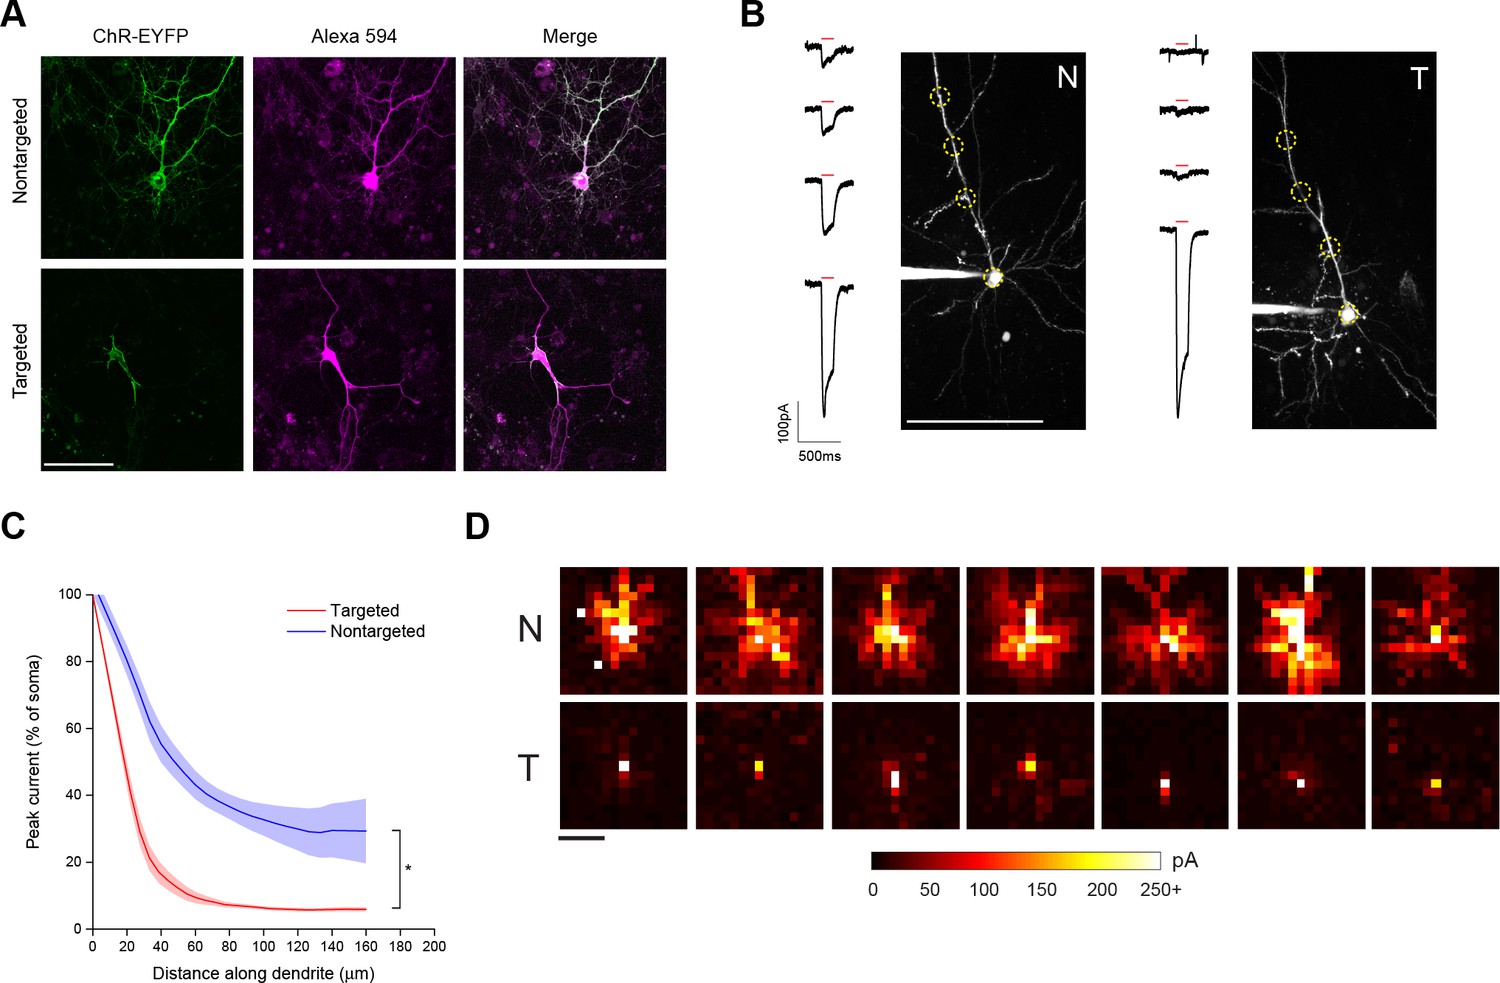
Characterization of soma-targeted channelrhodopsin (ChR2).
(A) Fluorescence of ChR2-EYFP (green) in live dissociated cortical neurons that had been patched and filled with Alexa 594 dye (magenta) as visualized by two-photon microscopy. Scale bar = 100 µm. (B) Representative two-photon maximum intensity projections of Alexa 594 fluorescence and current responses to a single 150 ms TF stimulation pulse (red bar) for patched and dye-filled pyramidal cells in acute slices expressing nontargeted (N) or targeted (T) ChR2. Scale bar = 100 µm. (C) Mean (solid lines) ± s.e.m. (shaded regions) for current responses to TF stimulation measured at specific points along a single dendrite (N=10 nontargeted cells and 13 targeted cells). Fitting each curve with an exponential function demonstrated that the nontargeted and targeted datasets were significantly different (*p<0.05 by F-test). (D) Maps of direct currents in representative cells expressing ChR2 constructs when stimulating a 15 × 15 grid of locations. Each pixel in a map represents the direct current observed in the patched cell when that location in the slice was stimulated. Each position in a map was stimulated with the minimum power that evoked action potentials in 10/10 trials when stimulation was applied to the soma. Currents evoked by such powers ranged from 20 to over 250 pA, as indicated by the scale at bottom. Scale bar at lower left = 100 µm.
Figure 1—figure supplement 1
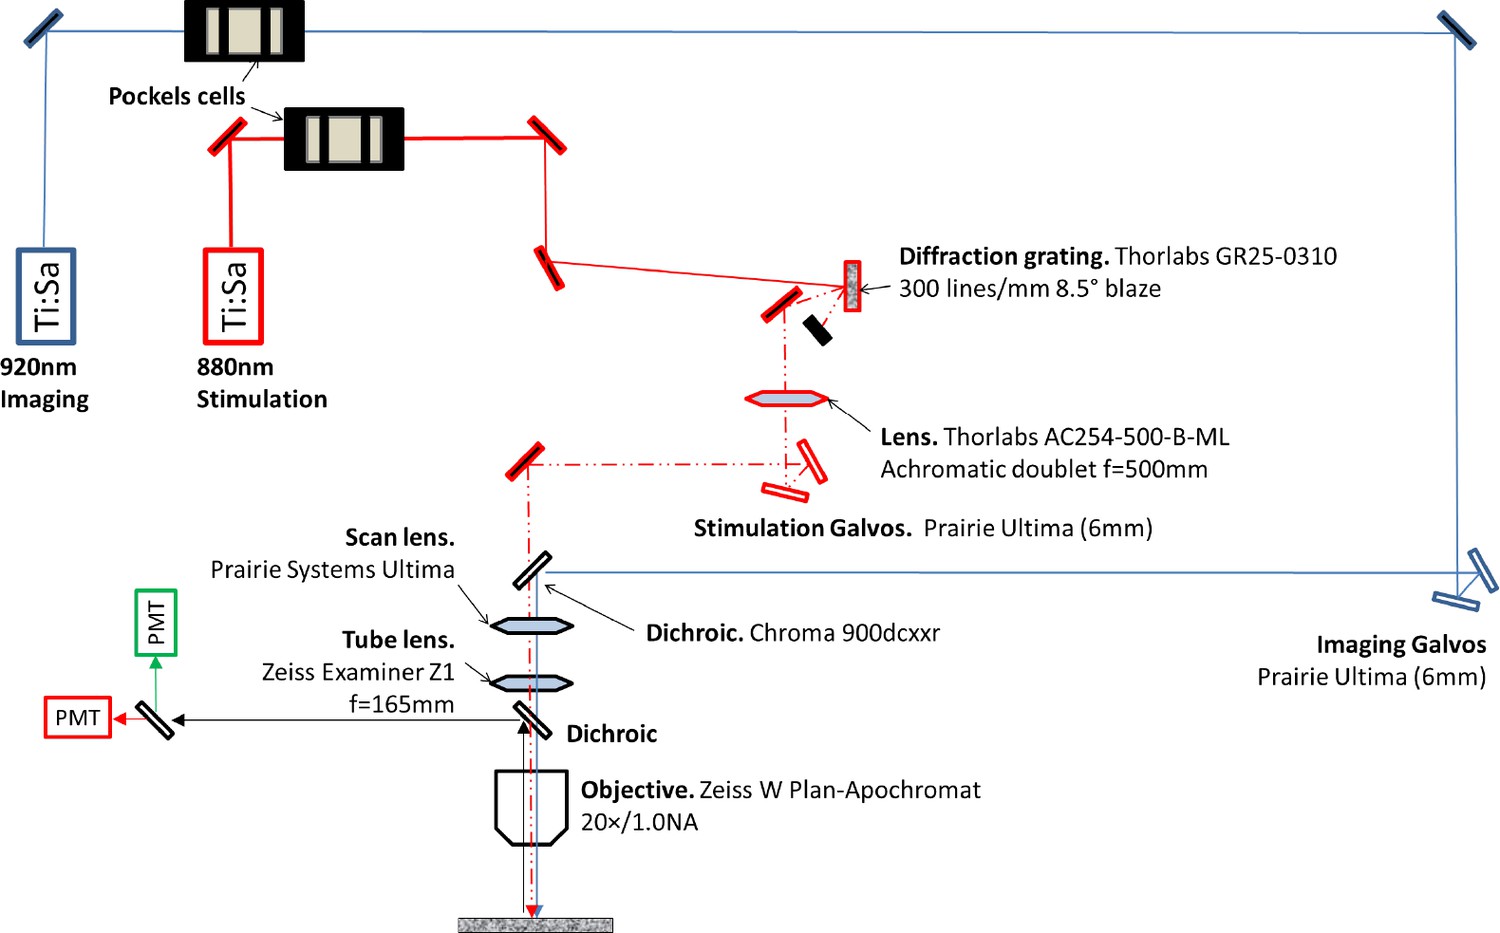
Custom two-photon microscope setup for temporal focusing stimulation with simultaneous imaging.
https://doi.org/10.7554/eLife.14193.004
Figure 1—figure supplement 2

Orthogonal projections from a z-stack of a spin-coated layer of 200 nm fluorescent beads imaged with the temporal focusing beam and collected with a CCD camera.
Scale bar = 20 µm. The full width at half maximum was 9.0 µm in the xy plane and 9.5 µm in the axial plane.
Figure 1—figure supplement 3
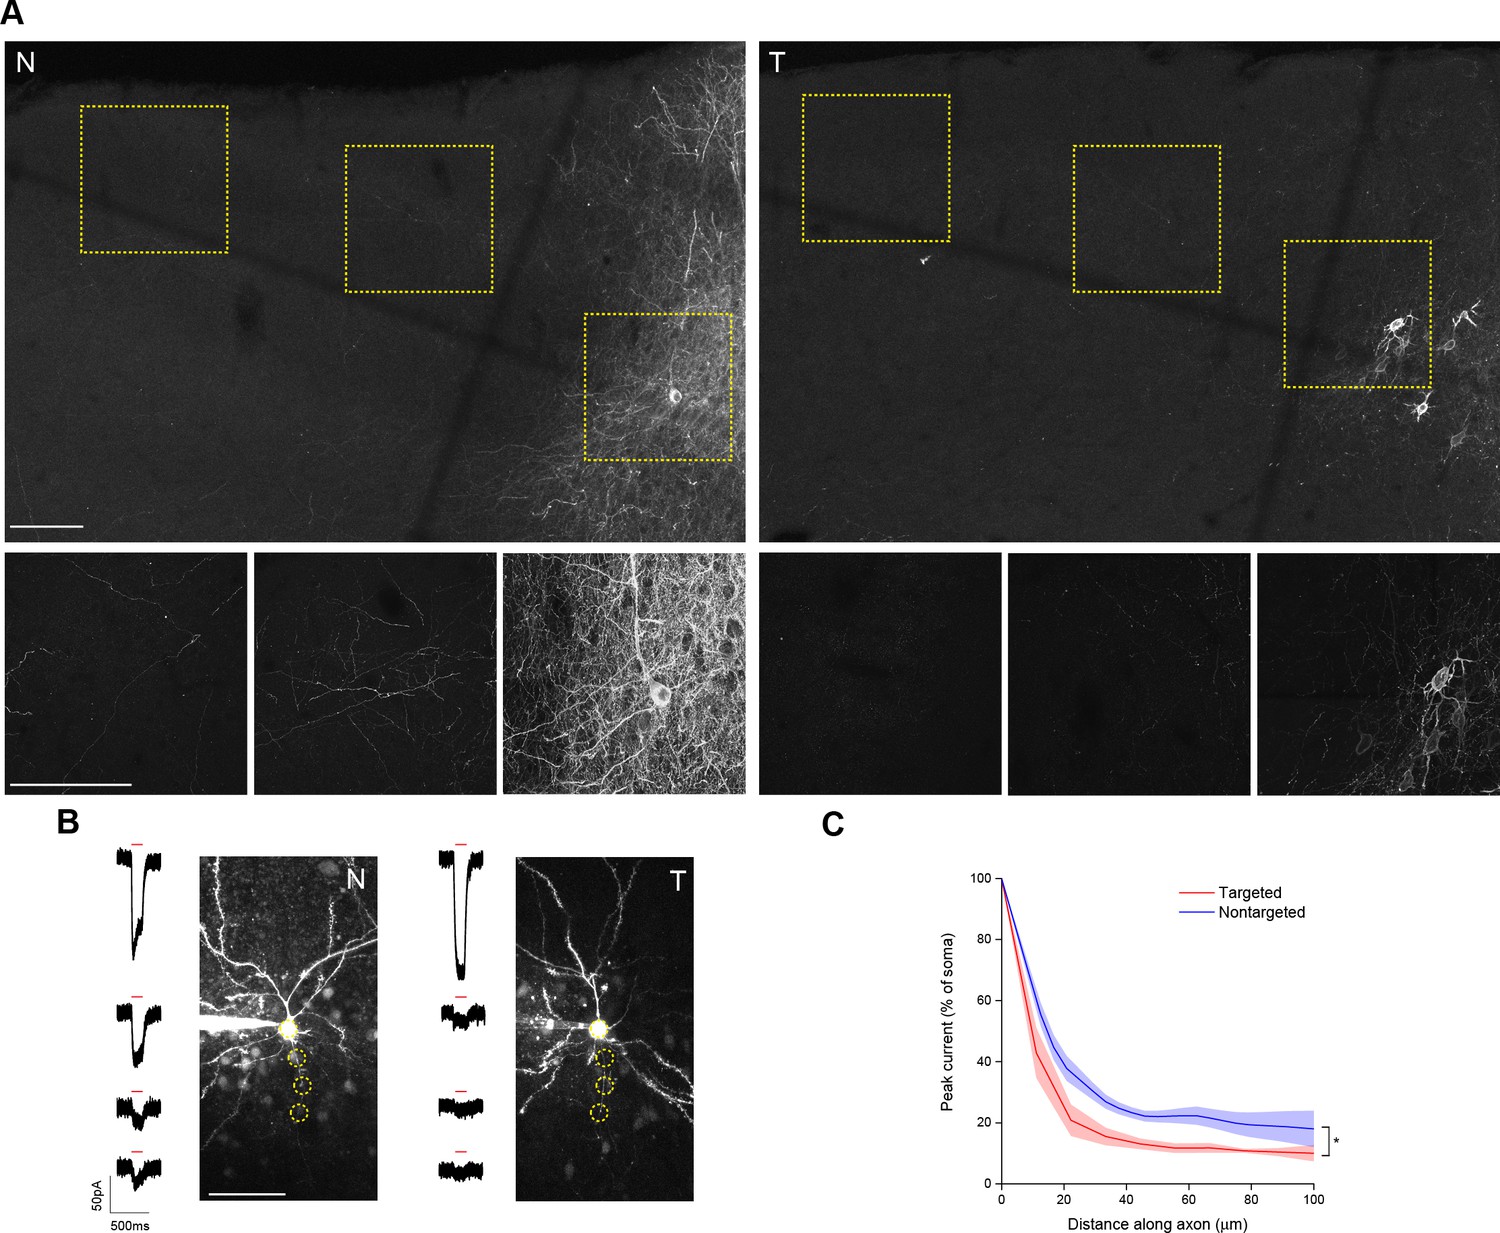
Characterization of targeted ChR2 in axonal processes.
(A) Maximum intensity projections of confocal image stacks of brain sections from animals expressing nontargeted (N) or targeted (T) ChR2. Dashed boxes in the upper panels indicate the positions of the images shown in the lower panels. Scale bars = 100 µm. (B) Representative two-photon maximum intensity projections of Alexa 594 fluorescence and current responses to a single 150 ms TF stimulation pulse (red bar) for patched and dye-filled pyramidal cells in acute slices. Scale bar = 50 µm. (C) Mean (solid lines) ± s.e.m. (shaded regions) for current responses to TF stimulation measured at specific points along an axonal process (N=16 nontargeted cells and 9 targeted cells). Fitting each curve with an exponential function demonstrated that the nontargeted and targeted datasets were significantly different (*p<0.05 by F-test).
Figure 2 with 3 supplements
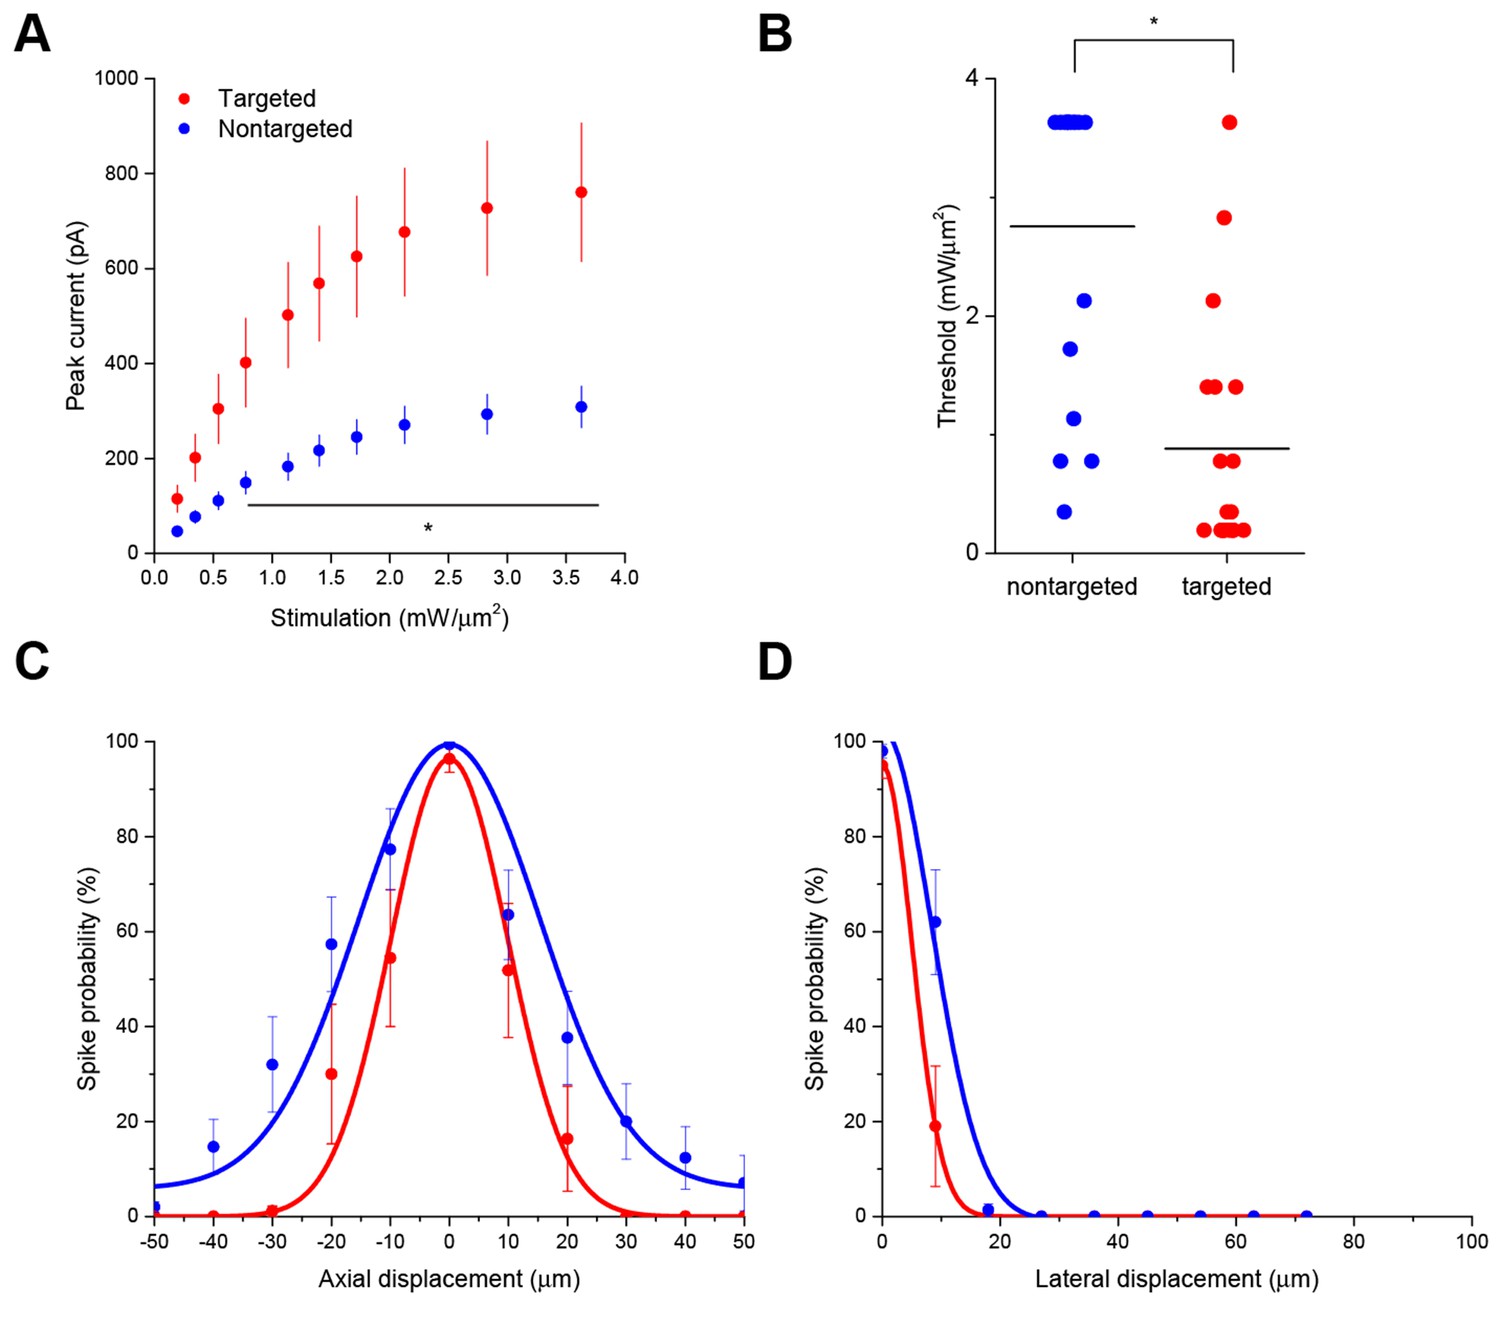
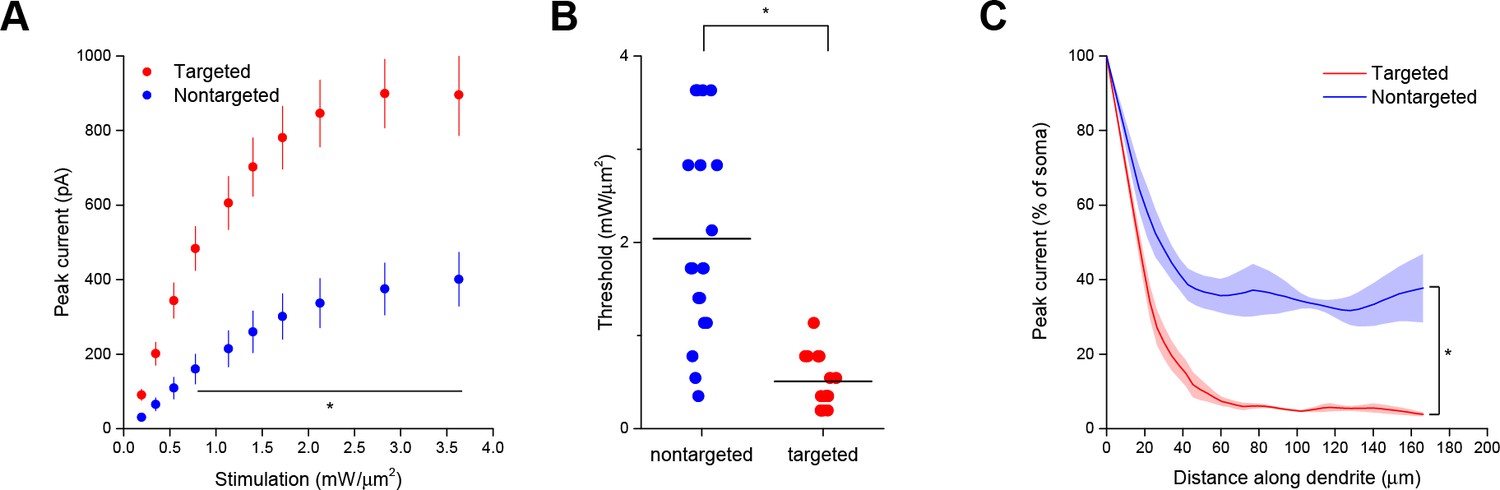
Enhanced sensitivity and resolution with soma-targeted ChR2.
(A) Evoked currents in acute slices in response to 150 ms TF stimulation of increasing intensity; targeted ChR2 exhibited significantly greater current (two-way repeated measures ANOVA, p=0.0101 for main effect of targeting, p=0.0056 for targeting × power interaction, *p<0.05 Holm-Bonferroni post hoc test). (B) Minimum TF power required to elicit a single action potential. Each point indicates a single cell; cells expressing targeted ChR2 had a much lower threshold (*p=8.028 × 10⁻⁵, Mann-Whitney U Test). (C–D) Probability of evoking spikes per 10 trials in cells expressing targeted (red) or nontargeted (blue) ChR2 when stimulating the soma and at laterally and axially displaced locations.
Figure 2—figure supplement 1
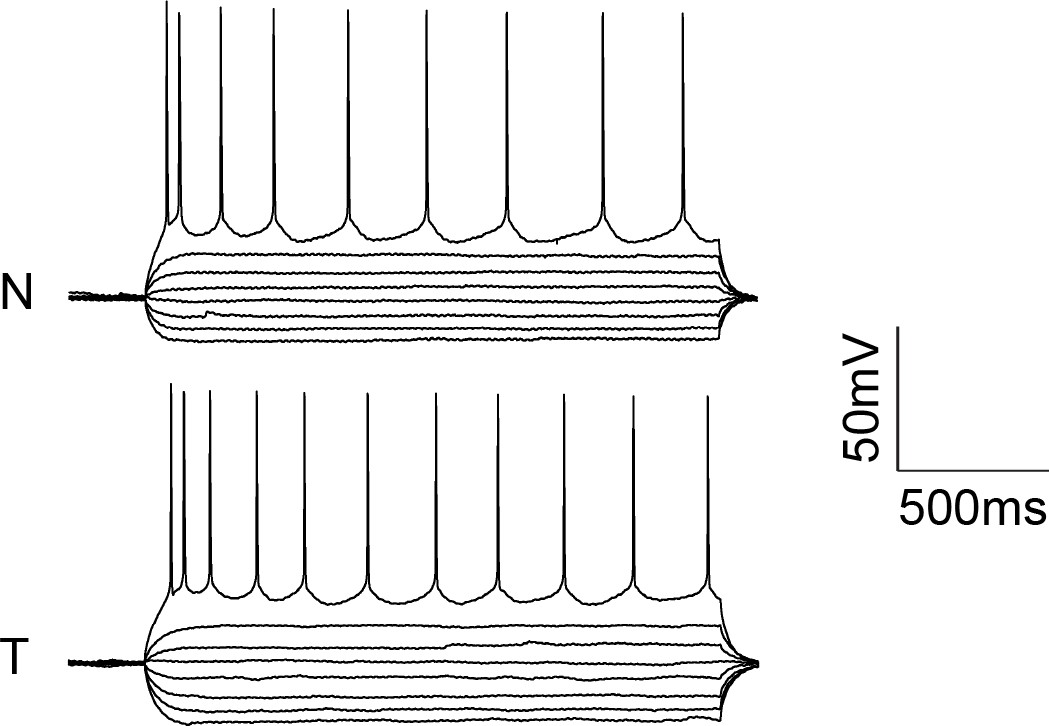
Action potentials triggered in neurons expressing nontargeted (N) or targeted (T) ChR2 in response to stepwise current injections ranging from −100 to 110 pA in 30 pA steps.
https://doi.org/10.7554/eLife.14193.008
Figure 2—figure supplement 2
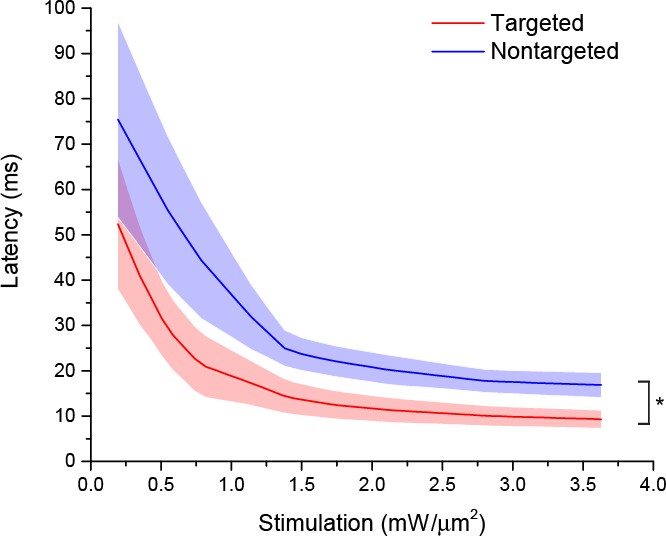
Action potential latency as a function of stimulation power in cells expressing targeted (red) or nontargeted (blue) ChR2.
Mean (solid lines) ± s.e.m. (shaded regions) latency to first action potential in response to 150 ms TF stimulation of increasing intensity in cells from acute cortical slices (N=9 cells per group). Fitting each curve with an exponential function demonstrated that the nontargeted and targeted datasets were significantly different (*p<0.05 by F-test).
Figure 2—figure supplement 3
Latency to first action potential with targeted and nontargeted ChR2.
(A) Evoked currents in acute slices in response to shorter 32 ms TF stimulation of increasing intensity; targeted ChR2 exhibited significantly greater current (two-way repeated measures ANOVA, p=1.951 × 10⁻⁴ for main effect of targeting, p=0.01 for targeting × power interaction, *p<0.05 Holm-Bonferroni post hoc test). (B) Minimum TF power required to elicit a single action potential. Each point indicates a single cell; cells expressing targeted ChR2 had a much lower threshold (*p=9.124 × 10⁻⁶, Mann-Whitney U Test). (C) Mean (solid lines) ± s.e.m. (shaded regions) for current responses to TF stimulation measured at specific points along a single dendrite (N=6 nontargeted cells and 6 targeted cells). Fitting each curve with an exponential function demonstrated that the nontargeted and targeted datasets were significantly different (*p<0.05 by F-test).
Figure 3 with 1 supplement
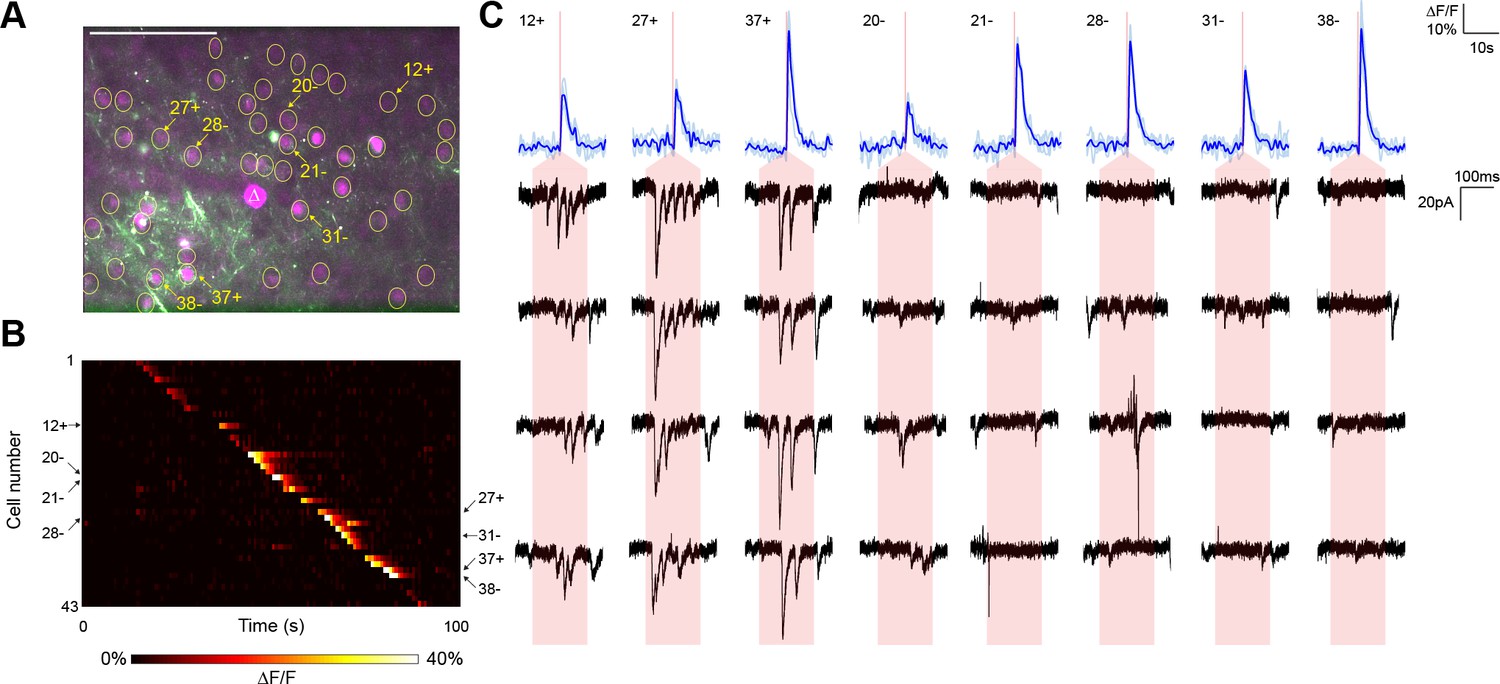
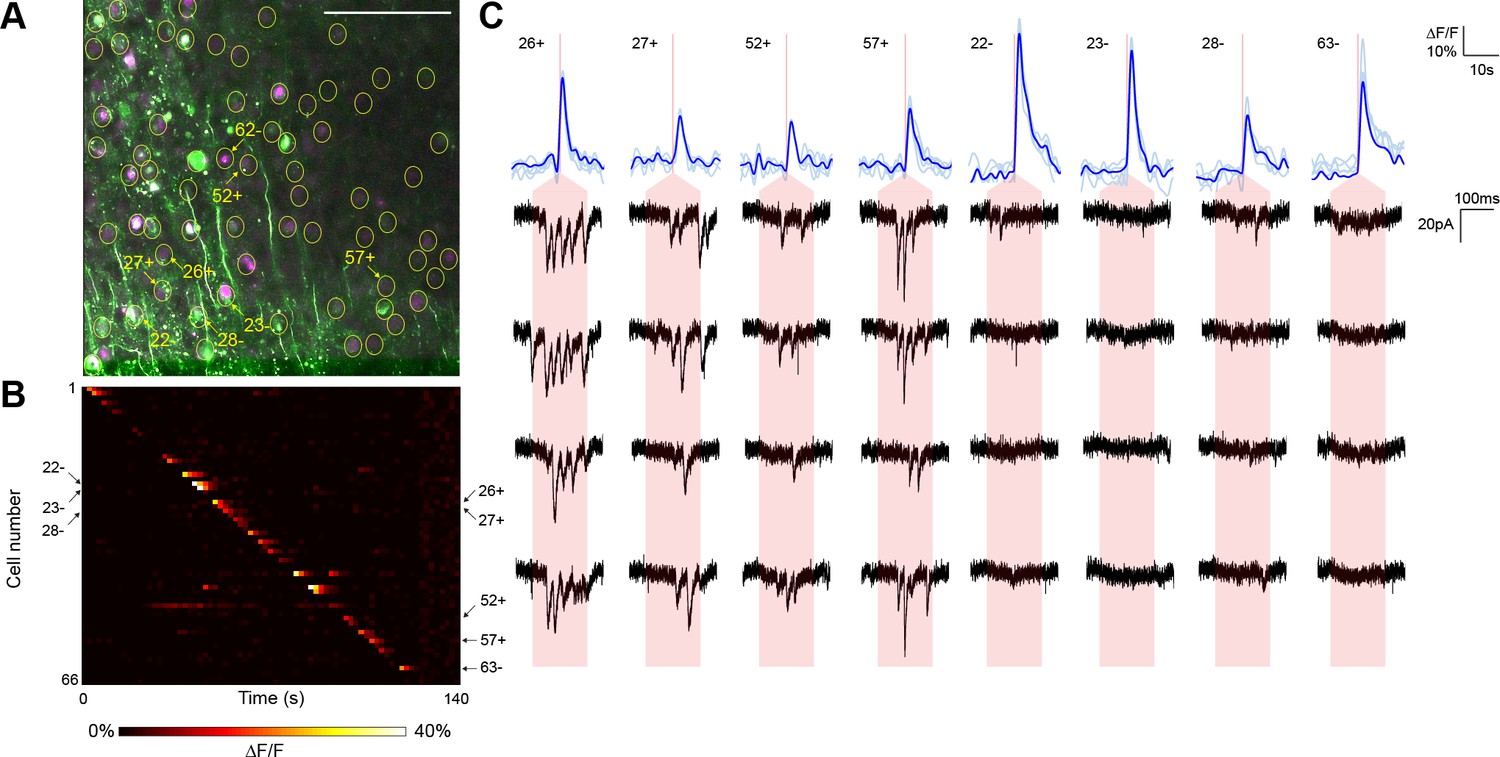
Typical mapping experiment with action potential validation by GCaMP6s.
(A) In acute slices expressing GCaMP6s (green) and targeted ChR2-P2A-H2B-mRuby2 (magenta), cells were identified for photostimulation based on nuclear mRuby2 fluorescence (yellow circles). A cell was patched and dye-filled (triangle) and assessed for postsynaptic currents as surrounding cells were stimulated (1.40 mW/µm2 incident power) and GCaMP fluorescence was simultaneously recorded. Scale bar = 100 µm. (B) Changes in GCaMP fluorescence over the experimental timecourse for each cell identified in (A); each cell was stimulated sequentially with ~2 s between cells. Signals are the average of four trials. In this experiment, 35 out of 43 cells yielded calcium transients in response to optical stimulation; overall the average probability of detecting an induced calcium response was 80%. (C) Calcium (blue) responses for a subset of cells reacting to TF stimulation; four trials are overlaid in light blue, with the average in dark blue. Red lines in the calcium traces indicate the onset of stimulation for each cell. The recorded currents for the four trials (black) in the patched and putatively postsynaptic cell are shown expanded below each calcium trace; the shaded red region indicates the 150 ms stimulation epoch. Three cells showed a calcium response to TF stimulation and triggered postsynaptic currents (fast onset kinetics but delayed with respect to the TF stimulation) in the patched cell. Five representative cells showing calcium transients but no reproducible postsynaptic currents are also shown. For the displayed three connected cells and the five unconnected cells, the cell numbers, spatial locations and full calcium traces are marked with plus signs and minus signs, respectively, in panels (A) and (B). Across multiple experiments, the average connection probability was 10% (27 connections out of 252 responsive cells).
Figure 3—figure supplement 1
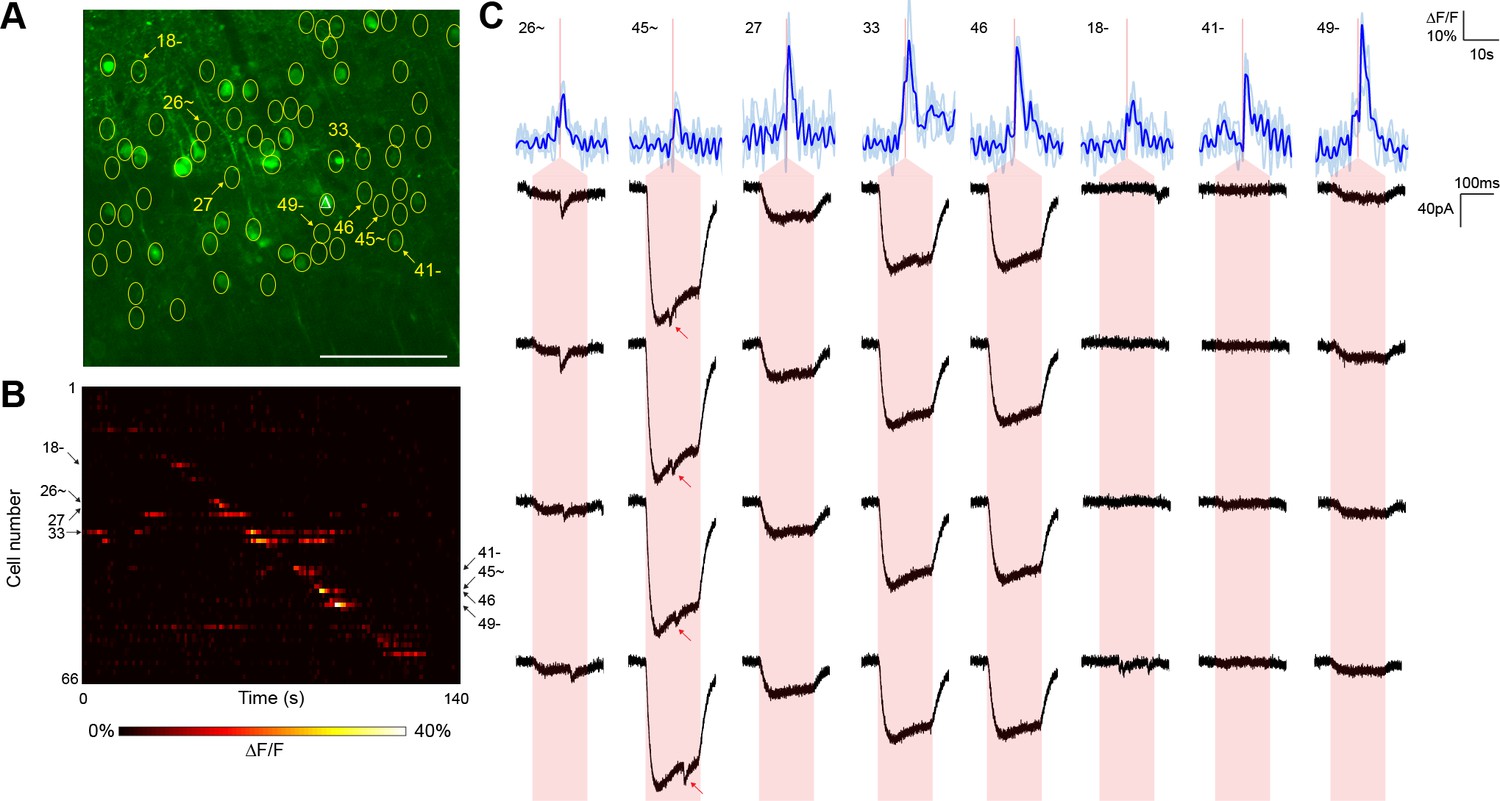
Second typical mapping experiment with action potential validation by GCaMP6s.
(A) In acute slices expressing GCaMP6s (green) and targeted ChR2-P2A-H2B-mRuby2 (magenta), cells were identified for photostimulation based on nuclear mRuby2 fluorescence (yellow circles). A cell was patched and assessed for postsynaptic currents as surrounding cells were stimulated (1.40 mW/µm2 incident power) and GCaMP fluorescence was simultaneously recorded. Scale bar = 100 µm. (B) Changes in GCaMP fluorescence over the experimental timecourse for each cell identified in (A); each cell was stimulated sequentially as described in Figure 3. Signals are the average of four trials. (C) Calcium (blue) responses for a subset of cells reacting to TF stimulation; four trials are overlaid in light blue, with the average in dark blue. Red lines in the calcium traces indicate the onset of stimulation for each cell. The recorded currents for the four trials (black) in the patched and putatively postsynaptic cell are shown expanded below each calcium trace; the shaded red region indicates the 150 ms stimulation epoch. Four cells with a calcium response to TF stimulation and coincident postsynaptic currents (fast onset kinetics but delayed with respect to the TF stimulation) in the patched cell are shown, as are four representative cells showing calcium transients but no reproducible postsynaptic currents. For the displayed connected and unconnected cells, the cell numbers, spatial locations and full calcium traces are marked with plus signs and minus signs, respectively, in panels (A) and (B).
Figure 4
Typical mapping experiment using nontargeted ChR2.
(A) In acute slices expressing GCaMP6s (green) and conventional ChR2-mRuby2, cells were identified for photostimulation based on responsiveness to widefield ChR excitation (yellow circles). A cell was patched and dye-filled (triangle) and assessed for postsynaptic currents as surrounding cells were stimulated (2.13 mW/µm2 incident power) and GCaMP fluorescence was simultaneously recorded. Scale bar = 100 µm. (B) Changes in GCaMP fluorescence over the experimental timecourse for each cell identified in (A); each cell was stimulated sequentially as described in Figure 3. Signals are the average of four trials. (C) Calcium (blue) responses for a subset of cells reacting to TF stimulation; four trials are overlaid in light blue, with the average in dark blue. Red lines in the calcium traces indicate the onset of stimulation for each cell. The recorded currents for the four trials (black) in the patched and putatively postsynaptic cell are shown expanded below each calcium trace; the shaded red region indicates the 150 ms stimulation epoch. Several types of events were observed: one cell showed a synaptic event coincident with a low amplitude current from direct stimulation of the dendritic arbor of the patched cell, and one cell showed what might be a synaptic event buried within another direct stimulation current of large amplitude (red arrows). Three other cells with a calcium response to TF stimulation and coincident direct stimulation of the patched cell’s dendritic arbor are also shown, along with three cells with calcium transients but no detectable currents in the patched cell. The cell numbers, spatial locations and full calcium traces corresponding to these events are marked in panels (A) and (B).
Tables
Table 1
Intrinsic electrophysiological properties of neurons expressing normal or targeted channel rhodopsin constructs. Rheobase measurements were made in response to current injections. All measurements are mean ± s.e.m. No significant differences as an effect of targeting were found (Mann-Whitney U Tests, all p>0.05).
| Nontargeted | Targeted | p | |
|---|---|---|---|
| Input resistance (MΩ) | 129.16 ± 8.91 (N = 11) | 148.36 ± 17.76 (N = 18) | 0.9462 |
| Capacitance (pF) | 125.25 ± 16.99 (N = 11) | 89.85 ± 7.66 (N = 18) | 0.0887 |
| Resting potential (mV) | −72.71 ± 3.86 (N = 7) | −76.87 ± 1.87 (N = 8) | 0.3532 |
| Rheobase (pA) | 160.00 ± 7.69 (N = 12) | 147.39 ± 12.92 (N = 23) | 0.5357 |
| Spikes at 1.5× rheobase | 7.18 ± 0.52 (N = 12) | 7.56 ± 0.83 (N = 23) | 0.8377 |
Download links
A two-part list of links to download the article, or parts of the article, in various formats.
Downloads (link to download the article as PDF)
Open citations (links to open the citations from this article in various online reference manager services)
Cite this article (links to download the citations from this article in formats compatible with various reference manager tools)
Cellular resolution circuit mapping with temporal-focused excitation of soma-targeted channelrhodopsin
eLife 5:e14193.
https://doi.org/10.7554/eLife.14193


