Synaptotagmin-1 C2B domain interacts simultaneously with SNAREs and membranes to promote membrane fusion
- Huazhong University of Science and Technology, China
Figures
Figure 1
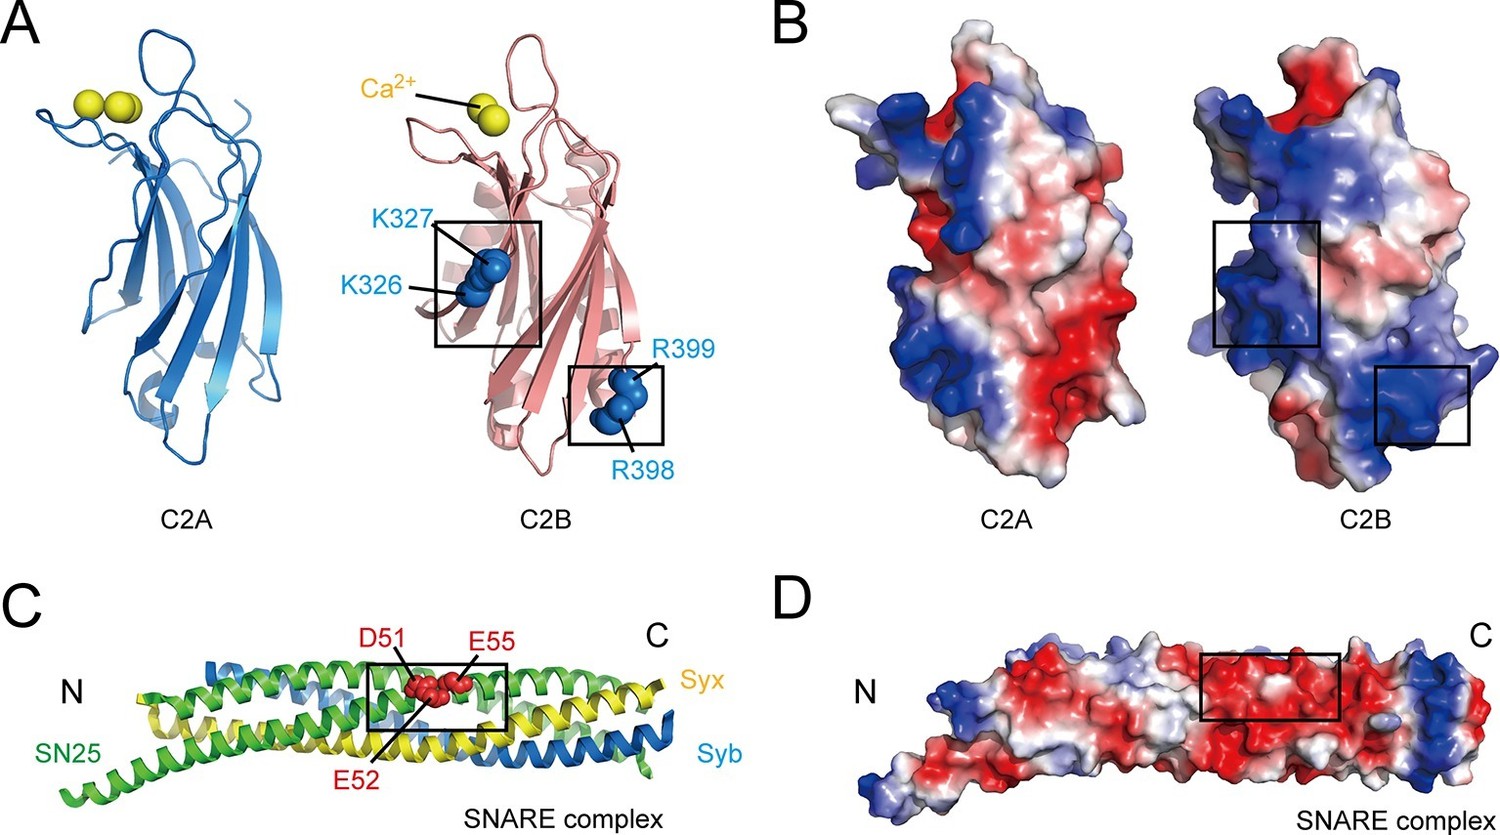
Overview of the structure features of Syt1 C2 domains and the core SNARE complex.
(A and B) Structural diagrams (A) and electrostatic surface potential (B) of Syt1 C2A (PDB entry 1BYN) and C2B (PDB entry 1TJX) domain. Residues K326 and K327 on the side, R398 and R399 on the bottom, and Ca2+ ions on the top of C2B are shown as blue and yellow spheres, respectively. Black boxes display the basic patches that include the residues shown in A. (C and D) Structural diagram (C) and electrostatic density map (D) of the core SNARE complex (PDB entry 1N7S). Residues D51, E52 and E55 are displayed as red spheres. Black box displays the acidic patch, which includes the residues shown in C. Syx, syntaxin-1; SN25, SNAP-25; Syb, synaptobrevin-2. The electrostatic surface potential was calculated by generating local protein contact potential (pymol software) and scaled from -5kT/e to 5kT/e, with red and blue denoting negative and positive potential, respectively.
Figure 2 with 2 supplements
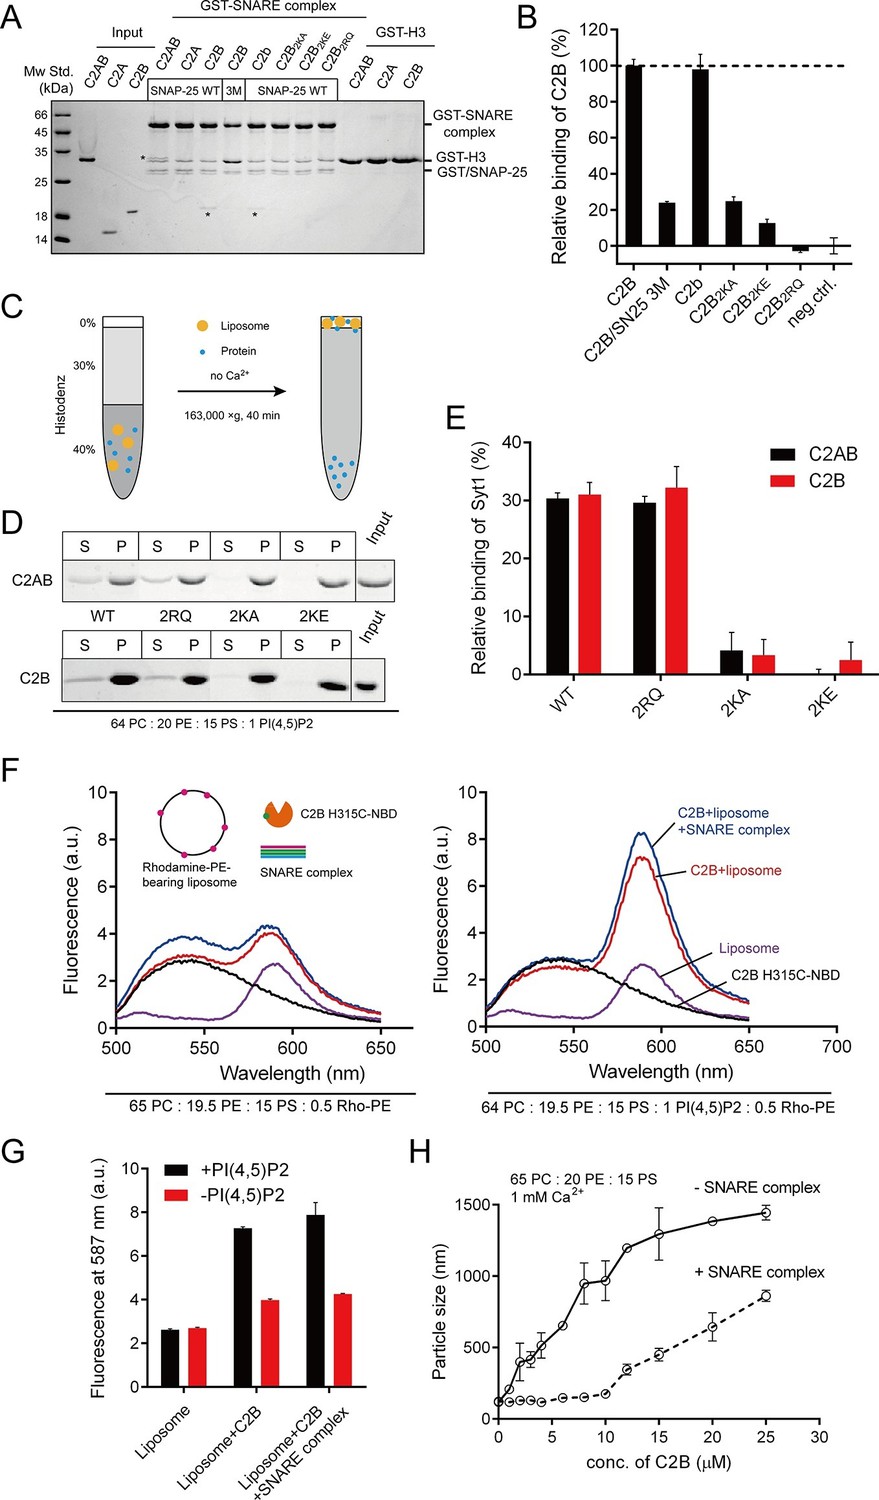
Different Ca2+-independent interactions of Syt1 with membranes and SNARE complexes.
(A and B) Binding of Syt1 soluble fragments and their mutants to the core SNARE complex measured by GST pull-down assay (A) and quantification of the C2B binding (B). Asterisks in A show the bands of bound protein. 3M, GST-tagged SNARE complex bearing the SNAP-25 D51A/E52A/E55A mutation; H3, the SNARE motif of syntaxin-1; neg.ctrl., negative control, which represents C2B bound to GST-H3. Representative gel from one of three independent experiments is shown. Data are processed by Image J (NIH) and presented as the mean ± SD (n = 3), technical replicates. (C) Schematic diagram of the liposome co-flotation assay. After centrifuging, liposomes (orange) and bound proteins (blue) were co-floated on the top of the density gradients, remaining unbounded proteins left in the bottom of the gradients. (D and E) Co-flotation of C2AB, C2B and their mutants with liposomes bearing 1% PI(4,5)P2 in the absence of Ca2+ (D) and quantification of the binding (E). WT/2RQ/2KA/2KE, Syt1 C2AB or C2B, and the mutants bearing R398Q/R399Q, K326A/K327A or K326E/K327E mutations, respectively; S, supernatant; P, pellet formed by centrifuging. Representative gel from one of three independent experiments is shown. Data are processed by Image J (NIH). (F and G) FRET between NBD labeled Syt1 C2B-H315C and rhodamine labeled liposomes with or without 1% PI(4,5)P2 (F) and quantification of the emission fluorescence of rhodamine at 587 nm (G). Liposome compositions are presented below the diagram; all reactions were performed in the absence of Ca2+. (H) C2B-induced liposome clustering measured in the presence of SNARE complexes. The change in particle size as a function of the C2B concentration was measured by dynamic light scattering (DLS). All data plots are presented as the mean ± SD (n = 3), technical replicates.
Figure 2—figure supplement 1
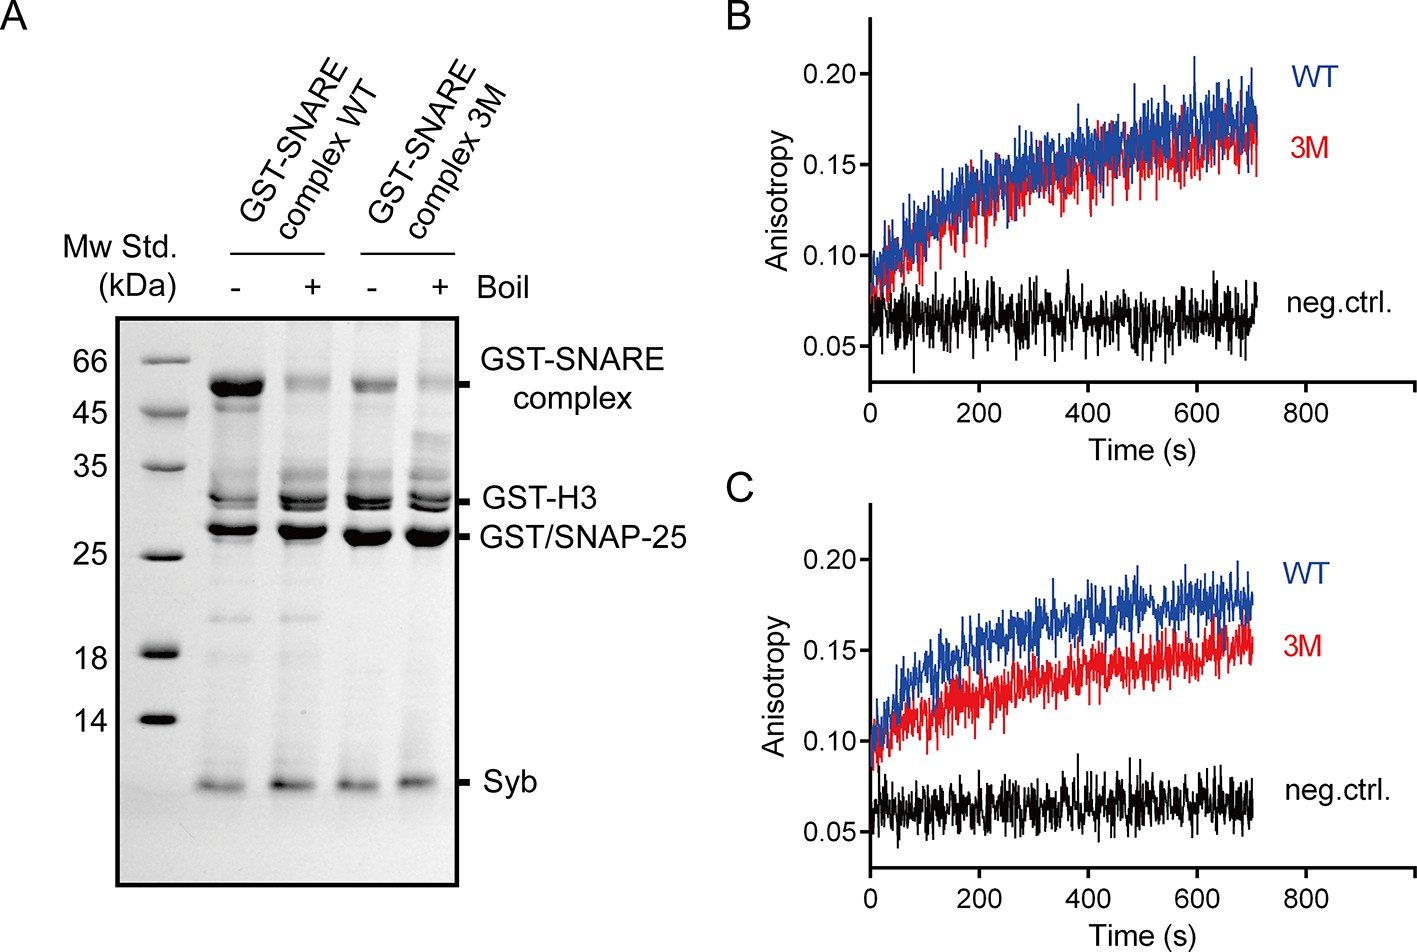
The SNAP-25 3M mutation displayed less resistance to SDS and no influence on SNARE complex assembly.
(A) Assembled GST-tagged SNARE complexes were analyzed by SDS-PAGE before pull-down assays. (B) The assembly of pre-assembled syntaxin-1–SNAP-25 complex and synaptobrevin monitored by fluorescence anisotropy. (C) The assembly of syntaxin-1, SNAP-25 and synaptobrevin monitored by fluorescence anisotropy. Fluorescent probe (BODIPY FL) was labeled on synaptobrevin S61C. The small difference between WT and 3M in B is insignificant given the noise in the traces. WT, wild type; 3M, SN25 D51A/E52A/E55A mutations; neg.ctrl., negative control, which represents the addition of excess unlabeled synaptobrevin.
Figure 2—figure supplement 2
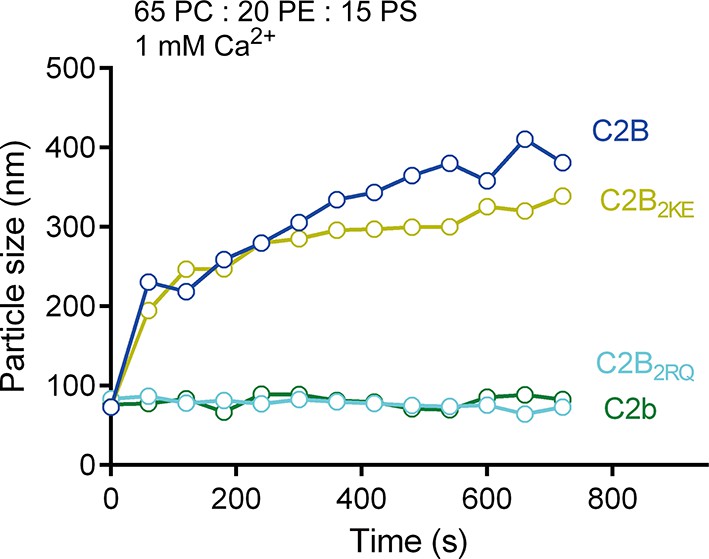
PS-containing liposome clustering induced by C2B and its mutants in the presence of Ca2+.
https://doi.org/10.7554/eLife.14211.006
Figure 3
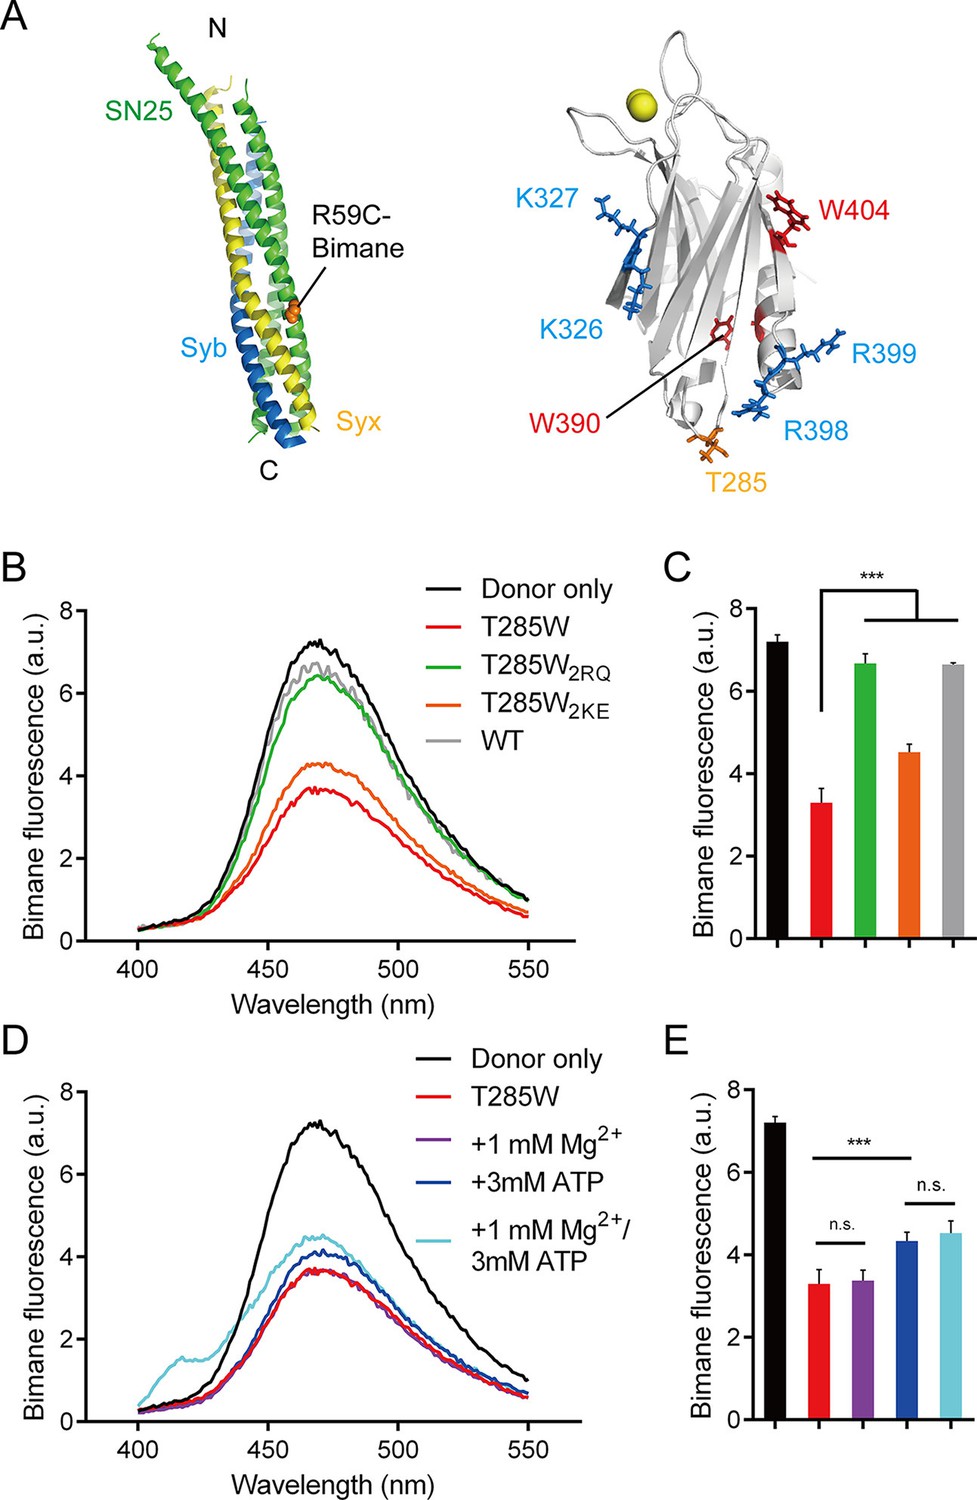
Persistence of the R398 R399–SNARE complex interaction in the presence of ATP and Mg2+.
(A) Schematic diagrams of bimane-labeled SNARE complex and Syt1 C2B. Tryptophan was introduced at the bottom of C2B (T285W, orange stick), which is close to residues R398 and R399; two native tryptophans (W390 and W404) are indicated as red sticks; residues K326 K327 and R398 R399 are shown as blue sticks; Ca2+ ions are displayed as yellow spheres. (B and C) Quenching of bimane fluorescence on the SNARE complex with the addition of C2B T285W and the mutants in the absence of ATP and Mg2+ (B) and quantification of the results (C). (D and E) Quenching of bimane fluorescence on the SNARE complex with the addition of C2B T285W in the presence of ATP and Mg2+ (D) and quantification of the results (E). Donor only, no addition of Syt1 C2B; T285W, C2B bearing the T285W mutation; T285W2RQ and T285W2KE, C2B T285W bearing the R398Q/R399Q or K326E/K327E mutations, respectively. Data are presented as the mean ± SD, technical replicates. n.s., not significant (p > 0.05); *p<0.05; ***p < 0.001; one-way ANOVA, n = 5.
Figure 4
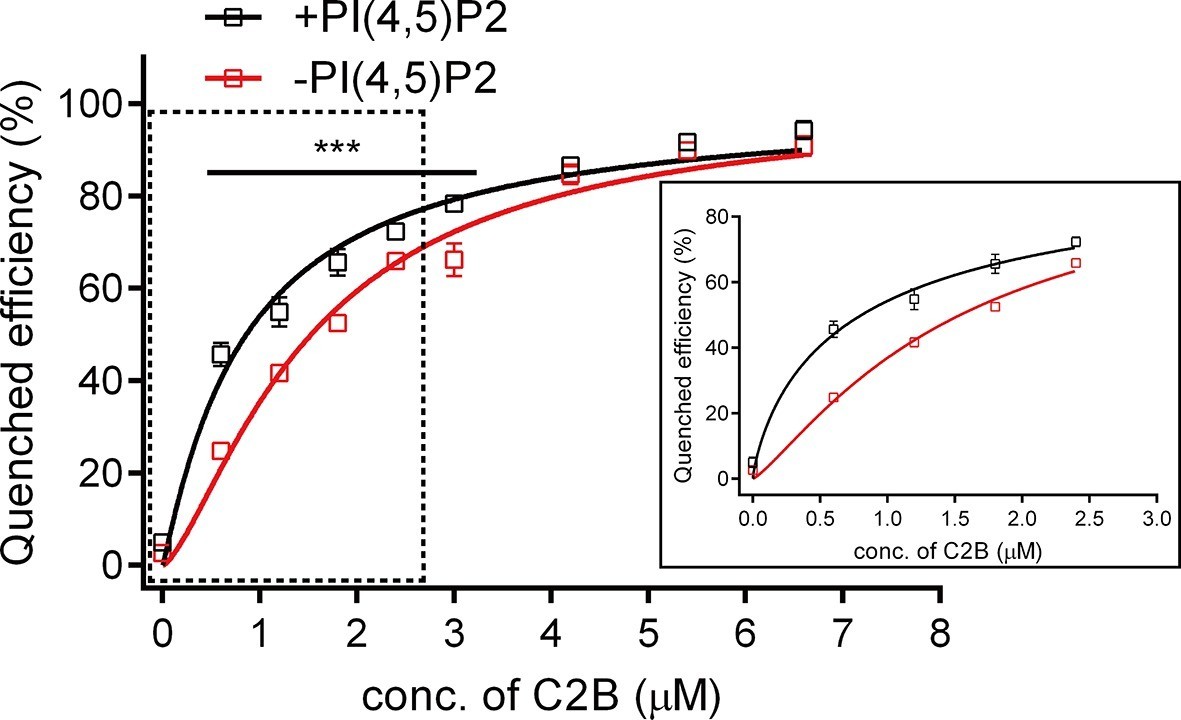
Binding Kd between C2B and the membrane-anchored SNARE complex.
Cis-SNARE complexes were reconstituted on liposome via the syntaxin-1 transmembrane domain. PI(4,5)P2 increased the binding affinity between Syt1 C2B and the membrane-anchored SNARE complex in the absence of Ca2+. Plots show the quenched efficiency of the bimane-labeled cis-SNARE complex reconstituted on liposomes (65% PC + 20% PE + 15% PS) with the titration of Syt1 C2B T285W in the presence (black) and absence (red) of 1% PI(4,5)P2. Diagram in the solid box is the close-up view of the data in the dashed box. Plots are presented as the mean ± SD, technical replicates. ***p<0.001; multiple t-test using Holm-Sidak method, n = 5. Non-linear curve fit were achieved by the Michaelis-Menten equation where Vmax was constrained to 100 (% Quenched efficiency).
Figure 5 with 1 supplement
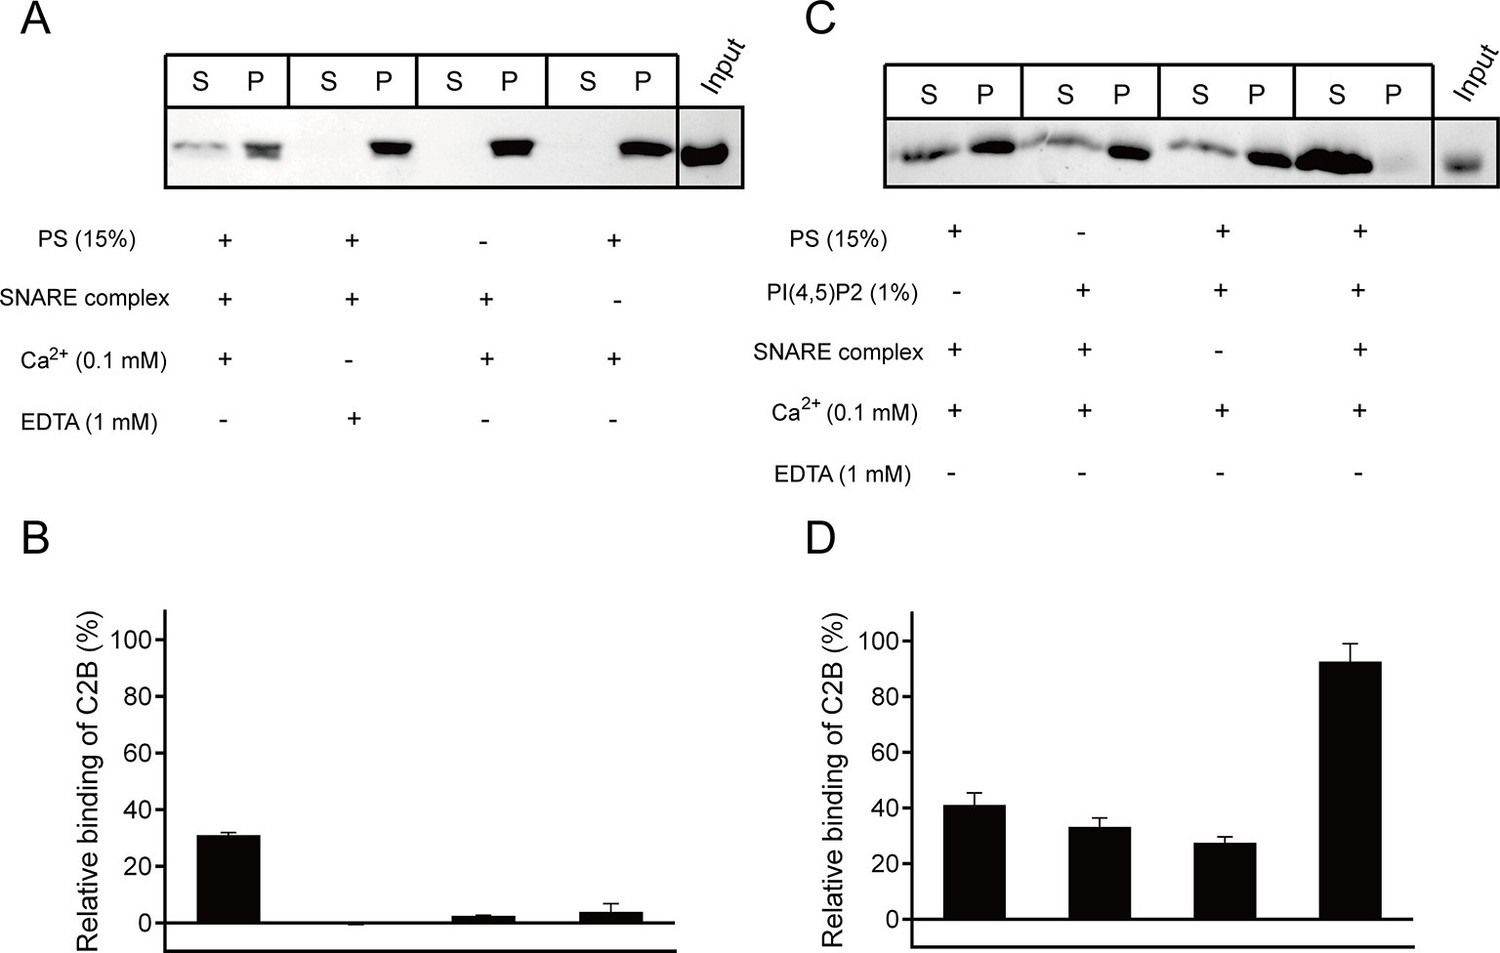
Synergistic interactions of C2B with membrane-anchored SNARE complexes, PI(4,5)P2 and PS in the presence of 0.1 mM Ca2+.
(A and B) Co-flotation of Syt1 C2B with liposomes in the absence of PI(4,5)P2 (A) and quantification of the results (B). (C and D) Co-flotation of Syt1 C2B with liposomes in the presence of 1% PI(4,5)P2 (C) and quantification of the results (D). Cis-SNARE complexes were reconstituted on liposome via the syntaxin-1 transmembrane domain. Liposomes compositions in A and C contain 65% PC, 20% PE, 15% PS with and without 1% PI(4,5)P2. S, supernatant; P, pellet. Representative gel from one of three independent experiments is shown. Data are processed by Image J (NIH) and presented as the mean ± SD (n = 3), technical replicates.
Figure 5—figure supplement 1
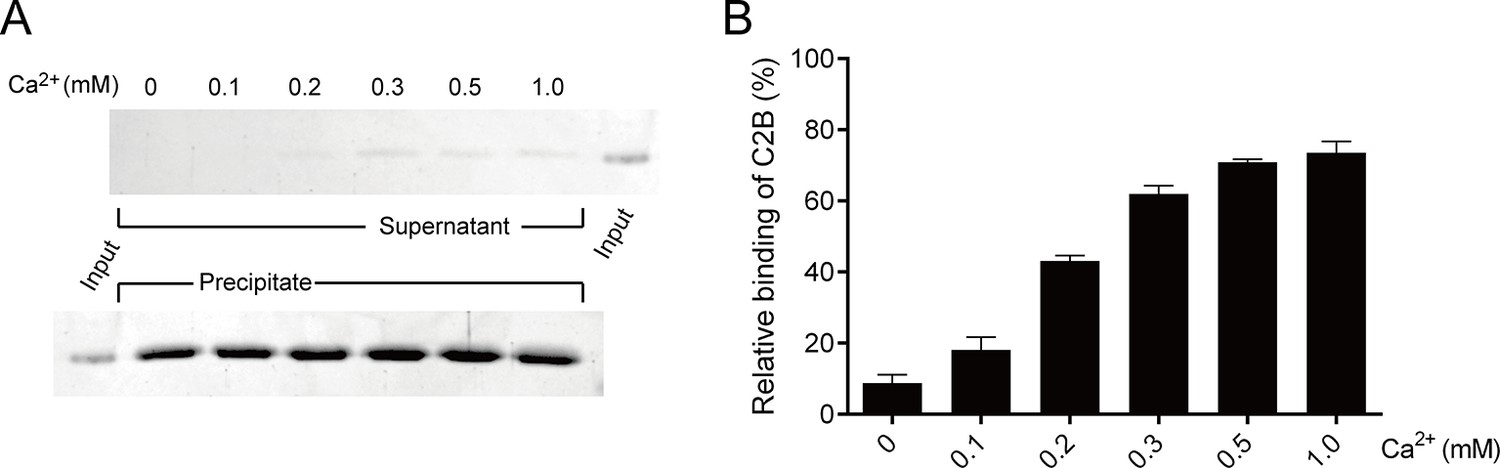
Binding of C2B to PS-containing liposomes in different Ca2+ concentrations.
(A) Co-flotation of C2B with liposomes (65% PC + 20% PE + 15% PS) in the presence of 250 mM KCl and different Ca2+ concentrations as indicated. (B) Quantification of the results in A. Representative gel from one of three independent experiments is shown. Data are processed by Image J (NIH) and presented as the mean ± SD (n = 3), technical replicates.
Figure 6
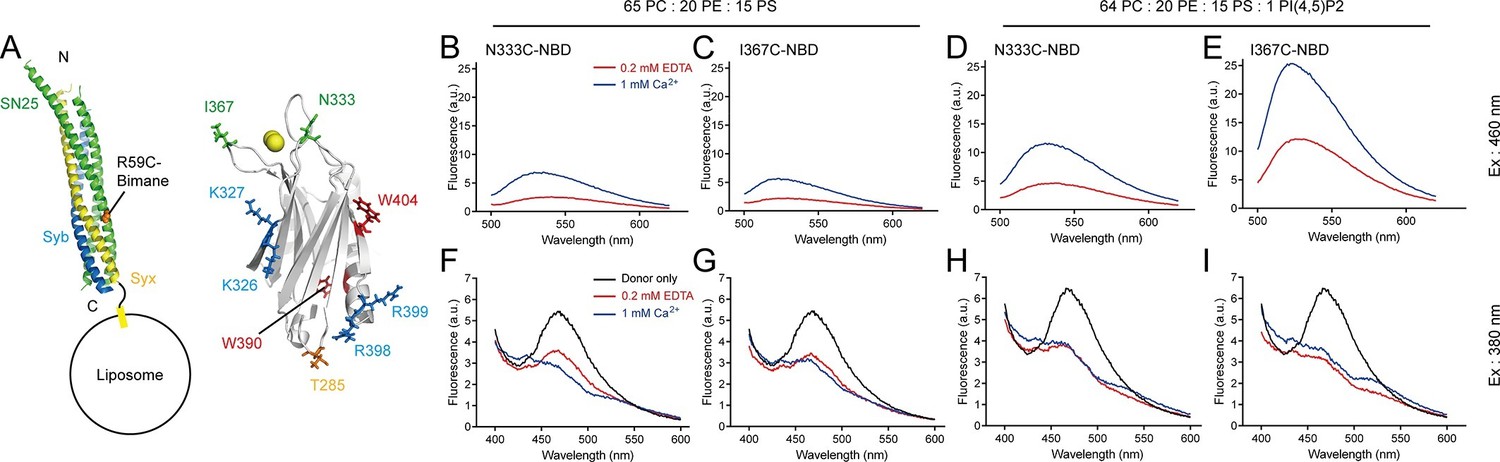
Persistence of C2B–SNARE complex and C2B–PI(4,5)P2 interactions upon insertion of the Ca2+-binding loops into membranes.
(A) Schematic diagrams of C2B and membrane-embedded cis-SNARE complex. NBD was labeled on N333C or I367C (green sticks) on C2B separately; bimane was labeled on SN25 R59C (orange sphere); tryptophan was introduced at the bottom of C2B (T285W, orange stick), which is close to residues R398 and R399; two native tryptophans (W390 and W404) are indicated as red sticks; residues K326 K327 and R398 R399 are shown as blue sticks; Ca2+ ions are displayed as yellow spheres. (B–E) Detecting Ca2+-triggered membrane insertion of the Ca2+-binding loops using NBD fluorescence reporters in the absence (B and C) and presence (D and E) of PI(4,5)P2. Emission spectra were collected from 500 nm to 620 nm. (F–I) Detecting FRET between tryptophan (T285W) on C2B and bimane-labeled SNARE complexes reconstituted on liposomes in the absence (F and G) and presence (H and I) of PI(4,5)P2. Emission spectra were collected from 400 nm to 600 nm. Donor only, no addition of Syt1 C2B.
Figure 7 with 3 supplements
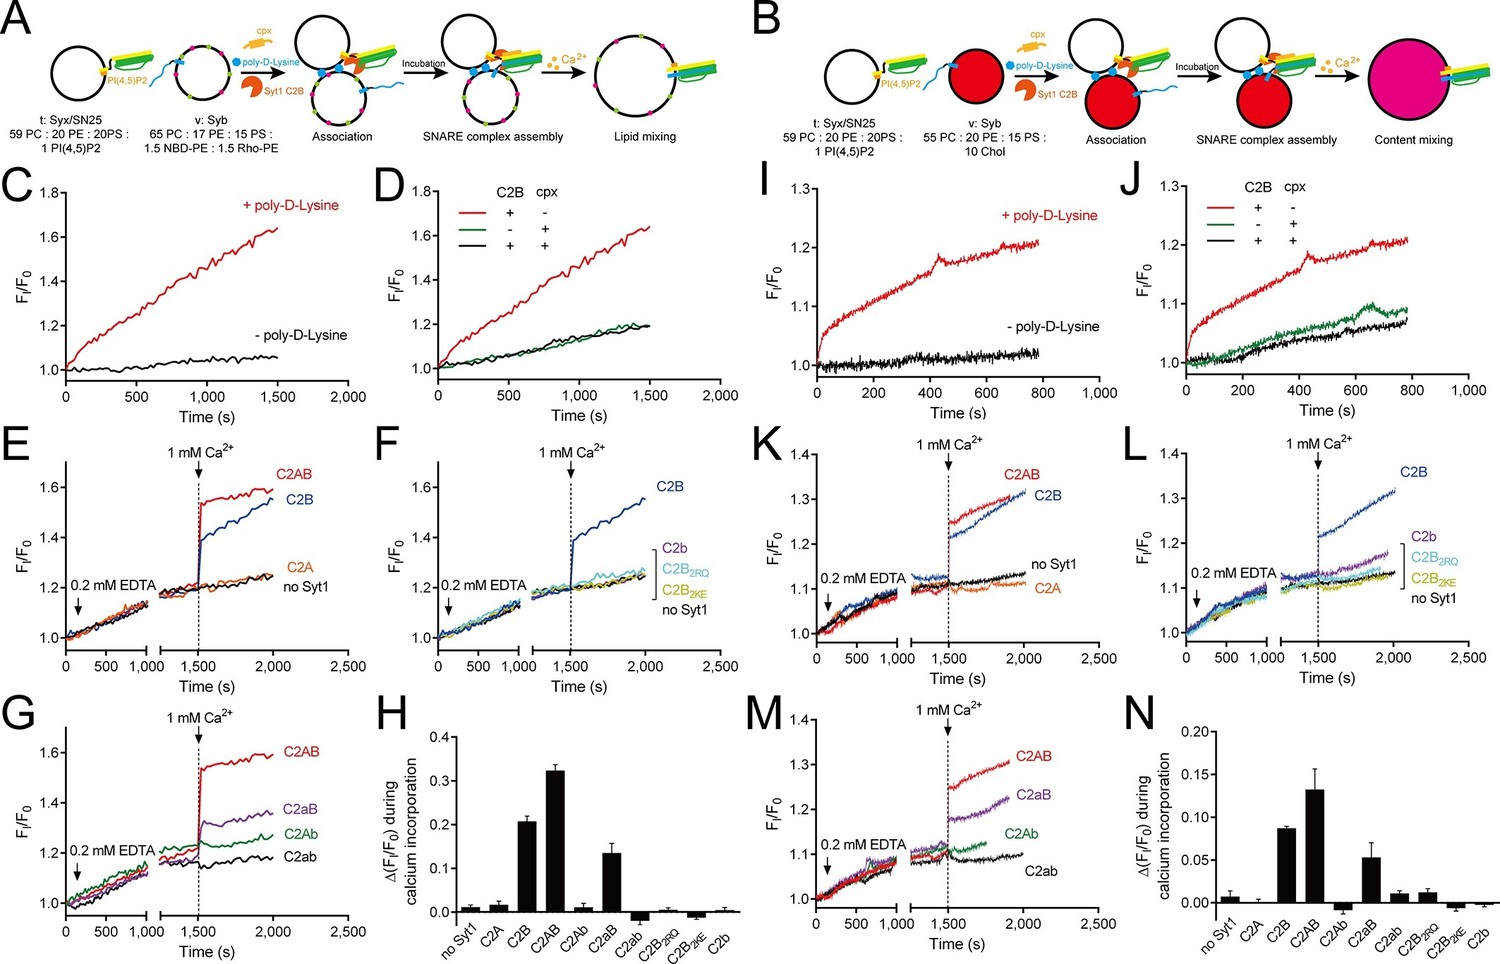
Ca2+-dependent simultaneous C2B–SNARE complex–membrane interactions underlie the function of Syt1 in triggering fusion.
(A and B) Schematic diagrams of the lipid mixing (A) and content mixing (B) assay. Liposome compositions are presented below the diagram. Cpx, complexin-1. (C and I) Poly-D-lysine promoted SNARE-dependent lipid mixing (C) and content mixing (I) in the absence of Ca2+. (D and J) Cpx inhibited SNARE-dependent lipid mixing (D) and content mixing (J) in the absence of Ca2+. (E and K) C2AB and C2B triggered fast lipid mixing (E) and content mixing (K) whereas C2A did not in response to Ca2+. (F and L) Disruption of the C2B–SNARE complex–membrane interactions abolished fast lipid mixing (F) and content mixing (L). (G and M) The functional analysis of the Ca2+-binding loops mutations on C2AB in triggering lipid mixing (G) and content mixing (M). (H and N) Quantification of the lipid-mixing (H) and content-mixing results (N) in E–G and K–M, respectively. Data are presented as the mean ± SD (n = 3), technical replicates.
Figure 7—figure supplement 1
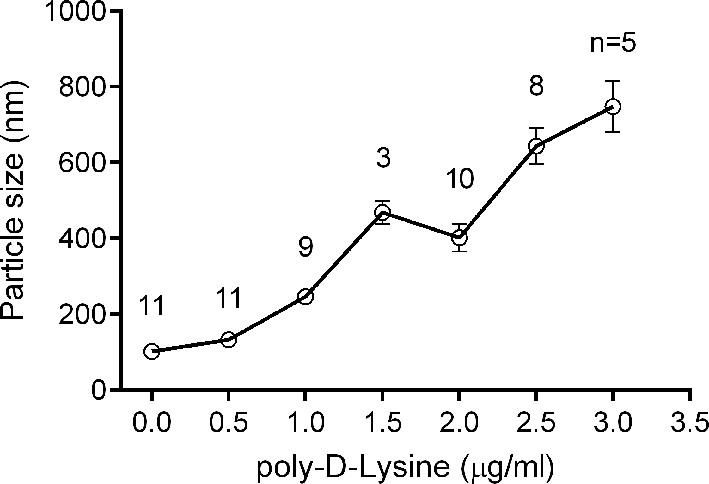
Liposome clustering induced by Poly-D-lysine in a concentration-dependent manner.
100 μM liposomes (65% PC + 20% PE + 15% PS) mixed with different concentrations of poly-D-lysine were incubated for 40 min and particle size was monitored by DLS. Data plots are presented as the mean ± SEM, technical replicates, degrees of freedom (n) are indicated on the top of the plots.
Figure 7—figure supplement 2
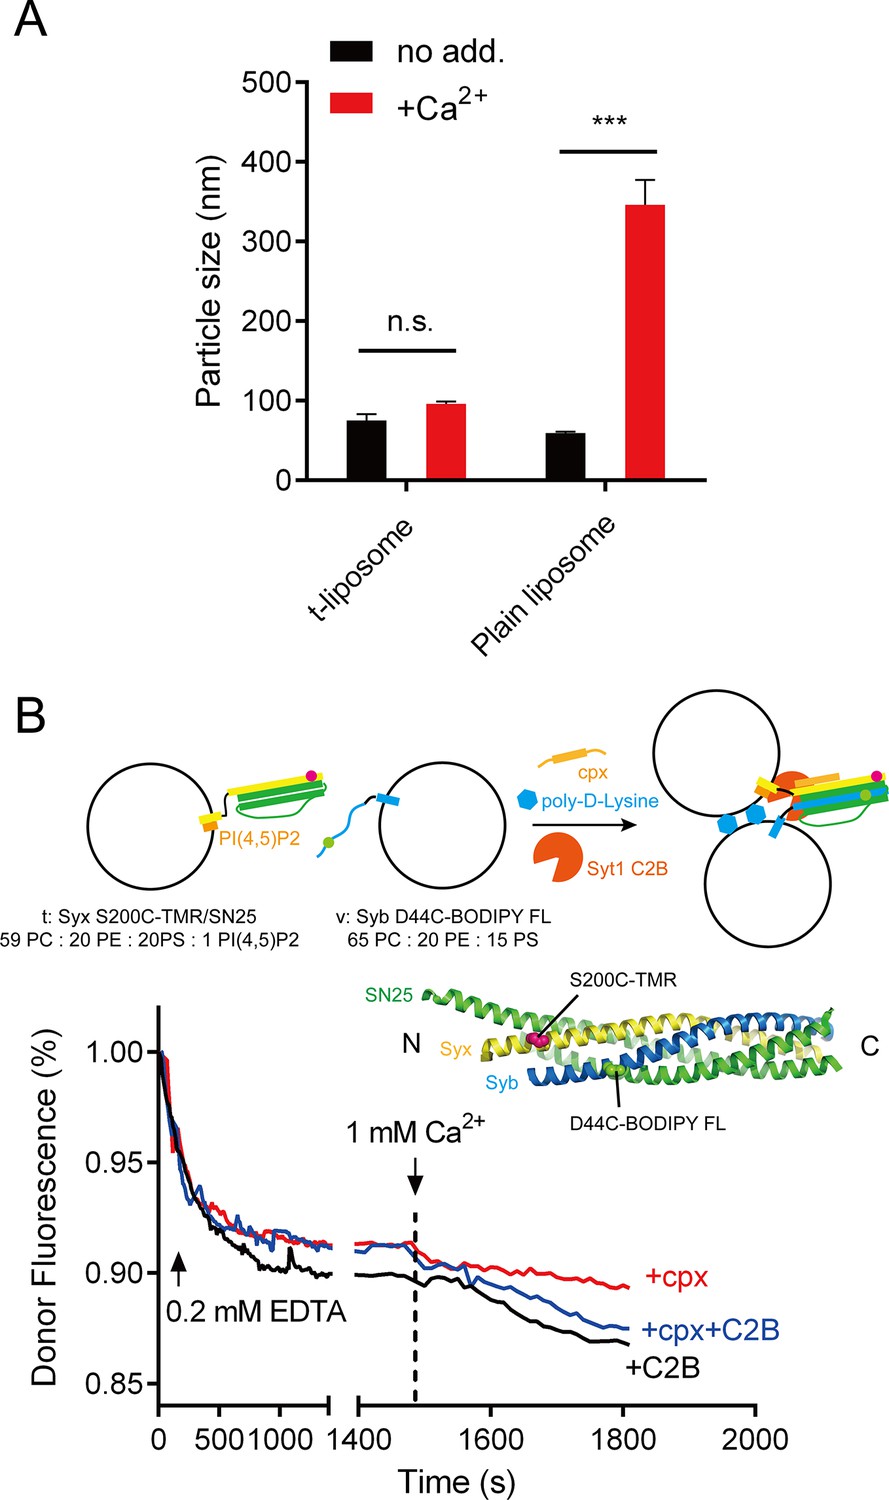
Liposome clustering and SNARE pairing monitored during liposome fusion.
(A) C2B did not cluster t-liposomes (bearing syntaxin-1–SNAP-25 complex) in the presence of Ca2+. Plain liposomes or t-liposomes (59% PC + 20% PE + 20% PS + 1% PI(4,5)P2) bearing 0.5 μM syntaxin-1–SNAP-25 complex or were mixed with 0.5 μM C2B, 1 mM Ca2+, after 40 min incubation, particle size of liposomes was monitored using DLS. Data are presented as the mean ± SD, technical replicates. n.s., not significant (p > 0.05); ***p<0.001; two-way ANOVA, n = 5. (B) SNARE complexes were largely assembled before Ca2+ triggering and not promoted upon Ca2+ triggering (1480 s–1500 s). Liposome compositions are indicated below the diagram. 0.2 mM EDTA, complexin-1 (cpx), Syt1 C2B and poly-D-lysine were present all the time unless indicated, Ca2+ was added to trigger fusion after 1480 s incubation. BODIPY FL (donor) and TMR (tetramethylrhodamine, acceptor) were labeled on Syb and Syx (D44C, green sphere and S200C, magenta sphere as shown in the schematic diagram, respectively) separately.
Figure 7—figure supplement 3
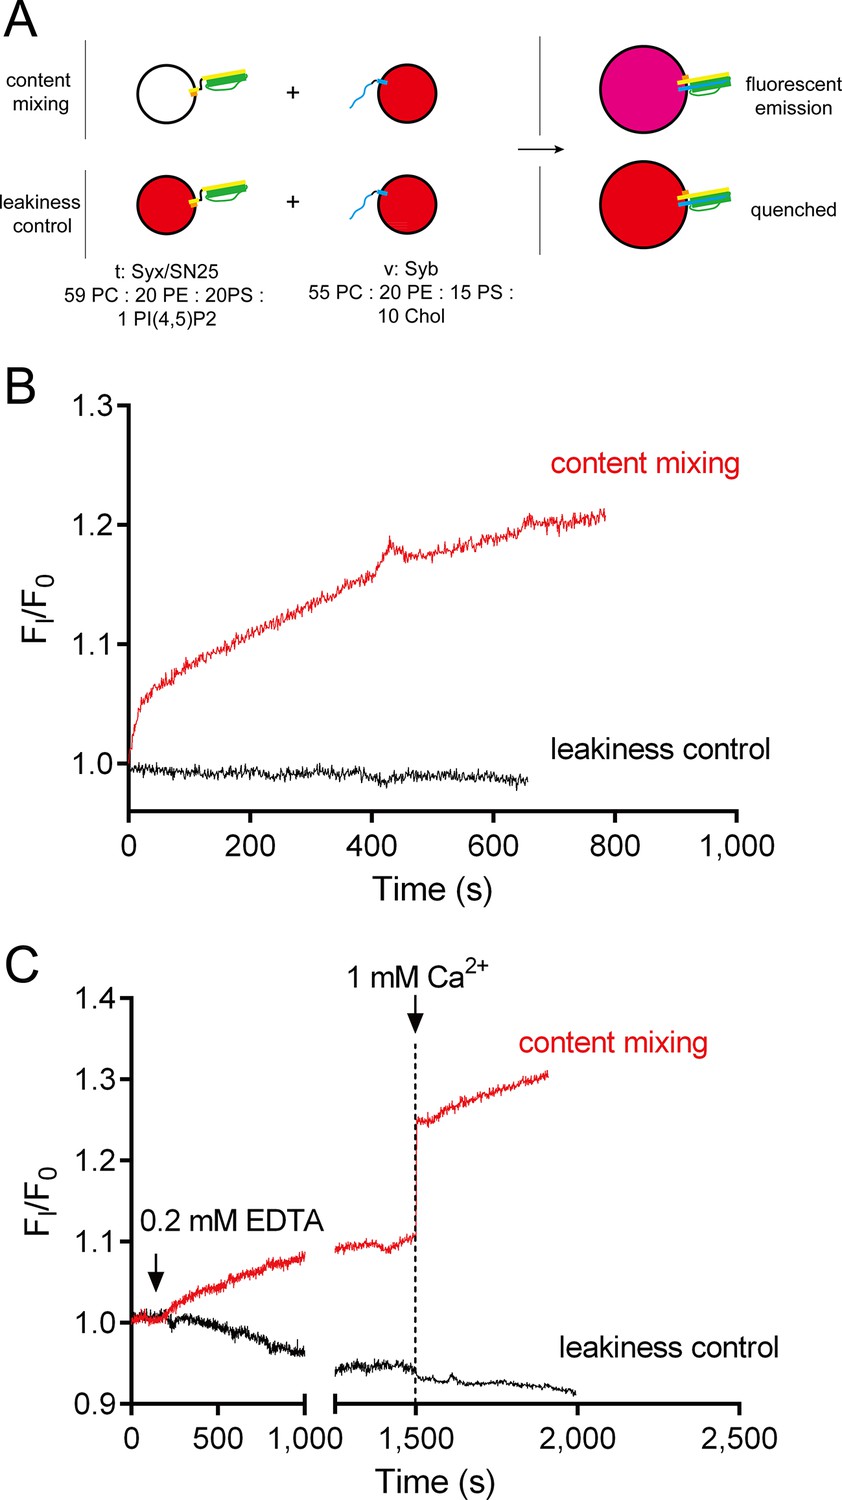
No leakiness of liposomes detected in the content-mixing experiments.
(A) Schematic diagram of the normal content mixing and the leakiness control assays. In the leakiness control, both v-liposomes and t-liposomes were loaded with 40 mM sulforhodamine. Liposome compositions are indicated below the diagram. (B) Leakiness was not detected in SNARE-dependent content mixing promoted by poly-D-lysine. (C) Leakiness was not detected in Ca2+-triggered content mixing in the presence of poly-D-lysine, complexin and Syt1 C2AB.
Figure 8
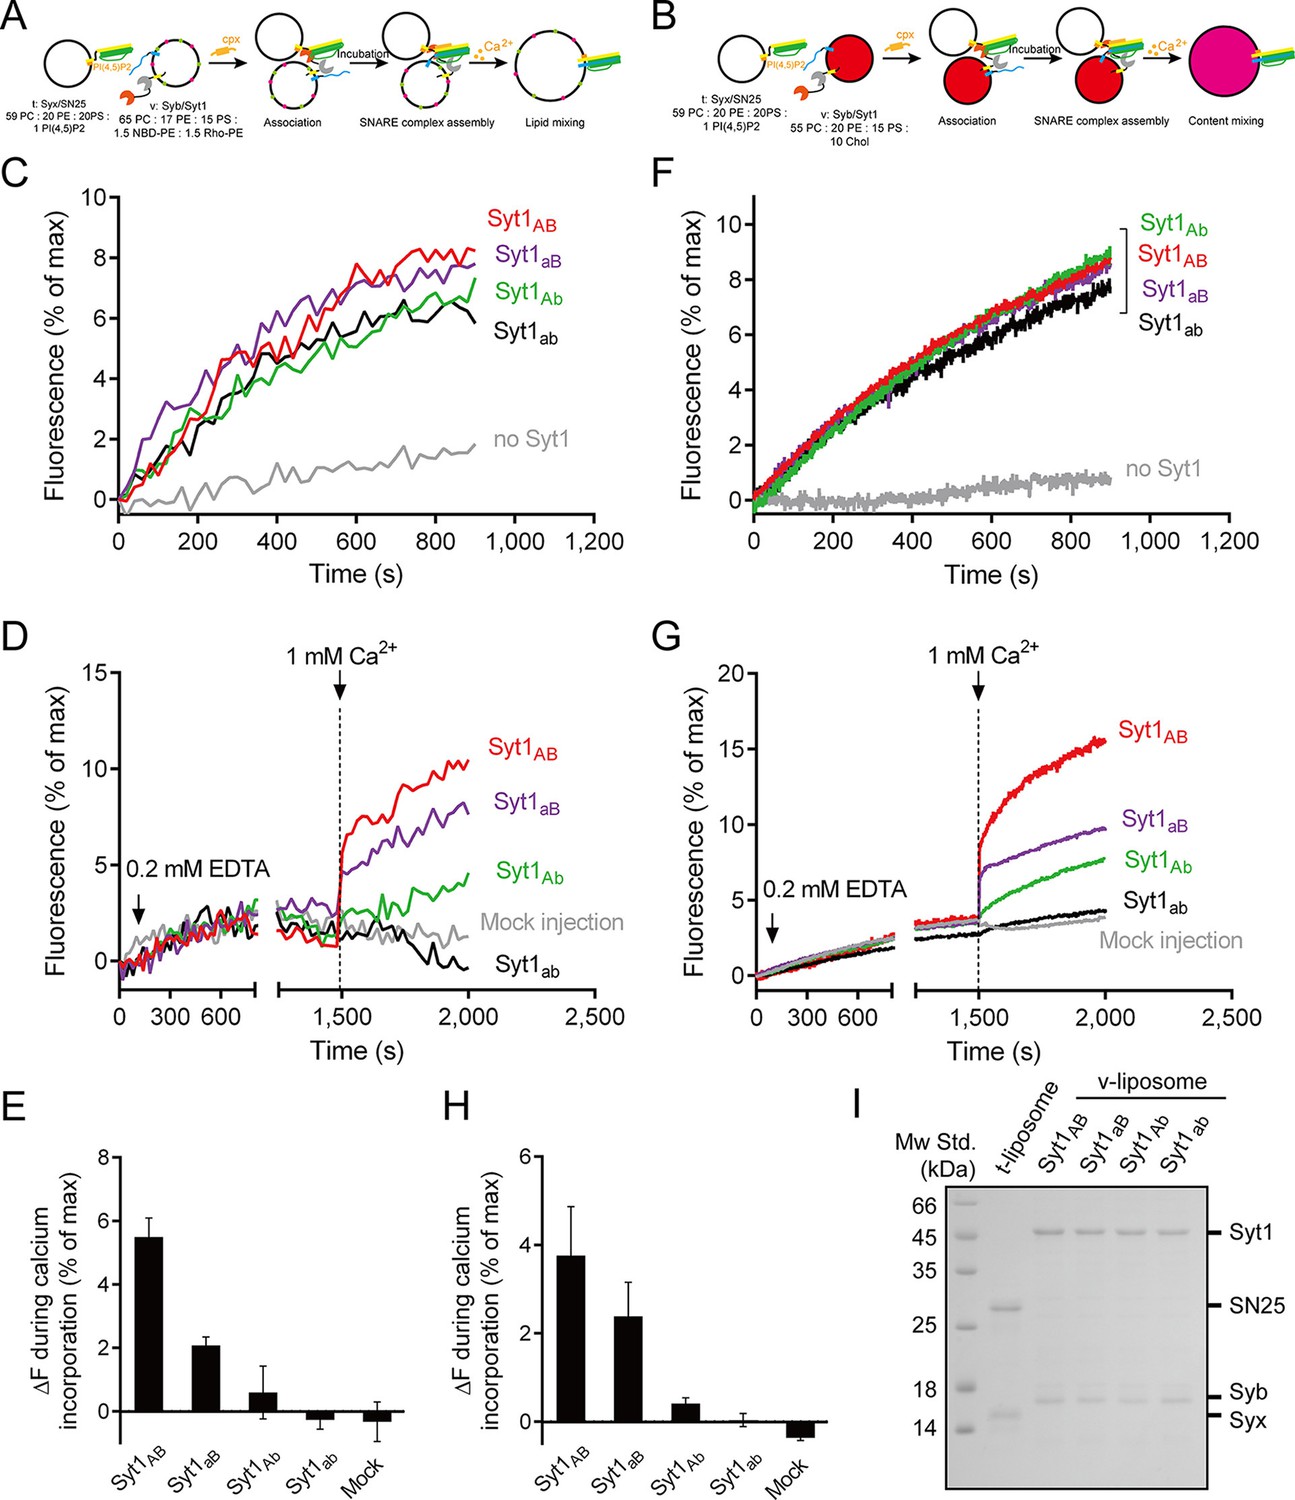
Functional analysis of the Ca2+-binding loops on full-length Syt1 in triggering liposome fusion.
(A and B) Schematic diagrams of the lipid mixing (A) and content mixing (B). (C and F) Syt1 stimulates lipid mixing (C) and content mixing (F) in the absence of Ca2+ and complexin-1 (cpx). (D and G) The functional analysis of the Ca2+-binding loops on Syt1 full-length in triggering lipid mixing (D) and content mixing (G). (E and H) Quantification of the lipid-mixing (E) and content-mixing results (H) in D and G, respectively. Data are presented as the mean ± SD (n = 3), technical replicates. (I) Analysis of reconstituted proteins on liposomes by SDS-PAGE. Mock injection represents the addition of the buffer (no Ca2+) instead of CaCl2 during triggering.
Figure 9

A working model of Syt1 in triggering membrane fusion.
(A) Binding of Syt1 C2B to PI(4,5)P2 and primed trans-SNARE complex on the plasma membrane before Ca2+ influx. (B) The simultaneous interactions of C2B with primed trans-SNARE complex and PI(4,5)P2-PS-containing membranes in response to Ca2+ cause bucking toward the synaptic vesicle of the plasma membrane. Note that a similar model has been recently proposed (Zhou et al., 2015). (C) Membrane bucking might cooperate with the action of Syt1 C2B in displacing inhibitory complexin-1 to facilitate the continuous helical SNARE complex assembly, thus triggering membrane fusion and neurotransmitter release. SV, synaptic vesicle; PM, pre-synaptic membrane.
Download links
A two-part list of links to download the article, or parts of the article, in various formats.
Downloads (link to download the article as PDF)
Open citations (links to open the citations from this article in various online reference manager services)
Cite this article (links to download the citations from this article in formats compatible with various reference manager tools)
Synaptotagmin-1 C2B domain interacts simultaneously with SNAREs and membranes to promote membrane fusion
eLife 5:e14211.
https://doi.org/10.7554/eLife.14211


