NOVA regulates Dcc alternative splicing during neuronal migration and axon guidance in the spinal cord
- University of Colorado, United States
- Howard Hughes Medical Institute, The Rockefeller University, United States
- The Rockefeller University, United States
Figures
Figure 1 with 2 supplements
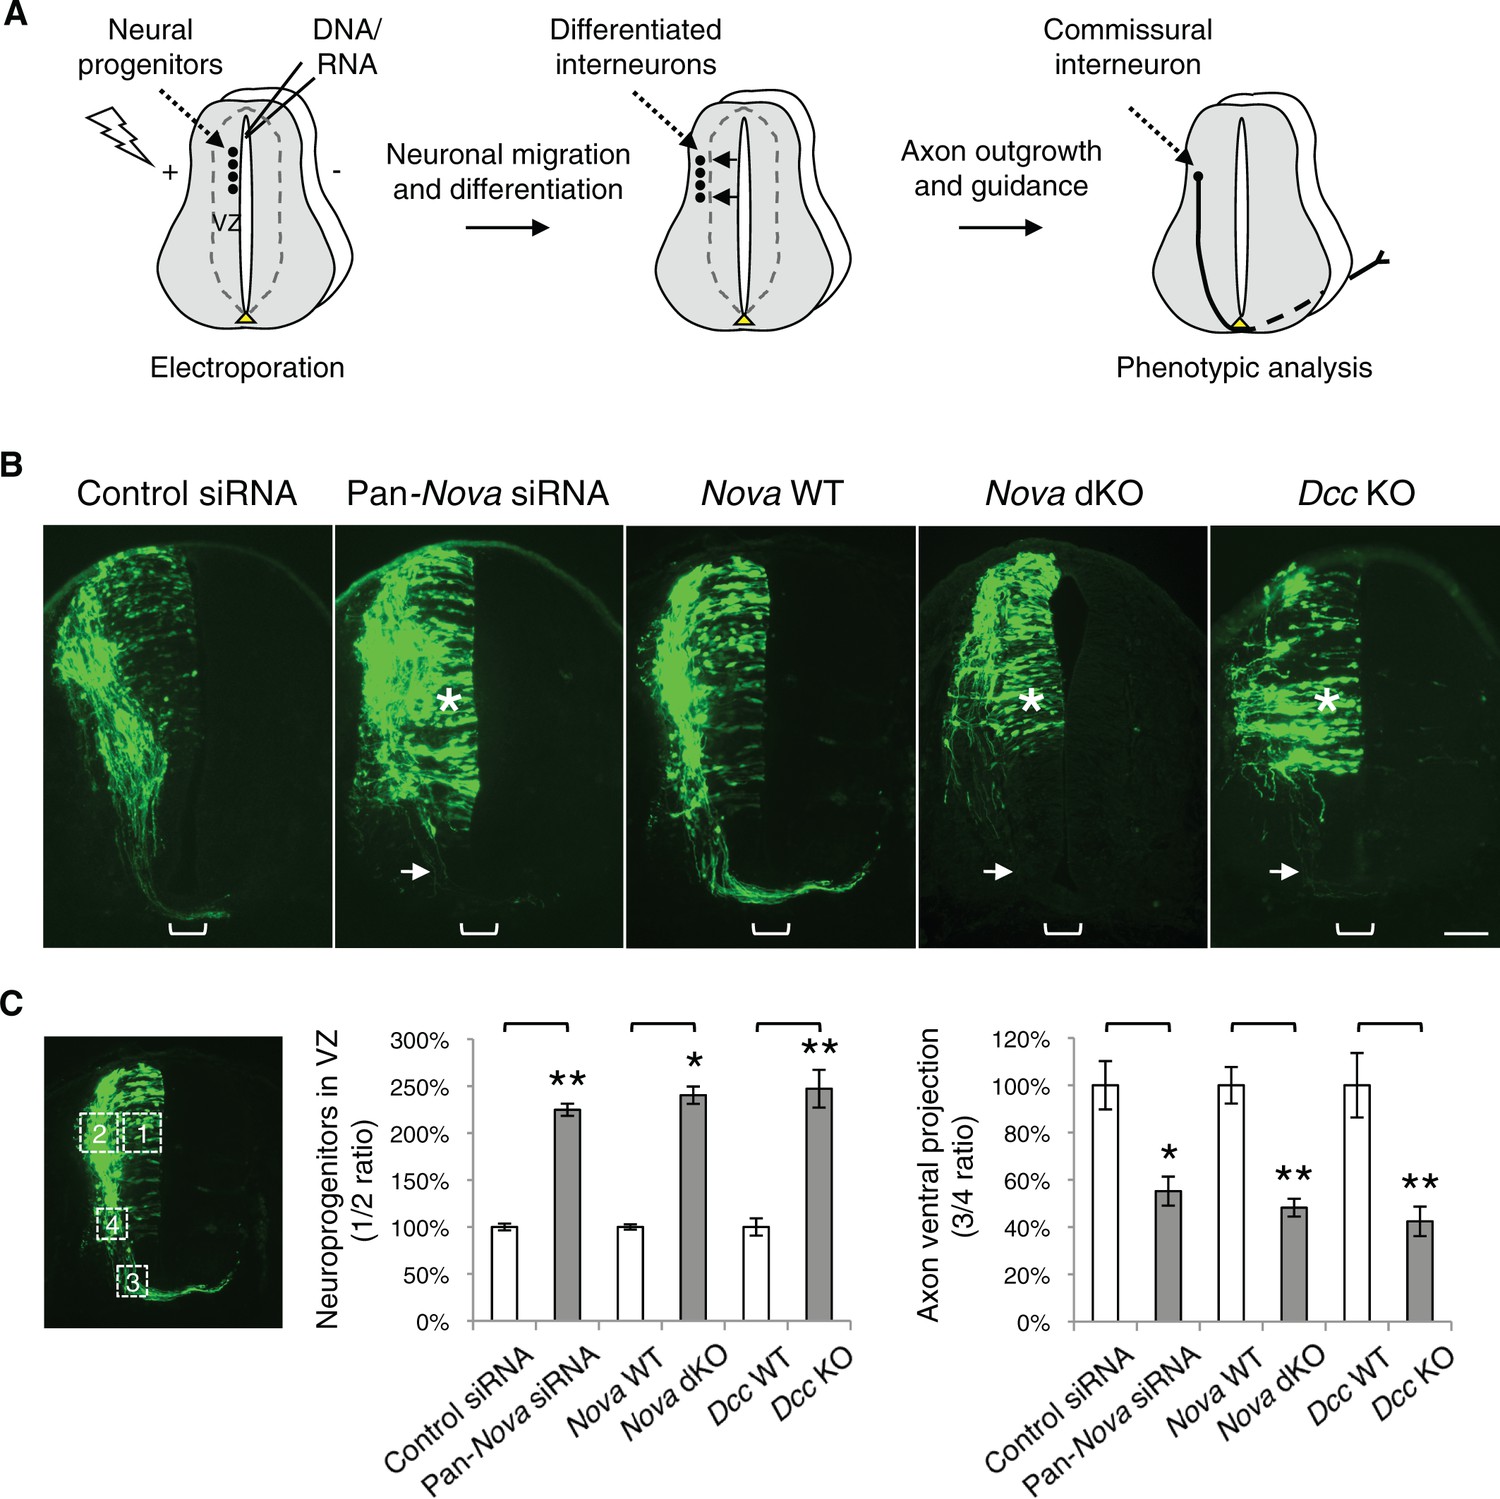
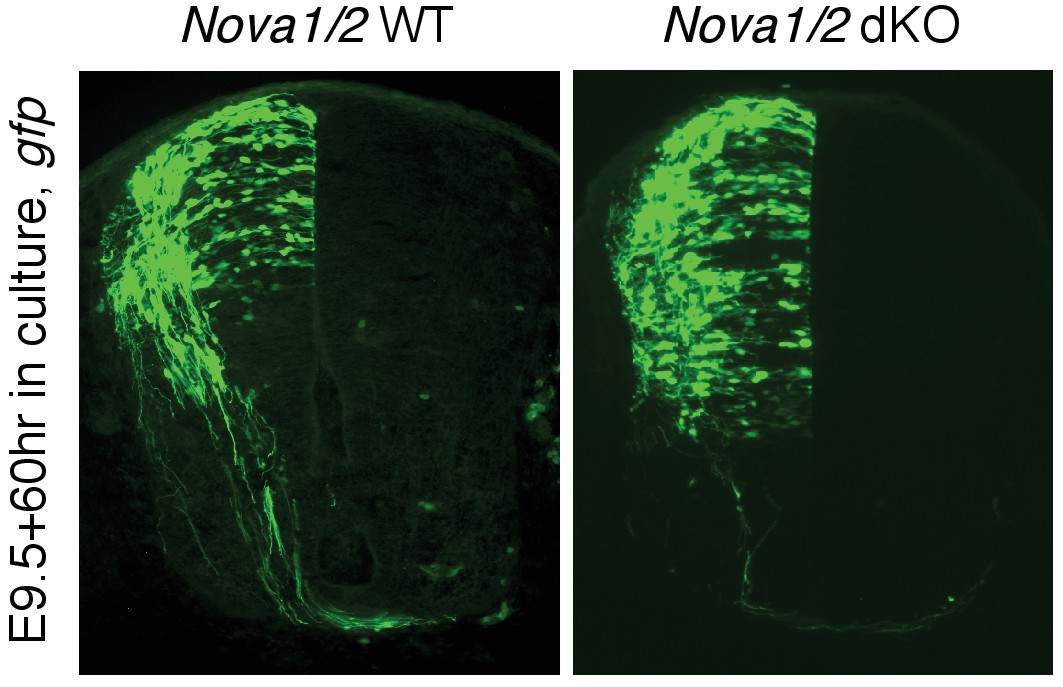
Nova1/2 loss of function disrupts the development of dorsal spinal cord interneurons.
(A) Schematic of neural development in the dorsal spinal cord during whole embryo culture. Nucleotides are microinjected and electroporated into neural progenitors at the superficial layer of the ventricular zone (VZ, outlined by dashed lines). We observed that the dorsal interneuron progenitors are mostly targeted whereas the ventral motor neuron progenitors are not. The dorsal interneuron progenitors migrate laterally and exit the VZ to differentiate into commissural and ipsilateral interneurons. These interneurons continue to migrate laterally as well as along the dorsoventral axis. Mature commissural neurons extend axons to and across the ventral midline. (B) Transverse sections of spinal cords electroporated with control or pan-Nova siRNAs, and sections from wildtype (WT), Nova double knockout (dKO), and Dcc KO. Actb-gfp was used to label the highly heterogeneous interneuron populations. Nova and Dcc deficiency leads to an increased number of neuroprogenitors in the VZ (asterisk), and fewer and shorter ventrally-projecting axons (arrow). Bracket, the ventral midline. (C) Quantification of phenotypes in B. Neuroprogenitors in the VZ is quantified as the ratio between the signal from the medial spinal cord (boxed area 1) to that from the lateral spinal cord (area 2). Axon ventral projection is quantified as the ratio between the signal from axons that have reached the ventral margin (area 3) and that from the beginning of the axon shaft (area 4). For quantification of phenotypes in all experiments, if Nova WT and dKO were not littermates, they were first normalized to the respective double heterozygous (dHet) littermates, and were then compared with each other. Dcc KOs were compared with WT littermate controls. Also see Figure 1—source data 1 for additional quantification. Data are represented as the mean ± SEM (Student’s t-test, *p<0.05, **p<0.001). Scale bar, 50 μm.
-
Figure 1—source data 1
Quantification of neuronal migration and axon projection phenotypes in cultured embryos.
- https://doi.org/10.7554/eLife.14264.005
Figure 1—figure supplement 1
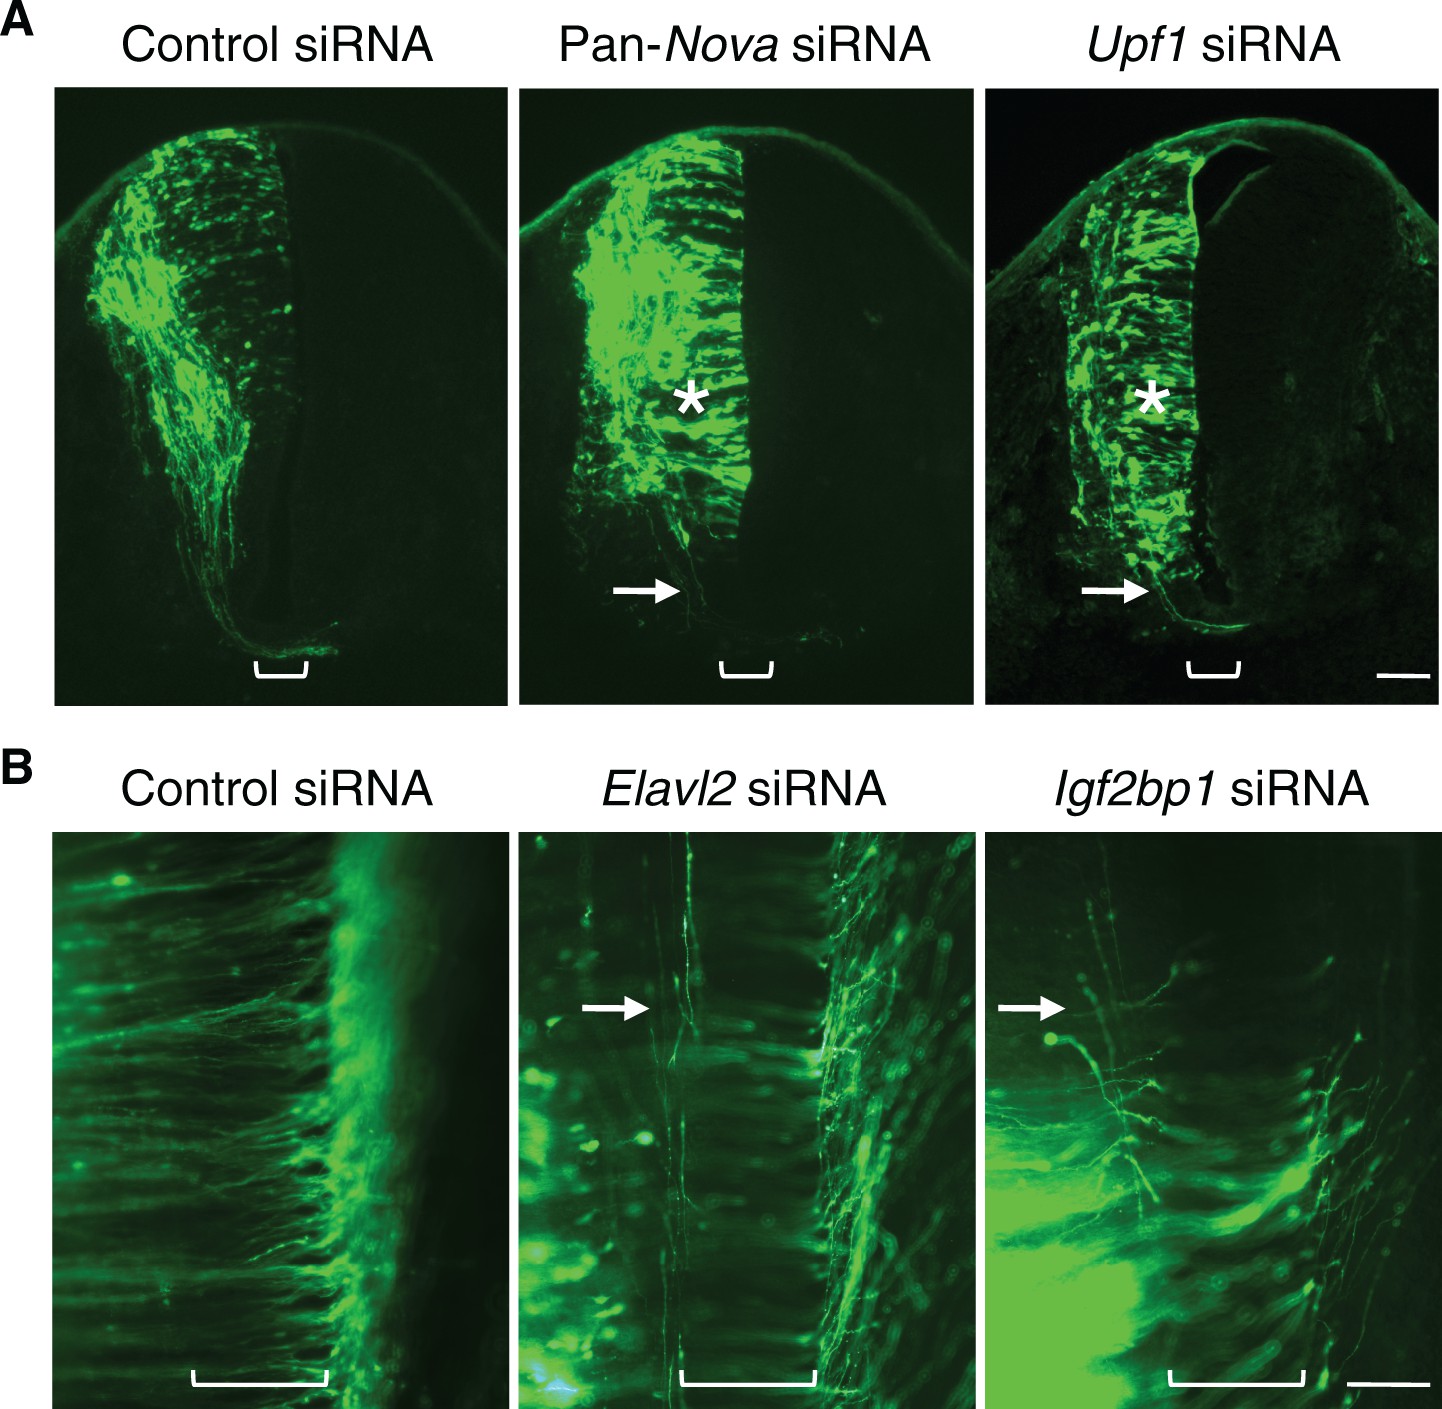
RNAi phenotypes of candidate RNA-binding proteins.
(A) Transverse sections of spinal cords treated with control, pan-Nova, and Upf1 siRNAs. The latter two siRNA treatments cause defects in progenitor migration and commissural axon ventral projection (indicated with asterisk and arrow, respectively). Also see Figure 1 for Nova RNAi effect. (B) Openbook preparation of spinal cords treated with control, Elavl2, and Igf2bp1 siRNAs. Neurons electroporated with gfp and siRNAs are orientated to the left, and their axons project to and across the midline (bracket). Elavl2 and Igf2bp1 knockdown causes some commissural axons to abnormally remain on the ipsilateral side (indicated with arrow). Scale bars, 50 μm.
Figure 1—figure supplement 2
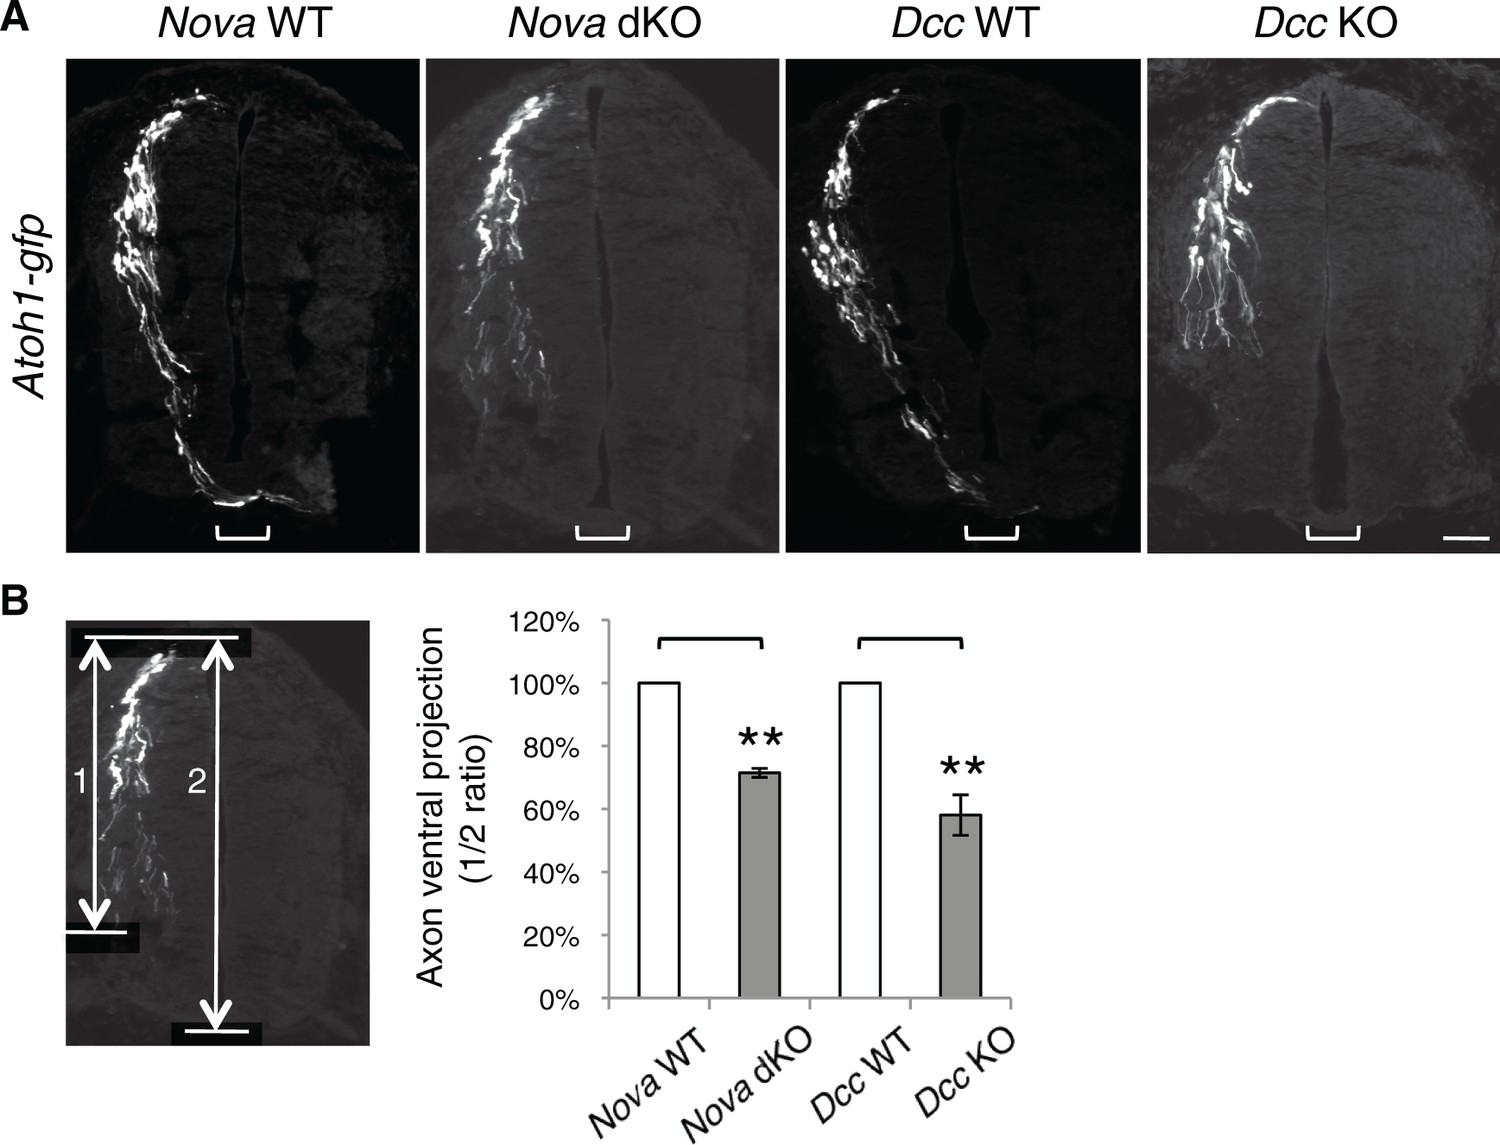
Nova and Dcc KOs cause axon projection defect.
(A) Atoh1-gfp was used to label the dorsal most dI1 population of interneurons and their progenitors. Nova and Dcc KO axons are shorter and fail to reach the midline (bracket). (B) Quantification of ventral axon projection in A. The distance from the dorsal margin of the spinal cord to the ventral most axons is compared to the total height of the spinal cord (1/2 ratio). Data are normalized to WT and are represented as the mean ± SEM (Student’s t-test, **p<0.001). Also see Figure 1—source data 1 for additional quantification. Scale bar, 50 μm.
Figure 2 with 1 supplement

Expression of neuronal and axonal markers in cultured Nova WT and dKO embryos electroporated with Actb-gfp.
PAX3/7 immunostaining labels dorsal interneuron progenitors, which reside within the ventricular zone and give rise to different populations of interneurons. BARHL2 and LHX5 stainings label differentiated interneurons at the lateral spinal cord. ROBO3 staining specifically labels the commissural axons. Scale bar, 50 μm.
Figure 2—figure supplement 1
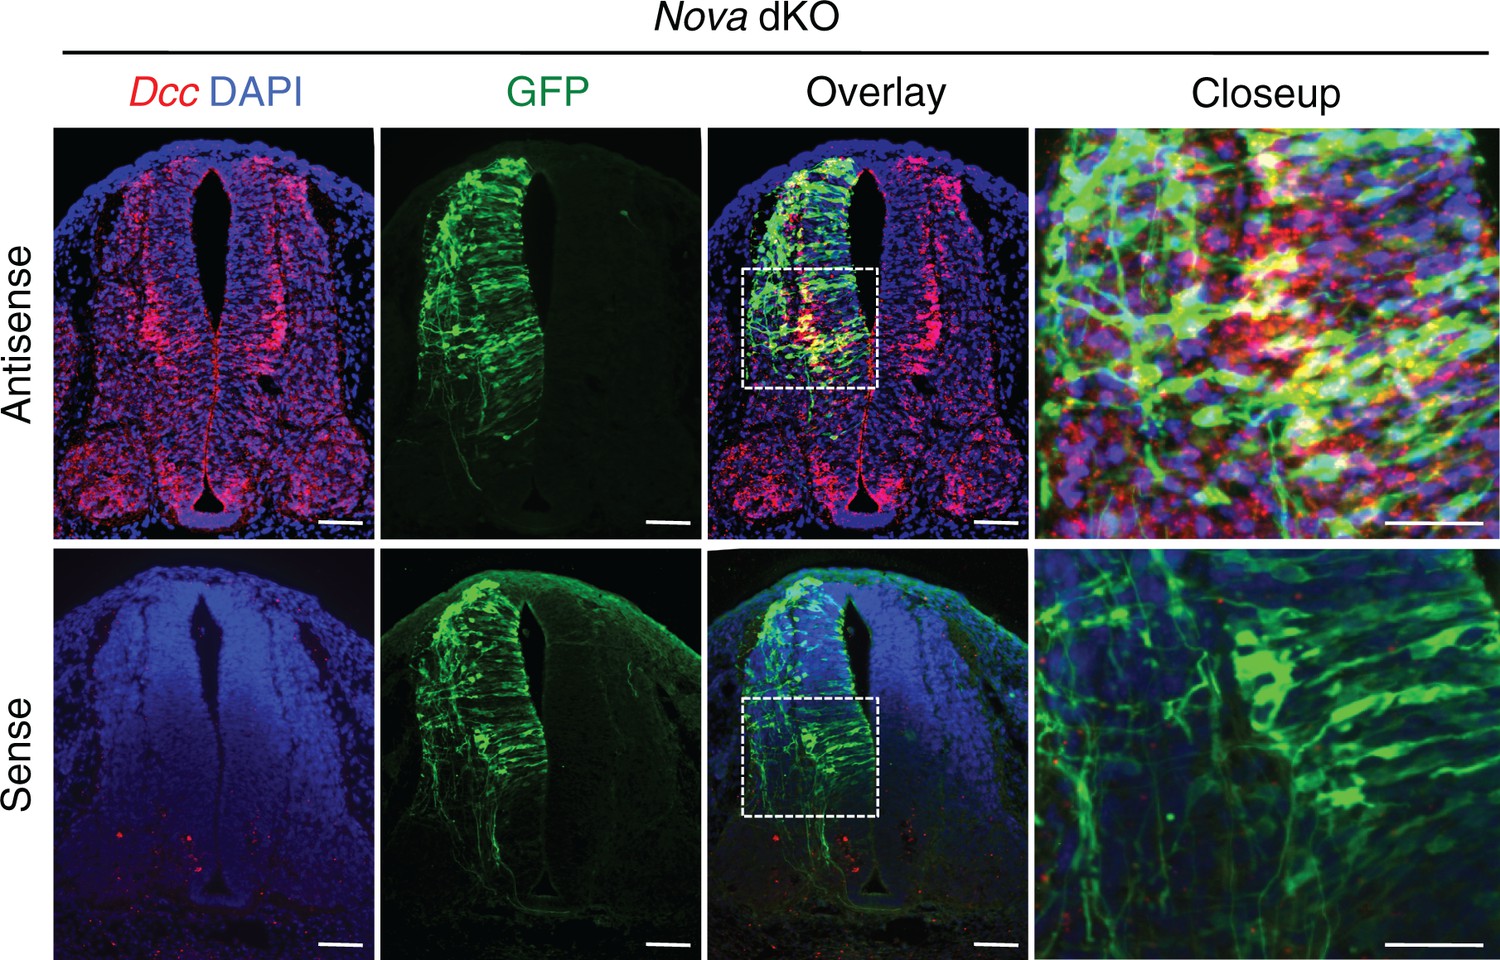
Fluorescent in situ hybridization of Dcc in cultured embryos electroporated with Actb-gfp.
Nova dKO was used as there are more GFP+ neurons in the VZ. Dcc expression is seen in GFP+ neuroprogenitors and interneurons. Scale bars, 50 μm.
Figure 3 with 2 supplements
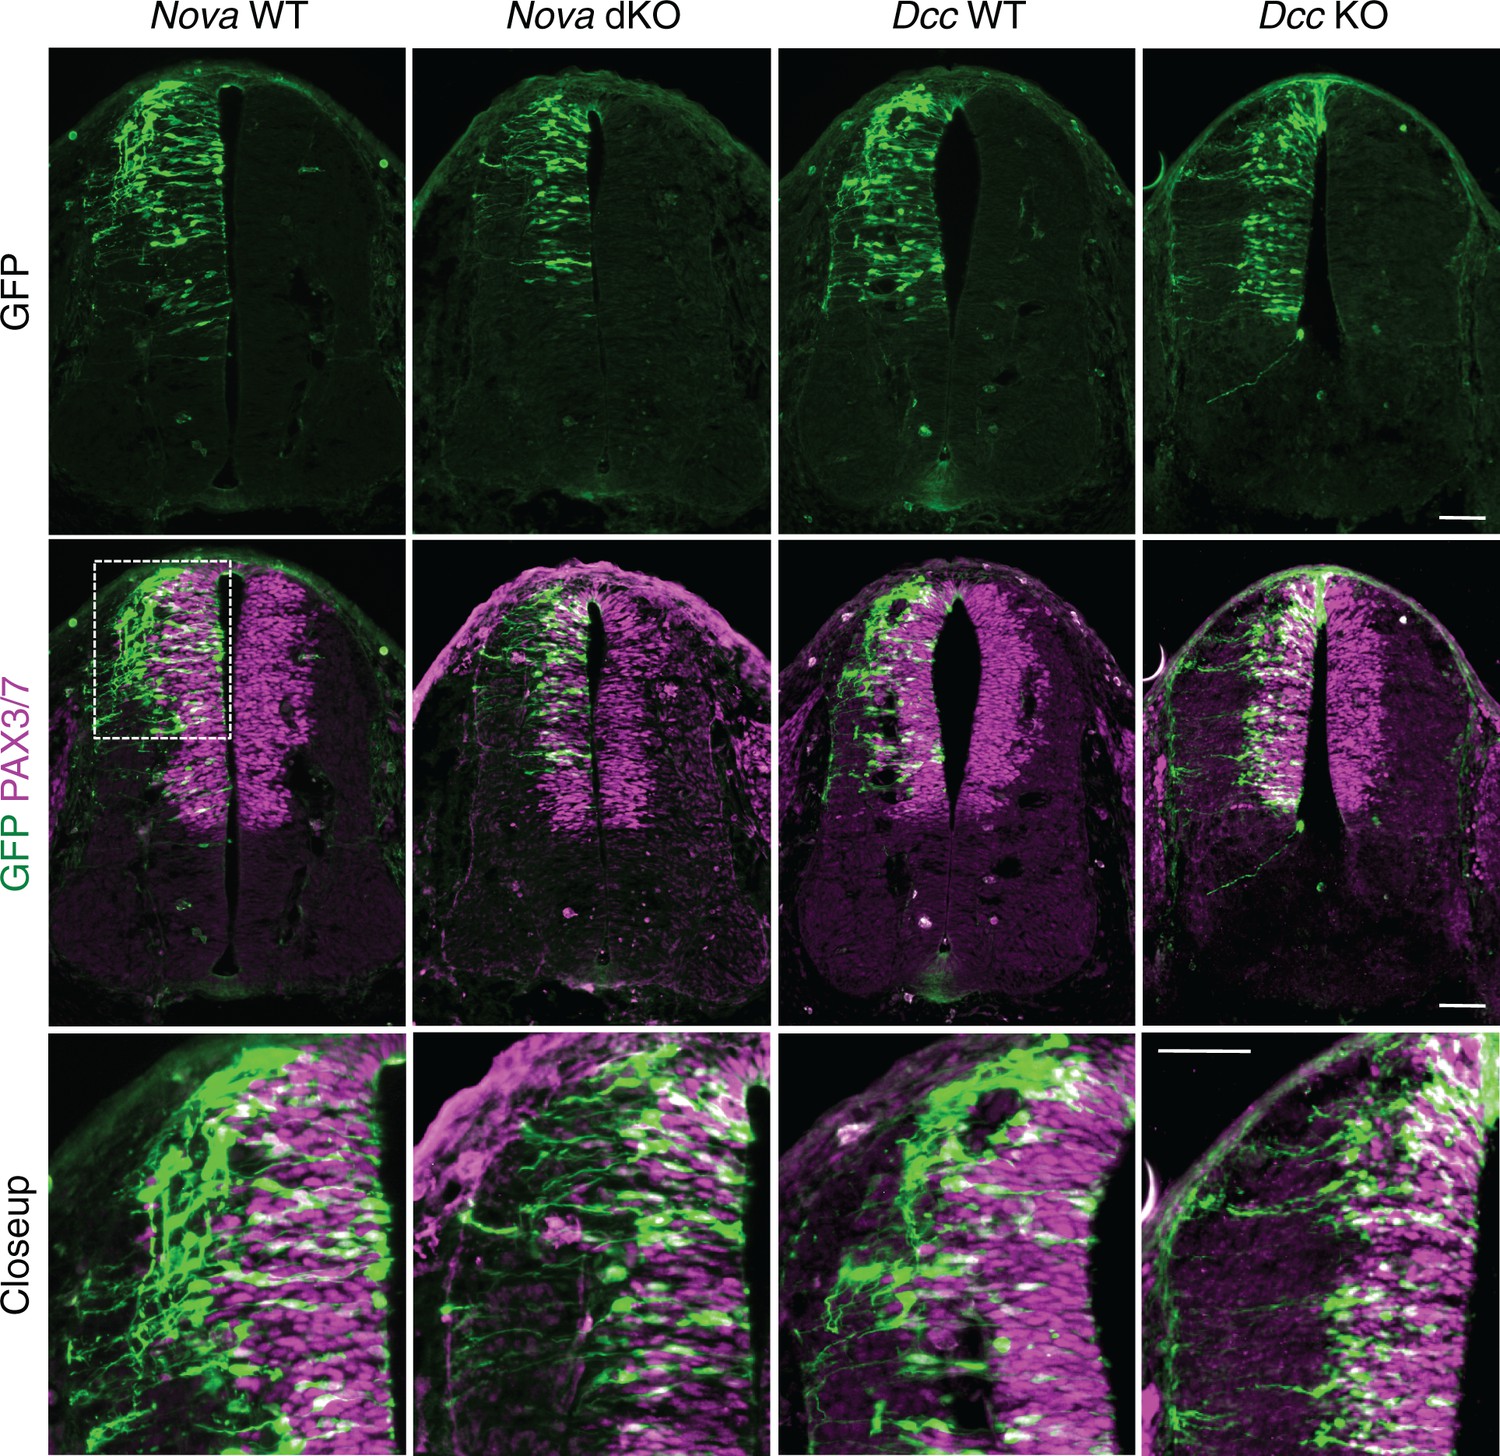
Nova and Dcc knockouts delay the lateral migration of dorsal interneuron progenitors.
Actb-gfp was electroporated into neural progenitors and embryos were cultured for 20 hrs. The bottom panel shows the closeup images of the boxed area from the middle panel. Many WT neurons have migrated out of the VZ (demarcated by PAX3/7 staining) after 20 hrs, whereas Nova and Dcc KO neurons are mostly located within the VZ. Scale bars, 50 μm.
Figure 3—figure supplement 1
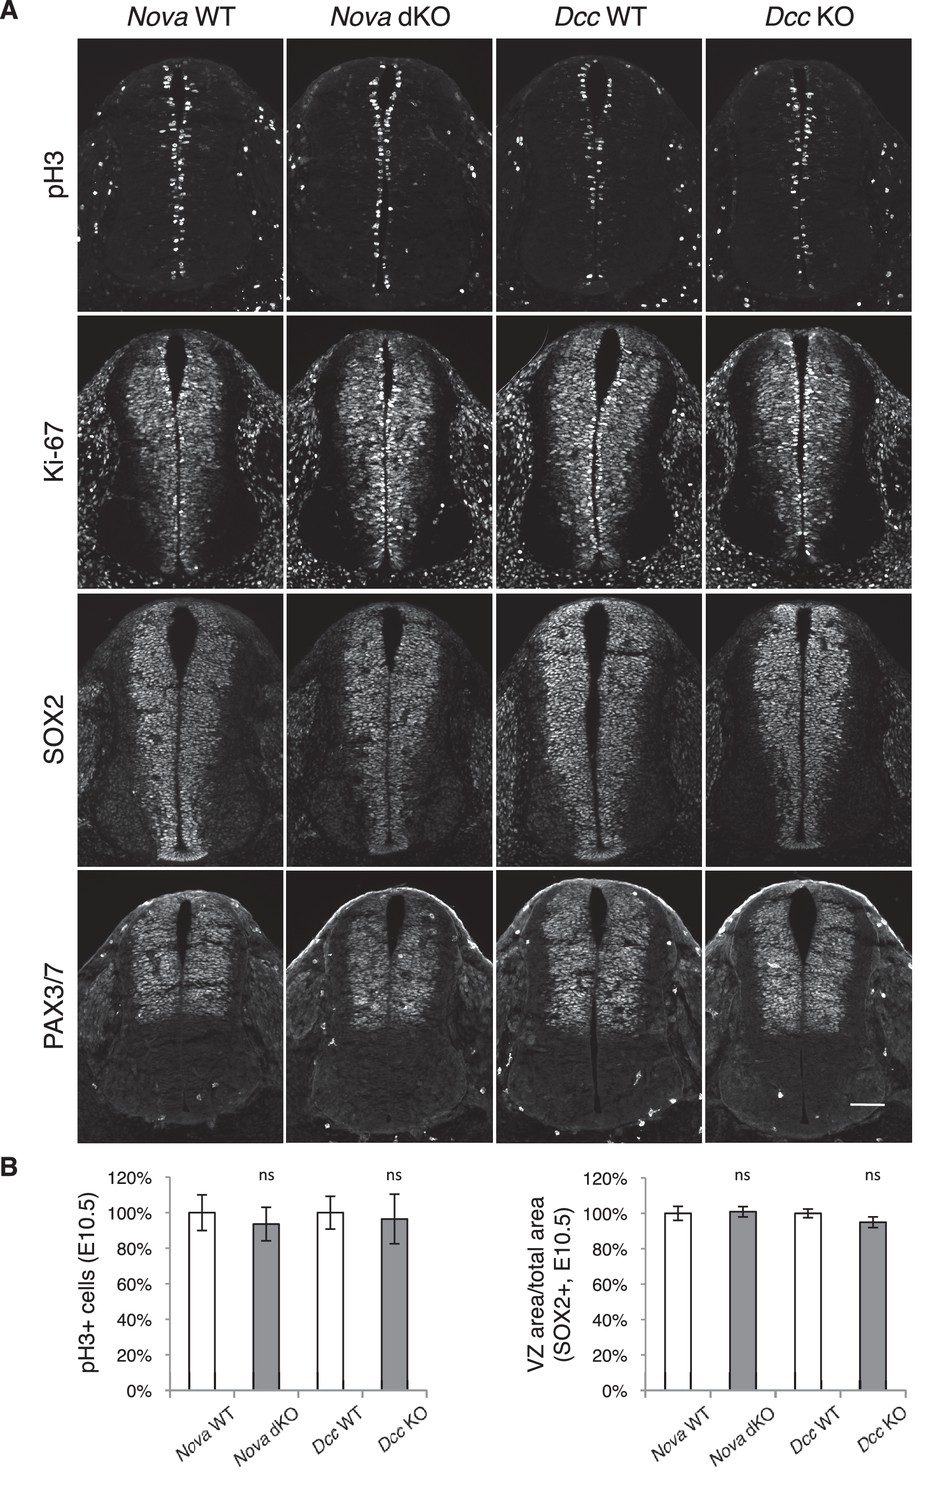
Neural stem cells and progenitors appear normal in Nova and Dcc KOs.
(A) Immunohistochemistry of phospho-histone H3, a mitotic marker, Ki-67, a cell proliferation marker, SOX2, a neural progenitor marker, and PAX3/7, a dorsal interneuron progenitor marker, in E10.5 spinal cords. (B) Quantification of phenotypes in A. pH3+ cells were counted and normalized to WT. The ratio between the SOX2+ VZ area and the total spinal cord area was quantified and normalized to WT. Data are represented as the mean ± SEM (Student’s t-test, ns, not significant). Scale bar, 50 μm.
Figure 3—figure supplement 2
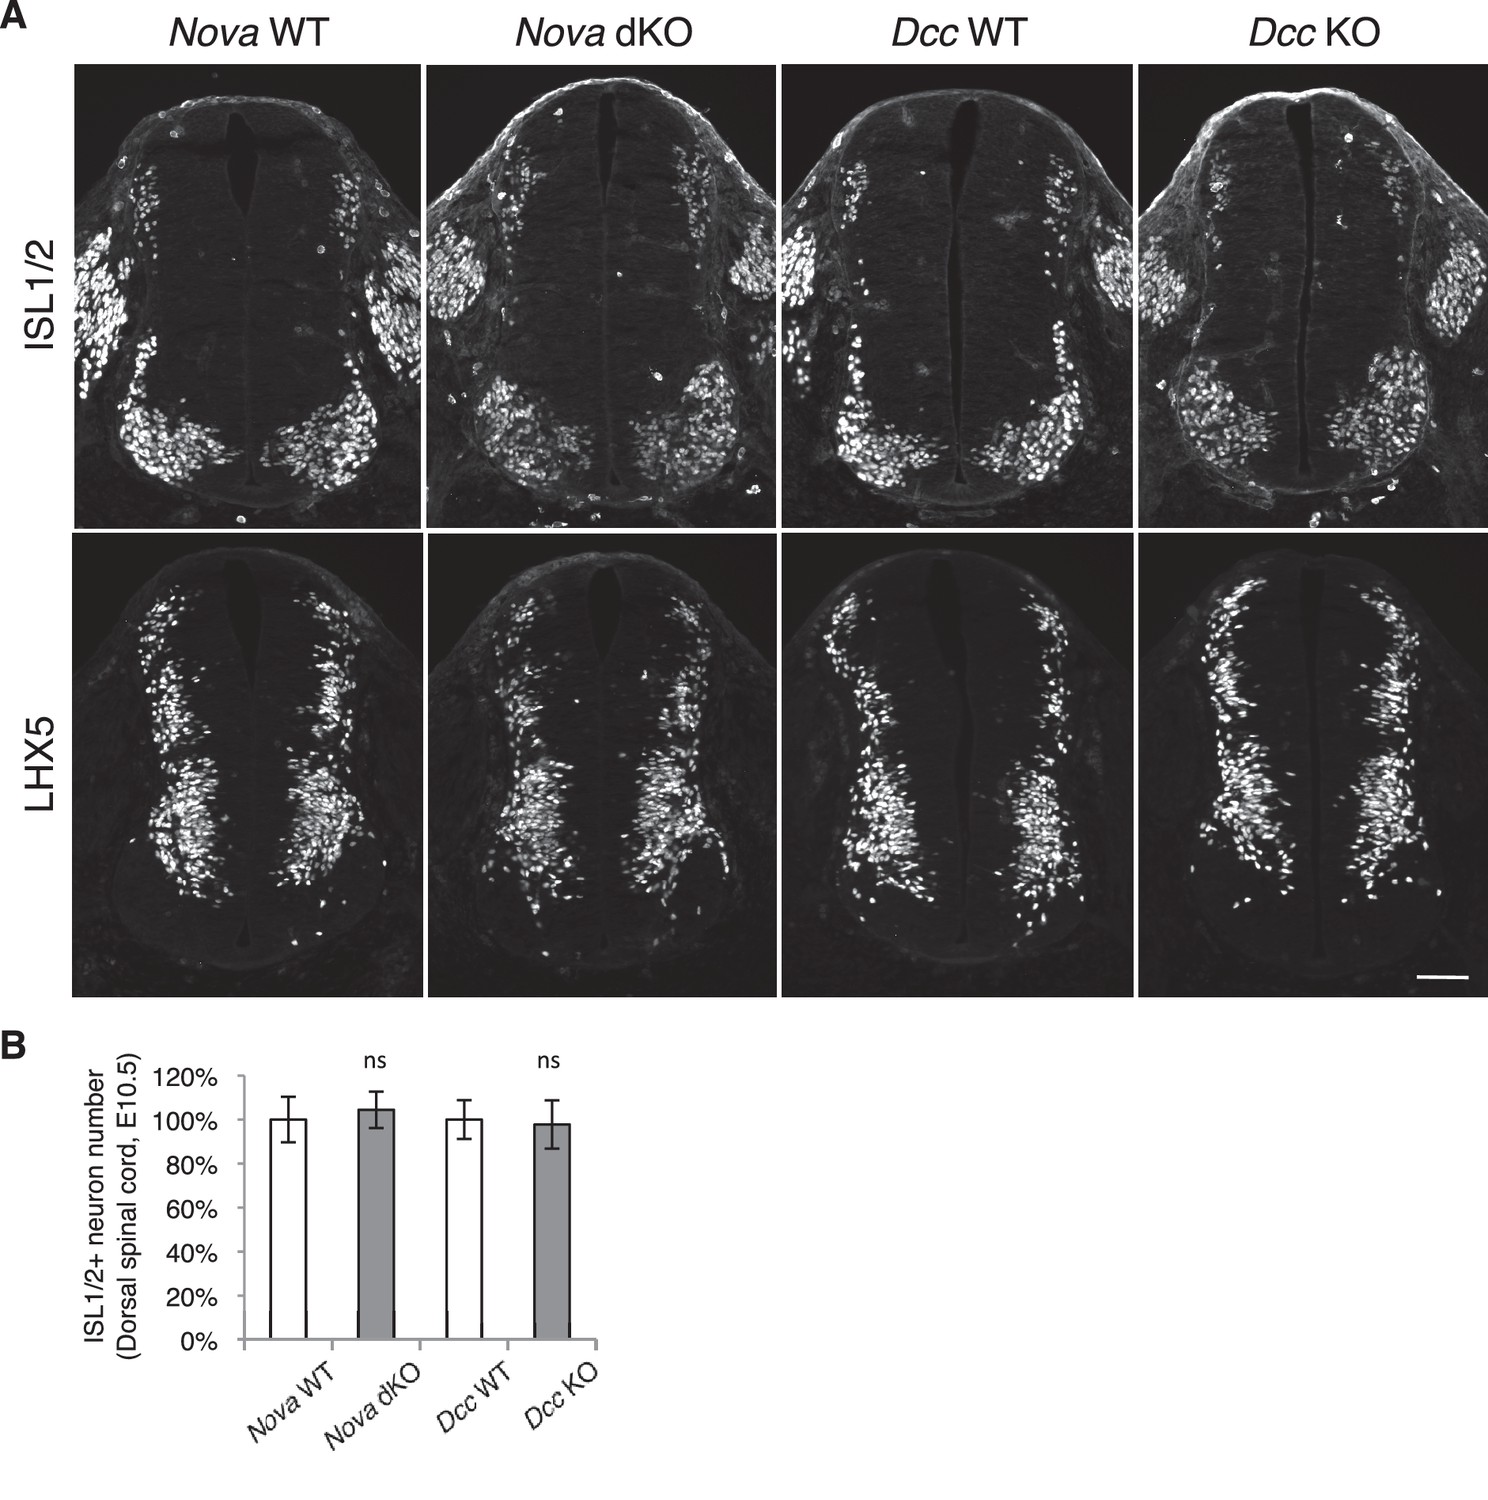
Dorsal interneuron differentiation is normal in Nova and Dcc KOs.
(A) Immunohistochemistry of ISL1/2 and LHX5 in Nova WT, Nova dKO, Dcc WT, and Dcc KO spinal cords at E10.5. The markers are expressed by different subpopulations of interneurons in the dorsal spinal cord. (B) Quantification of ISL1/2+ neurons located in the dorsal half of the spinal cord. Data are normalized to WT and are represented as the mean ± SEM (Student’s t-test, ns, not significant). Scale bar, 50 μm.
Figure 4
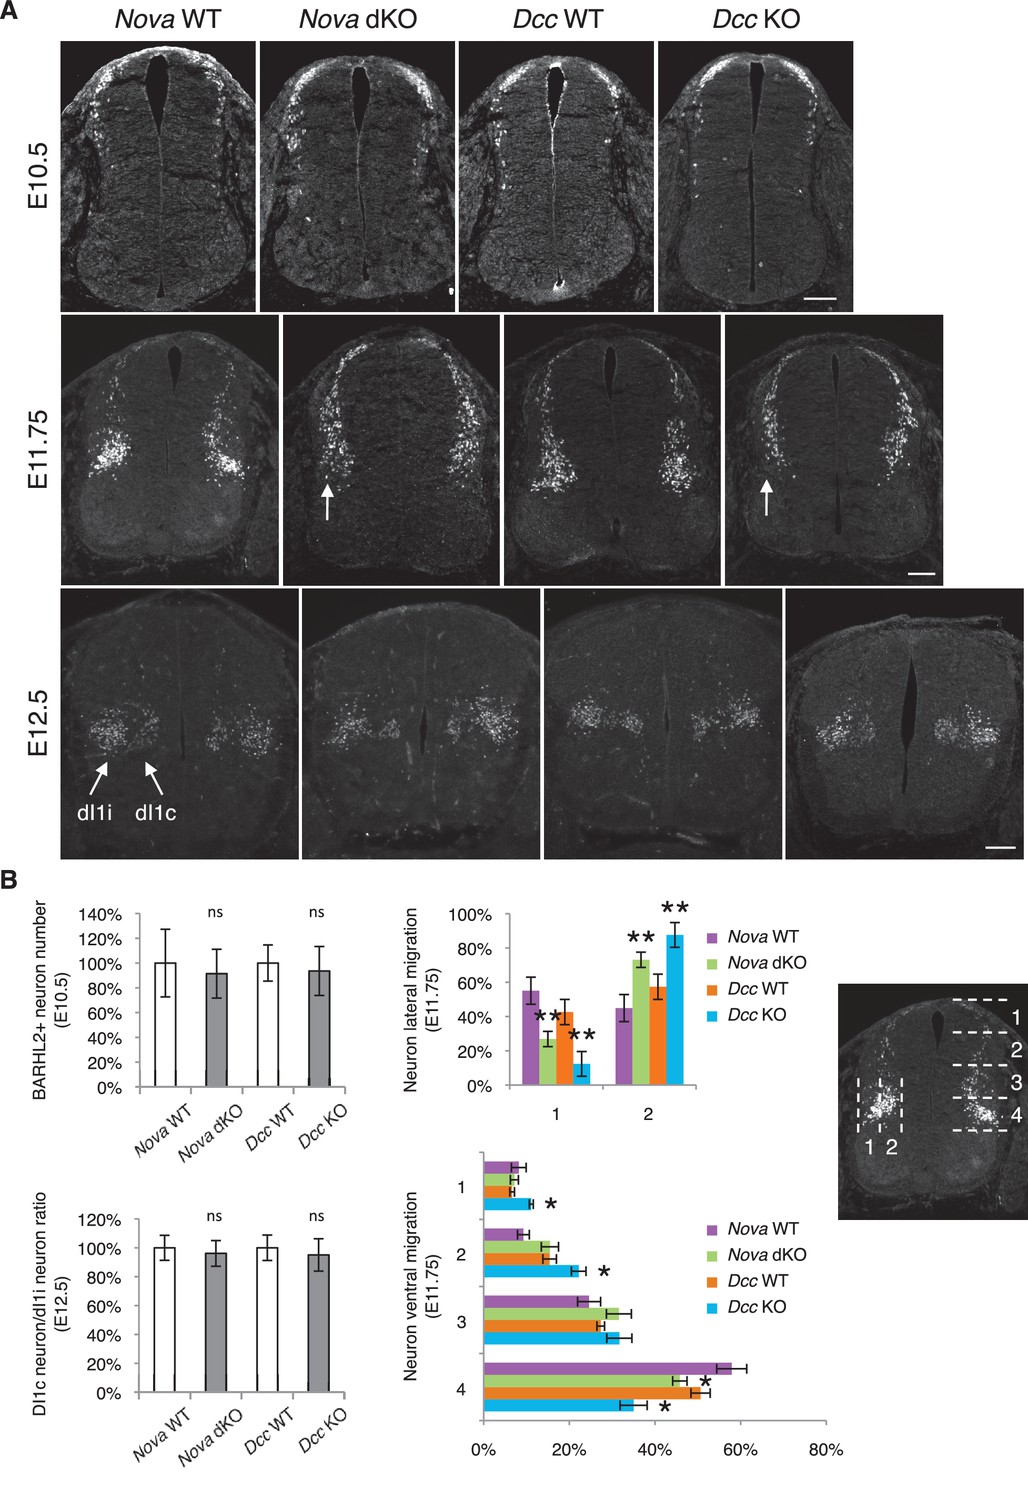
Nova and Dcc knockouts delay neuronal migration but do not disturb neuronal differentiation.
(A) Immunohistochemistry of BARHL2 in Nova WT, Nova dKO, Dcc WT, and Dcc KO spinal cords. A normal number of BARHL2+ neurons are generated in Nova and Dcc mutants at E10.5. At E11.75, BARHL2+ neurons fail to arrive at the lateral margin of the spinal cord in the KOs (indicated by arrow). Their ventral migration is also delayed. At E12.5, both dI1i (ipsilateral) and dI1c (commissural) populations appear normal in the mutants. (B) Quantification of phenotypes in A. For quantification of the lateral migration, the distance between the lateral margin of the spinal cord and the medial most BARHL2+ neurons are divided into two. The percentage of neurons within each half is shown. For quantification of the ventral migration, the distance from the dorsal margin of the spinal cord to the ventral most BARHL2+ neurons are divided into four. The percentage of neurons within each quarter (1 to 4 from dorsal to ventral) is shown. Three embryos from each genotype and at least five sections from each embryo were quantified. Data are normalized to WT for total neuron number and dI1c/dI1i ratio. Data are represented as the mean ± SEM (Student’s t-test for total neuron number, dI1c/dI1i ratio, and lateral migration, **p<0.001, ns, not significant. Two way ANOVA and Bonferroni post test for ventral migration, *p<0.05). Scale bars, 50 μm.
Figure 5 with 1 supplement
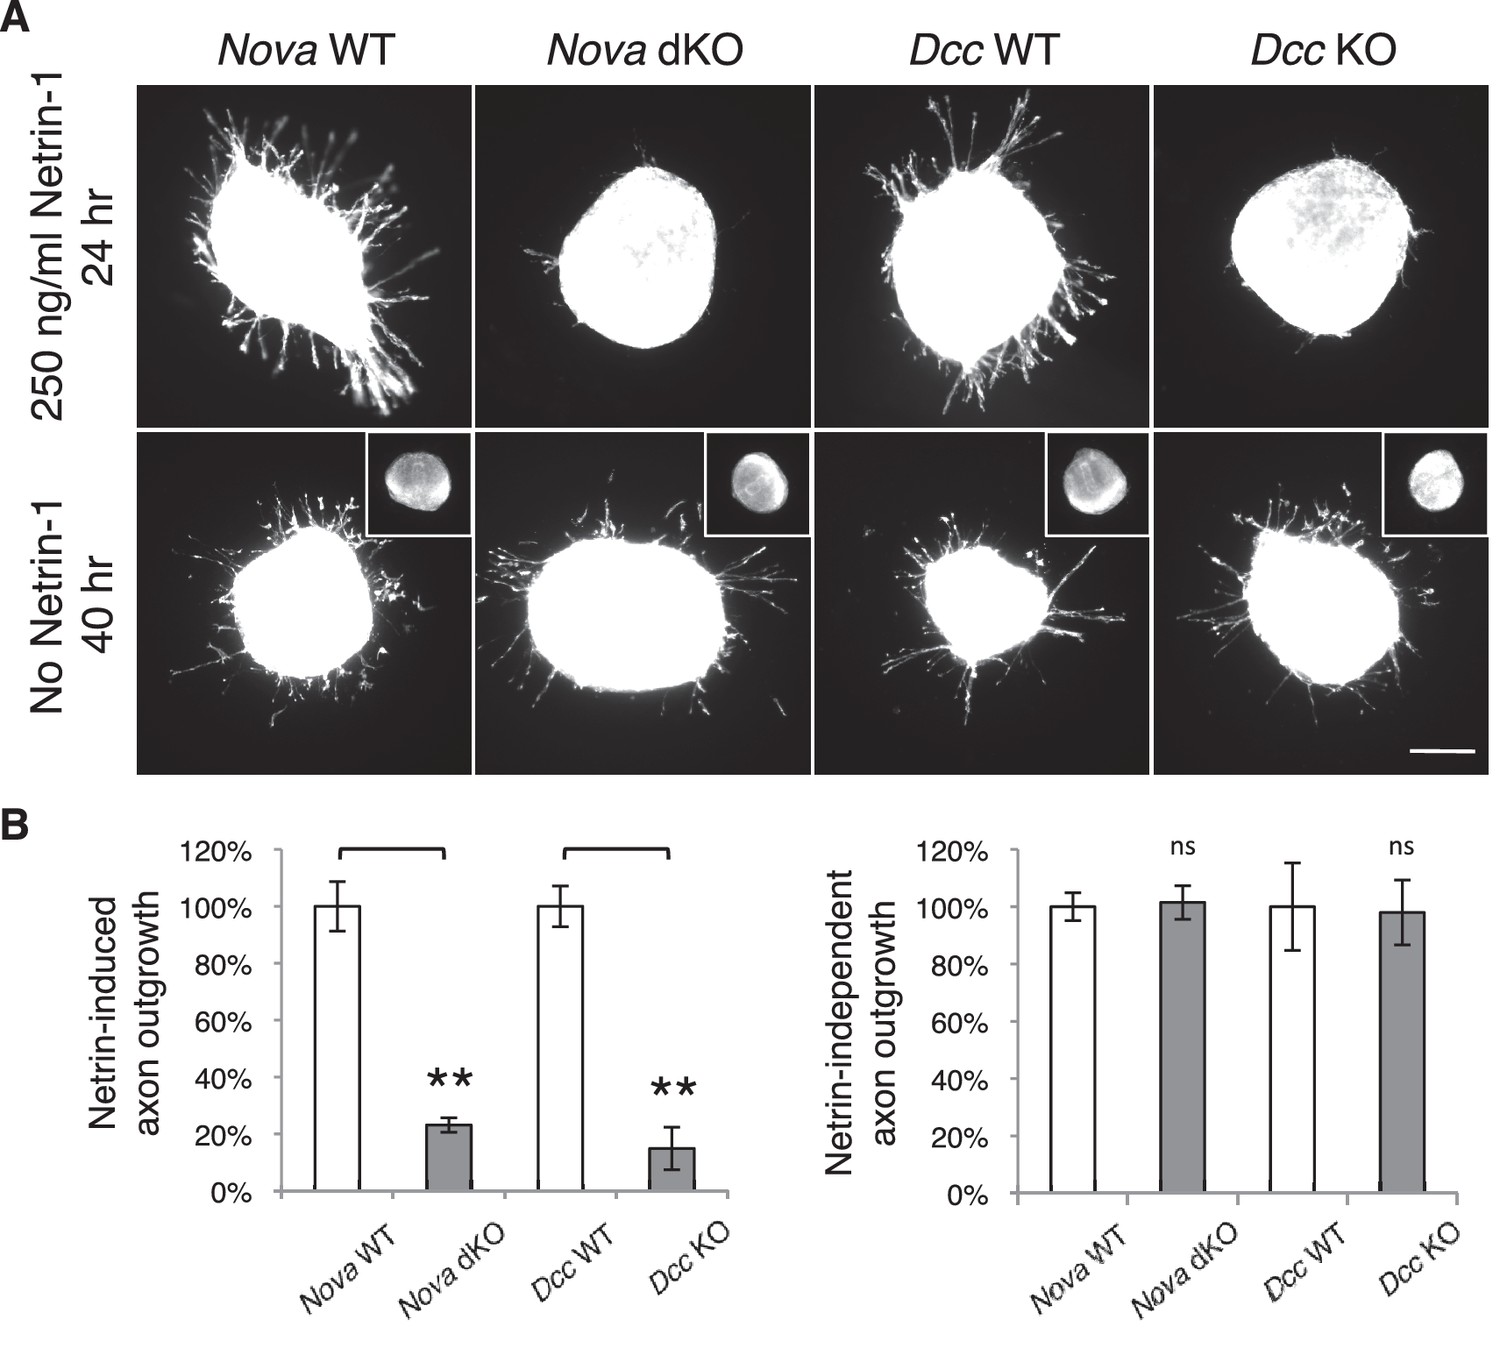
Nova dKO disrupts Netrin-1 induced axon outgrowth in dorsal spinal cord (DSC) explant assays.
(A) DSC axon outgrowth in Nova WT, Nova dKO, Dcc WT, and Dcc KO in the presence or absence of 250 ng/ml Netrin-1. Axons were visualized by rhodamine-phalloidin staining. Nova dKO and Dcc KO display a drastic reduction in axon growth in response to Netrin. However, both mutants are able to extend axons after an extended culture period in the absence of Netrin. The insets in the bottom panel show no axon outgrowth after 24 hrs of culturing for all genotypes in the absence of Netrin. (B) Quantification of axon outgrowth in A. Axon outgrowth is represented as the ratio between the signal from all axons extending out of the explant and that from the cell bodies within the explant, after background extraction. Three embryos from each genotype and at least five explants from each embryo were quantified. Data are normalized to WT and are represented as the mean ± SEM (Student’s t-test, **p<0.001, ns, not significant). Scale bar, 50 μm.
Figure 5—figure supplement 1
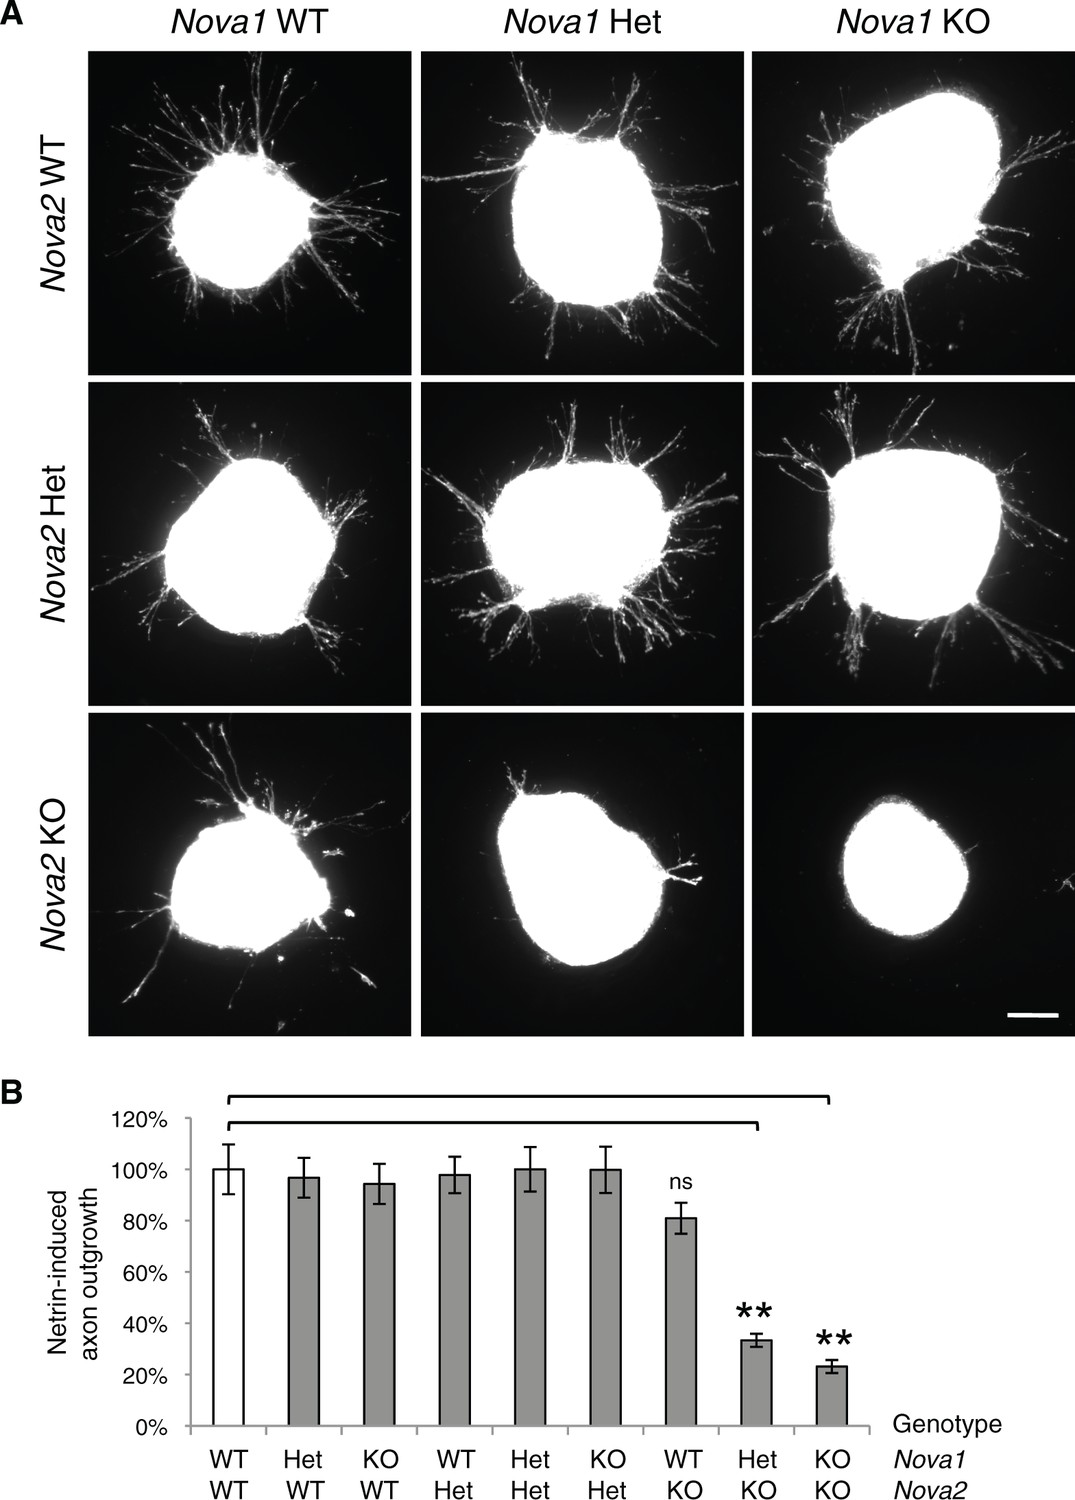
Commissural axon outgrowth in Nova embryos.
(A) Cultured dorsal spinal cord explants from nine genotypes. Explants were cultured for 24 hrs in the presence of 250 ng/ml Netrin-1 and axons were labeled with rhodamine-phalloidin. (B) Quantification of axon growth in A (normalized to WT). Data are represented as the mean ± SEM (one way ANOVA and Bonferroni post test, **p<0.001, ns, not significant). Scale bar, 50 μm.
Figure 6 with 1 supplement
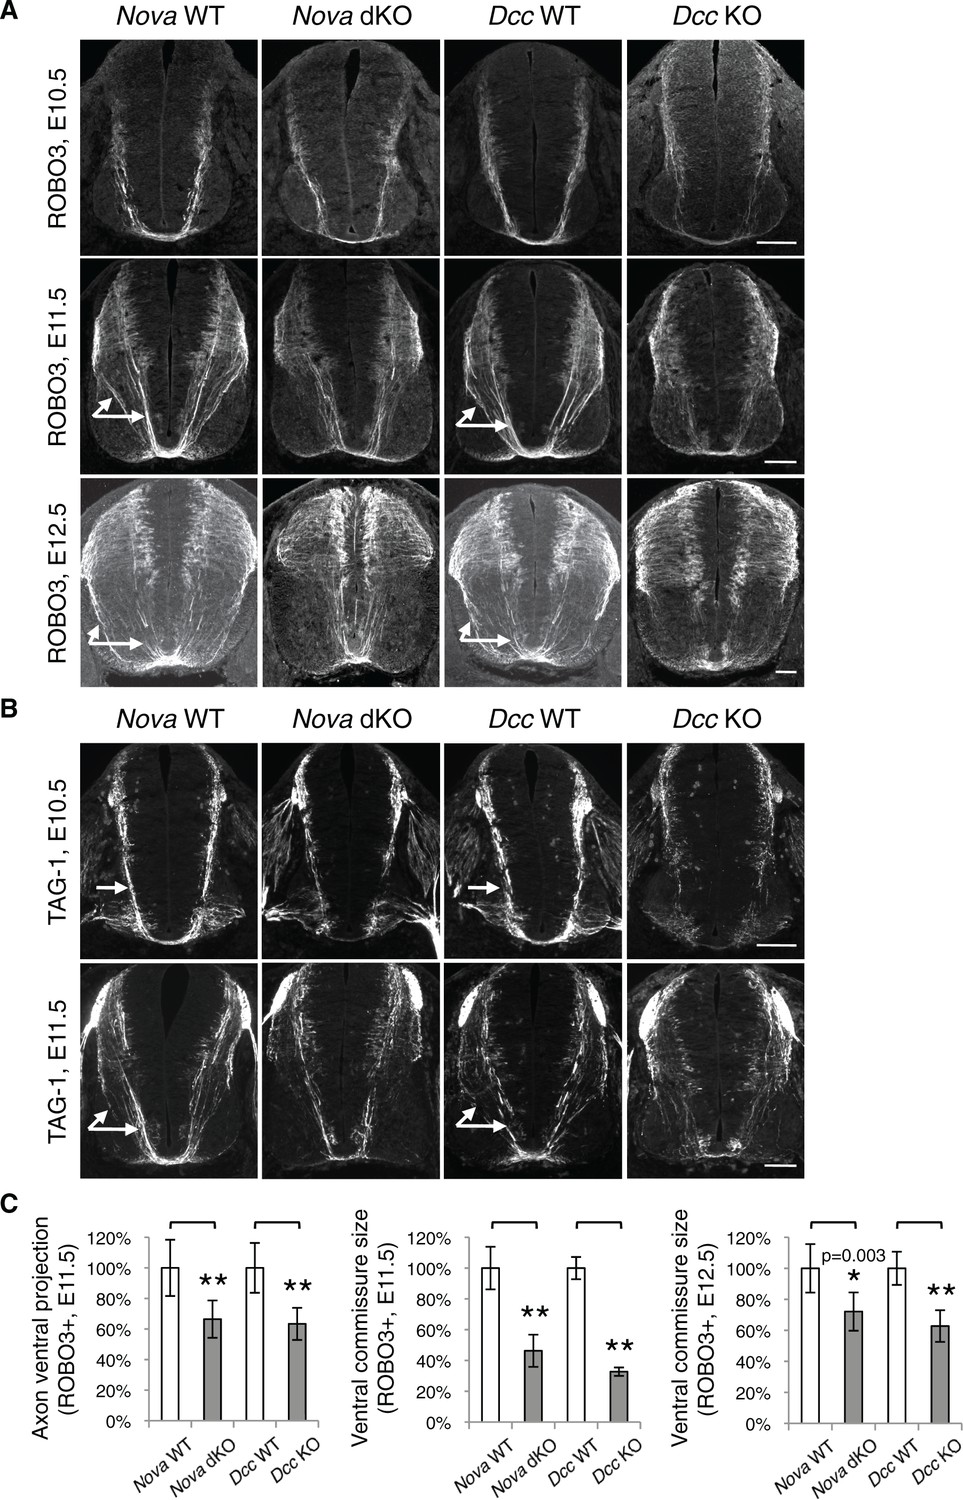
Nova dKO disrupts commissural axon ventral projection.
(A) and (B) Immunohistochemistry of commissural axonal markers, ROBO3 and TAG-1 respectively, in transverse sections of the spinal cord. Two main axon bundles can be observed at E11.5 (arrows) and the more lateral one is severely reduced in Nova dKOs. In the top panel of B, arrows indicate commissural axon projection, and the staining in the ventral lateral spinal cord is from motor axons. (C) Quantification of axon guidance phenotypes in A. To quantify axon ventral projection, the signal from the ventral half of the spinal cord was first normalized to the signal from the whole spinal cord, and then normalized to WT controls. The commissure size is represented as the ratio between the thickness of the axon bundle at the midline and that of the floorplate. Data are normalized to WT. Three embryos from each genotype and at least five sections from each embryo were quantified. Data are represented as the mean ± SEM (Student’s t-test, *p<0.05, **p<0.001). Scale bars, 50 μm.
Figure 6—figure supplement 1
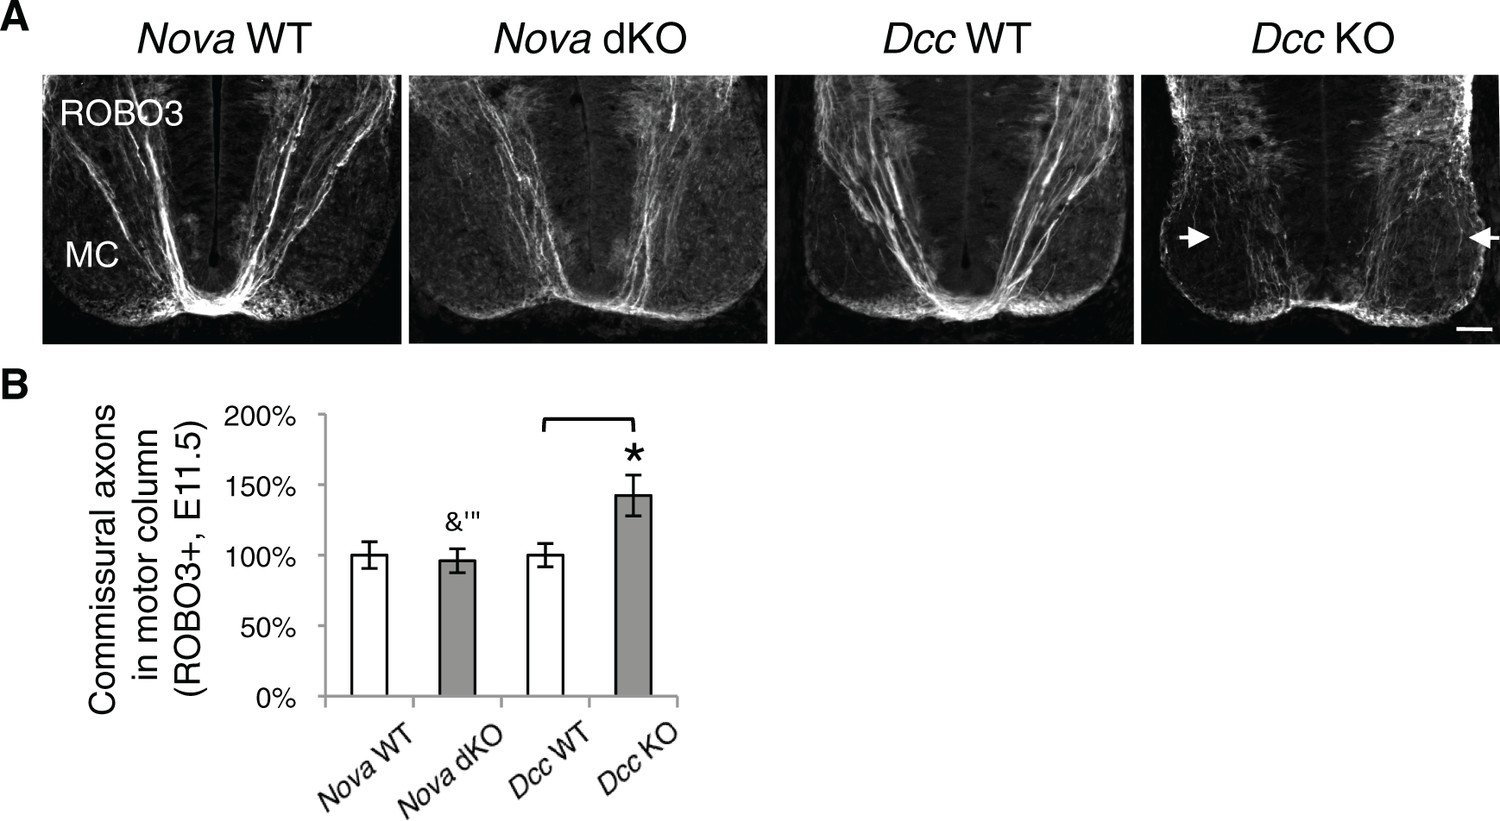
Nova dKO does not cause commissural axons to invade the motor column.
(A) Immunohistochemistry of ROBO3 in Nova WT, Nova dKO, Dcc WT, and Dcc KO spinal cords. Only the ventral half is shown (MC, motor column). Some commissural axons in Dcc KO, but not in Nova dKO, are defasciculated and invade the motor column (arrows). (B) Quantification of phenotypes in A. The amount of commissural axons in the motor column is represented as the ratio between the ventral area covered by commissural axons and that of the total ventral area. Data are normalized to WT and are represented as the mean ± SEM (Student’s t-test, *p<0.05, ns, not significant). Scale bar, 50 μm.
Figure 7 with 3 supplements
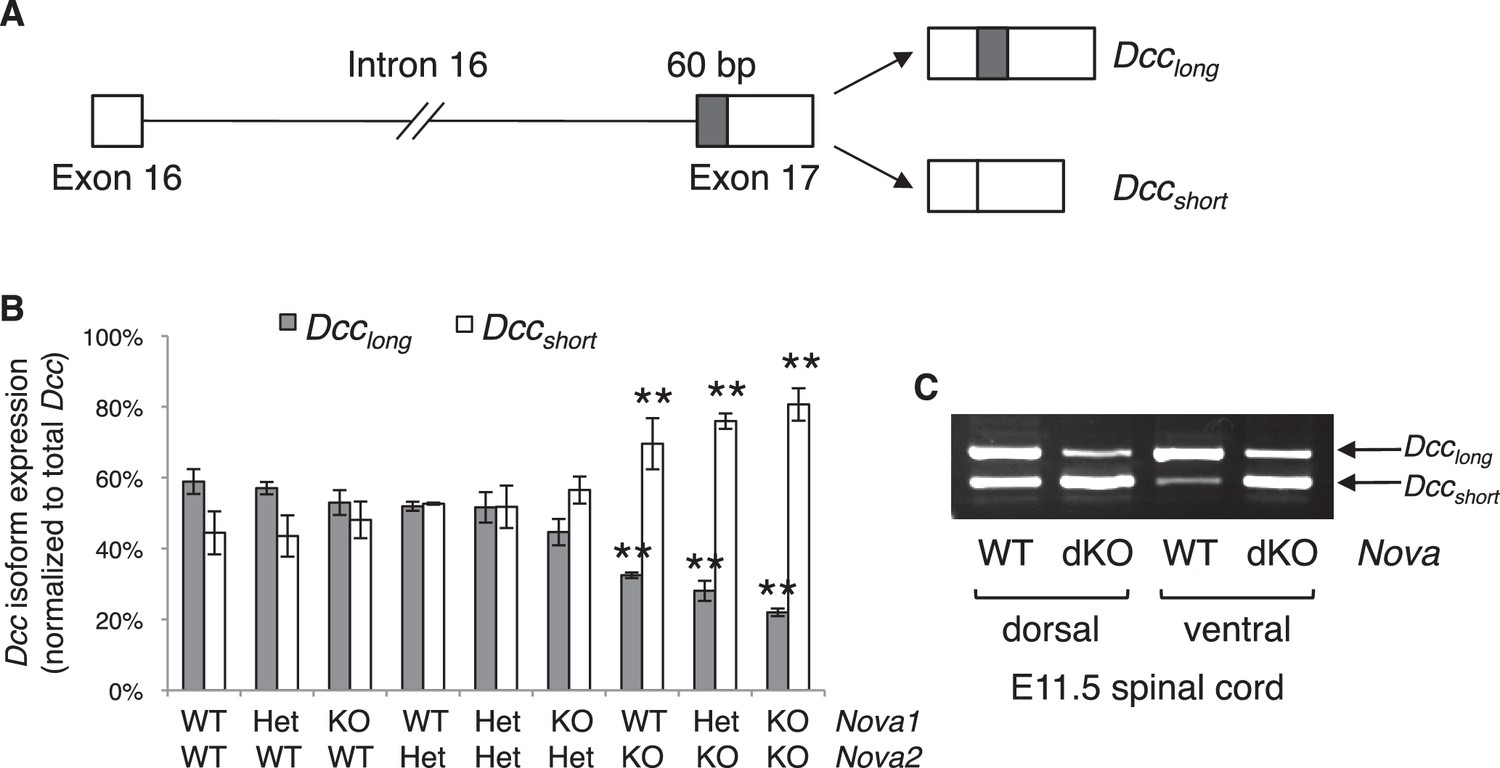
Nova dKO disrupts the alternative splicing of Dcc.
(A) Schematic of Dcc alternative splicing and the resulting isoforms. The alternative 60 bp in exon 17 is shaded grey. (B) Dcc isoform expression in nine Nova1/2 genotypes, as measured by quantitative RT-PCR using E11.5 dorsal spinal cord. The isoform expression level is normalized to a common region in Dcc cDNA (total Dcc; see materials and methods). Note that although the changes in Nova2 single KOs are statistically significant, the in vivo phenotype of Nova2 KOs is not significantly different from controls (see Figure 5—figure supplement 1). (C) Dcc isoform expression from Nova embryos detected by semi-quantitative PCR that amplify both isoforms. Dorsal and ventral spinal cords are separated to distinguish commissural neurons (dorsally located) and motor neurons (ventrally located). Nova dKO affects Dcc alternative splicing in both populations. Three animals from each genotype were quantified. Data are represented as the mean ± SEM (one way ANOVA and Bonferroni post test, **p<0.001).
Figure 7—figure supplement 1
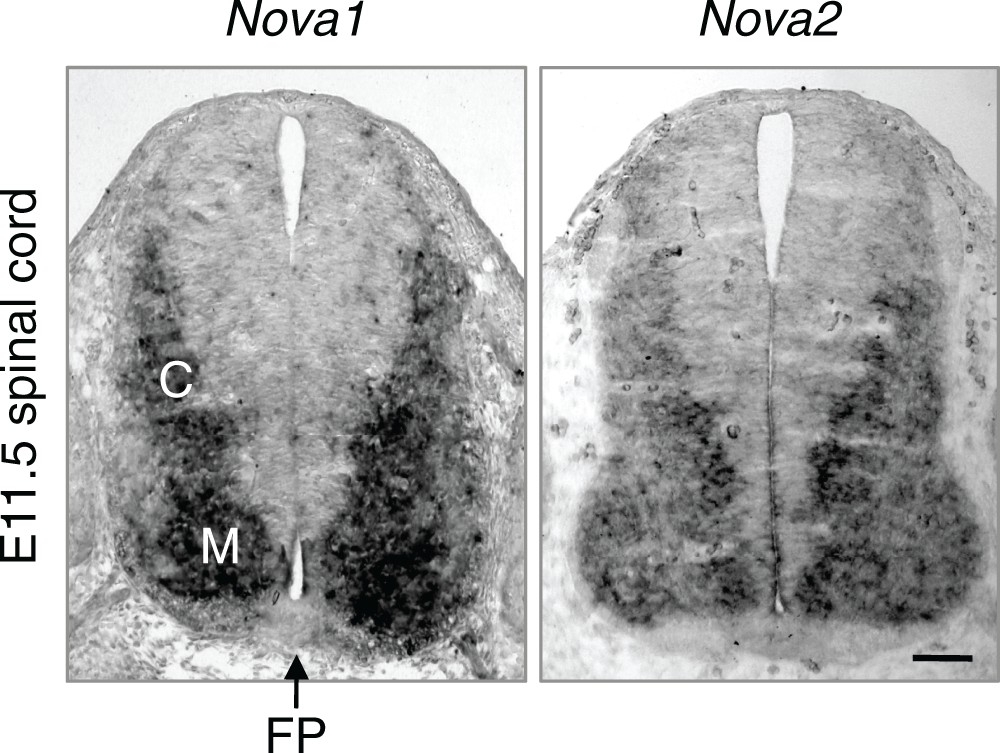
Nova1 and Nova2 expression in E11.5 spinal cord detected by in situ hybridization.
Both genes are expressed in interneurons at the lateral spinal cord and are highly expressed in the commissural neurons (C). M, motor neurons. FP, the floorplate. Scale bar, 50 μm.
Figure 7—figure supplement 2
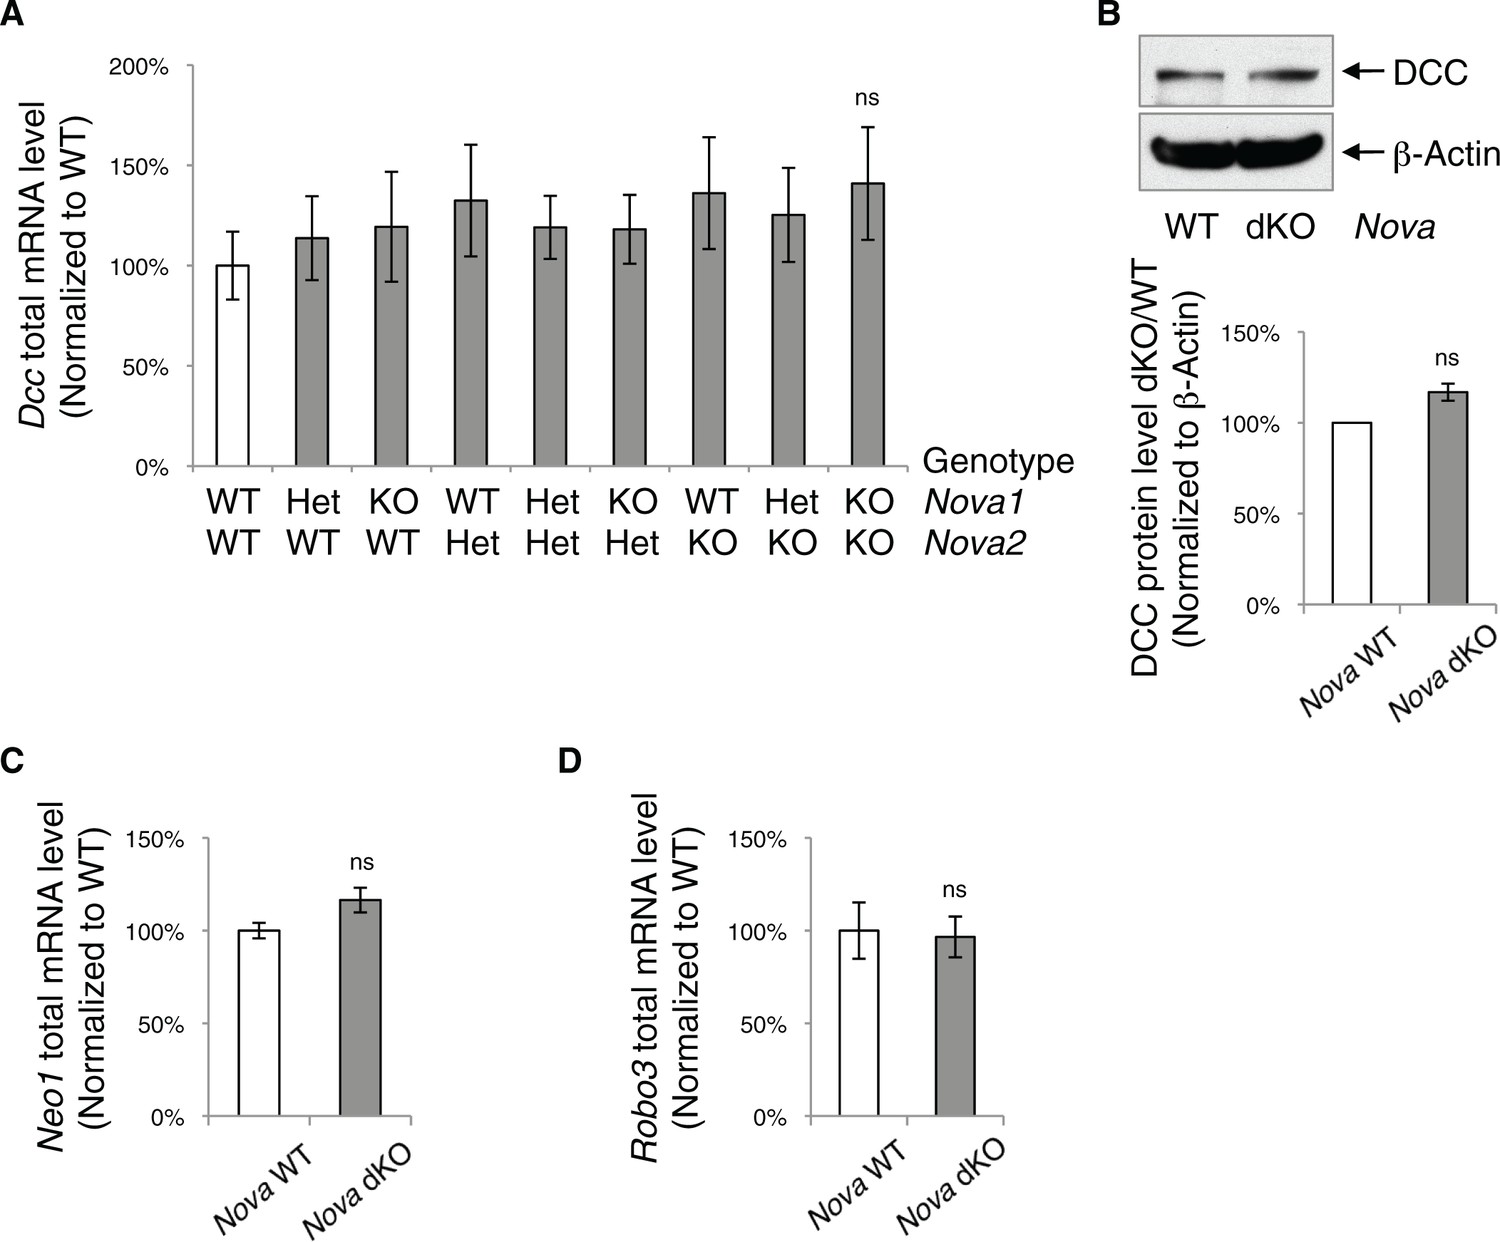
Nova dKO does not affect the total level of Dcc, Neo1, and Robo3 expression.
(A) Total Dcc mRNA level in the spinal cords from nine genotypes of Nova1/2, measured by quantitative RT-PCR. There is a slight but not significant increase. (B) DCC protein level detected by SDS-PAGE and western blotting in Nova WT and dKO spinal cords. The anti-DCC (AF5) recognizes both isoforms. There is also a slight but not significant increase. (C) Total Neo1 mRNA level in Nova WT and dKO. (D) Total Robo3 mRNA level in Nova WT and dKO. Data are represented as the mean ± SEM (one way ANOVA and Bonferroni post test in A. Student’s t-test in B, C and D. ns, not significant). For all three genes, multiple regions of the cDNAs were examined and one is shown as an example.
Figure 7—figure supplement 3
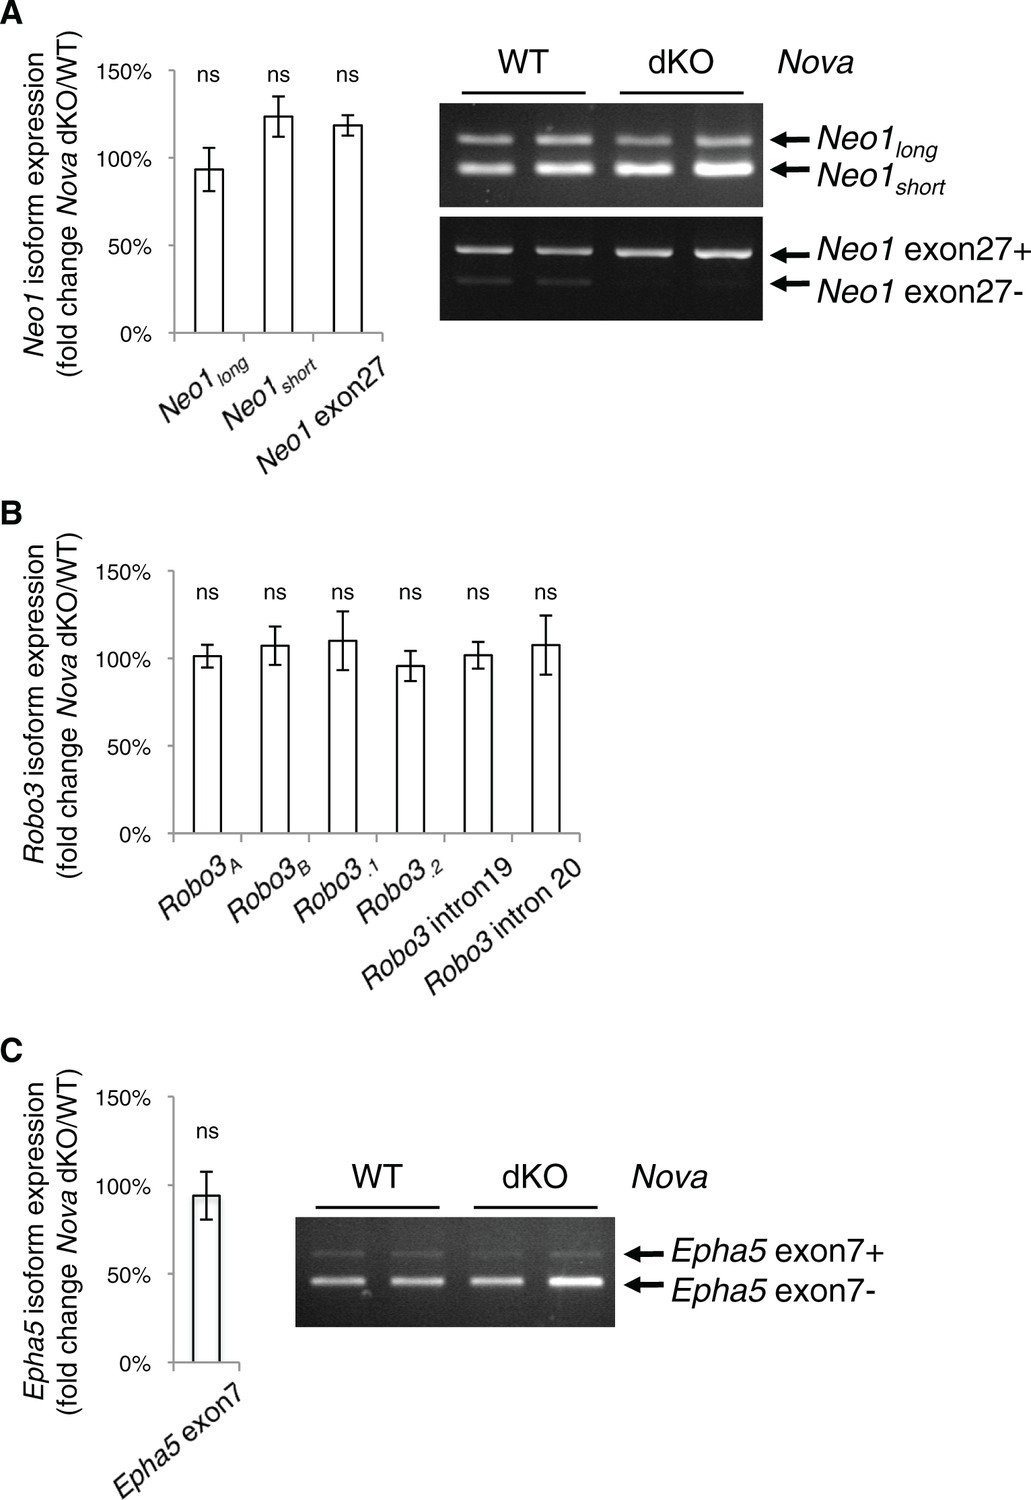
Nova dKO does not affect the alternative splicing of Neo1, Robo3, or Epha5.
(A) Neo1 alternative splicing in Nova mutants. Two alternative regions are shown, one at the homologous region to Dcc exon 17 and the other at Neo1 exon 27. Quantitative RT-PCR results are shown in the chart on the left and semi-quantitative RT-PCRs of the same regions (two animals for each genotype) are shown in the electrophoresis image on the right. (B) Robo3 alternative splicing in Nova mutants. Six alternative regions are shown as examples and additional regions were examined. No change is seen in any region. (C) Epha5 alternative splicing at exon 7 in Nova mutants. Three animals from each genotype were quantified. Data are normalized to WT and are represented as the mean ± SEM (Student’s t-test, ns, not significant).
Figure 8 with 1 supplement
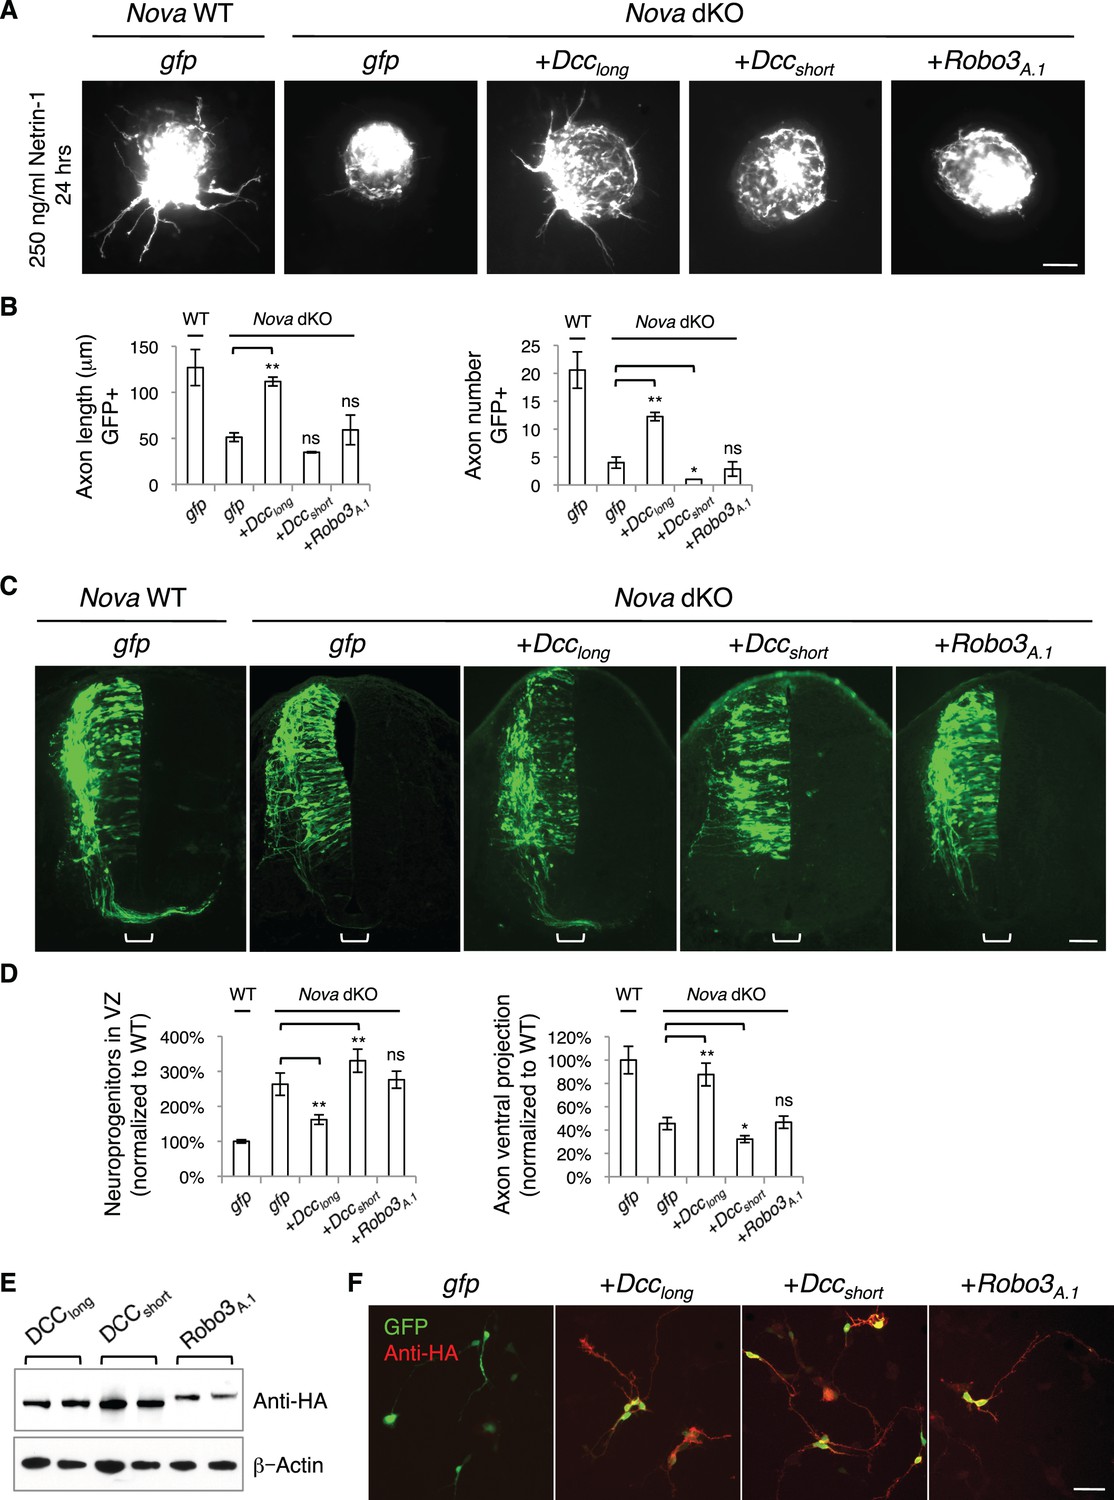
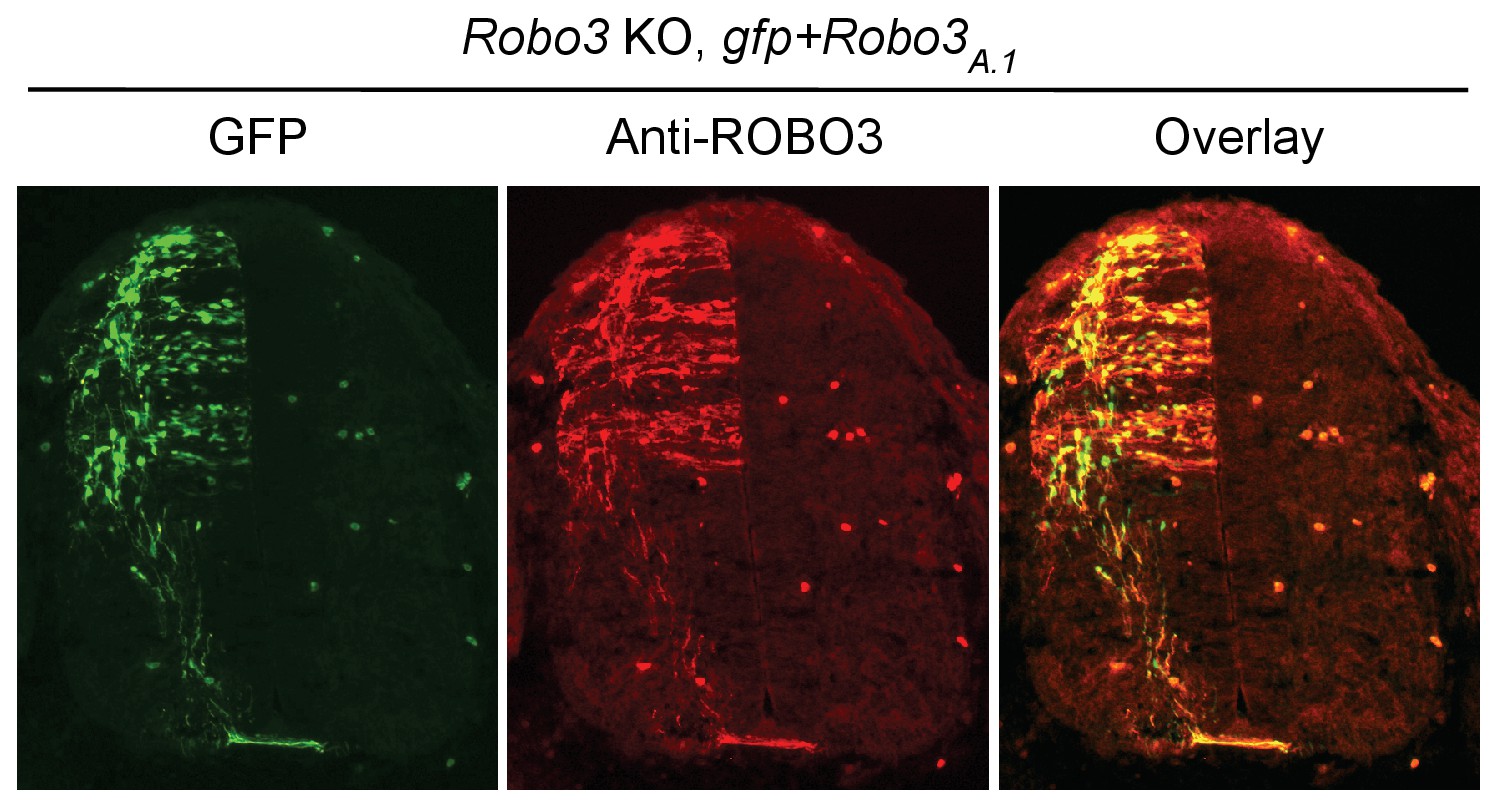
Expression of DCClong, but not DCCshort or Robo3A.1, is able to rescue Nova dKO defects.
(A) Dorsal spinal cord assays using Nova WT and dKO neurons electroporated with gfp, Dcclong, Dccshort, or Robo3A.1. The embryos were electroporated at E10.5 and cultured for one day to allow protein expression. DSC assays were then carried out and axons were directly visualized by GFP fluorescence. Explants were cultured for 24 hrs with 250 ng/ml Netrin-1. Only DCClong expression can rescue the outgrowth defect in Nova dKOs. (B) Quantification of DSC axon length and number in A. Three embryos from each treatment/genotype and at least five explants from each embryo were quantified. (C) Transverse sections of spinal cords from Nova WT and dKO electroporated with gfp, Dcclong, Dccshort, or Robo3A.1. Only Dcclong is able to rescue the neuronal migration and axon projection defects. Bracket, ventral midline. (D) Quantification of phenotypes in C (see description in Figure 1C). Also see Figure 1—source data 1 for additional quantification. (E) Expression of DCClong, DCCshort, and ROBO3A.1 proteins in electroporated embryos (two embryos are shown). All three proteins were immunoprecipitated by a C-terminal HA tag and detected by western blotting. (F) Expression of DCClong, DCCshort, and ROBO3A.1 proteins in dissociated dorsal spinal cord neurons, as detected by anti-HA. Data are represented as the mean ± SEM (one way ANOVA and Bonferroni post test, *p<0.05, **p<0.001, ns, not significant). Scale bars, 50 μm.
Figure 8—figure supplement 1
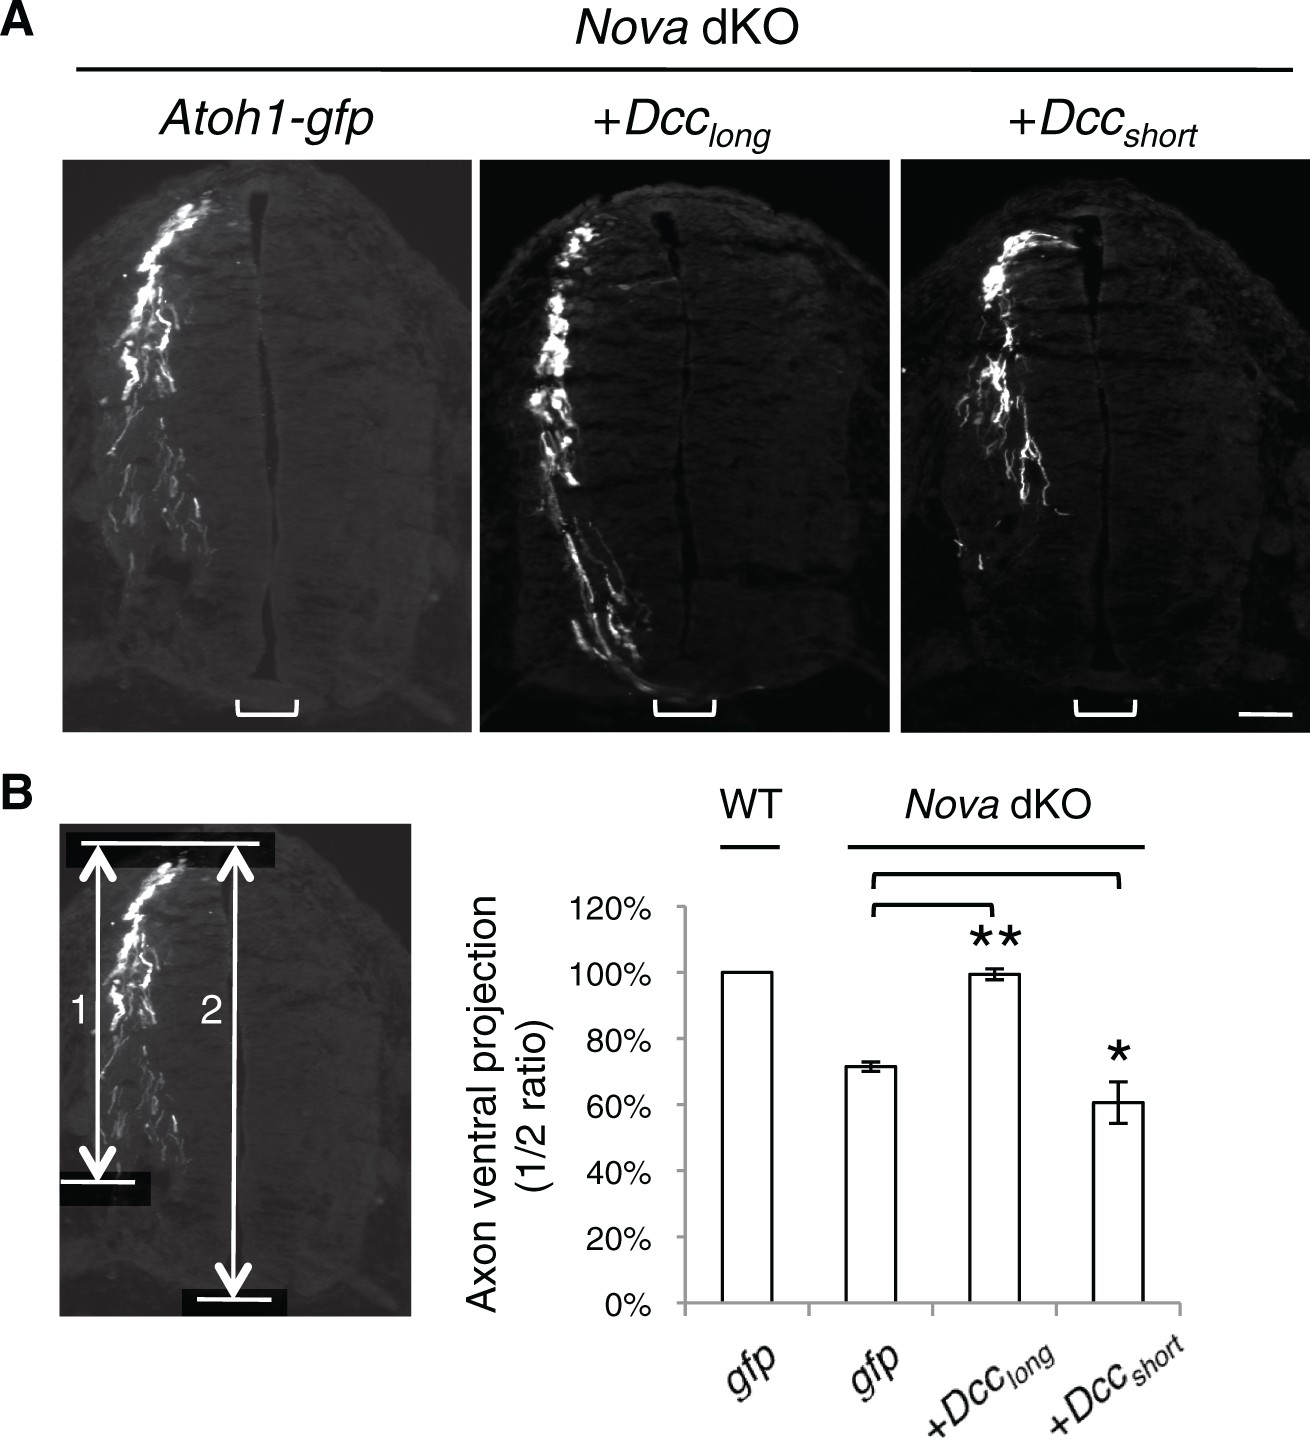
Rescue of Nova dKOs by Dcc isoforms in embryos labeled with Atoh1-gfp.
(A) Nova dKO was electroporated with gfp, Dcclong, or Dccshort. Only Dcclong expression is able to rescue the axon projection defect. (B) Quantification of ventral axon projection in A. The distance from the dorsal margin of the spinal cord to the ventral most axons is compared to the total height of the spinal cord (1/2 ratio). Data are normalized to WT and are represented as the mean ± SEM (one way ANOVA and Bonferroni post test, *p<0.05, **p<0.001). Also see Figure 1—source data 1 for additional quantification. Scale bar, 50 μm.
Figure 9
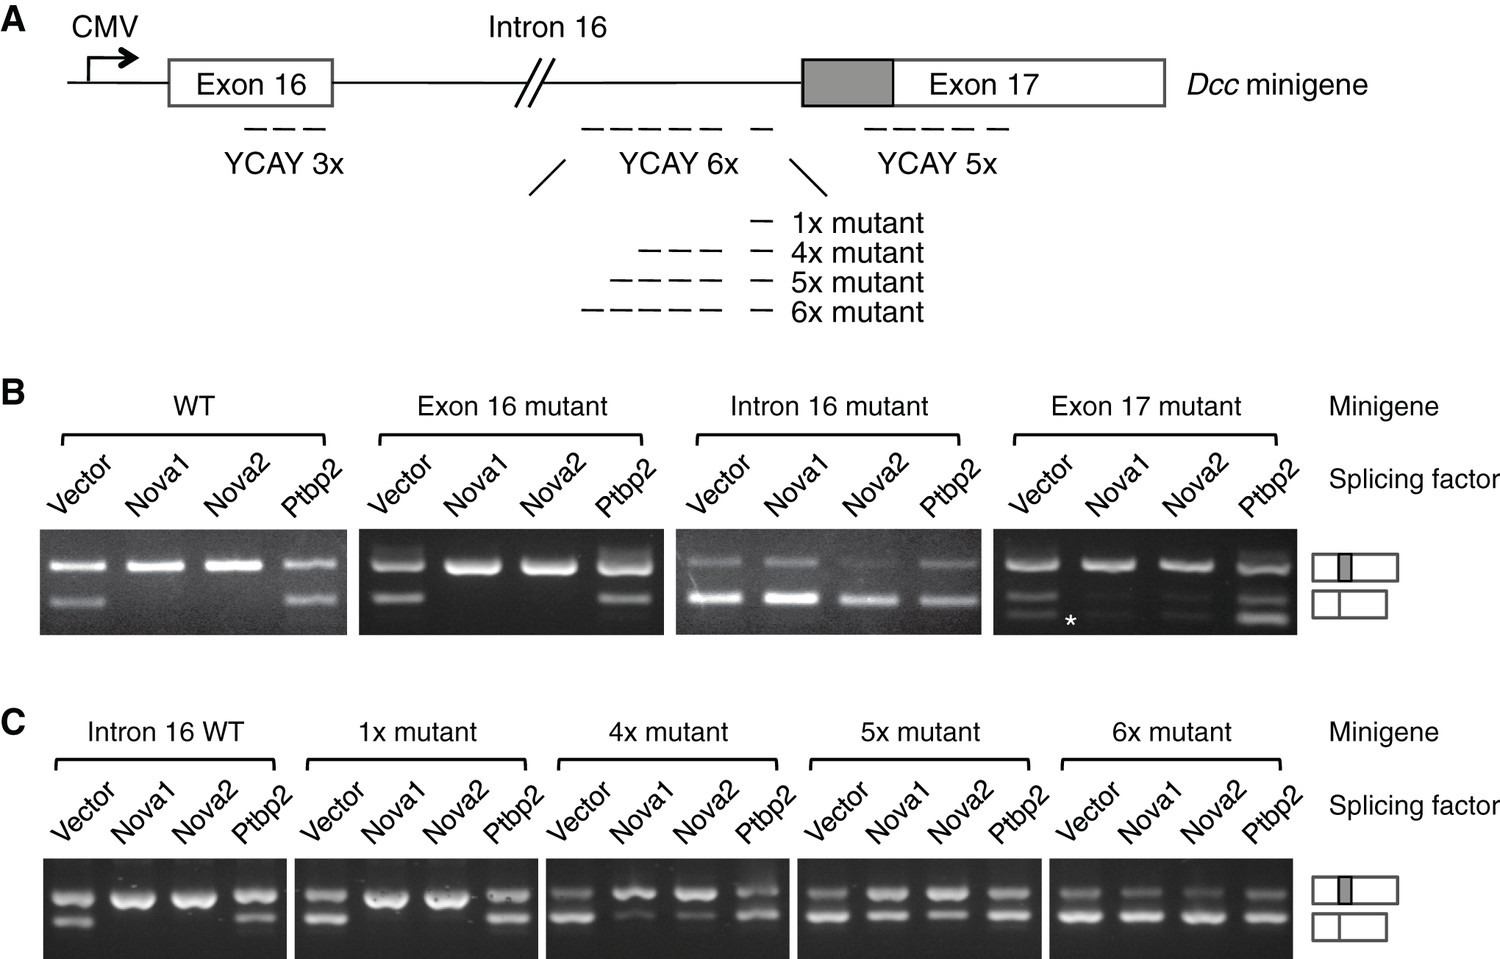
NOVA1/2 regulate Dcc alternative splicing.
(A) Schematic of a Dcc minigene containing the genomic DNA between exons 16 and 17. The alternative sequence is shaded gray. Three candidate Nova binding sites, which are YCAY (Y=C/U) clusters, are located within exon 16, intron 16, and exon 17, respectively (dashed lines indicate the number of YCAY repeats). (B) Alternative splicing of wildtype and mutant minigenes. The two RT-PCR products correspond to Dcclongand Dccshort, respectively. Two additional RT-PCR products are produced by exon 17 mutations (asterisk), from utilizing two downstream cryptic splice sites. Mutations in intron 16 block NOVA1/2 from increasing Dcclong. (C) Alternative splicing of Dcc minigenes containing different numbers of mutations in intron 16. With an increasing number of mutations, NOVA1/2 gradually lose their ability to promote Dcclong.
Author response image 1
Author response image 2
Tables
Table 1
RNA-binding proteins targeted in the RNAi screen
| Gene | Protein family | Phenotype | Note |
|---|---|---|---|
Nova1/2 | Neuro-oncological ventral antigen | Neuronal migration, axon outgrowth, and axon guidance defects |
|
Ptbp2 | Polypyrimidinetract-binding protein | - |
|
Sfpq | Splicing factor proline/glutamine rich (polypyrimidine tract-binding protein associated) | - |
|
Fmr1 | Fragile X mental retardation protein | - |
|
Nufip1/2 | Nuclear FMRP interacting protein | - |
|
Elavl1/2/3/4 | ELAV (embryonically lethal abnormal vision) homolog; Hu syndrome protein | Partial midline crossing defect caused by Elavl2 single RNAi |
|
Rbfox1/2/3 | RNA-binding protein, Fox (feminizing locus on X) homolog | - |
|
Msi1 | Musashi RNA-binding protein | - | Msi1-/- displays neuronal migration and axon guidance defects in precerebellar neurons but not in spinal commissural neurons (Kuwako et al., 2010) |
Upf1 | UPF1 regulator of nonsense transcripts homolog | Neuronal migration, axon outgrowth, and axon guidance defects |
|
Celf1/2/3/4/5/6 | CUG binding protein, Elav-like family member | - |
|
Khsrp | KH-type splicing regulatory protein | - |
|
Pabpc1 | Poly(A) binding protein, cytoplasmic | - |
|
Igf2bp1 | Insulin-like growth factor 2 mRNA binding protein | Partial midline crossing defect | Regulates beta-actin mRNA transport and translation (Leung et al., 2006; Yao et al., 2006) |
Srpk1/2 | Serine/arginine-rich protein specific kinase | - |
|
| -, no phenotype in spinal cord commissural neurons, when family members were targeted individually. | |||
Download links
A two-part list of links to download the article, or parts of the article, in various formats.
Downloads (link to download the article as PDF)
Open citations (links to open the citations from this article in various online reference manager services)
Cite this article (links to download the citations from this article in formats compatible with various reference manager tools)
NOVA regulates Dcc alternative splicing during neuronal migration and axon guidance in the spinal cord
eLife 5:e14264.
https://doi.org/10.7554/eLife.14264


