Cell type specificity of neurovascular coupling in cerebral cortex
- University of California, San Diego, United States
- John Carroll University, United States
- Harvard Medical School, United States
- Norwegian University of Life Sciences, Norway
- University of Oslo, Norway
- Oslo University Hospital, Norway
- University of Bergen, Norway
Figures
Figure 1 with 1 supplement

Sensory stimulus-induced arteriolar response.
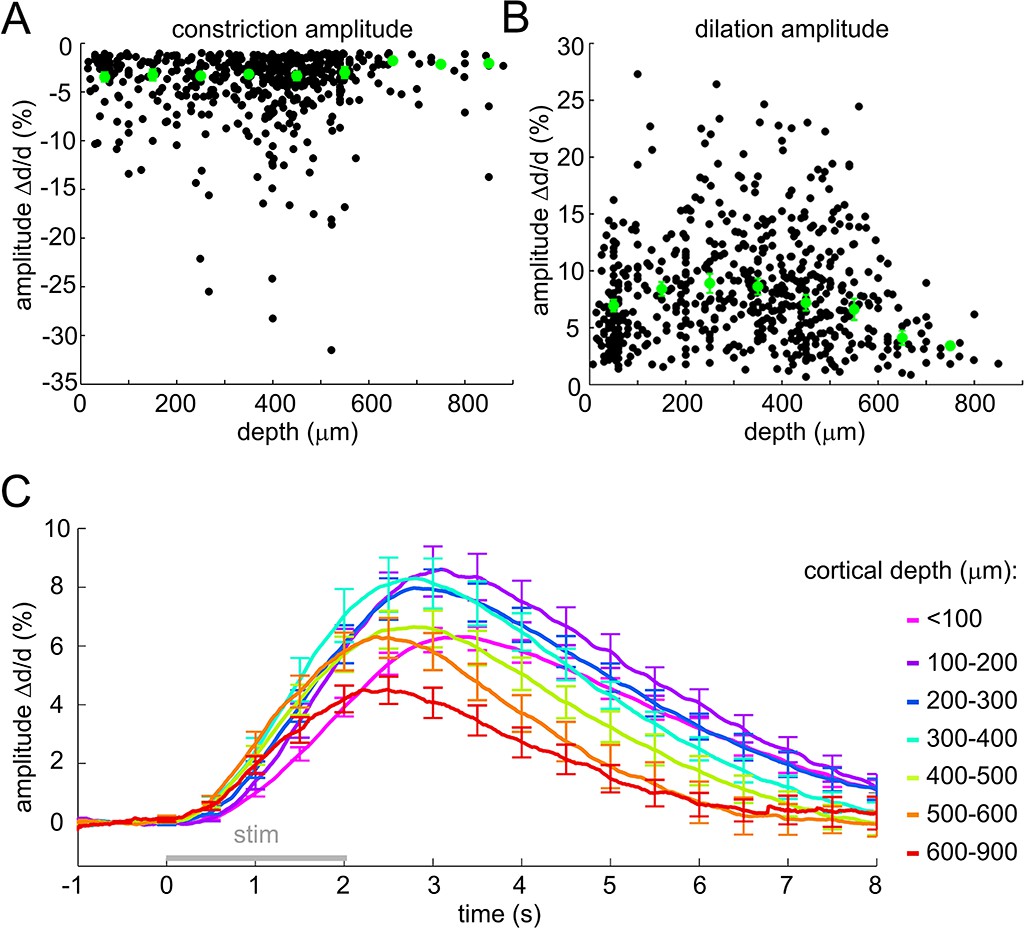
(A) An example vascular image stack throughout the cortical depth. Three 50-μm slabs at different depths are shown. Red arrows indicate the direction of flow in a surface arteriole diving at 3 points. (B) Sensory stimulus-induced dilation time-courses sorted into two categories by the presence or absence of the constriction phase, defined as the peak constriction amplitude exceeding 1%. The black curve (constriction): n = 419 measurements, 34 subjects. The red curve (no constriction): n = 397 measurements, 47 subjects. Error bars indicate standard error (SE) across subjects. (C) Onset (black) and time-to-peak (red) of dilation as a function of depth. Each data point represents a single measurement. For each subject, the data were group-averaged according to depth in 100-μm bins. Error bars represent the mean ± SE across subjects for each bin (green). (D) A zoomed-in view onto the initial eight seconds of the response. Time-courses were grouped by depth as in (C) and peak-normalized (see Materials and methods) to facilitate visual inspection of temporal differences. Color-coded depth categories are indicated on top.
Figure 1—figure supplement 1
Sensory stimulus-induced arteriolar response – additional quantification.
(A) Constriction amplitude (in% change) as a function of depth for cases with peak constriction > 1%. Each data point represents a single measurement. For each subject, the data were group-averaged according to depth in 100-μm bins. Error bars represent the mean ± SE across subjects (green). (B) Dilation amplitude (in% change) as a function of depth. Conventions are as in (A). (C) As in Figure 1D without peak normalization. Error bars represent SE across subjects.
Figure 2 with 2 supplements
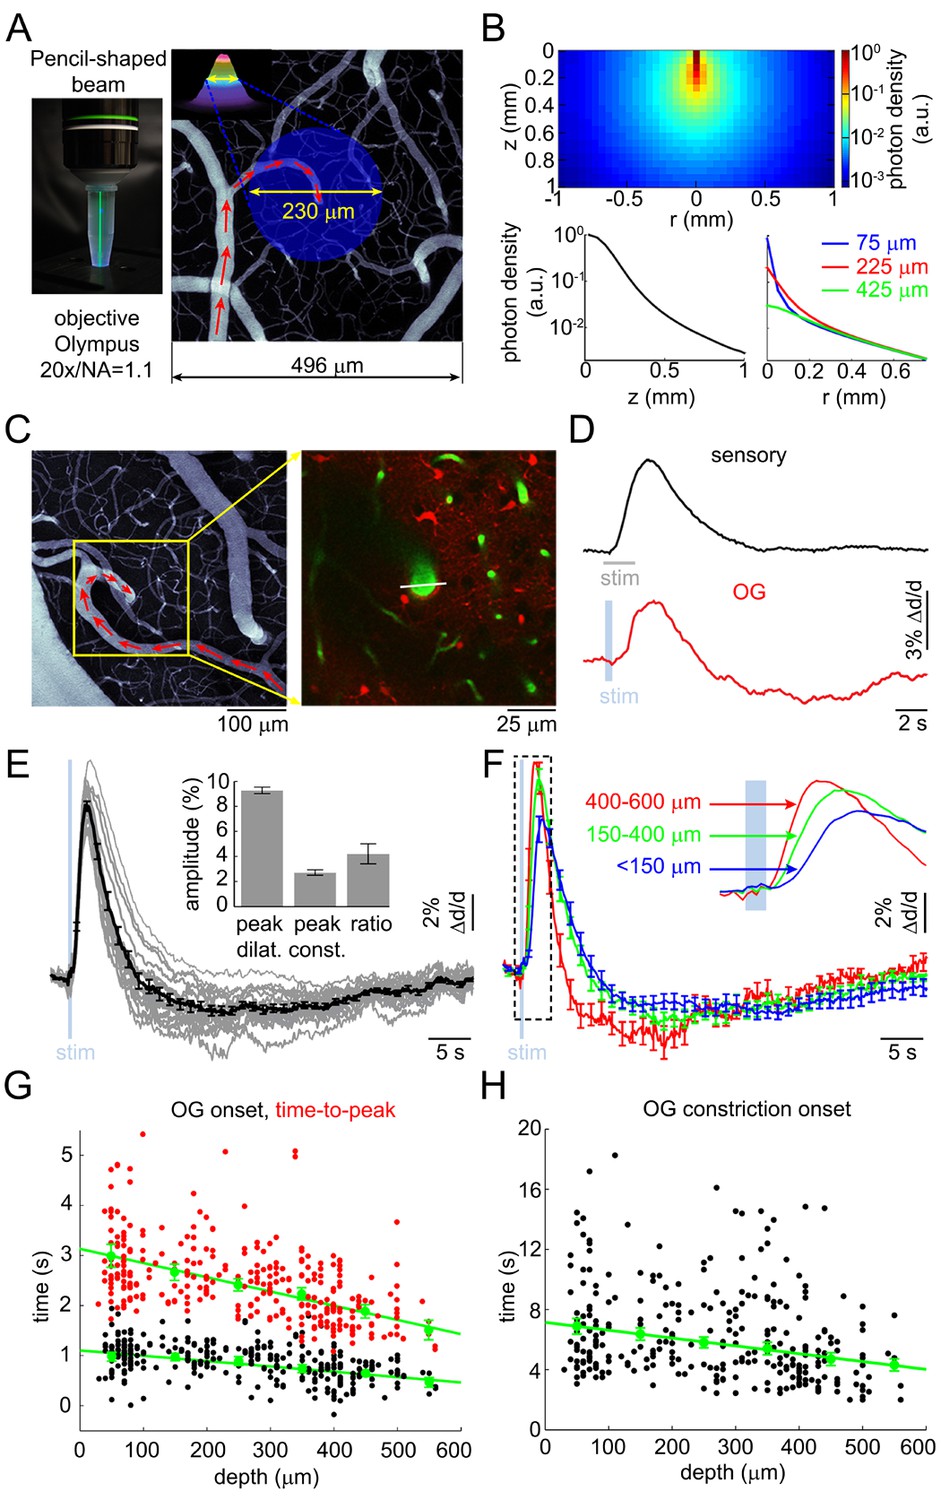
Arteriolar response to OG stimulation of INs.
(A) Left: The 473-nm laser beam visualized in fluorescent medium. Right: Schematic illustration of the OG beam centered on a diving arteriole. The full width at half maximum (FWHM = 230 μm) of the beam is superimposed on a mean intensity projection (MIP) of a 2-photon image stack of FITC-labeled vasculature through the top 116 μm. Individual images were acquired every 3 μm. Red arrows indicate the direction of flow in the arteriole. (B) Simulated spatial profile of the OG beam in cortical tissue. Top: Color-coded photon density. Bottom: Photon density as a function of depth (z-axis) and as a function of the radial distance (r) at three different depths (75, 225, and 425 μm). (C) Left: An example vascular MIP throughout the top 180 μm. Right: the measurement plane 180 μm deep including intravascular FITC (green) and SR101-labeled astrocytes (red). The white line indicates the scanning trajectory used for diameter measurements in (D). (D) Diameter change time-courses of the diving arteriole in (C) in response to the sensory and OG stimuli (sensory: black, average of 10 stimulus trials; OG: red, single trial). (E) Each thin gray line shows an average response within one subject. Across-subject average is overlaid in thick black. Error bars indicate SE across subjects. The mean peak dilation, peak constriction, and the ratio of peak dilation to peak constriction are shown in the inset. Error bars indicate SE across subjects. (F) Averaged dilation time-courses grouped by depth. An expanded view of the initial 4 s after the stimulus onset is shown. The depth in μm is indicated on the left. Error bars indicate SE across subjects. (G) Dilation onset (black) and time-to-peak (red) as a function of depth. Conventions are as in Figure 1C. (H) As in (G) for constriction onset (see text).
Figure 2—figure supplement 1
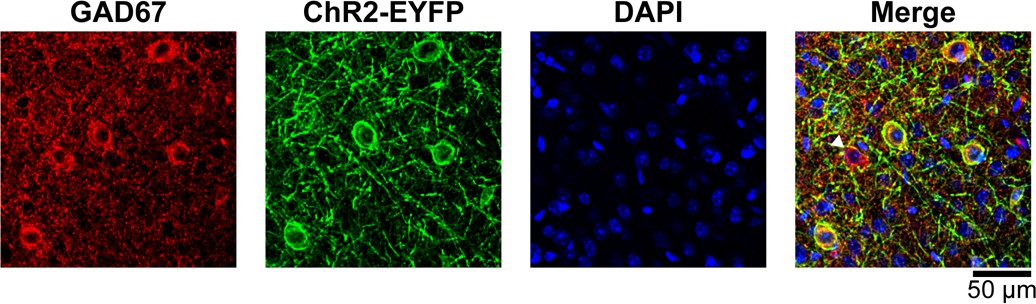
GAD67/ChR2-EYFP immunostaining of the cortex from a VGAT-ChR2(H134R)-EYFP mouse.
Coronal brain sections were incubated with GAD67 antibodies, which detect the GABA-producing enzyme glutamate decarboxylase (GAD) expressed in INs, and with EGFP antiserum to detect the membrane-targeted ChR2-EYFP fusion protein. Secondary antibodies coupled to Alexa 594 (red) and Alexa 488 (green) were used to detect the respective primary antibodies. DAPI was used to visualize cell nuclei (blue). Two-photon image stacks were acquired using 750-nm excitation. We counted 299 ChR2-EYFP+ (96%) and 12 ChR2-EYFP- (4%) neurons out of 311 GAD67+ neurons in 12 representative images. We did not detect GAD67-/ChR2-EYFP+ neurons. The arrowhead in the right panel is pointing towards a GAD67+/ChR2-EYFP- neuron.
Figure 2—figure supplement 2
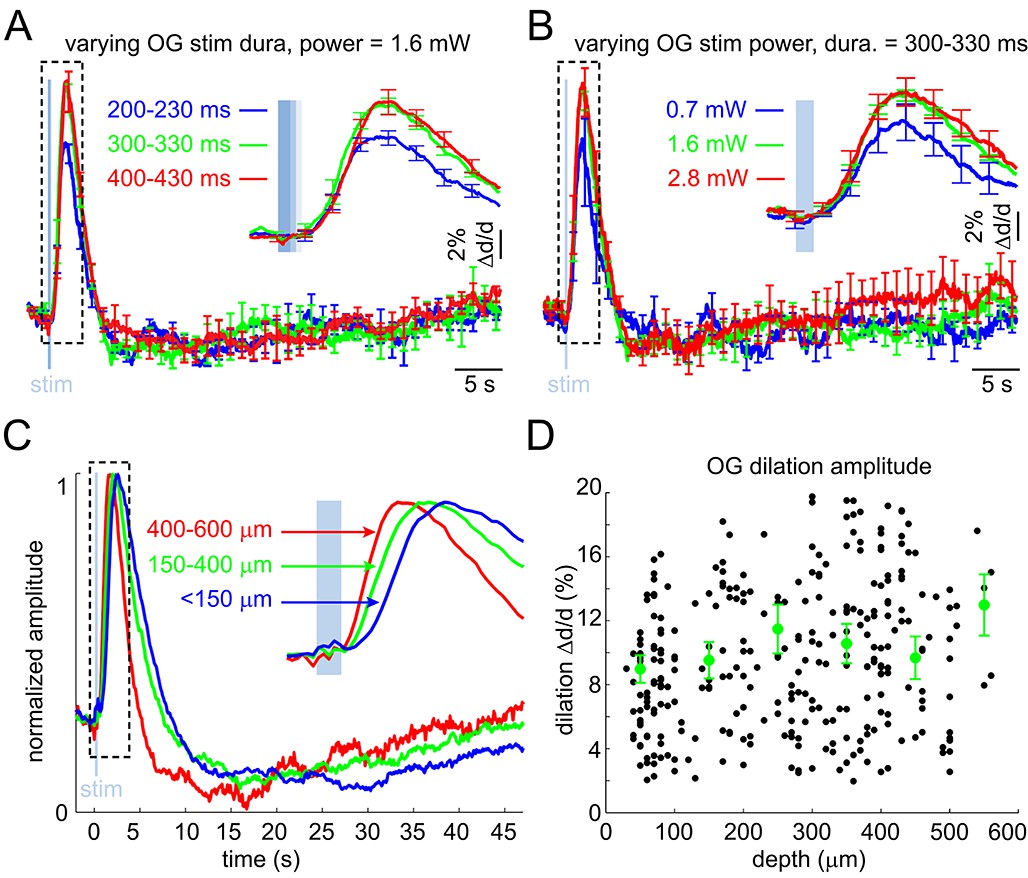
Arteriolar response to OG stimulation of INs – additional quantification.
(A) The OG response as a function of varying the duration of the light stimulus at constant power. Each curve corresponds to an average of 3 subjects. Error bars indicate SE across subjects. (B) As in (A) for the stimulus power at constant stimulus duration. (C) As in Figure 2F but peak-normalized. (D) OG dilation amplitude (in% change) as a function of depth. Each data point represents a single measurement. For each subject, the data were group-averaged according to depth in 100 μm bins. Error bars represent the mean ± SE across subjects for each bin (green).
Figure 3 with 2 supplements
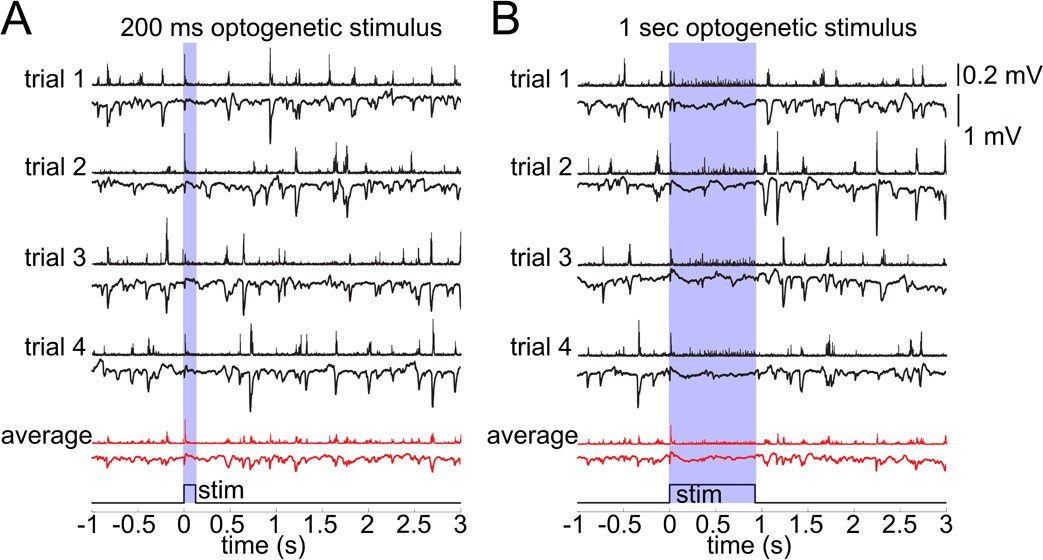
Lack of excitatory recruitment upon OG stimulation of INs.
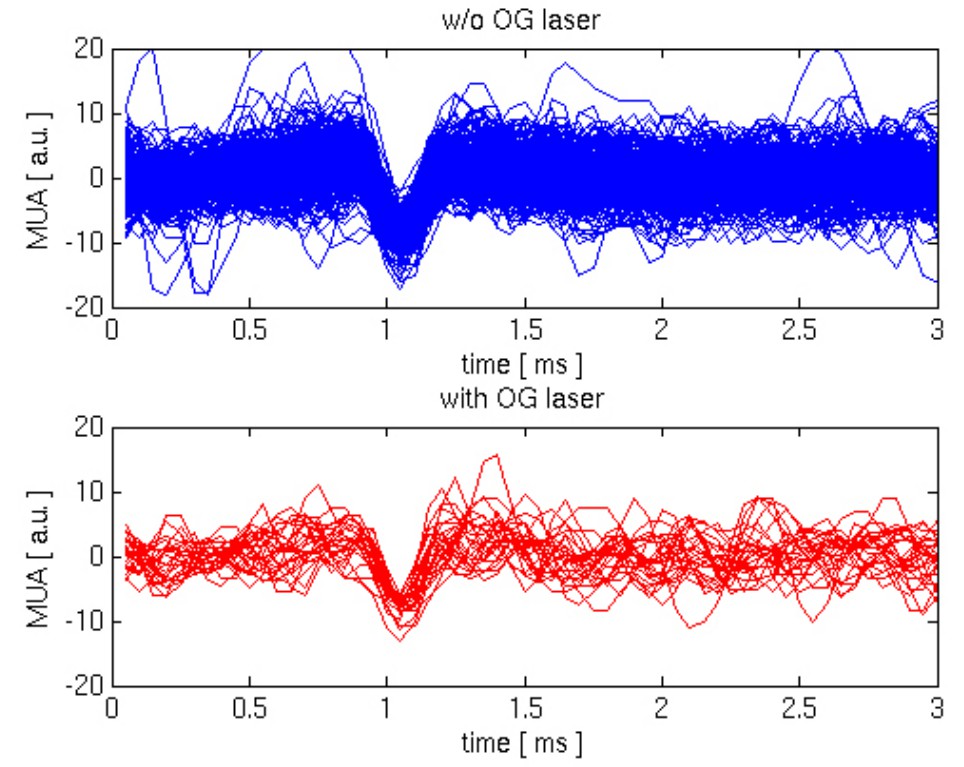
(A) Top: Corresponding MUA (top trace) and LFP (bottom tarce) recorded from layer II/III during a 200 ms OG stimulus. Each trace shows a single stimulus trial; red traces show the average of four individual trials. (B) As in (A) for a 1 s long OG stimulus.
Figure 3—figure supplement 1
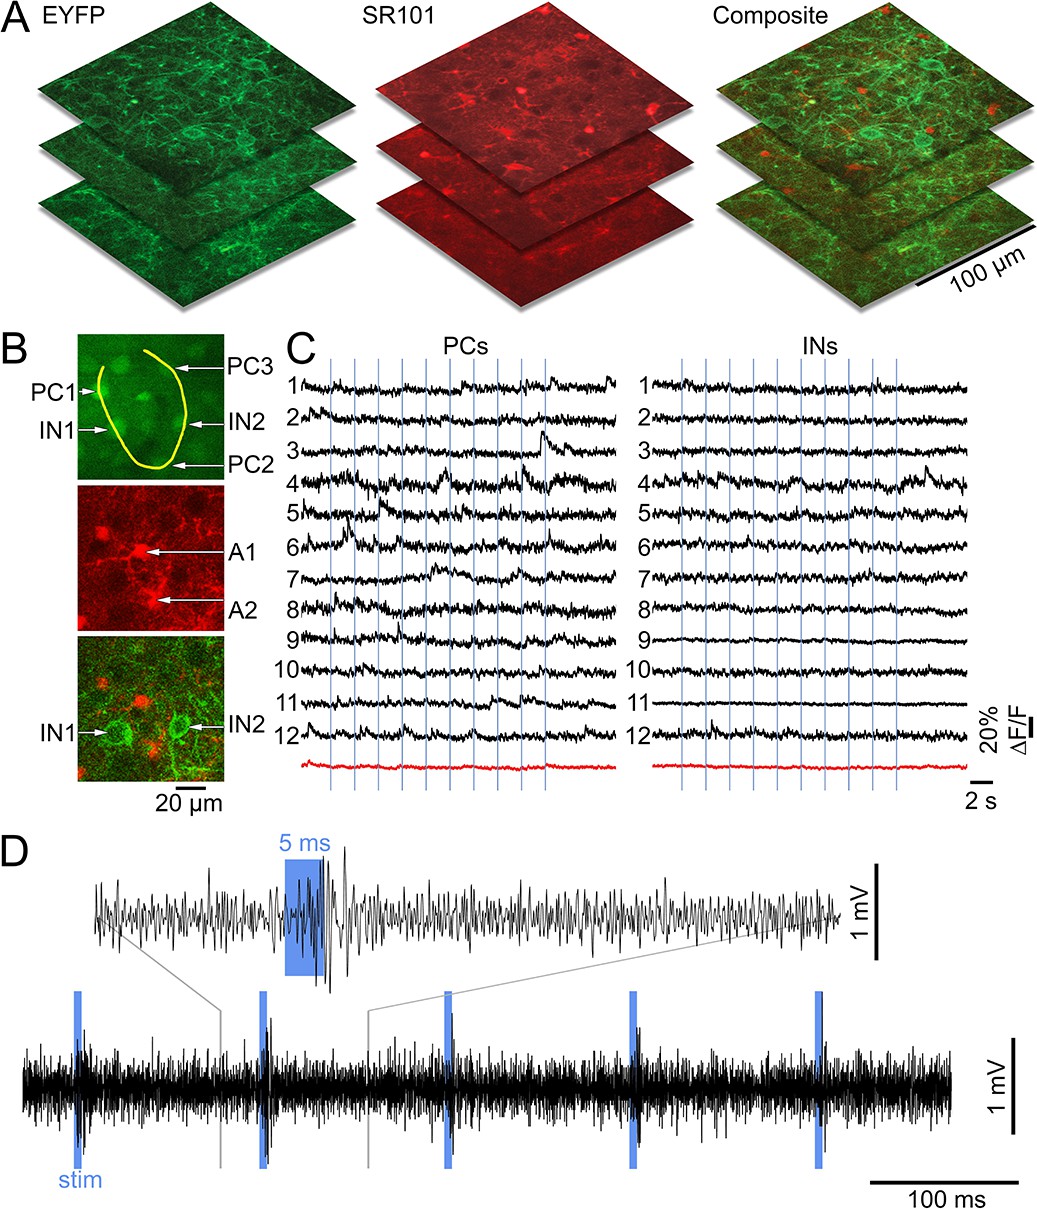
Lack of excitatory recruitment upon OG stimulation of INs – additional evidence from calcium imaging.
(A) Example reference image stacks showing EYFP, SR101, and composite EYFP/SR101 fluorescence for later coregistration with OGB1/SR101 images. (B) Top: an example OGB1 image with a line-scan trajectory (the yellow curve) used to acquire calcium imaging data. The trajectory passes through a number of PCs (PC1-PC3) and INs (IN1-IN2). Below: the corresponding SR101 and composite EYFP/SR101 images used to define astrocytes (A1-A3) and INs, respectively. (C) Example calcium signal time-courses from PCs (left) and INs (right) in response to 5 ms OG stimulus (indicated by vertical lines). Each horizontal line (Raichle and Mintun, 2006; Kleinfeld et al., 2011; Cauli and Hamel, 2010; Buxton et al., 2014; Lacroix et al., 2015; Lecrux et al., 2011; Markram et al., 2004; Cauli et al., 2004; Perrenoud et al., 2012; Anenberg et al., 2015; Devor et al., 2008, 2007) corresponds to a PC/IN pair that was acquired simultaneously. The average for each cell type (PCs and INs) is shown at the bottom in red. (D) MUA acquired under the same stimulus conditions. The electrode was moved into the field-of-view right after acquisition of the calcium imaging data.
Figure 3—figure supplement 2
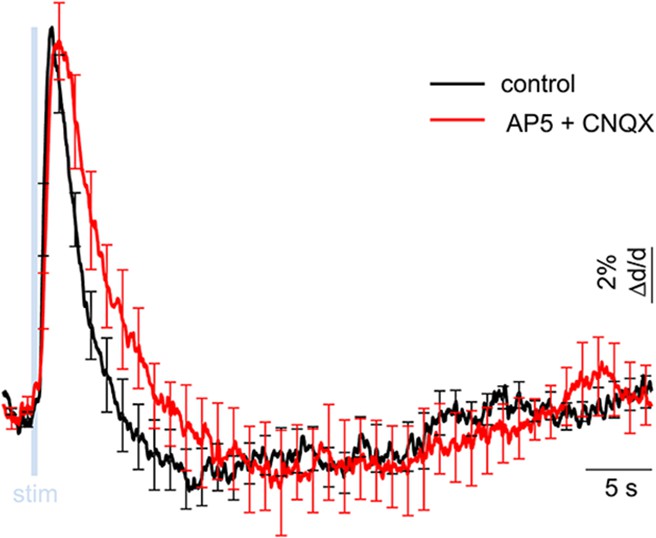
Lack of excitatory recruitment upon OG stimulation of INs – additional pharmacological evidence.
Averaged dilation time-courses in response to OG stimulus before and after blocking glutamatergic synaptic transmission. The response under control condition (black) and after application of AMPA and NMDA receptor blockers (500 μM AP5 + 200 μM CNQX, red) are overlaid. Error bars indicate SD across measurement locations within a single subject. Under glutamatergic blockade, we observed a trend towards delayed constriction (peaking at 19.9 ± 2.0 s and 21.8 ± 2.6 s before and after the blockade, respectively). This trend, however, was not statistically significant (p = 0.6).
Figure 4 with 2 supplements

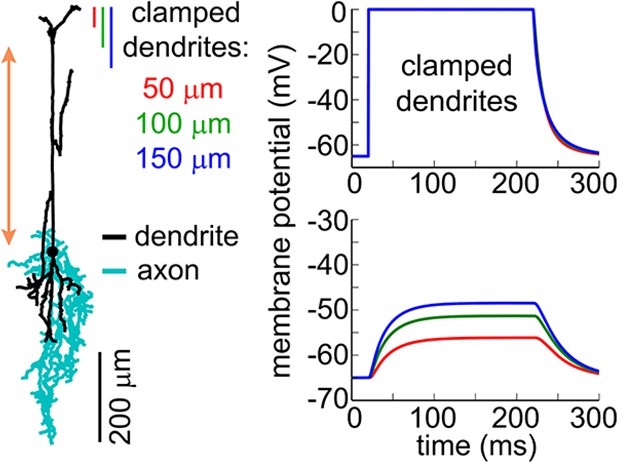
The effect of OG stimulation of INs delivered directly to layer V.
(A) Representative images of EYFP-expressing INs at different depths (green – INs labeled with EYFP, red – astrocytes labeled with SR101). (B) Arteriolar response to OG stimulation of INs through the objective before and after TTX (black and red curves, respectively). Error bars indicate SE across subjects. (C) As in (B) for OG stimulation through the optical fiber with the tip in layer V. The inset shows the light-emitting fiber tip visualized in fluorescent medium. (D) Left: Example morphology of VIP-positive inhibitory neuron (ID=NMO_06142, NeuroMorpho.org). The red double ended arrow indicates the dendritic section that was stretched to approximate layer V neuron (see Materials and methods). Right: dendritic (top) and somatic (bottom) membrane potential in response to voltage clamping the top 50-, 100- or 150 μm of the dendritic tree at 0 mV. (E) Comparison of the arteriolar response (across-subject average) to OG stimulation of INs through the objective (black) and fiber (red). Error bars represent SE across subjects. The inset shows the mean laser power for each category (left) and a zoomed-in view onto the initial 4 s after the stimulus onset of the response normalized by the laser power (right).
Figure 4—figure supplement 1
Simulation of the somatic membrane potential – another example.
Left: Example neuronal morphology (ID= NMO_06144, NeuroMorpho.org). The red double ended arrow indicates dendritic section that was stretched to approximate layer V neuron (see Materials and methods). Right: dendritic (top) and somatic (bottom) membrane potential in response to voltage clamping the top 50-, 100- or 150 μm of the dendritic tree at 0 mV.
Figure 4—figure supplement 2
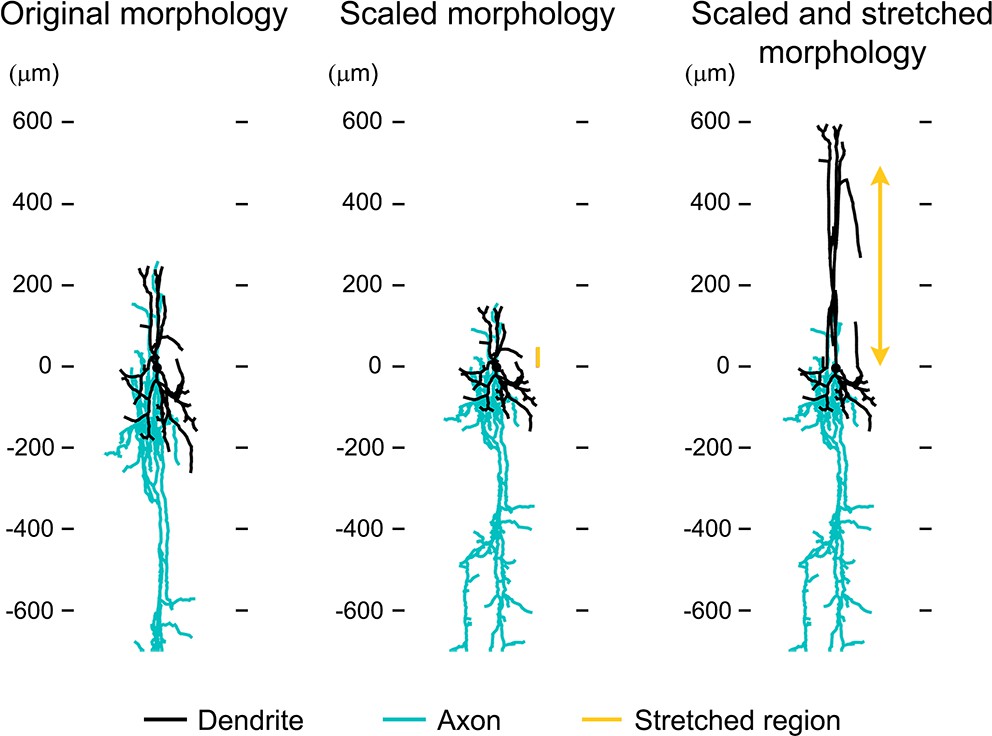
Approximation of neuronal morphologies.
(A) Original morphology of layer II/III VPI-positive neuron from rat SI obtained from NeuroMorpho.org (ID= NMO_06142). (B) Scaling the morphology to approximate a mouse layer II/III neuron. (C) Stretching the middle dendritic section to approximate a mouse layer V neuron.
Figure 5
Neurovascular mechanism of the constriction phase.
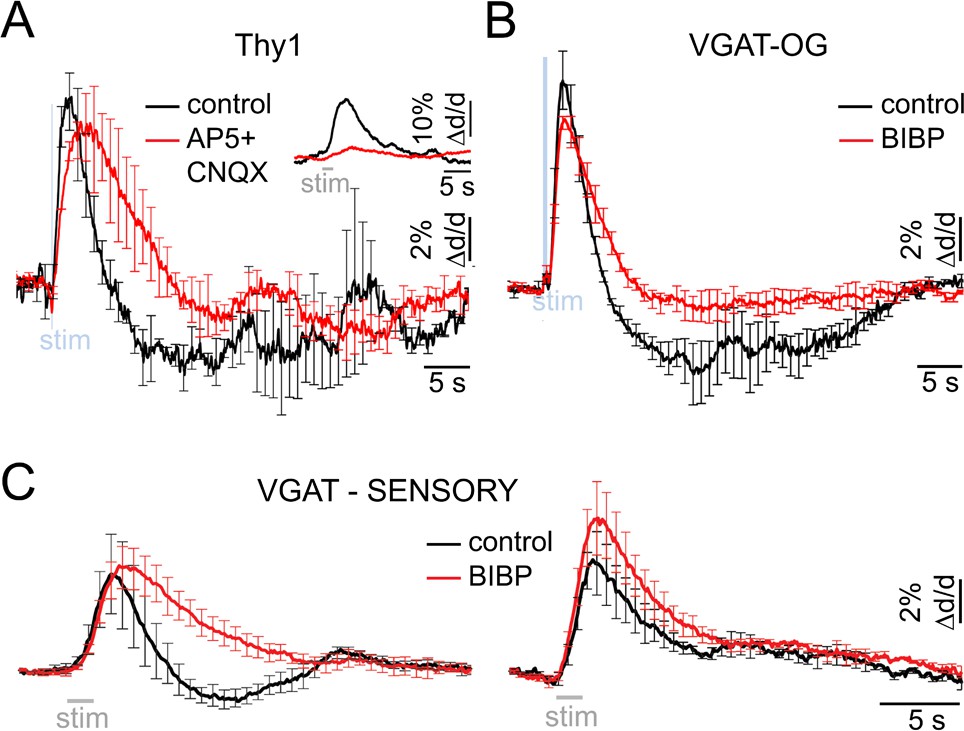
(A) Arteriolar response to OG stimulation of PCs in Thy1-ChR2-YFP subjects before (black) and after (red) application of AMPA/NMDA glutamatergic blockers (black and red, respectively). Error bars represent SE across subjects. The inset shows the sensory response before and after drug application (500 μM AP5 + 200 μM CNQX). (B) Comparison of dilation time-courses in response to OG stimulation of INs in VGAT-ChR2(H134R)-EYFP subjects before (black) and after (red) blocking Y1 receptors for NPY with topical application of 100 μM of BIBP 3226. Error bars represent SE across subjects. (C) As in (B) for the sensory response. The data were grouped according to the presence of the constriction phase as in Figure 1B.
Figure 6
Imaging arteriolar response to sensory and OG stimulation of INs in awake mice.
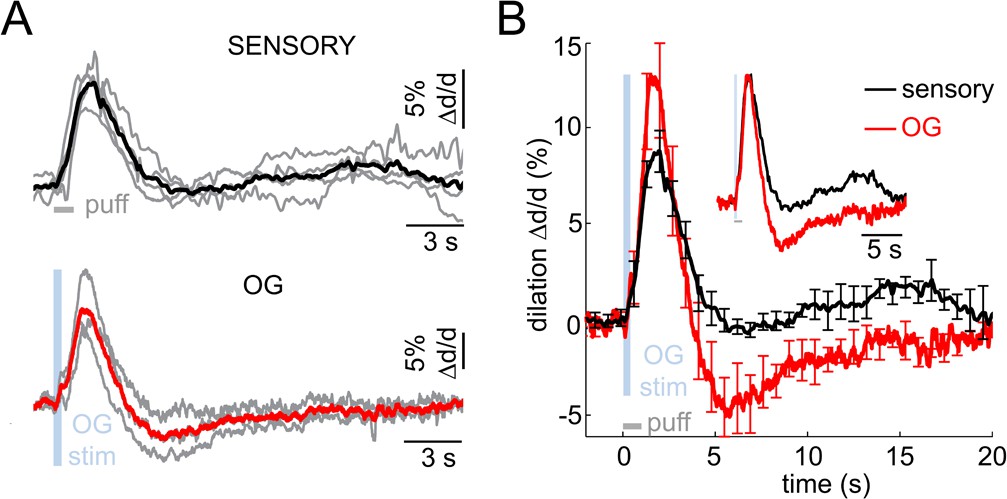
(A) Arteriolar dilation in awake mice in response to a sensory stimulus (three 100-ms air puffs to the contralateral whisker pad, top panel) and OG stimulation of INs (bottom panel). Thin gray lines represent individual subjects. Across-subject averages are overlaid (thick black and red lines for the sensory and OG stimuli, respectively). (B) Overlaid dilation time-courses in response to sensory stimulation (black) and OG stimulation of INs (red). Error bars represent SE across subjects. The inset shows the same time-courses normalized to the peak.
Author response image 1
Download links
A two-part list of links to download the article, or parts of the article, in various formats.
Downloads (link to download the article as PDF)
Open citations (links to open the citations from this article in various online reference manager services)
Cite this article (links to download the citations from this article in formats compatible with various reference manager tools)
Cell type specificity of neurovascular coupling in cerebral cortex
eLife 5:e14315.
https://doi.org/10.7554/eLife.14315


