Hypoxia-induced metabolic stress in retinal pigment epithelial cells is sufficient to induce photoreceptor degeneration
- The Scripps Research Institute, United States
- The Lowy Medical Research Institute, United States
- National Institutes of Health, United States
Figures
Figure 1 with 2 supplements
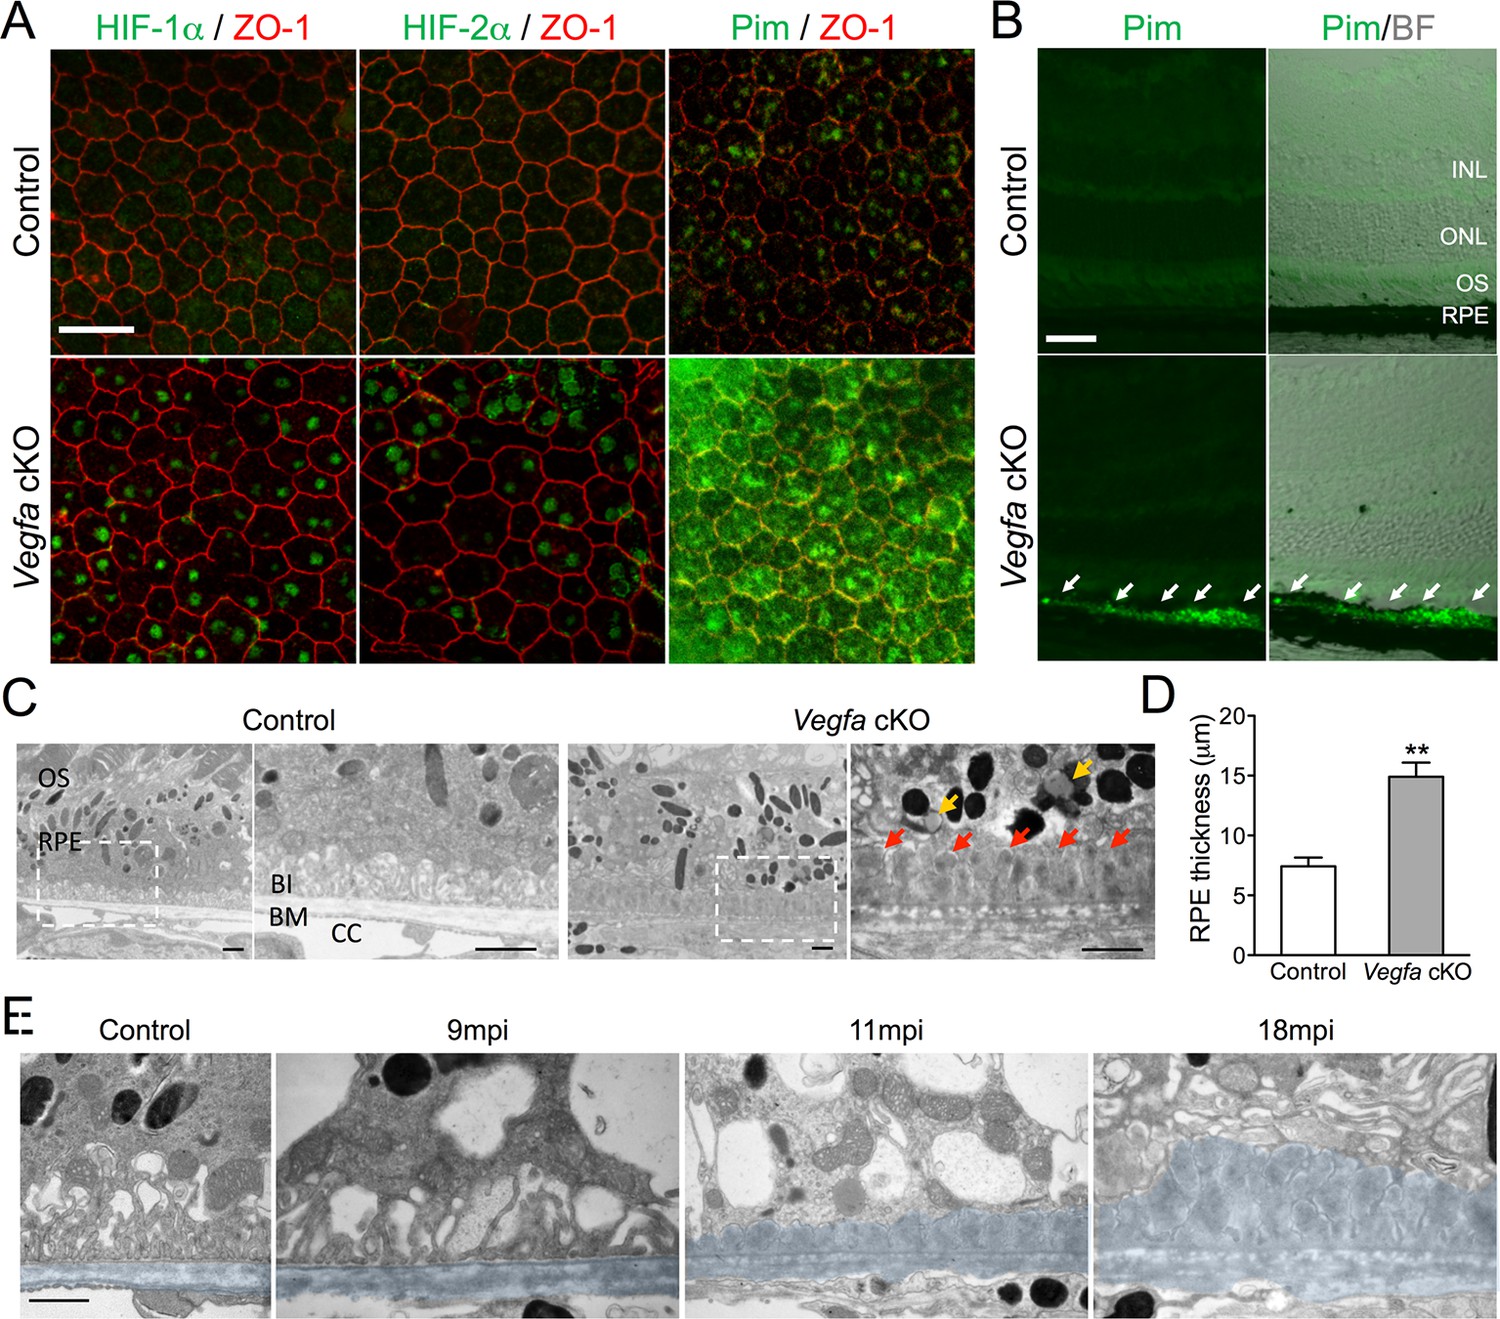
HIF-α accumulation precedes the induction of AMD-like features in Vegfa-cKO mice.
(A) HIF-1α, HIF-2α, and pimonidazole (Pim; green) are detected 6 months post induction in flat-mounted RPE/choroids from Vegfa mutants but not in littermate controls. ZO-1 (red) labels the cell boundaries. (B) The hypoxia probe Pimonidazole (Pim; green) is detected specifically in the RPE (white arrows) of cross-sectioned Vegfa mutant retinas (probe labeling is shown alone (left) and overlaid over brightfield images (right) to emphasize the retinal anatomy). (C) Electron micrographs of littermate control (left) and Vegfa-cKO RPE 11 months post induction (right). Dashed squares in left panels are magnified in right panels. Note the absence of choriocapillaris in Vegfa mutants, accumulation of lipid droplets (yellow arrows) in the cytoplasm, and thickening of Bruch’s membrane (red arrows). (D) Measured thickness values of the RPE of Vegfa mutant mice 11 months post induction (n=4) (see associated Figure 1—source data 1). (E) Electron micrographs of RPE/Bruch’s membrane from control and Vegfa-cKO RPE taken 9, 11, and 18 months post induction. Note the progressive accumulation of material in Bruch’s membrane (pseudo-colored light blue). Abbreviations: Pim=pimonidazole, INL=inner nuclear layer, ONL=outer nuclear layer (photoreceptor cell bodies), OS=photoreceptor outer segments, BI=basal infoldings of RPE cells, BM=Bruch’s membrane, CC=choriocapillaris, mpi=months post [RPE-specific] induction. Scale bars=20 µm (A), 50 µm (B), 1 µm C&E.
-
Figure 1—source data 1
Source data for Figure 1D.
- https://doi.org/10.7554/eLife.14319.004
Figure 1—figure supplement 1

Recombination efficiency in VMD2-Cre mice.
(A) RPE/choroid complexes from VMD2-Cre;ROSA26 mTomato/mGFP reporter mice were flatmounted 3 days post induction. (B) GFP expression, which occurs after cre-recombination, were counted and plotted. Error bars indicate mean s.e.m. (n=3).
Figure 1—figure supplement 2
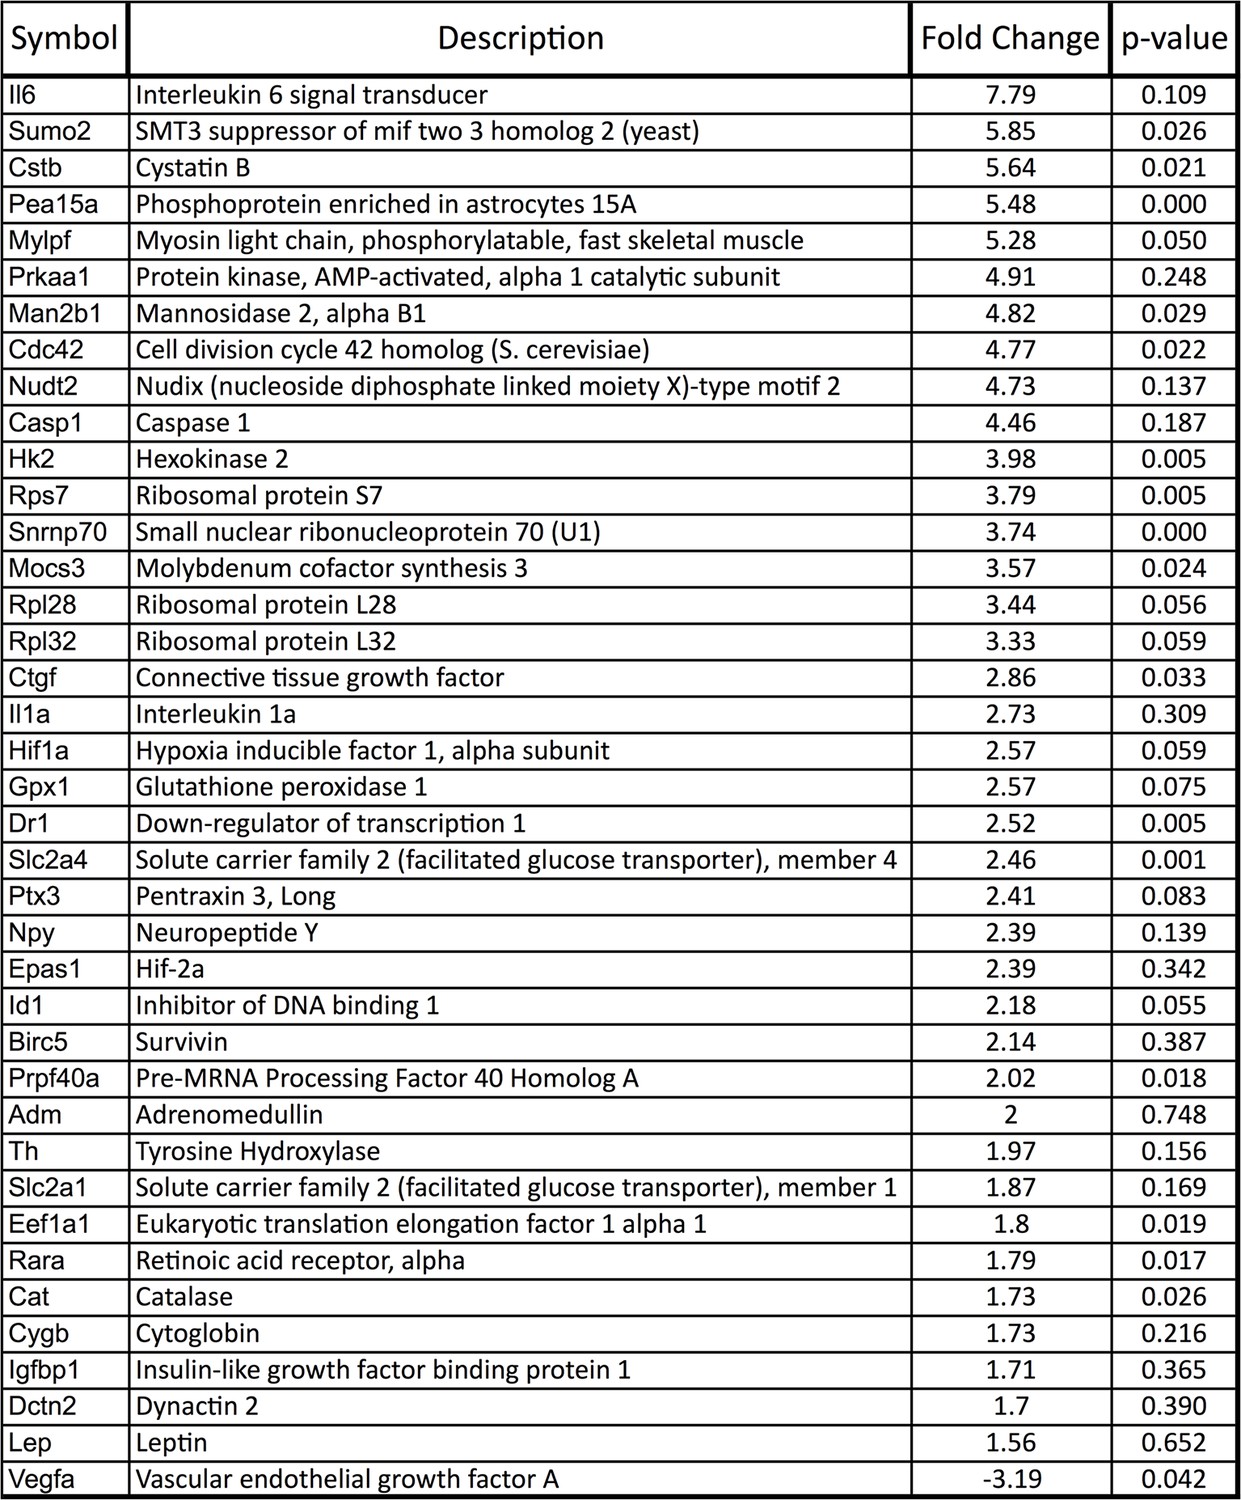
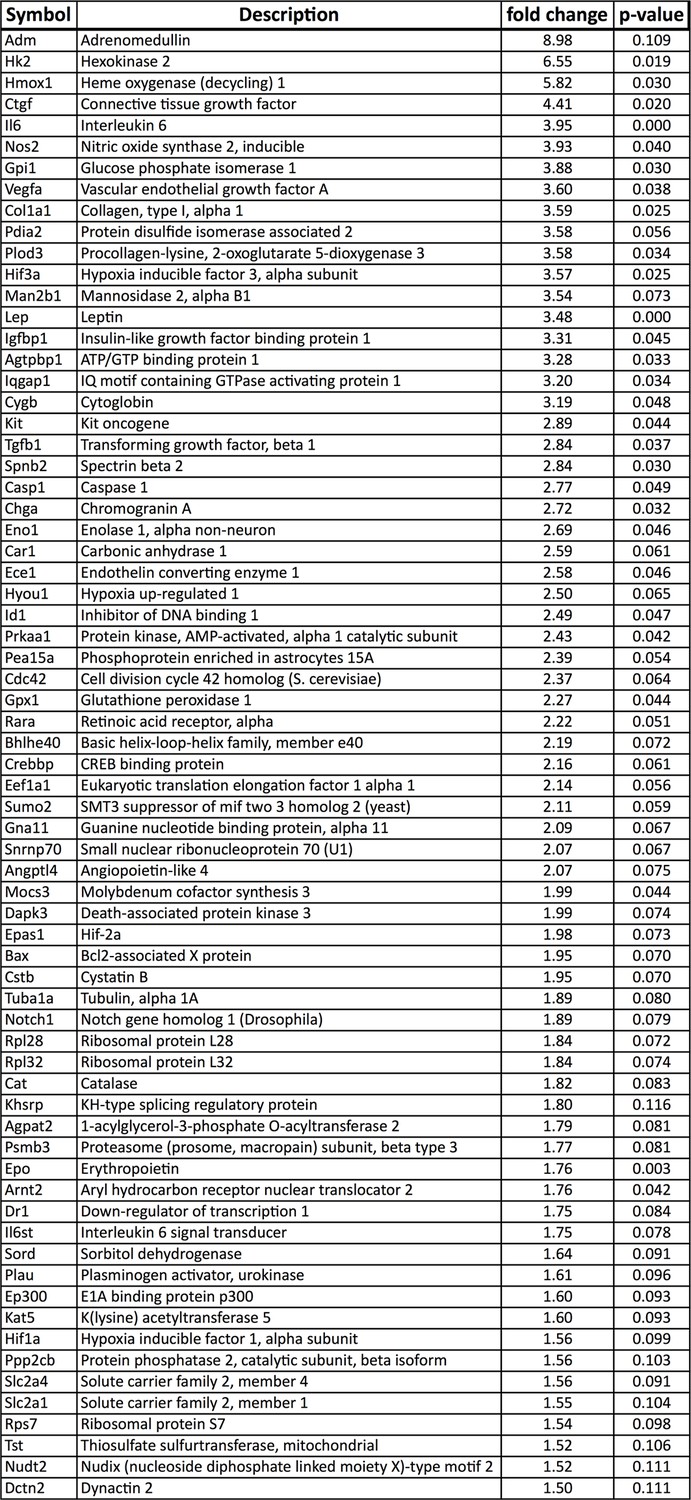
Upregulation of HIF target genes in Vegfa-cKO RPE.
Relative mRNA expression values generated using qPCR gene-profiling analyses of 84 hypoxia-related genes in Vegfa-cKO RPE/Choroids 6 months post-induction. The upregulated genes (P<0.05 or more than 1.5 fold-change) are listed according to fold change (highest to lowest) (n=4).
Figure 2
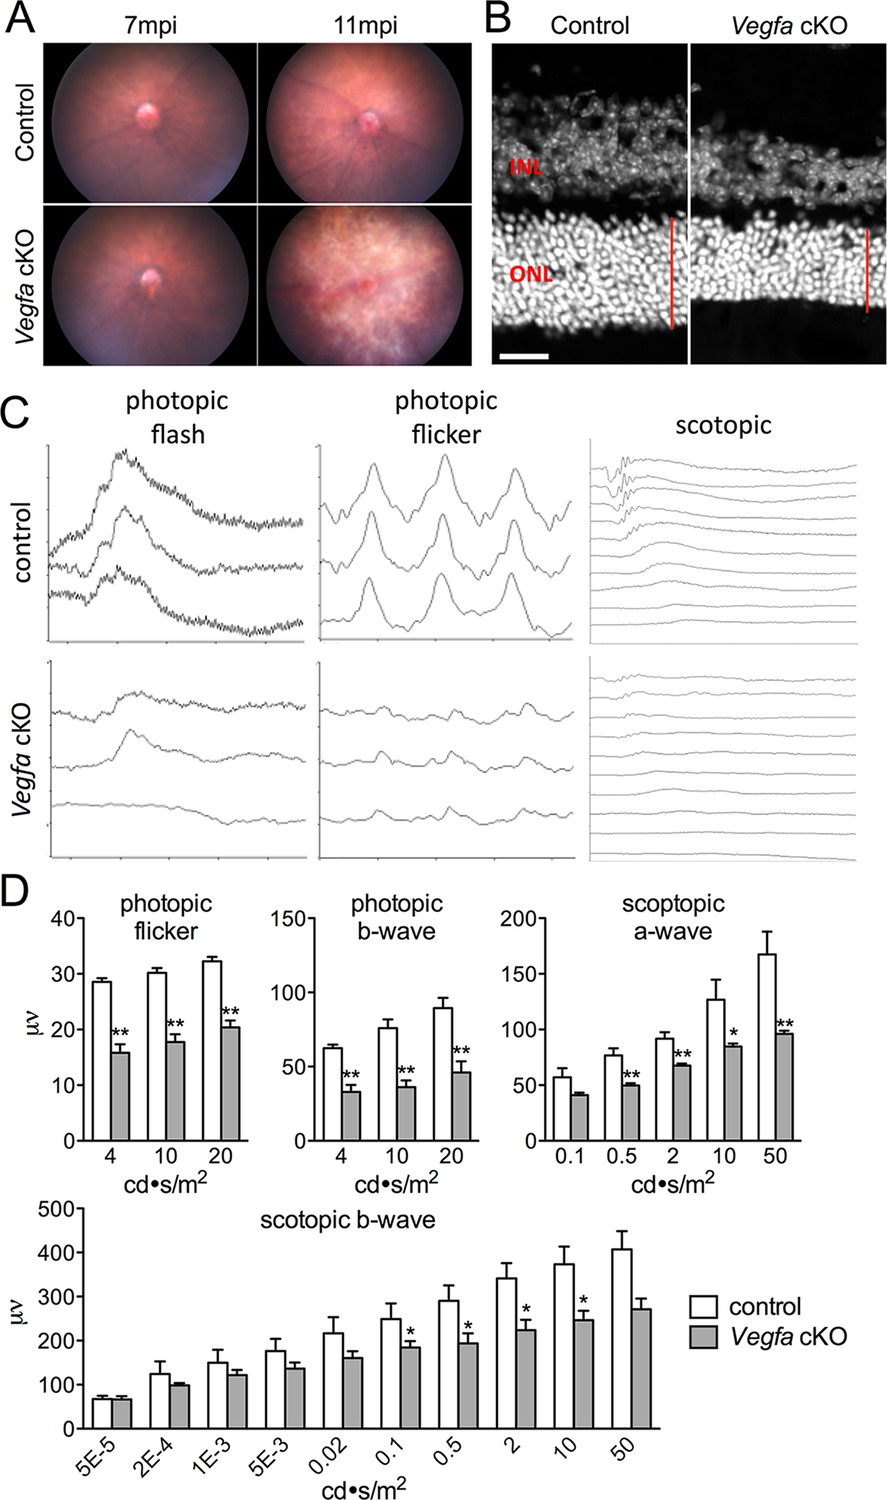
Photoreceptor atrophy and dysfunction is observed in late stage Vegfa-cKOs.
(A) Color fundus images of littermate control and Vegfa-cKO mice 7 or 11 months post induction (mpi). No obvious changes are seen after 7 months, but significant changes indicative of retinal degeneration are seen 11 months post induction. (B) Photoreceptor atrophy, determined by observing thinning of the outer nuclear layer (ONL; red vertical line) is seen in DAPI labeled cryosectioned Vegfa-cKO retinas 18 months post induction 600 μm from the optic nerve head compared with controls. (C) Full-field ERGs performed on controls and Vegfa-cKO mice 11 months post induction (n=6) reveal rod dysfunction in both the a- and b-waves (scotopic), and cone dysfunction in the b-wave and flicker response (photopic flash & flicker) in Vegfa-cKO mice. (D) Quantification of ERGs (see associated Figure 2—source data 1). *p<0.05, **p<0.01. Error bars indicate mean plus s.d. Scale bar=20 µm.
-
Figure 2—source data 1
Source data for Figure 2D.
- https://doi.org/10.7554/eLife.14319.008
Figure 3 with 1 supplement
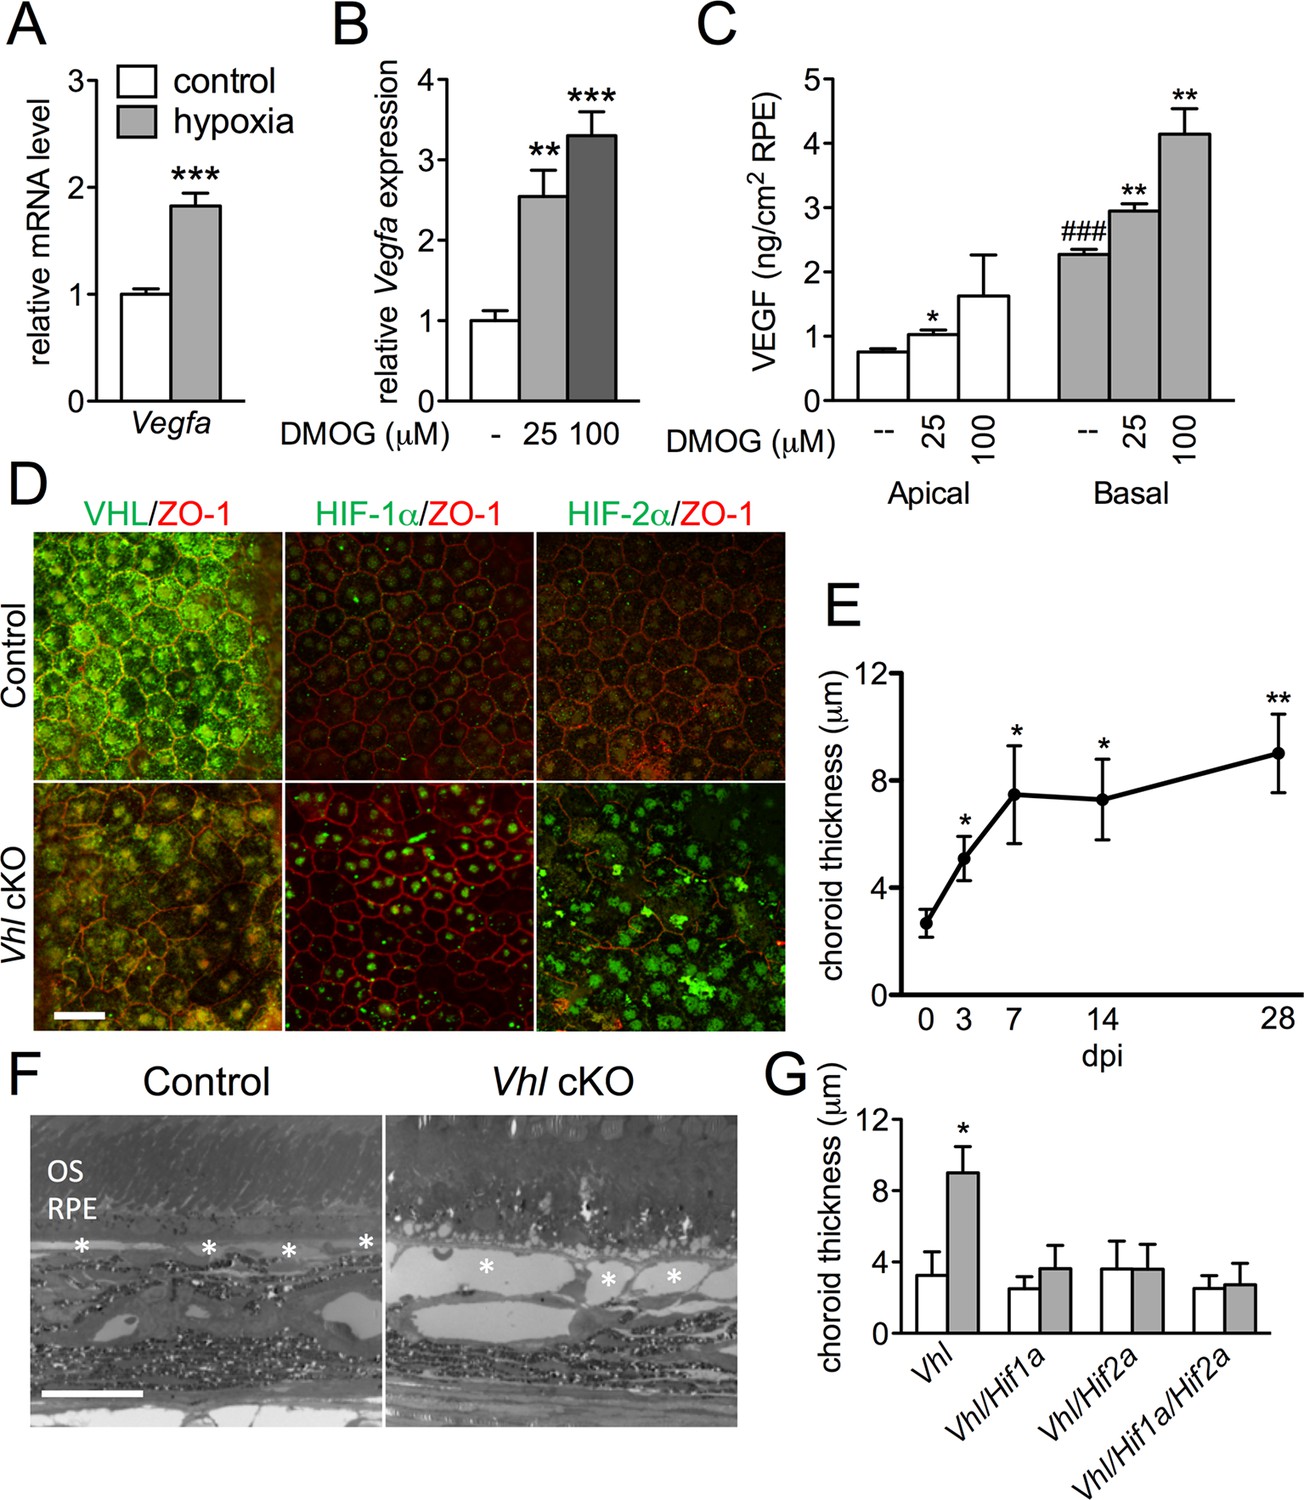
HIF-αs induce dilation of the choriocapillaris in Vhl-cKOs.
(A) Vegfa is upregulated in hRPE exposed to 3% oxygen. Data are the mean plus s.e.m. (n=5–6). (B–C) Vegfa mRNA (B) and VEGF165 protein (C—predominately from the basal surface when grown on transwells) is upregulated in a dose-dependent manner by DMOG for 24 hr compared with DMSO controls. Data are the mean plus s.e.m. (n=4–6). (D) Immunohistochemistry analyses reveal that VHL (green) expression is lost 3 days post induction in Vhl-cKOs, and HIF-1α and HIF-2α are upregulated in the nucleus of Vhl-cKOs RPE, but not in controls. (E) Measurements of the choriocapillaris from electron micrographs 0–28 days post induction (F) in untreated and Vhl mutants revealed progressive choriocapillaris vasodilation (n=4). (G) Choriocapillaris thickness values of Vhl-cKO, Vhl/Hif1a-dKO, Vhl/Hif2a-dKO, Vhl/Hif1a/Hif2a-tKO mice measured 28 days post induction (n=4). (See also associated Figure 3—source data 1 for panels A-C, E, and G.) Scale bars=20 µm. Error bars represent mean plus s.d.
-
Figure 3—source data 1
Source data for Figure 3A–C,E, and G.
- https://doi.org/10.7554/eLife.14319.010
Figure 3—figure supplement 1
Upregulated hypoxia-related genes in Vhl-cKO RPE/Choroid.
Relative mRNA expression values obtained using qPCR gene-profiling analyses of 84 hypoxia-related genes in Vhl-cKO RPE/Choroids 3 days post induction. The dysregulated genes (p<0.05 or more than 1.5 fold-change) are listed according to fold change values (highest to lowest) (n=4).
Figure 4
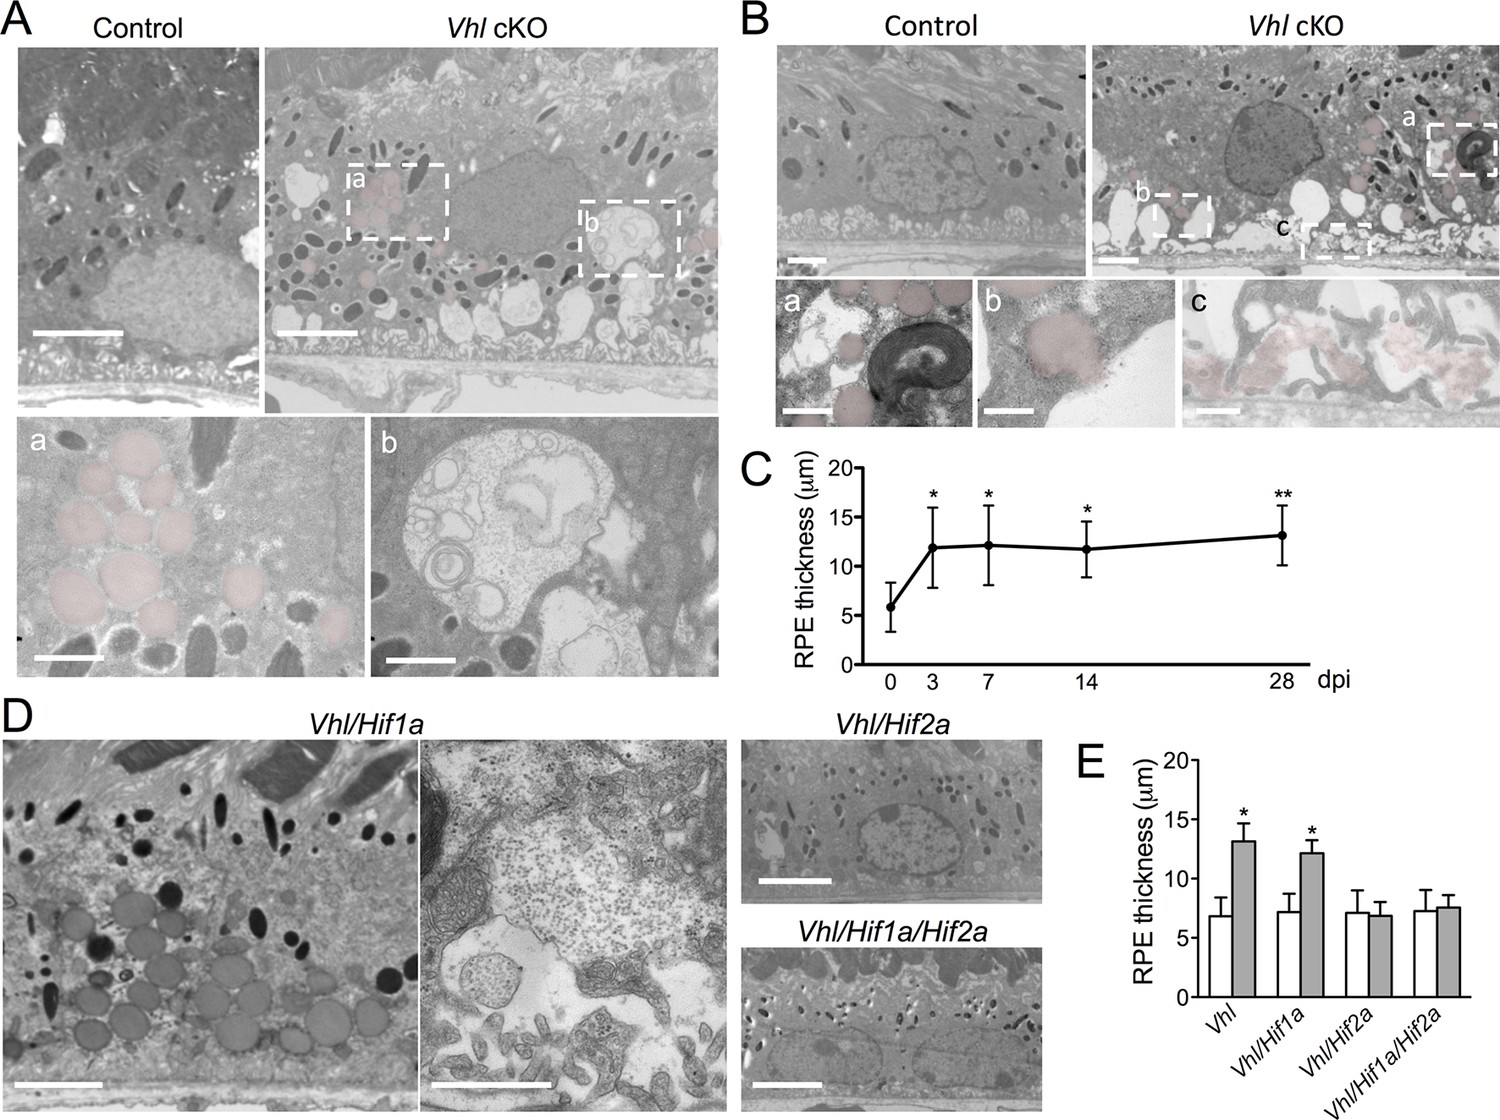
Dramatic and rapid-ensuing RPE defects observed in Vhl-cKO mice are dependent on Hif2a.
(A) Electron micrographs of RPE cells from littermate control and Vhl-cKO mice 3 days post Vhl deletion. Regions marked with perforated white rectangles are in the lower panels. Note the intracellular accumulations of lipid droplets (a; red) and glycogen (b). (B) Electron micrographs of RPE cells from littermate control and Vhl-cKO mice 14 days post Vhl deletion. Intracellular lipid droplets (a), extrusion of lipid droplets into the subretinal space (b), and lipids collecting along the basal laminar surface of Bruch’s membrane and between RPE basal infoldings (c) are observed. (C) Thickness measurements from electron micrographs and reveal that RPE hypertrophy occurs from 0–3 day post induction timepoints, and then plateaus from 3–28 timepoints in Vhl mutant mice (n=5). (D) Electron micrographs of RPE from Vhl/Hif1a (left panels), Vhl/Hif2a (upper middle panel), and Vhl/Hif1a/Hif2a (bottom middle panel) mutant mice 14 days post induction. Note that lipid droplets (dark gray spheres, upper left panel) and material resembling glycogen (small punctate spots) are observed in Vhl/Hif1a-dKO, but not in Vhl/Hif2a-dKO or Vhl/Hif1a/Hif2a-tKO RPE) 14 days post induction. These data suggest Hif2a is responsible for the phenotype in Vhl mice. (E) Choriocapillaris thickness values of Vhl-cKO, Vhl/Hif1a, Vhl/Hif2a, Vhl/Hif1a/Hif2a mice measured 28 days post induction (n=4). (See also associated Figure 4—source data 1 for panels C&E.) Scale bars=5 µm (A), 1 µm (A’a & A’b), 2 µm (B), 0.5 µm (B’a, B’b, B’c), 5 µm (D). Error bars represent mean plus s.d.
-
Figure 4—source data 1
Source data for Figure 4C&E.
- https://doi.org/10.7554/eLife.14319.013
Figure 5 with 2 supplements

Progressive and rapid photoreceptor degeneration observed in Vhl-cKO mice is dependent on Hif2a.
(A) Thickness measurements from electron micrographs reveal progressive thinning of the outer nuclear layer (ONL or photoreceptor cell bodies) from 0–28 days post induction timepoints in Vhl mutant mice (n=5). (B) Cryosectioned DAPI stained retinas from Vhl-cKO mice prior to induction (0 dpi; left panel), 7 dpi, and 28 dpi. (C) Quantified thickness values measured 600 μm from the optic nerve head of the outer nuclear layer in Vhl-cKO, Vhl/Hif1a, Vhl/Hif2a, and Vhl/Hif1a/Hif2a 28 days post induction (n=4) (See associated Figure 5—source data 1 for panels A&C.). (D) Full-field ERGs performed on Vhl-cKO and control mice 28 days post induction. (E) ERGs from Vhl/Hif1a, (F) Vhl/Hif2a, and (G) Vhl/Hif1a/Hif2a mutant mice 28 days post induction. ERG analyses reveal that normal photoreceptor function is observed in Vhl/Hif2a (F) or Vhl/Hif1a/Hif2a (G) mutant mice. *p<0.05, **p<0.01. For all ERGs n=6–8. Error bars indicate mean plus s.d.
-
Figure 5—source data 1
Source data for Figure 5A&C and Figure 5—figure supplement 1A–C.
- https://doi.org/10.7554/eLife.14319.015
Figure 5—figure supplement 1
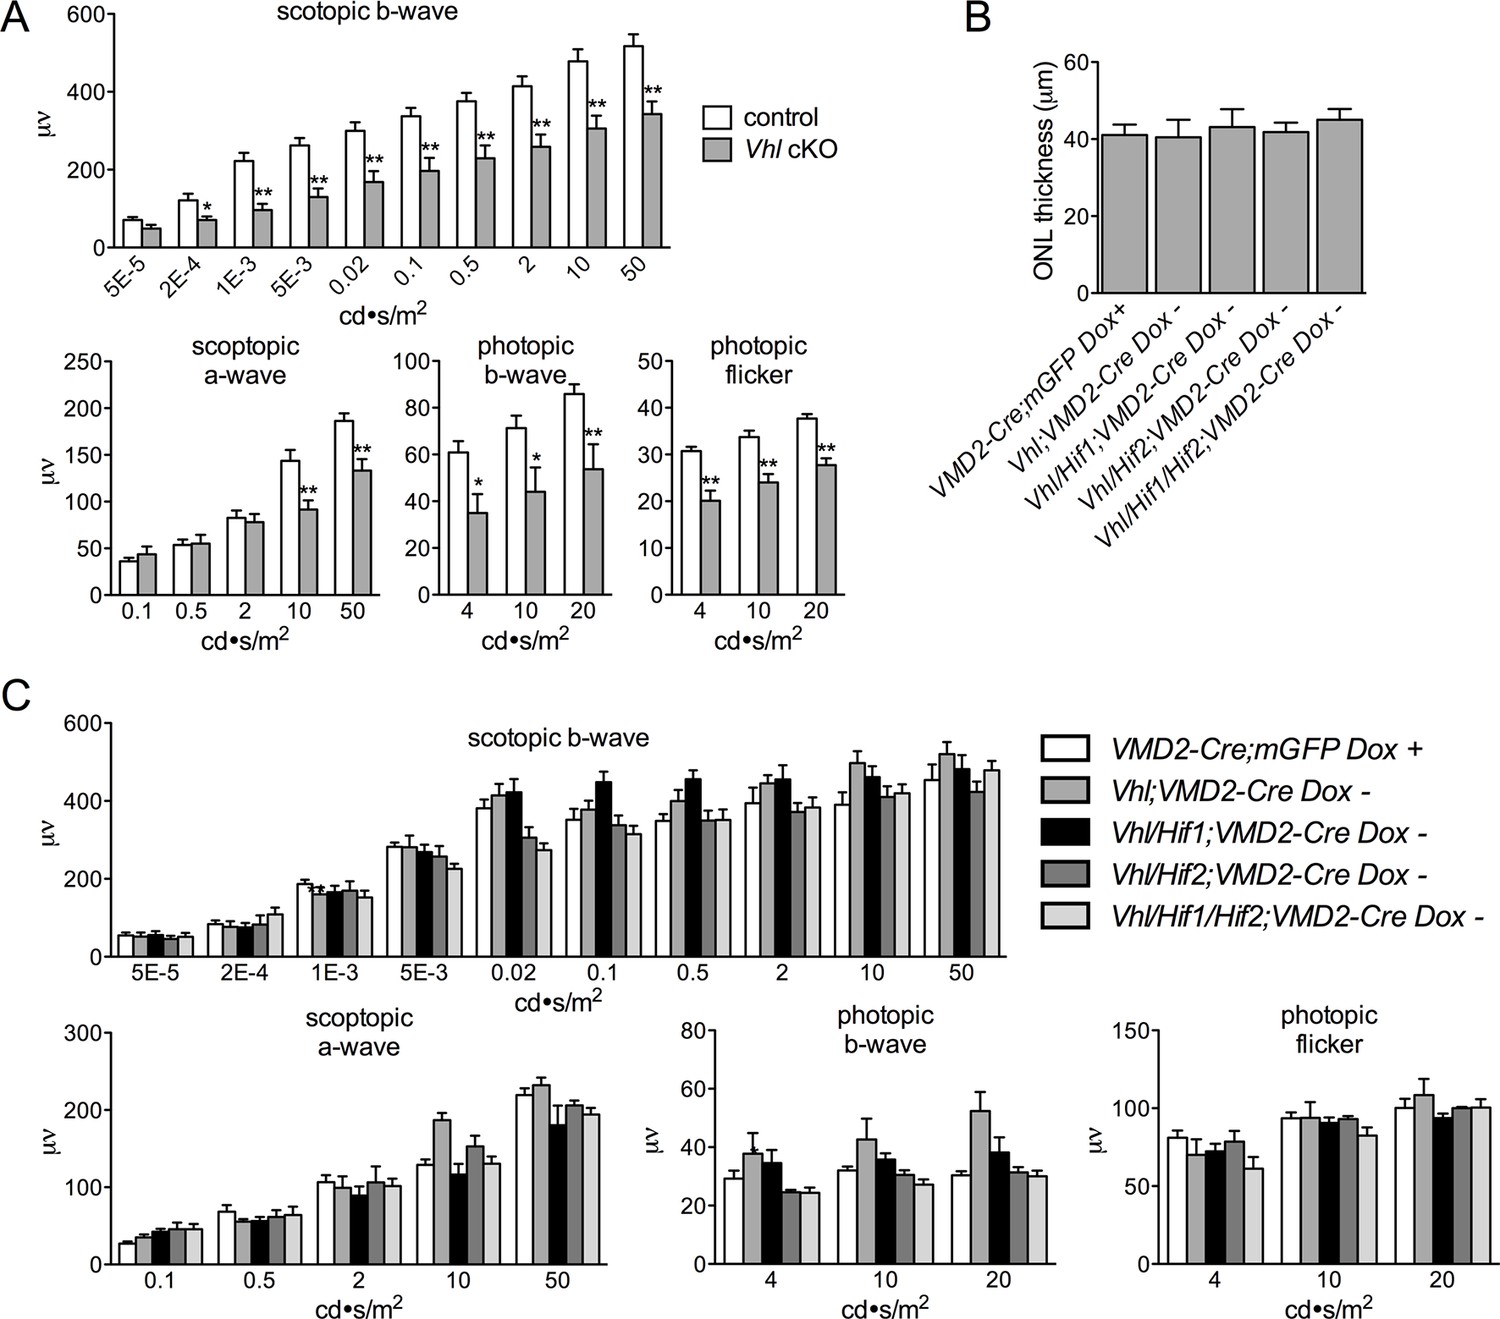
Quantification of ERGs for Vhl cKO and lack of photoreceptor degeneration in relevant controls.
(A) Quantification of ERGs from Figure 5D (n=6–8). (B) Thickness measurements from electron micrographs reveal no differences in ONL thickness values from multiple controls including VMD2-Cre;mGFP + Doxycycline, VMD2-Cre;Vhl no Doxycycline, VMD2-Cre;Vhl/Hif1a; no Doxycycline, VMD2-Cre;Vhl/Hif2a; no Doxycycline, and VMD2-Cre;Vhl/Hif1a/Hif2a; no Doxycycline 28 days post induction. VMD2-Cre/mGFP mice received doxycycline 28 days prior to examination (n=4). (C) ERGs measured in the same controls 28 days post injection as (B) (n=6–8). (See associated Figure 5—source data 1) *p=0.05, **p=0.01.
Figure 5—figure supplement 2
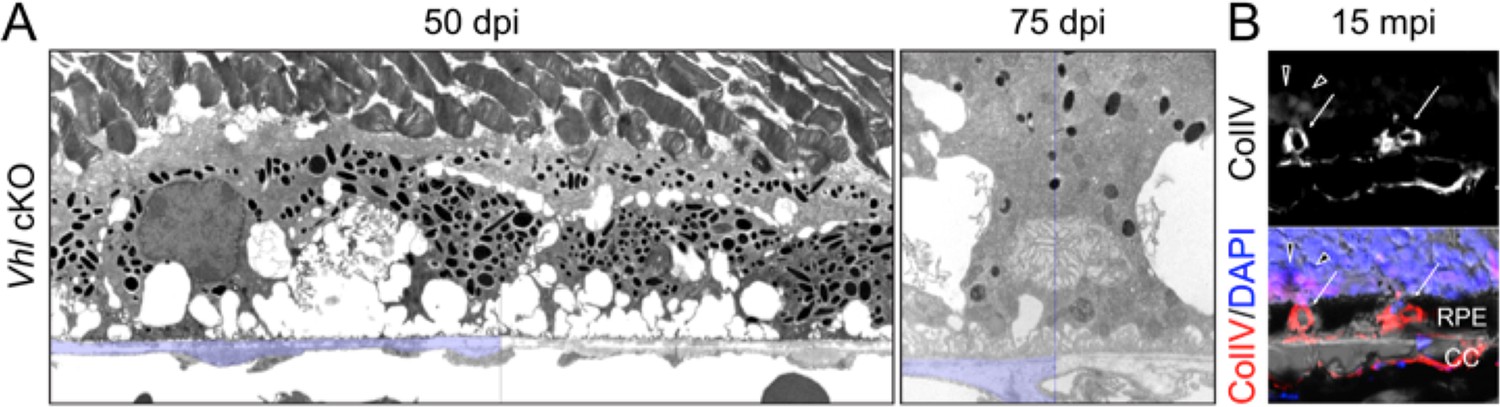
RPE and choroid defects characteristic of retinal remodeling are observed in late stage Vhl mutants.
(A) (Left panel) The basal infoldings of RPE are severely distended and cells are misshapen 50 days post induction. (Right panel) Pale nuclei are observed at 75 days post induction. Half of each micrograph is pseudo-colored blue to mark Bruch’s membrane. (B) Neovascularization is observed at very late stages in Vhl mutants (15 months post induction). Collagen IV labels blood vessels that are interdigitating with RPE cells (white arrows).
Figure 6 with 3 supplements
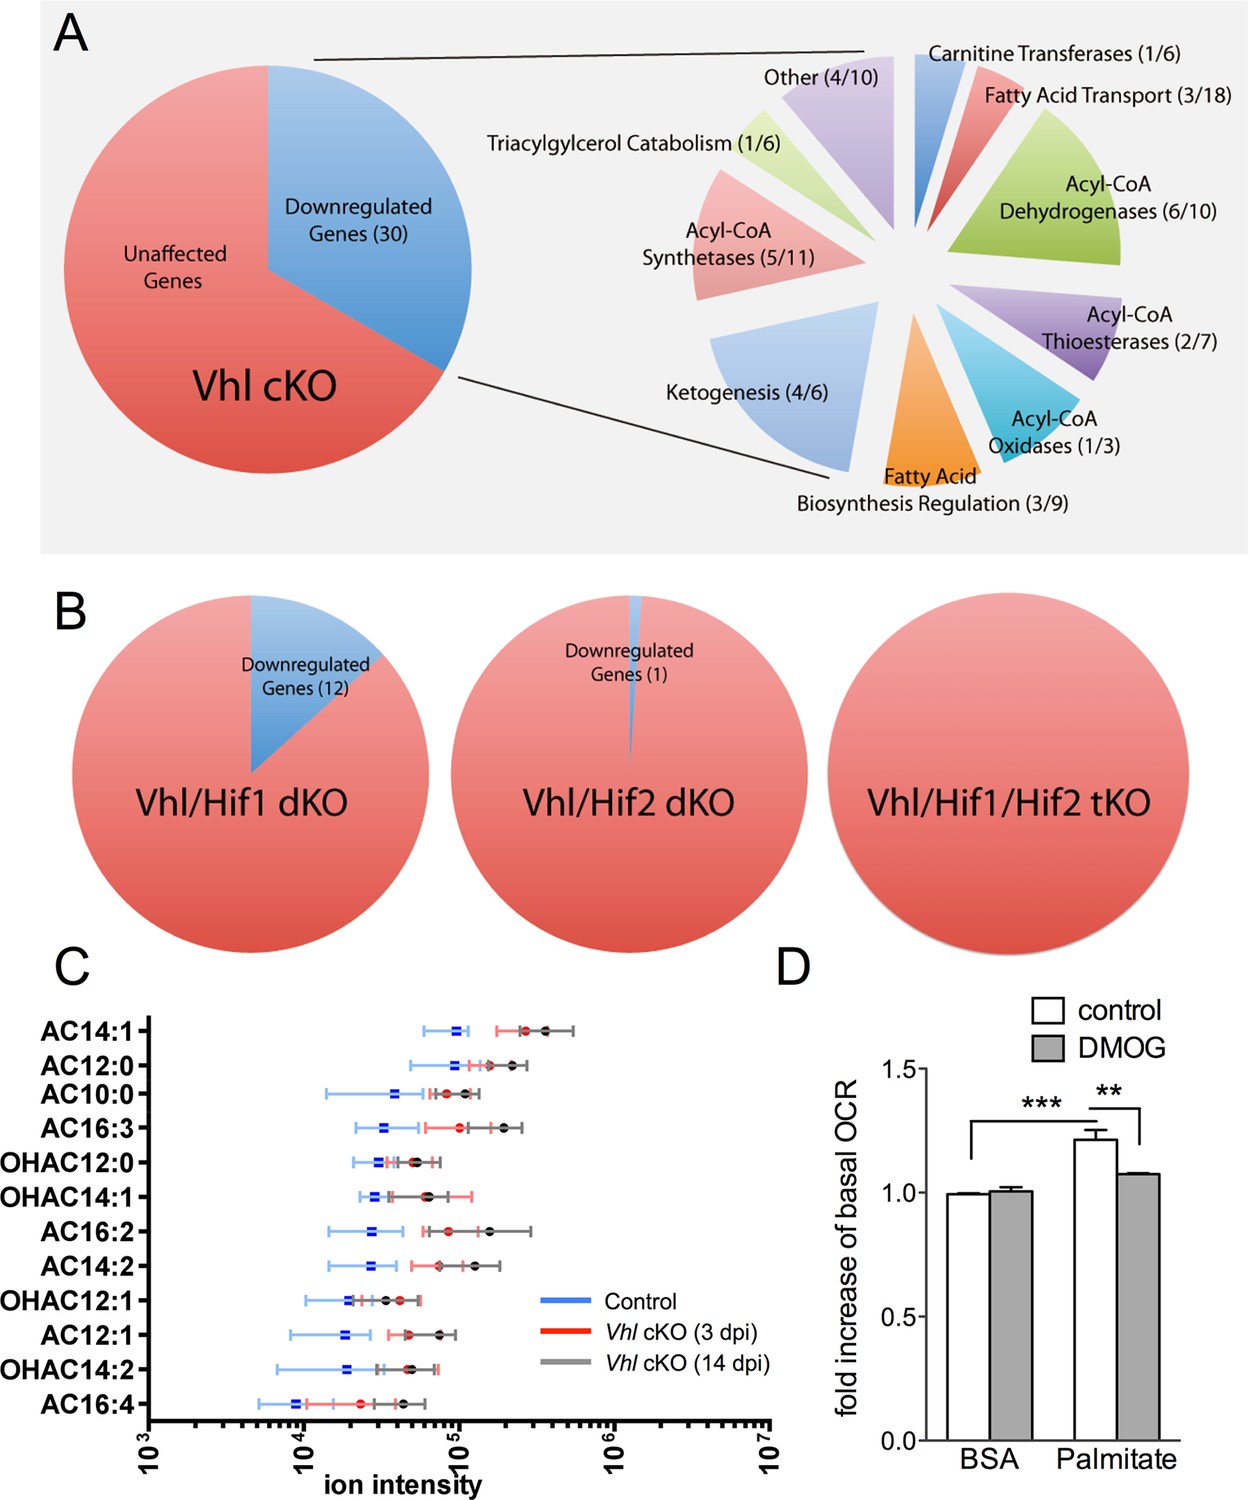
Defects in lipid metabolism in Vhl mutant RPE.
(A) Summary of gene-profiling experiments for lipid metabolism genes in RPE/choroid complexes from Vhl mutant mice 3 days post induction (n=4). (B) Downregulation of lipid metabolism genes was also seen in Vhl/Hif1a mutants, but nominally in Vhl/Hif2a, and no gross changes were seen in Vhl/Hif1a/Hif2a mutants 3 days post induction (n=4). (C) Untargeted high-resolution mass spectrometry-based metabolomic analyses revealed that a group of acylcarnitines (AC) was progressively dysregulated from 3 to 14 days post induction (n=4–6) (see also associated Figure 6—source data 1). Box and whiskers plots are shown. Error bars represent maximum and minimum values. (D) Pre-treating hRPE with DMOG reduced the basal oxygen consumption rates (initial OCR – OCR after injection of RAA) when the cells were assayed in substrate limited media (2.5 mM glucose) and provided BSA control or palmitate conjugated to BSA (n=4) (see also associated Figure 6—figure supplement 3B). Error bars are the maximum and minimum values in panel C and mean plus s.d. in panel D.
-
Figure 6—source data 1
Source data for Figure 6C, Figure 6—figure supplement 2A–D, Figure 6—figure supplement 3B.
- https://doi.org/10.7554/eLife.14319.019
Figure 6—figure supplement 1
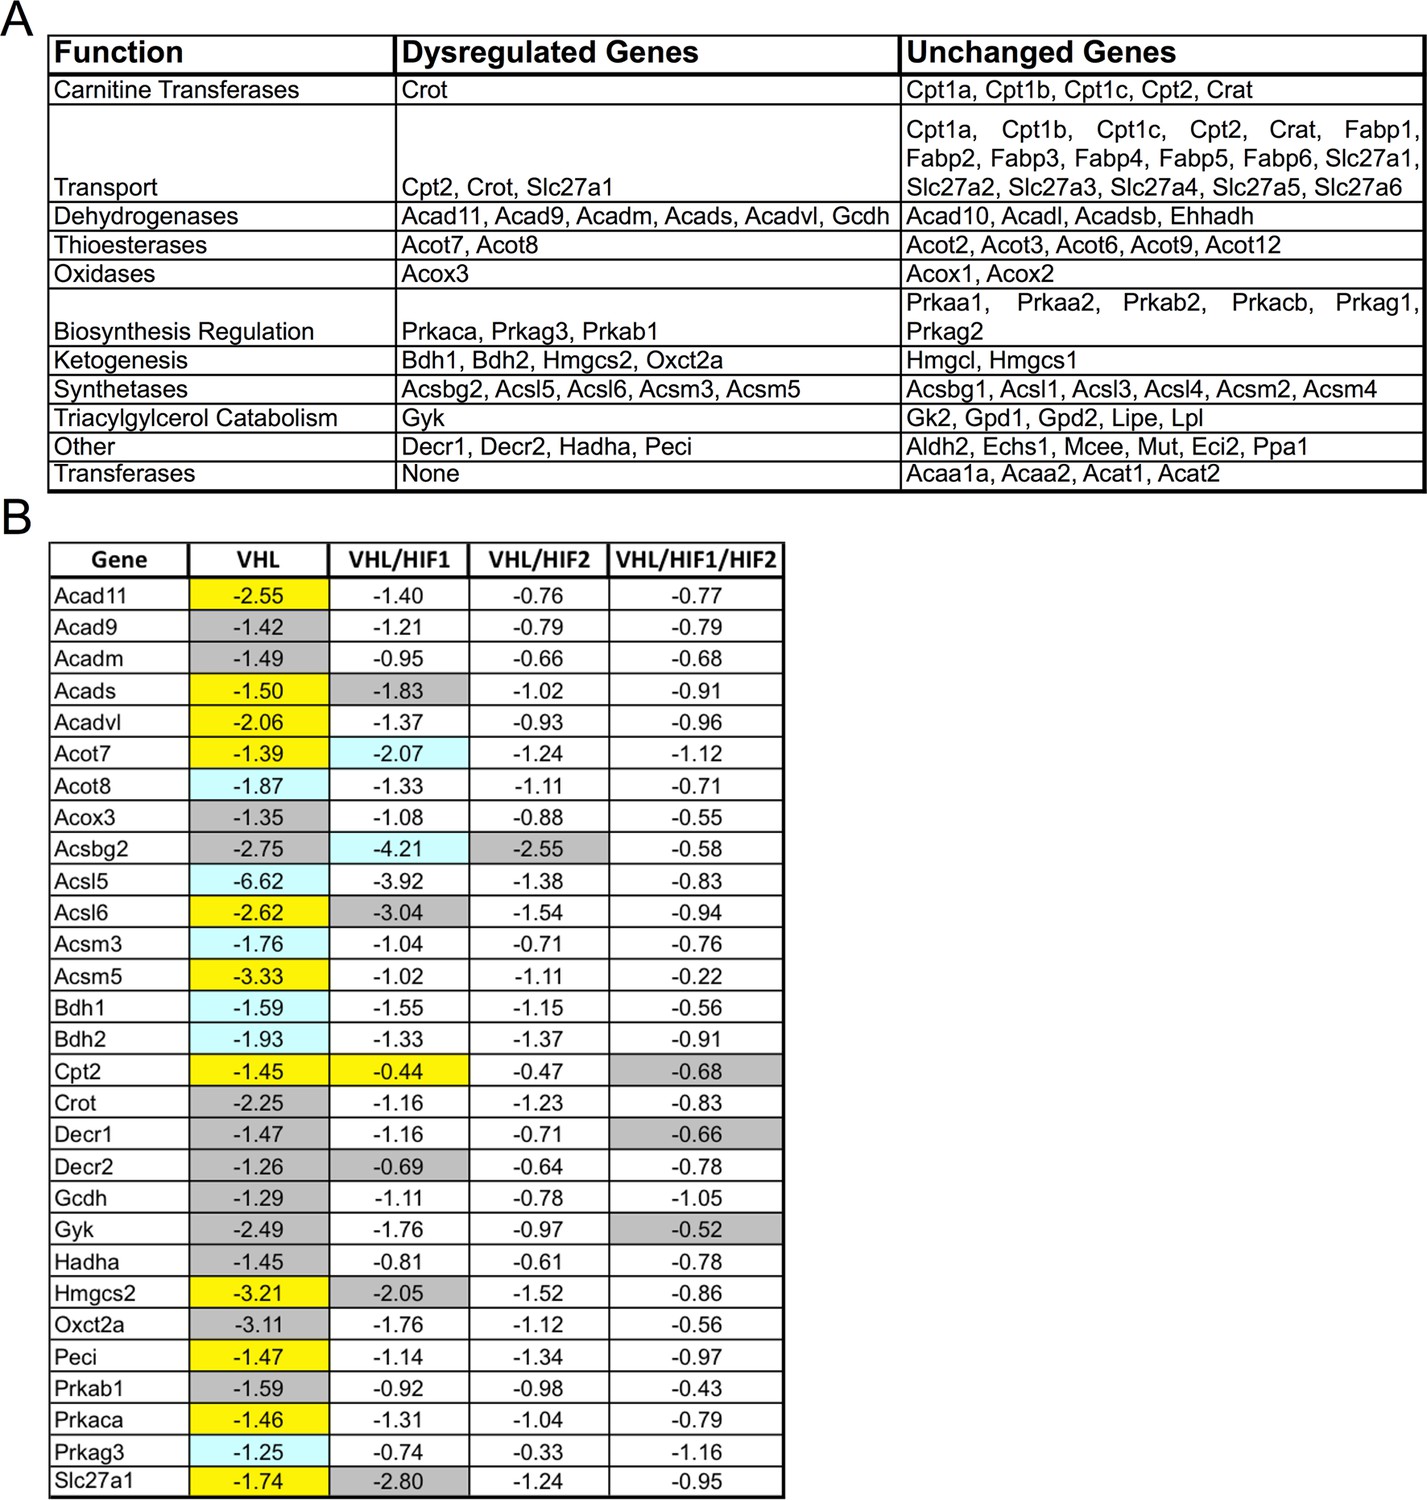
Classification of lipid metabolism genes and gene-profiling in Vhl and combinatorial Vhl/Hif mutants.
(A) Classifications of the genes from the Mouse Fatty Acid Metabolism PCR array (PAMM-007; Qiagen). (B) Profiling of fatty acid metabolism genes in Vhl-cKO and Vhl-cKO, Vhl/Hif1a-dKO, Vhl/Hif2a-dKO, Vhl/Hif1a/Hif2a-tKO RPE/choroids 3 days post induction (n=4). Note that the significant dysregulations in Vhl-cKO mice are predominately rescued in Vhl/Hif2a-dKO and Vhl/Hif1a/Hif2a-tKO mice 3 days post induction (n=4). Vhl/Hif1a-dKO induces only partial rescue. Boxes are colored gray, blue, or yellow for fold change values with p<0.05, p<0.01, p<0.001 significance respectively.
Figure 6—figure supplement 2

MS-based metabolomic assays for Vhl-cKO, Vhl/Hif1a-dKO, Vhl/Hif2a-dKO, Vhl/Hif1a/Hif2a-tKO mice.
(A-D) Untargeted high-resolution mass spectrometry-based metabolomic analyses revealed that multiple unique small molecule metabolites are dysregulated in Vhl-cKO and Vhl/Hif1a-dKO, mice but not in Vhl/Hif2a and Vhl/Hif1a/Hif2a-tKO mice 3 days post induction (n=6). (See also associated Figure 6—source data 1.) The majority of the identifiable metabolites consisted largely of acylcarnitines. Error bars indicate maximum and minimum values.
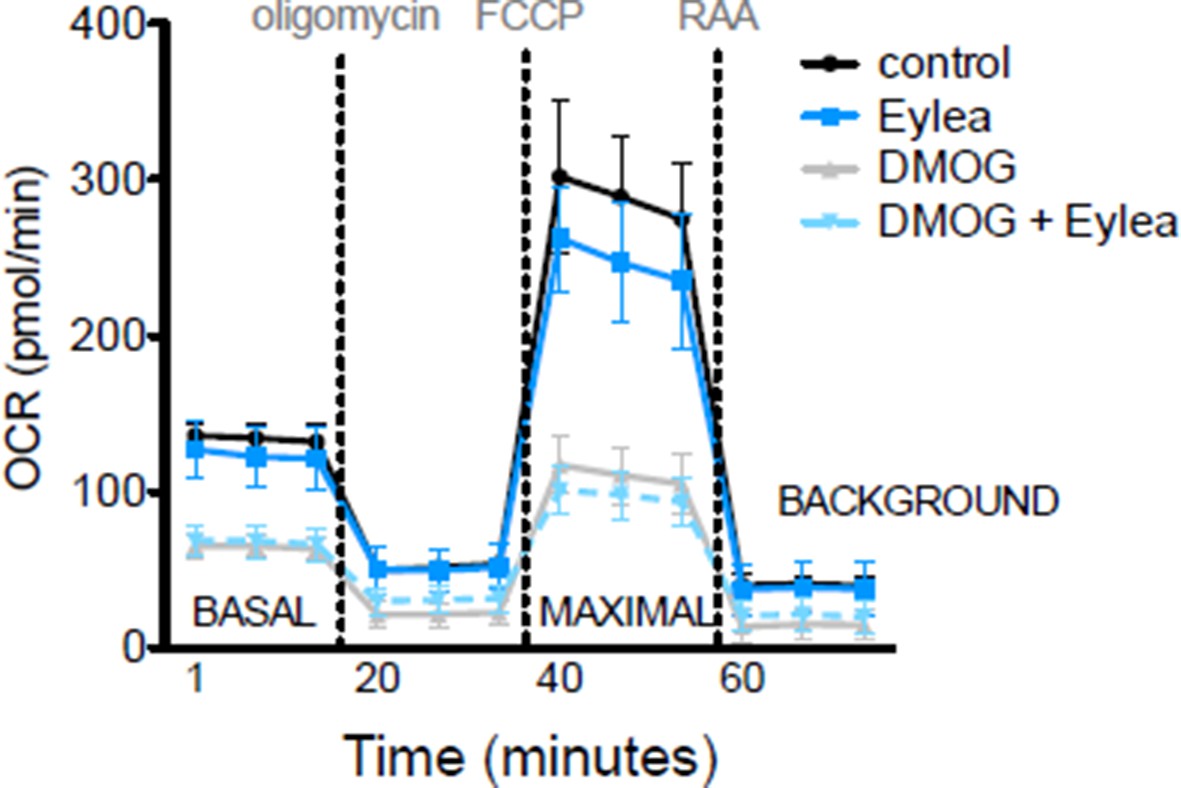
Figure 6—figure supplement 3
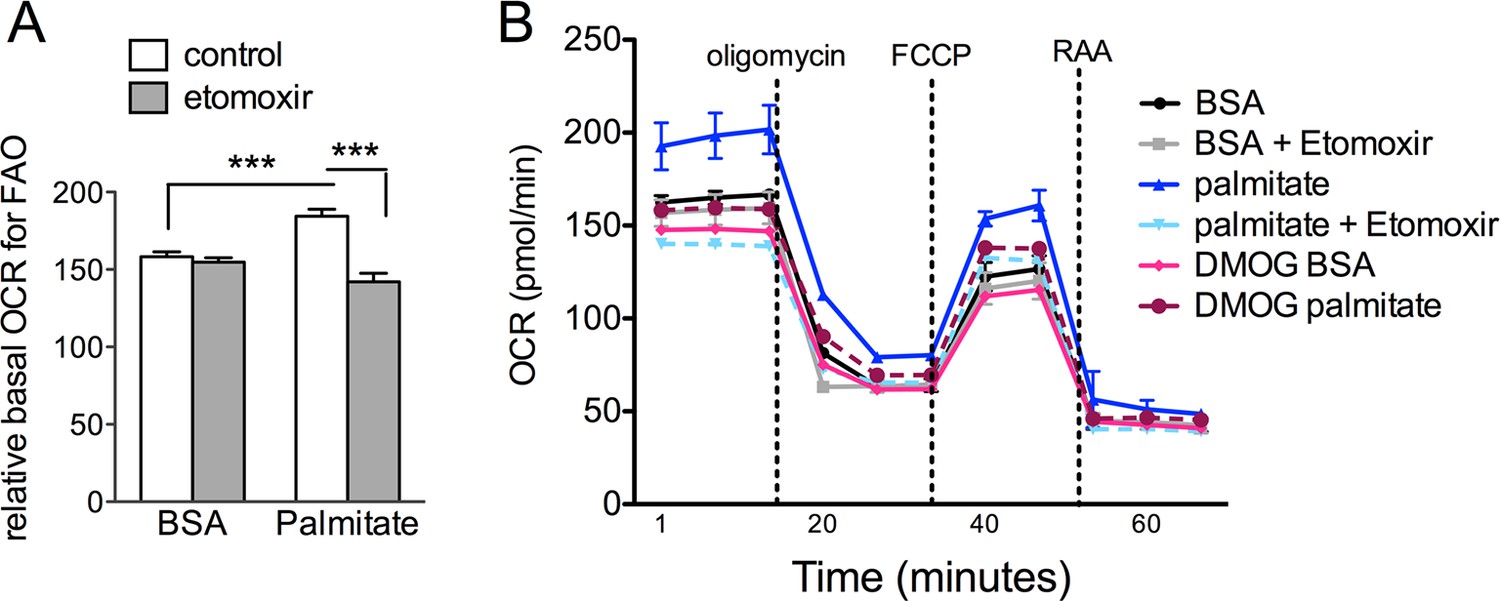
DMOG inhibits lipid oxidation in RPE cells.
(A) Basal oxygen consumption rates (OCR) of hRPE treated with BSA-Palmitate conjugates or with BSA alone after treatment with 40 μM Etomoxir, an inhibitor of CPT-1, to validate the increased of OCR are due to fatty acid oxidation (FAO). Data are the mean plus s.e.m. (n=8). (B) Seahorse Flux Analysis full OCR trace showing hRPE cells responding to pre-treatment with DMOG (10 μM) for 24 hr in the presence and absence of BSA, palmitate and etomoxir (see also associated Figure 6—source data 1). Data are the mean plus s.d. (n=6)
Figure 7 with 2 supplements

Glucose consumption and metabolism is altered in the RPE of Vhl mutants.
(A) Gene-profiling data revealed that glycogen degradation genes were significantly attenuated in Vhl mutants 3 days post induction (n=4). (B) Gene-profiling data for glucose metabolism genes were summarized by plotting changes along the glycolysis and TCA cycle pathways 3 days post induction (n=4) (red text=downregulated, blue text=upregulated). (C) Basal and maximal oxygen consumption rates (OCR) of hRPE after being exposed to 3% O2 for 72 hr or maintained at normoxia. Data are the mean plus s.e.m. (n=7–10). (D) Seahorse Flux Analysis OCR trace showing reduced OCR in hRPE cells treated with DMOG for 24 hr. Data points are the mean plus s.d. (n=6). (E and F) Changes in lactate (E) and glucose (F) levels of the media from hRPE cells, in transwells, after treatment with DMOG for 24 hr. Data are the mean plus s.e.m. (n=4). (G) Glucose levels are decreased in the sensory retina of Vhl-cKO mice 3 days post induction compared with littermate controls (n=6–10). (H) Relative glucose consumption is increased (roughly two-fold) in primary Vhl-cKO RPE compared with controls (n=6). (I and J) Relative expression level of Glut1 in hRPE cells after exposure to 3% 02 for 72 hr (I) or treatment with DMOG for 24 hr (J). Data are the mean plus s.e.m. (n=6). (K) Changes in glutamine levels of the media from hRPE cells, in transwells, after treatment with DMOG for 24 hr. (See also associated Figure 7—source data 1 for panels C-K.) Data are the mean plus s.d. (n=4).
-
Figure 7—source data 1
Source data for Figure 7C–K, Figure 7—figure supplement 2A.
- https://doi.org/10.7554/eLife.14319.024
Figure 7—figure supplement 1
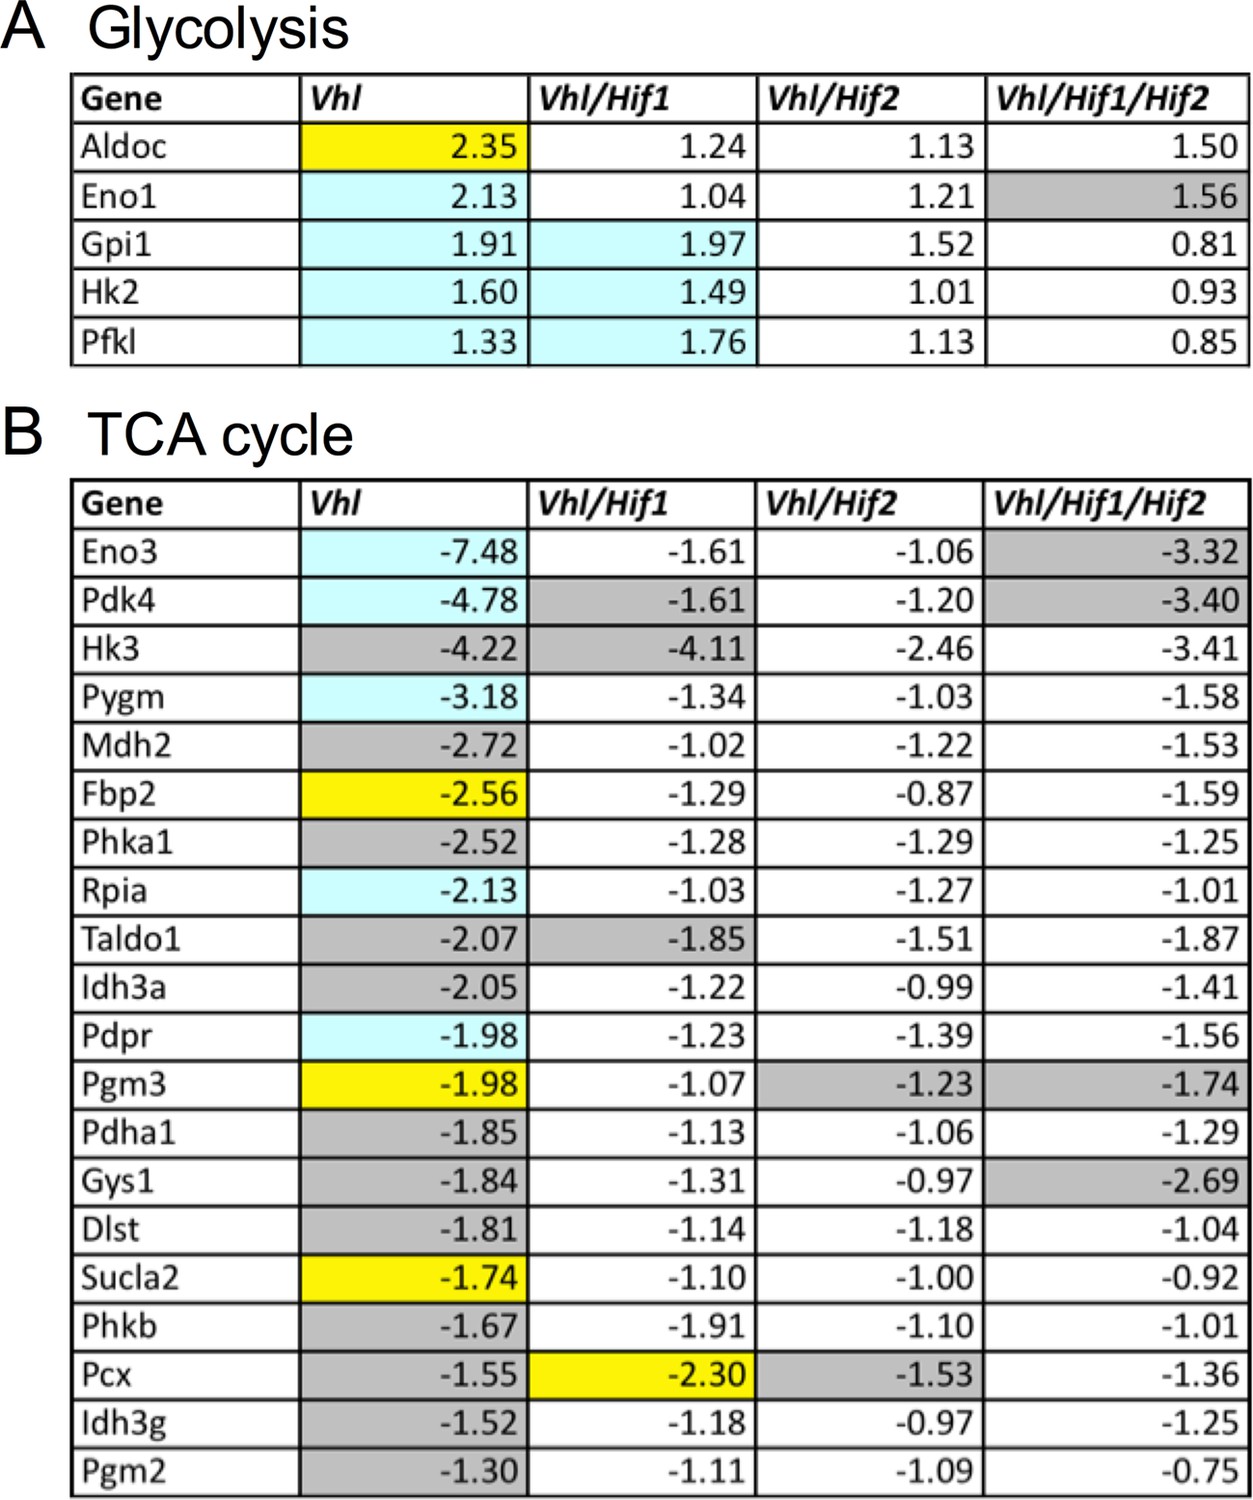
Altered regulation of glycolytic and TCA genes in Vhl and Hif mutants.
(A) Glycolysis-related gene expression changes (fold change) in Vhl-cKO and Vhl/Hif-dKO combination mutants 3 days post induction (n=4). Boxes are colored gray, blue, or yellow for fold change values with p<0.05, p<0.01, p<0.001 significance respectively. (B) TCA cycle-related gene expression changes (fold change) in Vhl and Vhl/Hif combination mutants 3 days post induction (n=4).
Figure 7—figure supplement 2
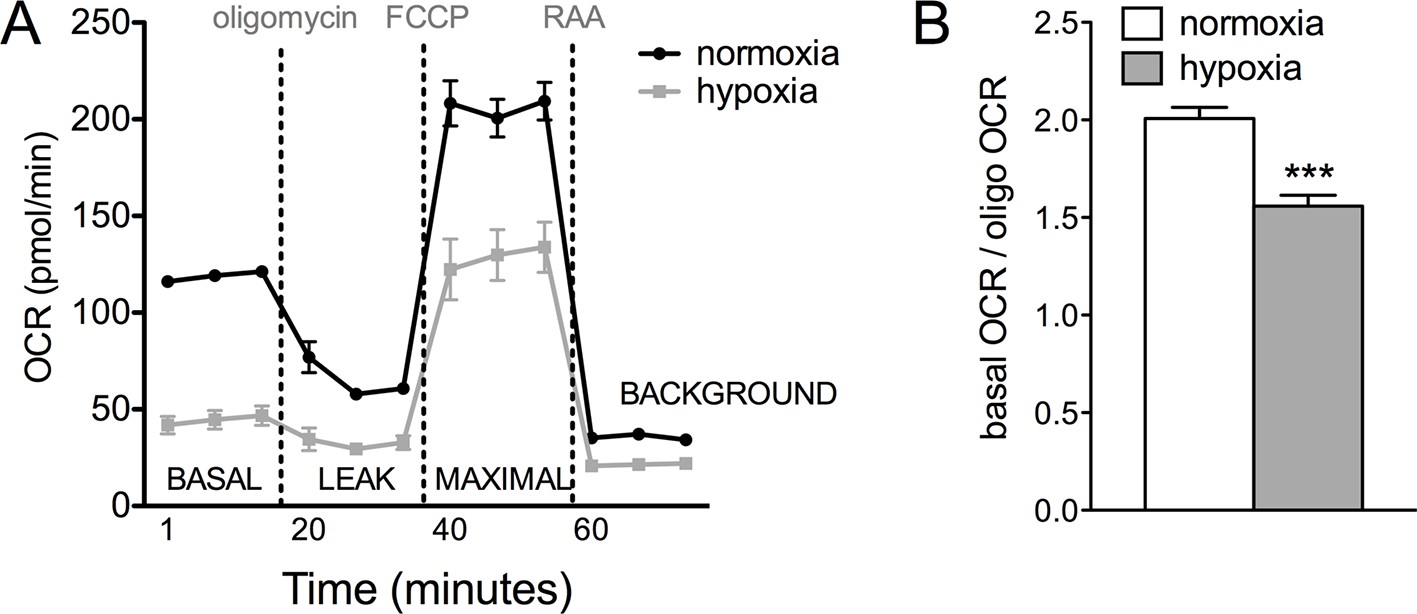
Glucose metabolism is altered in Vhl mutant RPE and hRPE exposed to hypoxia.
(A) Seahorse Flux Analysis full OCR trace showing hRPE cells exposed to 3% O2 for 72 hr or maintained at hypoxia, two plates combined onto one graph. Data are the mean pluss.e.m. (n=10) (See also associated Figure 7—source data 1). (B) Ratio of basal OCR to OCR after addition of oligomycin in hypoxia and normoxia hRPE cells. Data are the mean plus s.e.m. (n=10).
Figure 8
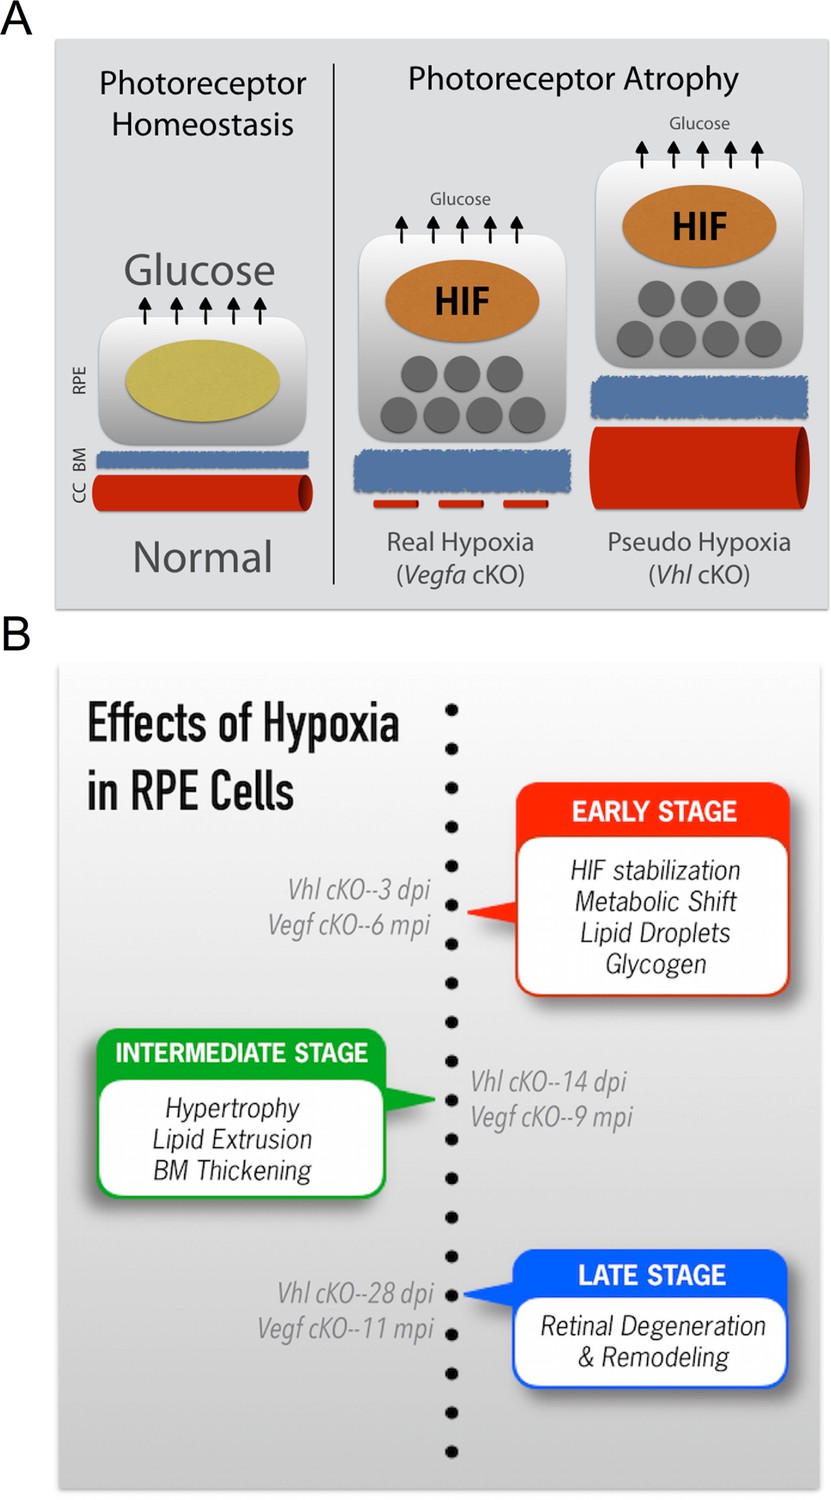
Summarizing the onset of the major phenotypes in Vhl and Vegfa mutant mice.
(A) In normal conditions RPE deliver sufficient levels of glucose for photoreceptor homeostasis. During real (Vegfa-cKO) and pseudo hypoxia (Vhl-cKO), Bruch’s membrane thickening and metabolic changes in RPE (that induce lipid accumulation—dark gray circles) limit glucose delivery to photoreceptors. This results in photoreceptor atrophy. (B) The effects of pseudo hypoxia in Vhl mutants and real hypoxia in Vegfa mutants present in a similar sequence but at radically different rates. The progression rate is accelerated in Vhl-cKOs since HIFs are dominant-stable. Changes in choriocapillaris density induce graded hypoxia in the Vegfa-cKO line, making it more physiologically relevant.
Author response image 1
Download links
A two-part list of links to download the article, or parts of the article, in various formats.
Downloads (link to download the article as PDF)
Open citations (links to open the citations from this article in various online reference manager services)
Cite this article (links to download the citations from this article in formats compatible with various reference manager tools)
Hypoxia-induced metabolic stress in retinal pigment epithelial cells is sufficient to induce photoreceptor degeneration
eLife 5:e14319.
https://doi.org/10.7554/eLife.14319


