TP53 drives invasion through expression of its Δ133p53β variant
- CNRS, Centre de Recherche de Biologie cellulaire de Montpellier, France
- Université Montpellier, France
- University of Dundee, Ninewells Hospital and Medical School, United Kingdom
- CNRS, Institut de Génétique Moléculaire de Montpellier, France
- IRB, Institut de Recherche en Biothérapie, France
- MD Anderson Cancer Centre, United States
Figures
Figure 1 with 2 supplements
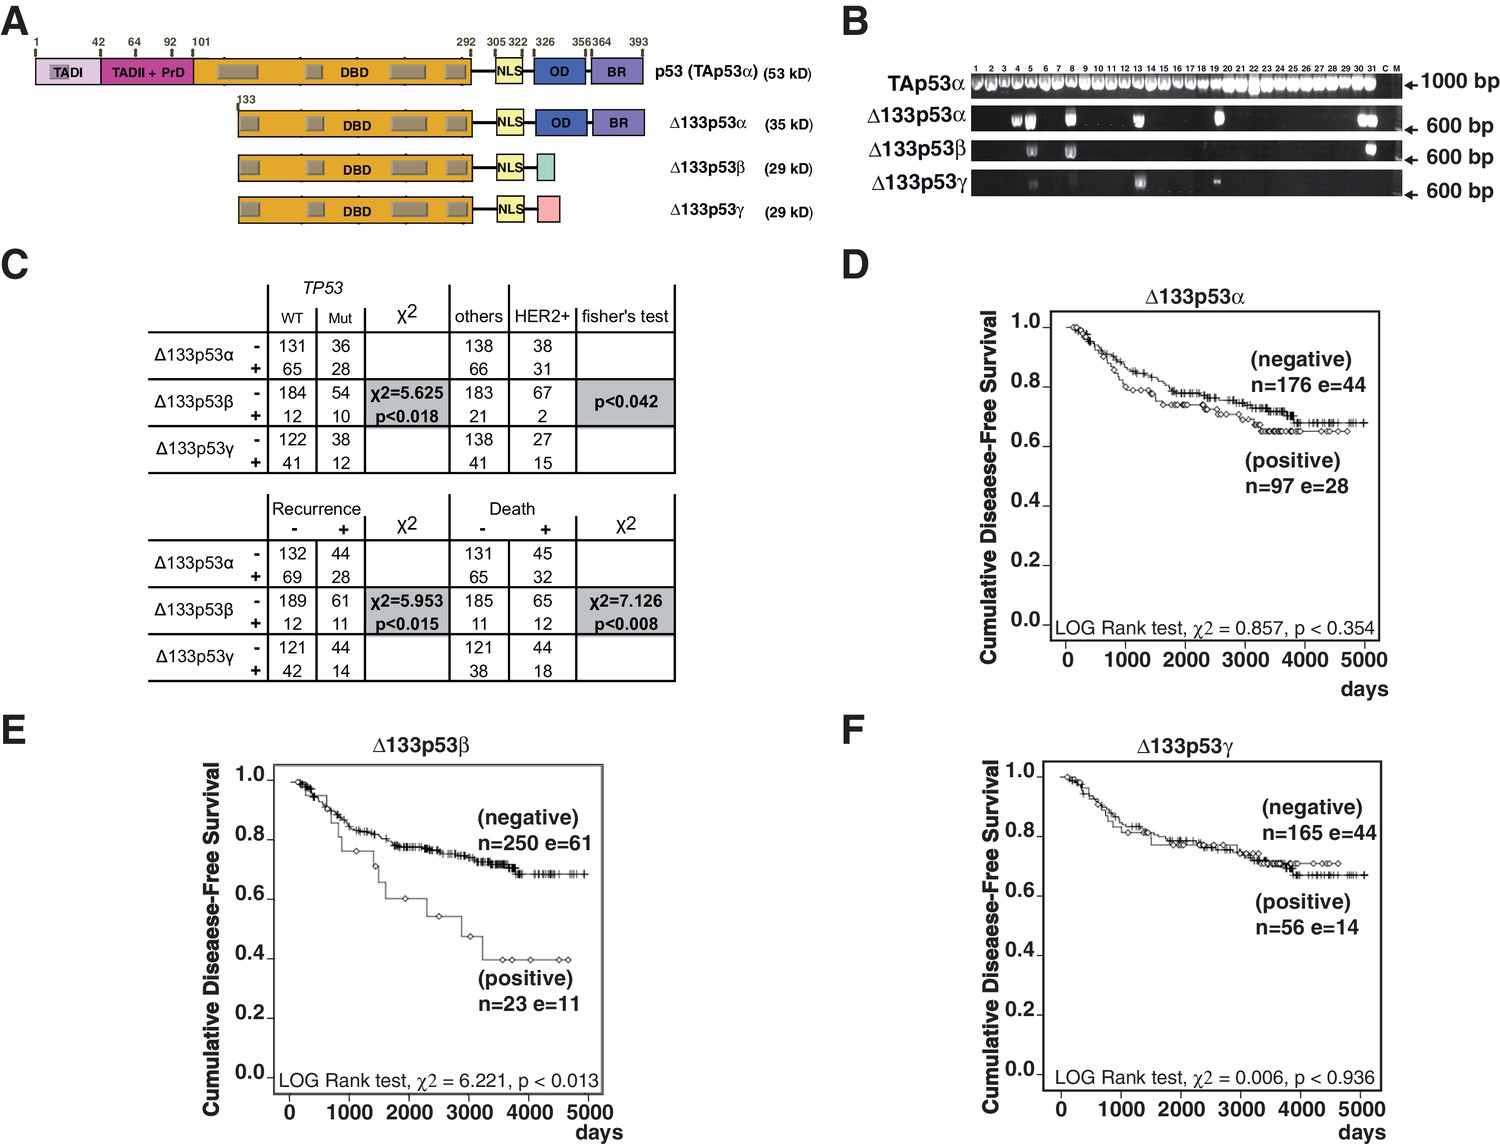
Breast cancer patients expressing Δ133p53β have a poor clinical outcome.
(A) Schematic representation of human TAp53α, Δ133p53α, Δ133p53β and Δ133p53γ protein isoforms. The two transactivation domains [TADI (in light purple) and TADII (in pink)] the Proline-rich Domain (PrD), the DNA-Binding Domain (DBD in orange), and the C-terminal domain comprised of the nuclear localization signal (NLS; in yellow), the oligomerization domain (OD; in blue), and the basic region (BR; in violet) are represented. The grey boxes correspond to the five highly conserved regions defining the p53 protein family. The amino-acid positions defining the different p53 domains are indicated. The C-terminal domains of p53β (DQTSFQKENC) and p53γ (MLLDLRWCYFLINSS) are indicated by green and pink respectively. The molecular weight (kD) of each p53 isoform protein is indicated. (B) Specific nested RT-PCR amplification of Δ133p53α, Δ133p53β and Δ133p53γ. Total RNAs from 273 primary breast tumors were provided by the Tayside tissue bank. The quality of RNA and the quality of reverse-transcription were assessed as described in Materials and methods section. All samples with low RNA quality and low quality of reverse transcription were discarded to minimize the number of false negative. Each different p53 cDNAs were specifically amplified by 2 successive nested RT-PCR (35 cycles each) using 2 sets of the primer specific of each of the following p53 mRNA variants: p53(all isoforms), Δ133p53α, Δ133p53β and Δ133p53γ. The nested RT-PCR analysis was performed as described in the Materials and methods section and the extended experimental procedures. Primer sequences are provided in Table 1 . A representative subset of the nested RT-PCR analysis is shown. Tumor sample numbers are indicated. C: negative control, M: Molecular Markers. (C) ∆133p53β association with TP53 gene mutation status, HER2 and clinical outcome in breast cancer patients. ∆133p53β expression is associated with p53 mutation but is not frequently expressed in HER2 positive tumors as determined by univariate analysis (upper table). ∆133p53β expression is associated with cancer progression and death in breast cancer by univariate analysis. (Lower table) (D–F) Only ∆133p53β is associated with cancer progression in breast cancer patients. Non-parametric Kaplan-Meier plots of disease-free survival in relation to Δ133p53α (D), Δ133p53β (E), Δ133p53γ (F) expression (n = 273). ‘I’ indicates censored cases on the curves. p-value is based on Kaplan-Meier log-rank analyses.
Figure 1—figure supplement 1
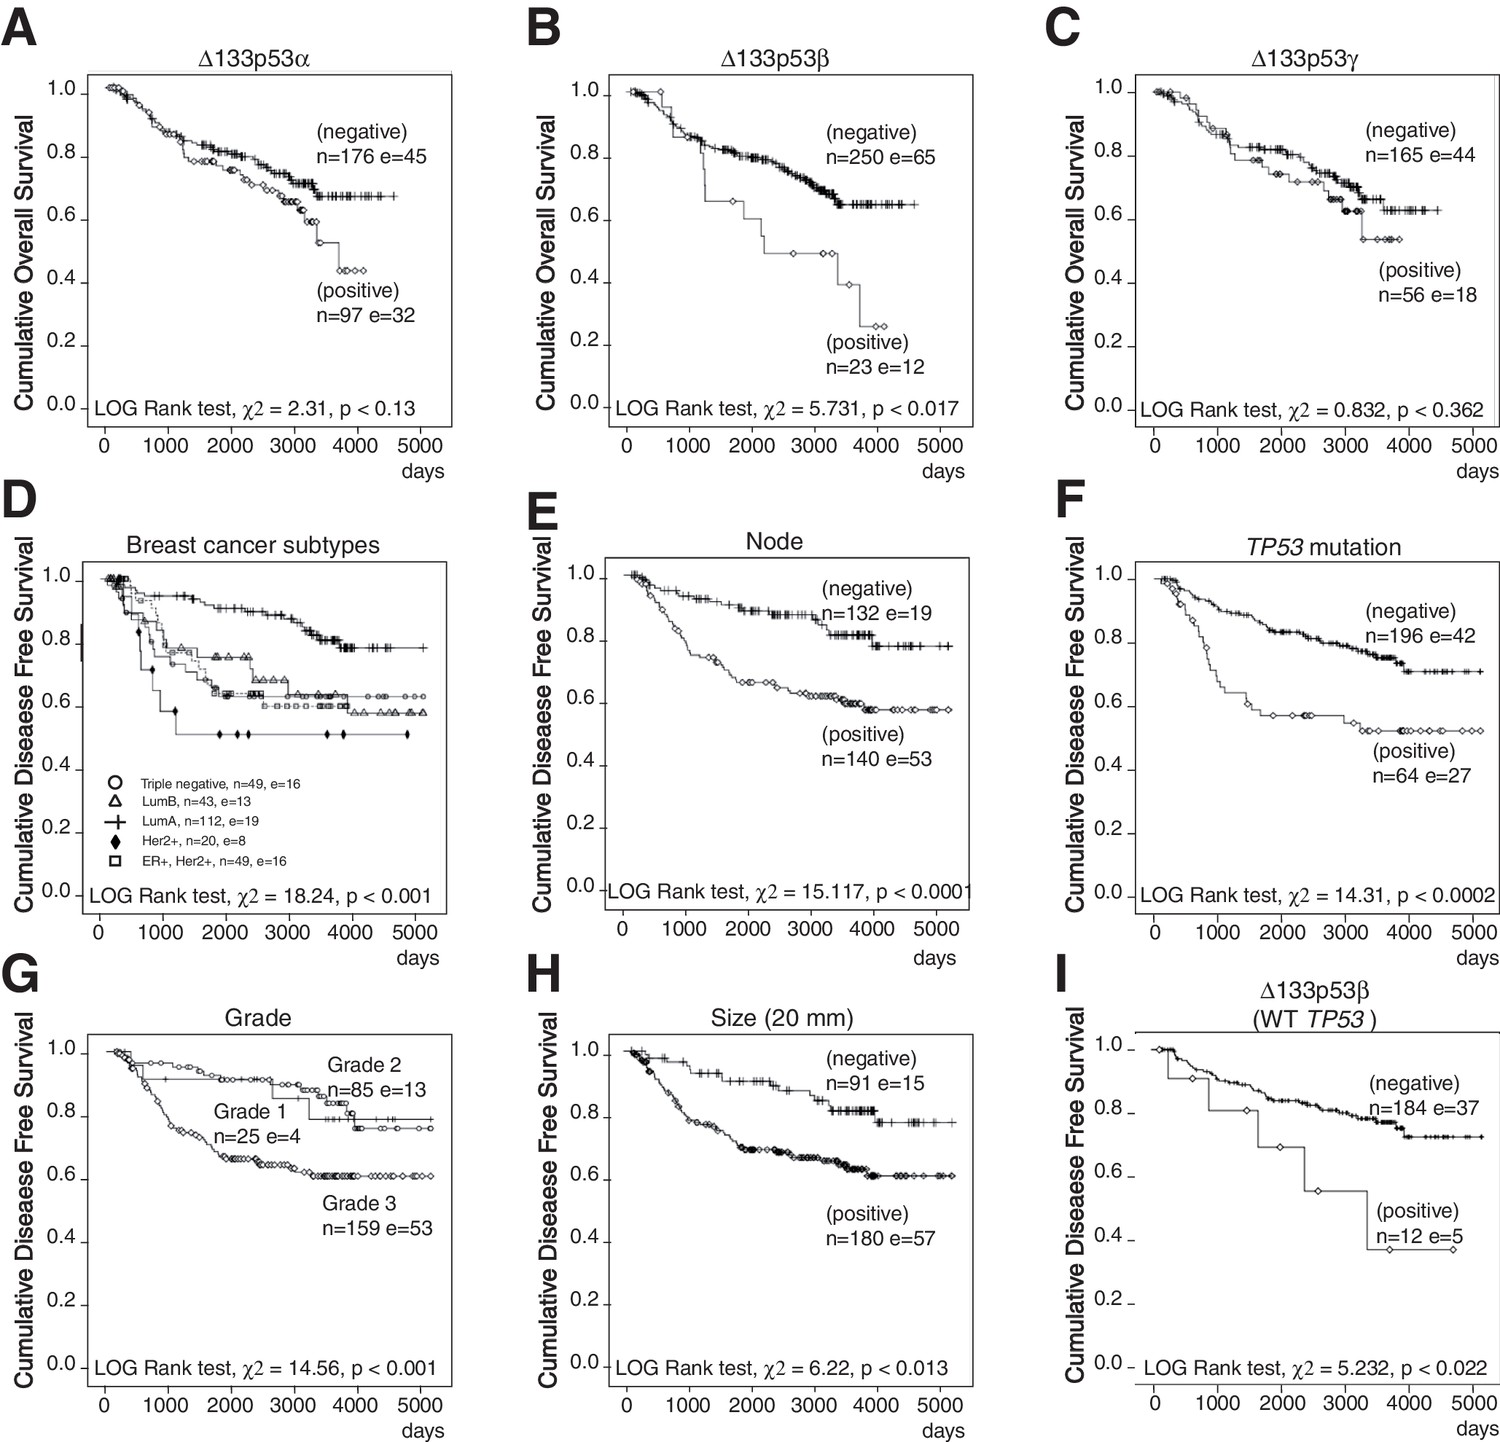
Non-parametric Kaplan-Meier plots analysis of marker association with disease-free survival and overall survival in the entire cohort of primary breast cancers (related to Figure 1).
Overall survival in relation to ∆133p53α (A), ∆133p53β (B) and ∆133p53γ (C). Disease-free survival in relation to breast cancer subtypes (D), invaded node (>0; E), TP53 mutation (F), Grade (G), tumor size (H). Association of ∆133p53β expression with disease-free survival of WT TP53breast cancer patients (no discrimination by subtype) (I). The Log-rank analysis and p values are indicated.
Figure 1—figure supplement 2
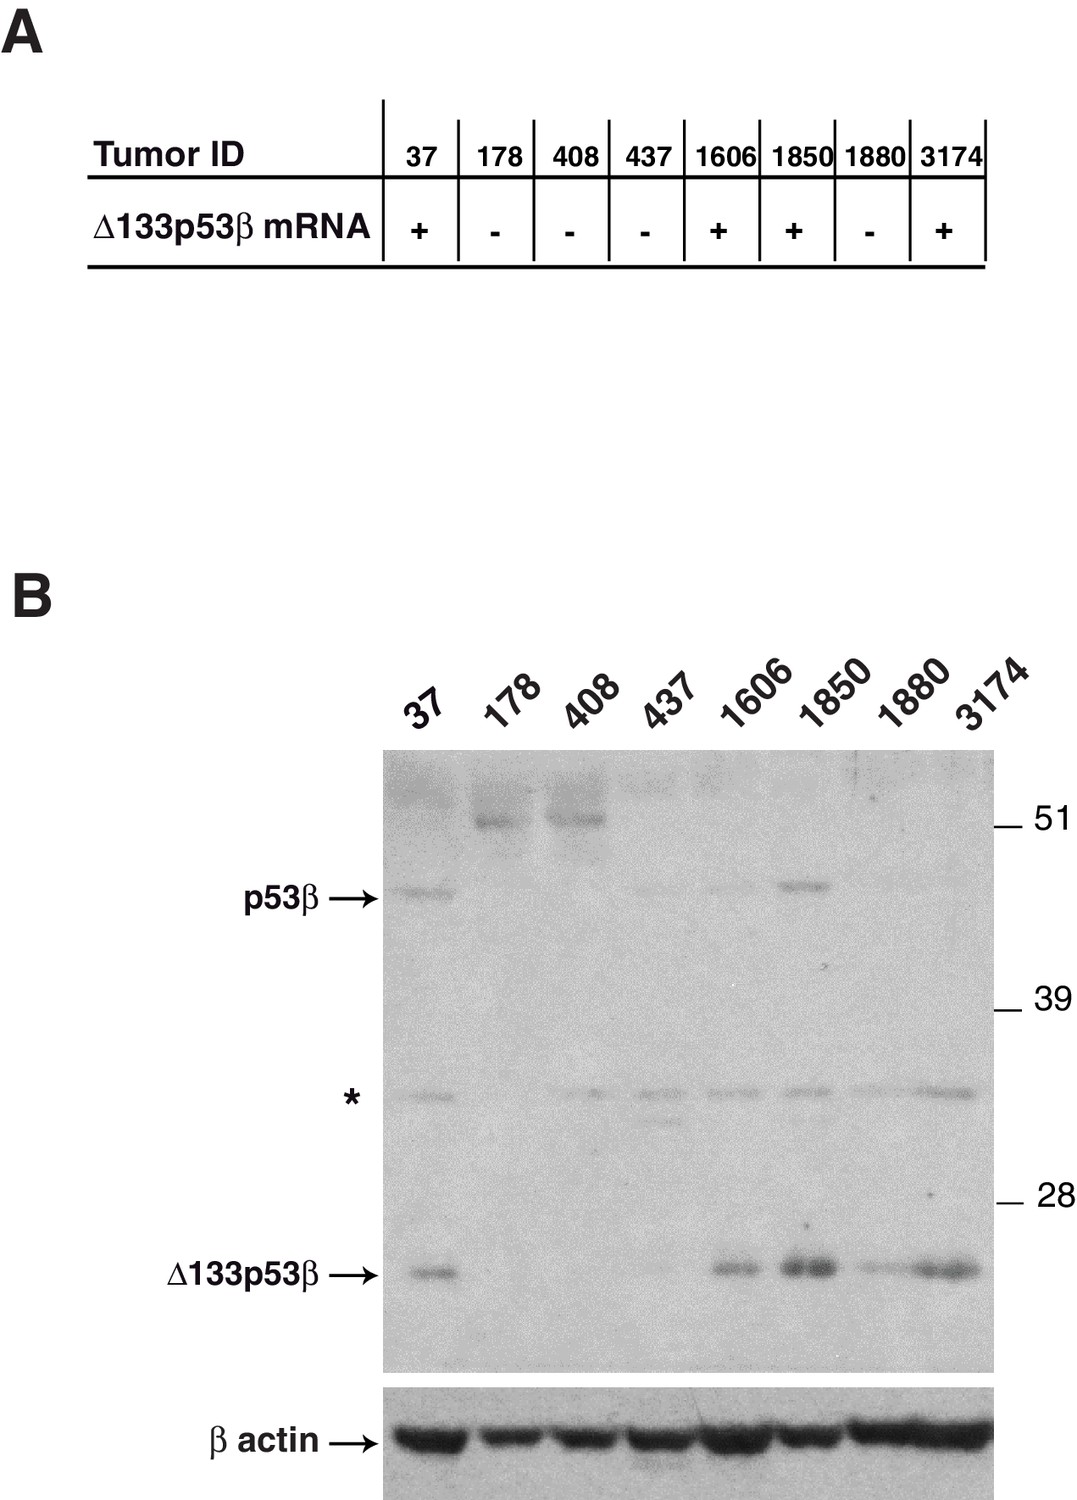
Detection of endogenous beta p53 protein isoforms in breast tumors(related to Figure 1).
The expression of Δ133p53β mRNA was determined by nested RT-PCR in the indicated breast tumors (A). The expression of endogenous beta p53 protein isoforms (20 ug/well) was analyzed by western blotting using KJC8, a β-specific p53 antibody (B). Actin was used as a loading control.
Figure 2
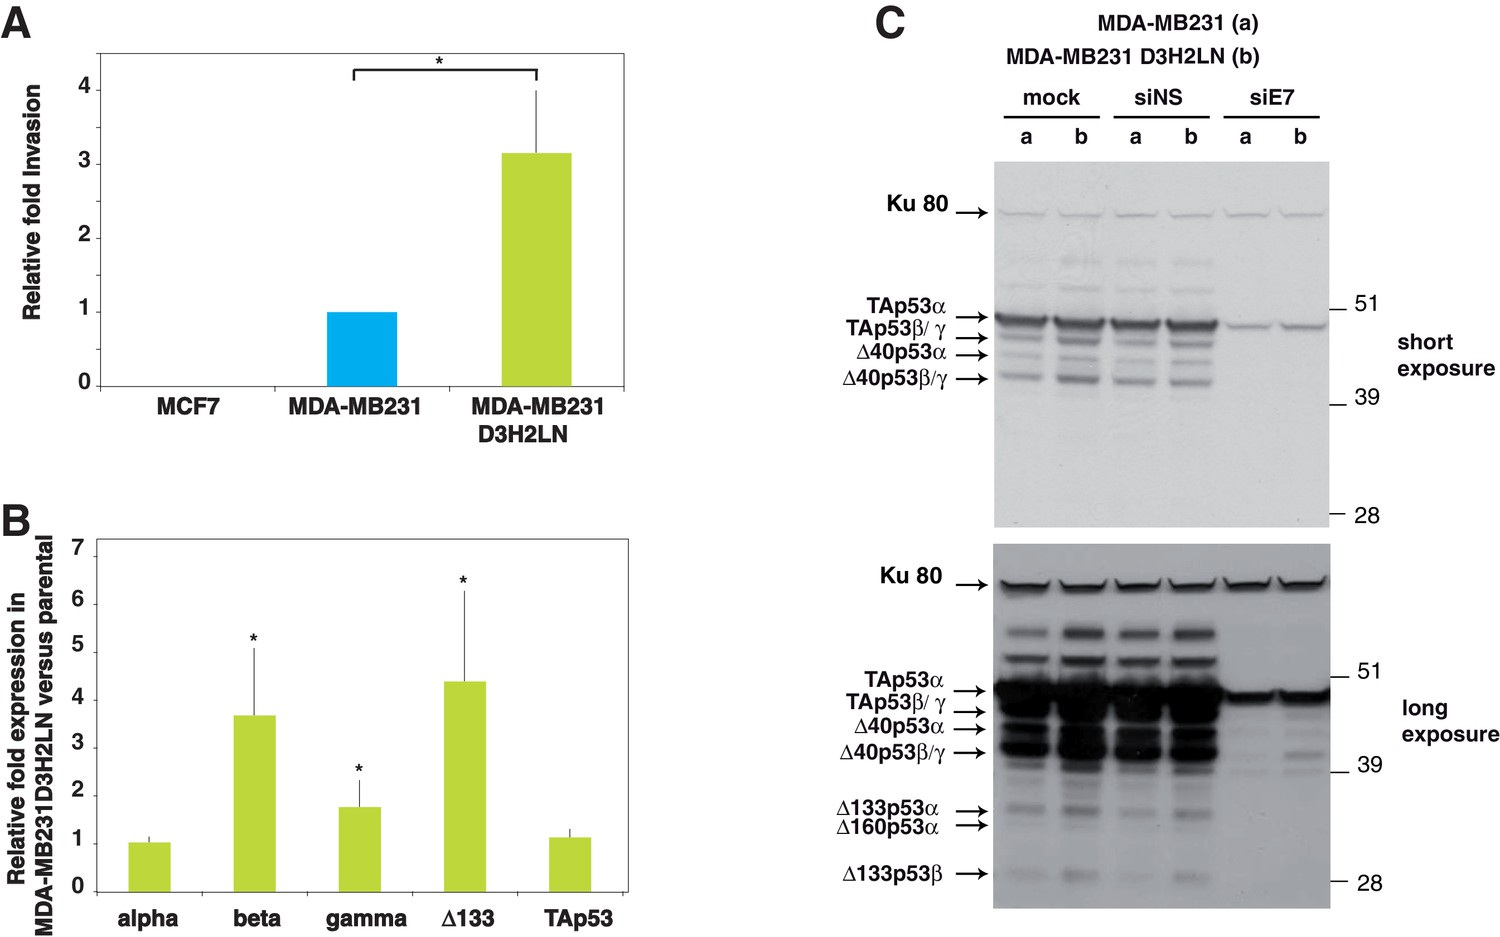
p53 isoform expression correlates with cell invasiveness in breast cancer cells.
(A) Invasion of breast cancer cell lines. MCF7, MDA-MB231 and MDA-MB231 D3H2LN cells were assayed for 24 hr and the changes in invasion were analyzed, as described in Materials and methods (Smith et al., 2008). Invading cells were counted as the number of invading cells at 50 μm divided by the number of non-invading cells at 0 µm. The results are expressed as the fold change ratio compared with MDA-MB231. Each assay was performed in triplicate for each cell line. The values plotted are means ± SEMs of N = 4 independent experiments; *p<0.05. (B) Comparative expression of p53 mRNA variants in MDA-MB231 D3H2LN versus parental MDA-MB231 cells. The expression level of p53 isoform mRNA is higher in the highly invasive MDA-MB231 D3H2LN cells than in MDA-MB231 cells. Sub-confluent proliferating breast cancer cells were harvested for quantitative RT-qPCR Taqman assays (see Materials and methods section). p53 isoform expression was quantified relative to the control MDA-MB231 cell line. For all RT-qPCR experiments, expression levels of p53 isoforms were normalized to TBP. Results are expressed as the fold change compared to MDA-MB231 cells and represent means ± SEMs of N = 4 independent experiments; *p<0.05. (C) Differential expression of endogenous p53 protein isoforms in MDA-MB231 and MDA-MB231 D3H2LN cells. The protein expression levels of p53 isoforms were analyzed by western blotting using the sheep polyclonal p53 pantropic antibody (Sapu). To identify p53 protein isoforms, cells were transfected either with p53 siRNA (siE7) targeting exon-7 common to all p53 mRNA variants or with control siRNA (siNS, non specific). Two exposures (short and long) are shown.
Figure 3 with 1 supplement
Δ133p53β isoform promotes invasion in breast cancer cells.
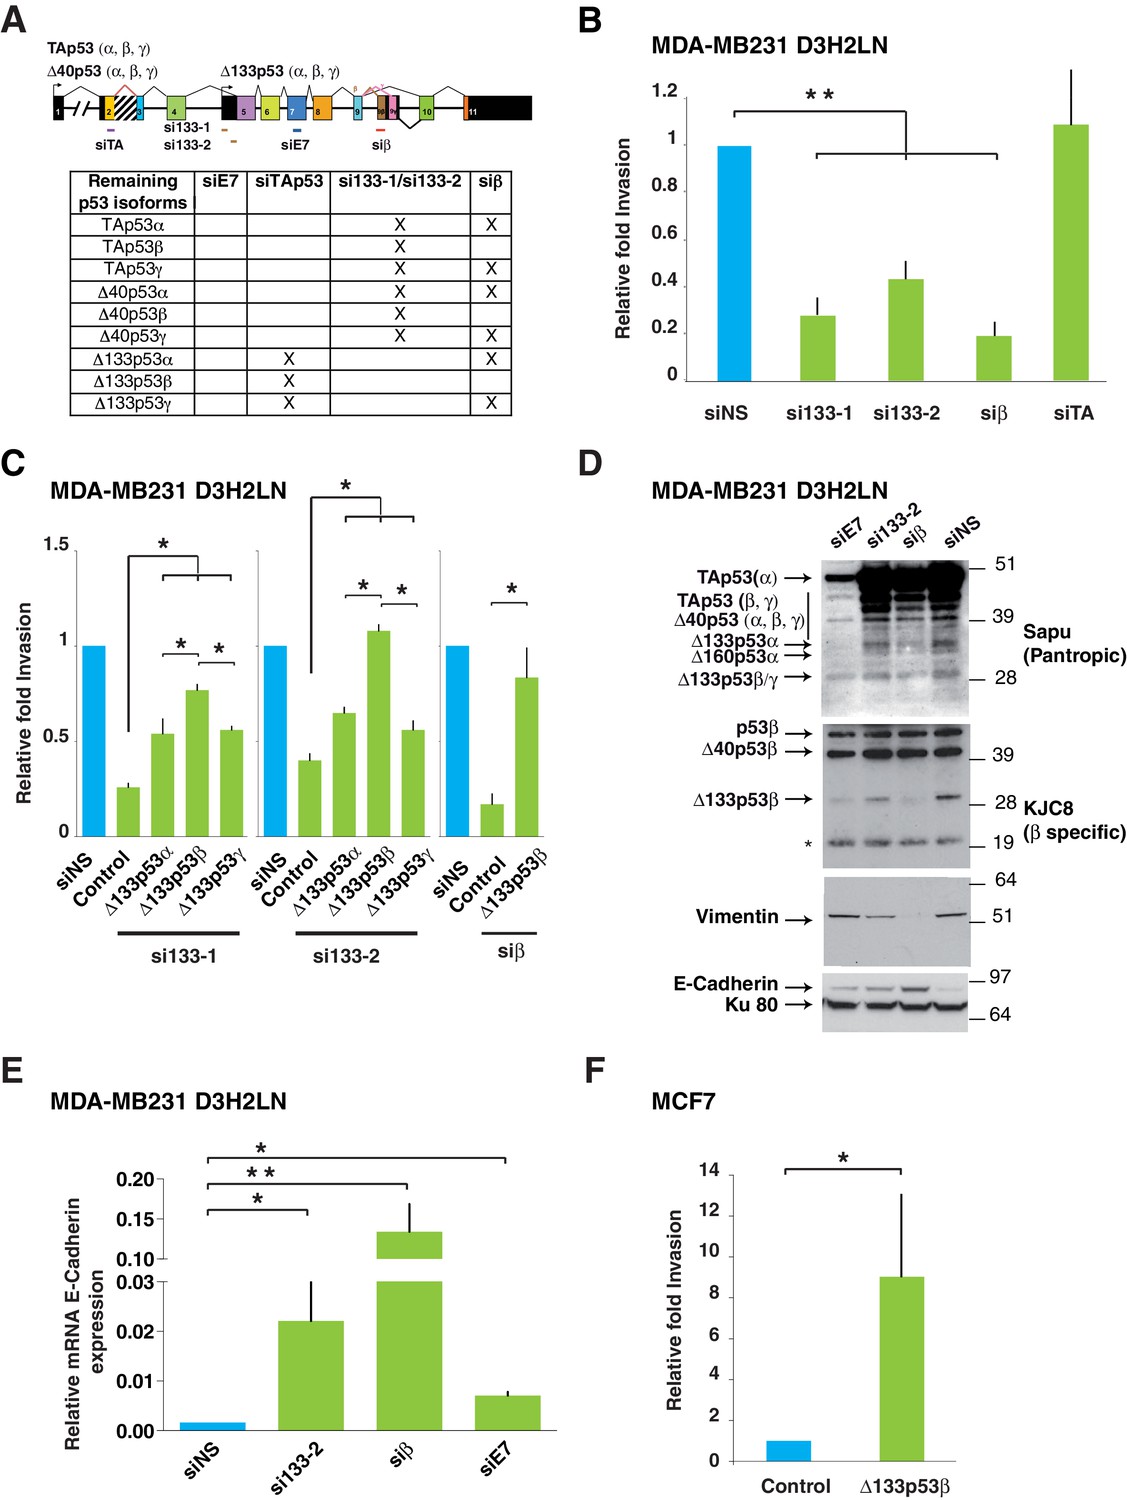
(A) RNA chart of the different isoforms of TP53 in this study showing the exons (boxes) and introns (horizontal lines, not to scale). Alternative promoters are shown as arrows and alternative splices are depicted with the lines above as they connect different exons. Location of the different siRNAs used is indicated below the chart. Below is a list of the p53 isoforms that remain after transfection of the different siRNAs, indicated by a cross. (B) Specific inhibition of some p53 isoforms expression decreases invasiveness. MDA-MB231 D3H2LN cells were transfected with si133-1 or si133-2, two distinct siRNAs specific for the 5’UTR of Δ133p53 mRNAs; or with siTAp53, a siRNA targeting TP53 exon-2 depleting all p53 isoforms except the Δ133p53 (α, β, γ) isoforms; or with siβ, a siRNA targeting the alternatively spliced exon-9β of TP53; or with siNS, a non-specific siRNA used as negative control. (C) ' Rescue' experiments. Re-introductions of si-133–resistant mutant Δ133p53α-R280K, Δ133p53β-R280K or Δ133p53γ-R280K restore the invasive activity in MDA-MB231 D3H2LN cells previously depleted of either Δ133p53 (α, β, γ) isoforms after transfection with si133-1 or si133-2, or β p53 isoforms (p53β, Δ40p53β and Δ133p53β) (n = 4). (D) Inhibition of endogenous p53 protein isoforms induces expression of epithelial features associated with decreased invasiveness. The expression of endogenous p53 protein isoforms after transfection of MDA-MB231 D3H2LN cells with si133-2, siβ, siE7 or control siRNA (siNS) was analyzed by western blotting using pantropic p53 isoforms antibody Sapu or KJC8, a β-specific p53 antibody recognizing p53β, Δ40p53β and Δ133p53β. The expression of two EMT markers (Vimentin and E-Cadherin) was determined in parallel. Ku80 was used as a loading control. * cross-reaction. (E) Quantification of E-Cadherin mRNA in MDA-MB231 D3H2LN cells transfected with siRNA si133-2, siβ, siE7 or siNS (control) used as a negative control. For all RT-qPCR experiments, expression levels were normalized to TBP. Results are expressed relative to TBP mRNA and represent means ± SEMs of N = 4 independent experiments; *p<0.05; **p<0.01 (F) WT ∆133p53β promotes cell invasion. Weakly invasive MCF7 cells were transfected with Δ133p53β expression vector or the empty expression vector (Control). Cells were challenged for their invasive potential after 48 hr. The values are plotted as means ± SEMs of at least 3 independent experiments; *p<0.05.
Figure 3—figure supplement 1
Δ133p53 (α, β and γ) expression in MCF7 breast cancer cells (related to Figure 3).
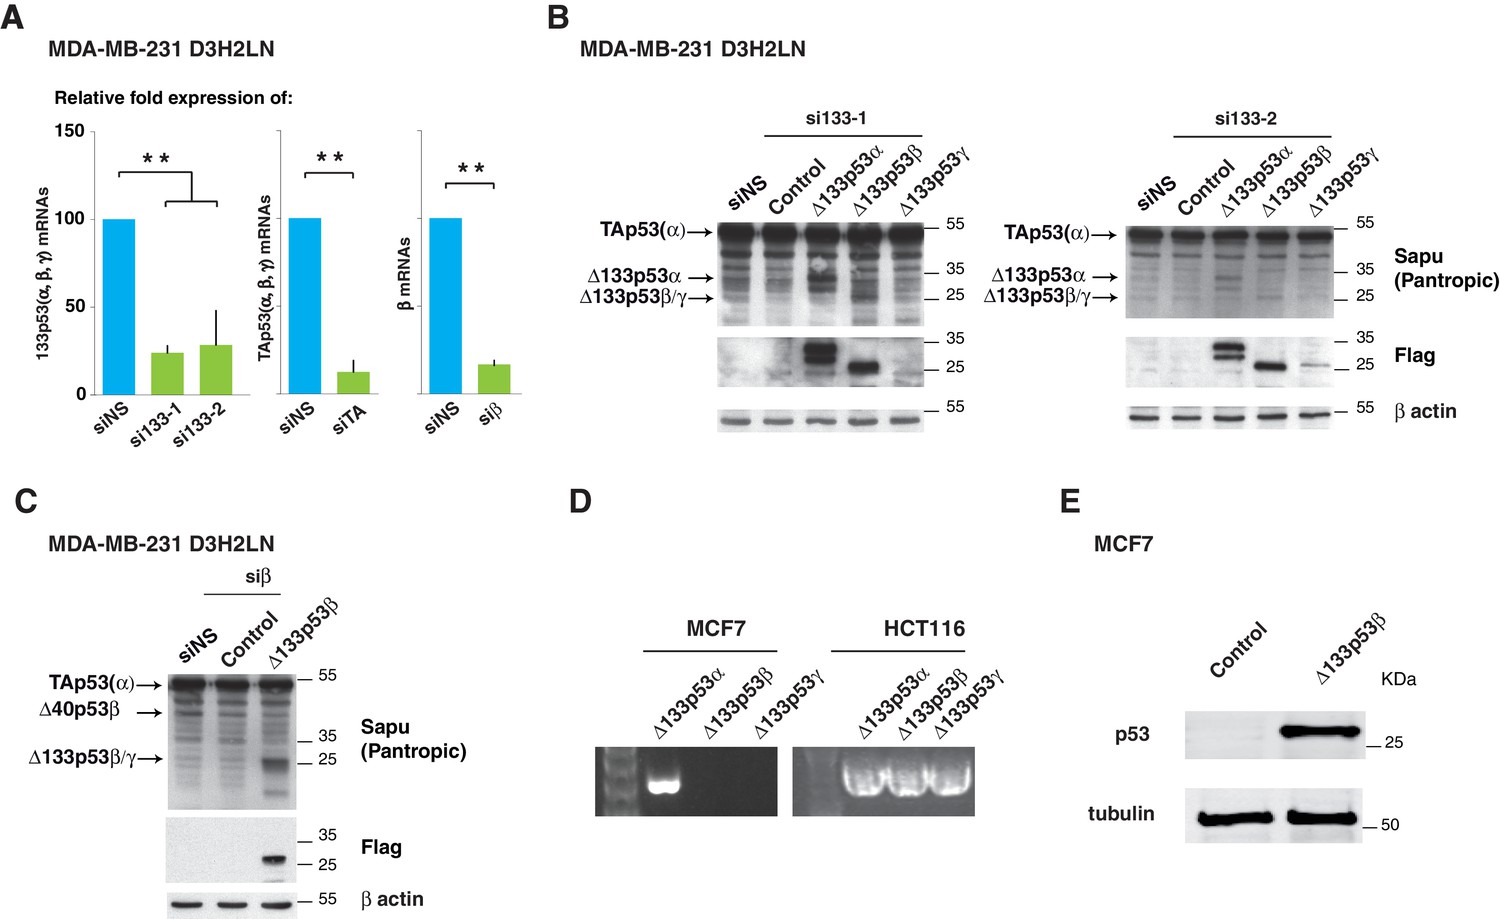
(A) Quantitative RT-qPCR (TaqMan) of Δ133p53 (α, β and γ), TAp53 (α, β and γ) or β mRNAs in MDA-MB231 D3H2LN cells transfected with non-specific siRNA (siNS), or p53 specific siRNA si133-1, si133-2, siTAp53 or siβ, respectively. For all RT-qPCR (TaqMan) experiments, expression levels were normalized to TBP. Results are expressed as relative expression to TBP mRNA and represent means ± SEMs of N = 4 independent experiments; **p<0.01. (B) Western blot of ectopically expressed Δ133p53α, Δ133p53β and Δ133p53γ in MDA MB231 D3H2LN breast cancer cells using Sapu p53 pantropic or anti-Flag antibodies after Δ133p53 depletion with si∆133–1 (left panel) or si∆133–2 (right panel). (C) Western blot withSapu p53 pantropic or anti-Flag antibodies of ectopically expressed Δ133p53β in MDA MB231 D3H2LN breast cancer cells previously depleted of all b p53 isoforms with siRNA siβ (D) Expression of ∆133p53 (α, β and γ) mRNA variants in MCF7 cells and in HCT116 cells. Expression was determined by nested RT-PCR (E) Western blot of ectopically expressed Δ133p53β in MCF7 breast cancer cells using Sapu antibody.
Figure 4 with 1 supplement
Δ133p53 isoforms promote invasion in colorectal cancer cells.
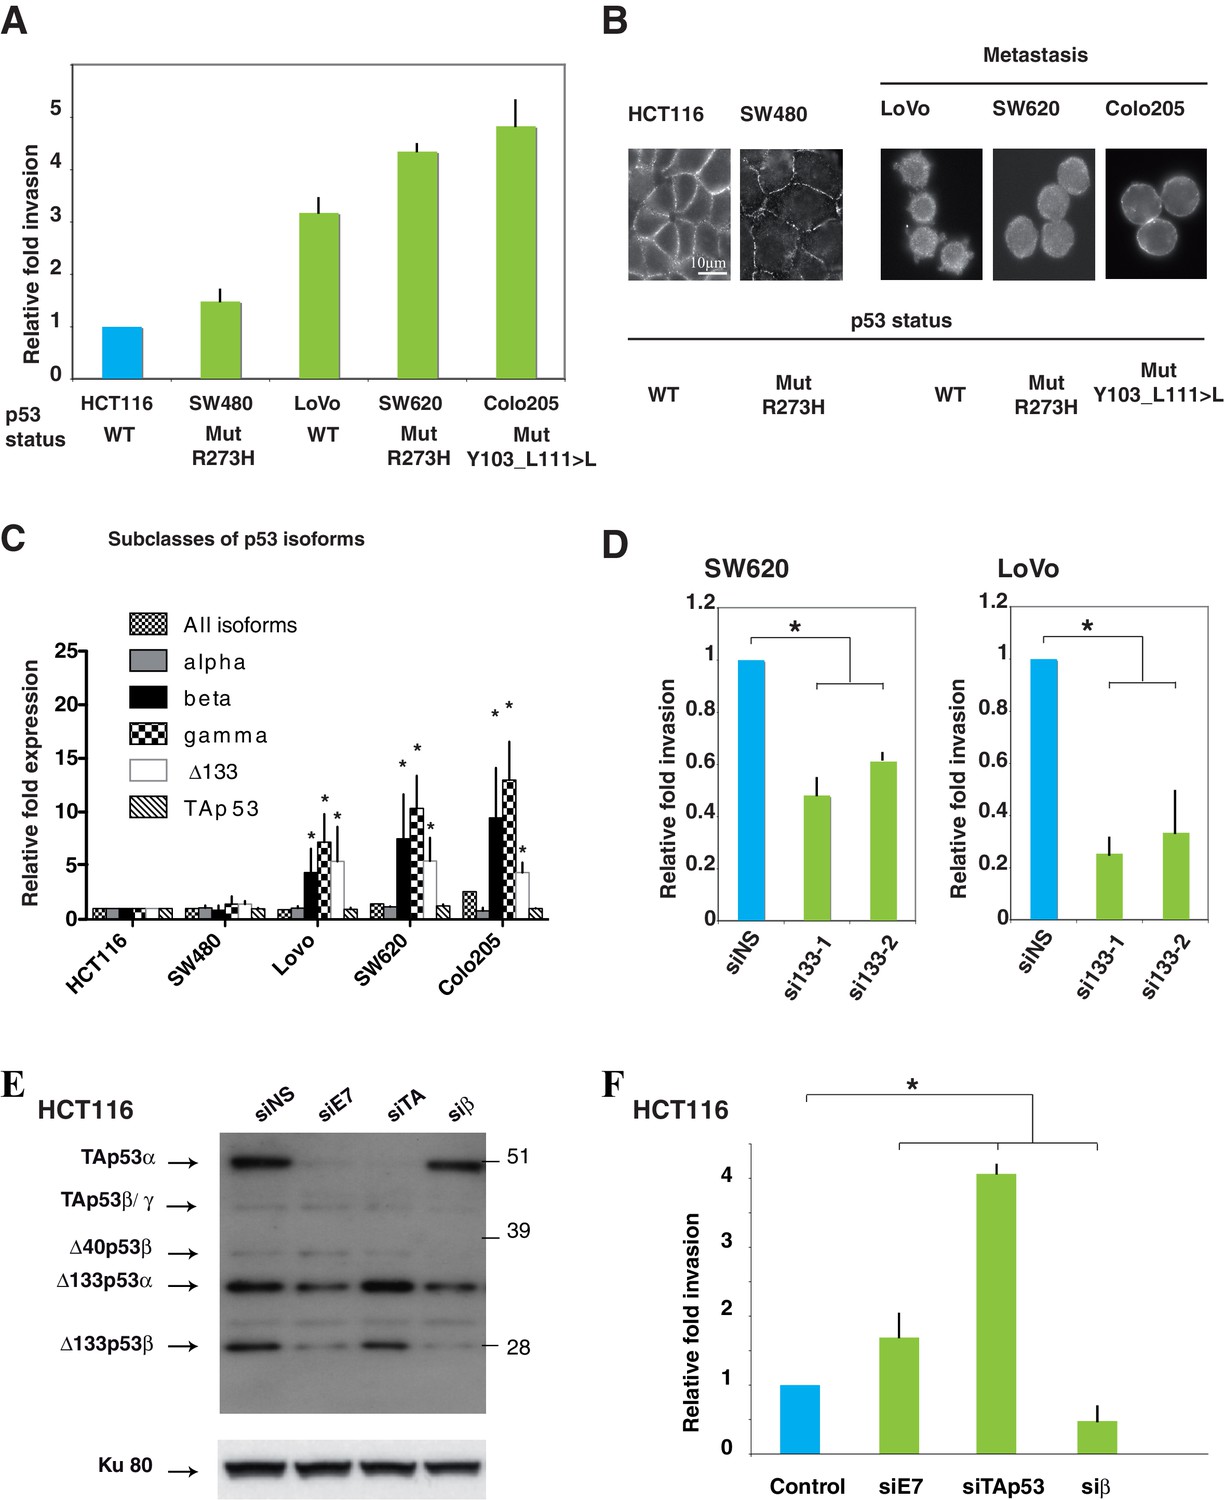
(A) Invasiveness of different colorectal cancer cells. Cells were assayed for invasiveness through Matrigel over 24 hr, as described in Materials and methods. Invading cells were counted and the results are expressed as the average of 6 different fields and normalized to HCT116 cells. Each assay was performed in triplicate for each cell line. TP53 mutation status is indicated. The values plotted are means ± SEMs of N = 4 independent experiments. (B) Immunofluorescence staining for E-Cadherin in a panel of colorectal cell lines. The images show representative E-Cadherin immunostaining for each colorectal cell line plated at low density. Scale bar: 10 µm. (C) Quantitative RT-qPCR (TaqMan) of different subclasses of p53 isoform mRNA in a panel of colorectal cell lines. Sub-confluent proliferating colorectal cells were harvested for quantitative RT-PCR assays (see Materials and methods section). For each cell line, results are expressed as the fold change compared to HCT116 cells. For all RT-qPCR experiments, expression levels of sub-types of p53 mRNA variants were normalized to TBP mRNA and represent means ± SEMs of N = 3 independent experiments; *p<0.05. (D) Invasion of SW620 (left) or LoVo (right) colon cancer cell lines after depletion of Δ133p53 (α, β, γ) isoforms. Cells transfected with Δ133 siRNAs (si133-1 and si133-2) or siNS were examined for their invasive potential after 24 hr. Invading cells were counted and the results are expressed as the average of 6 different fields and normalized to siNS. The values are plotted as means ± SEMs of 3 independent experiments; *p<0.05. (E) Western-blot analysis of endogenous p53 protein isoforms in HCT116 cells transfected with the non-specific siRNA (siNS) or with p53 isoform specific siRNA siE7, siTAp53, or siβ. Cells were then assessed for their invasive potential as in Figure 4F. (F) HCT116 cells transfected with siE7, siTAp53, siβ, or siNS were assessed for their invasive potential. Invading cells were counted and the results are expressed as the average of 6 different fields.
Figure 4—figure supplement 1
Δ133p53 (α, β and γ) expression and effect on cell invasion using colorectal cancer cells.
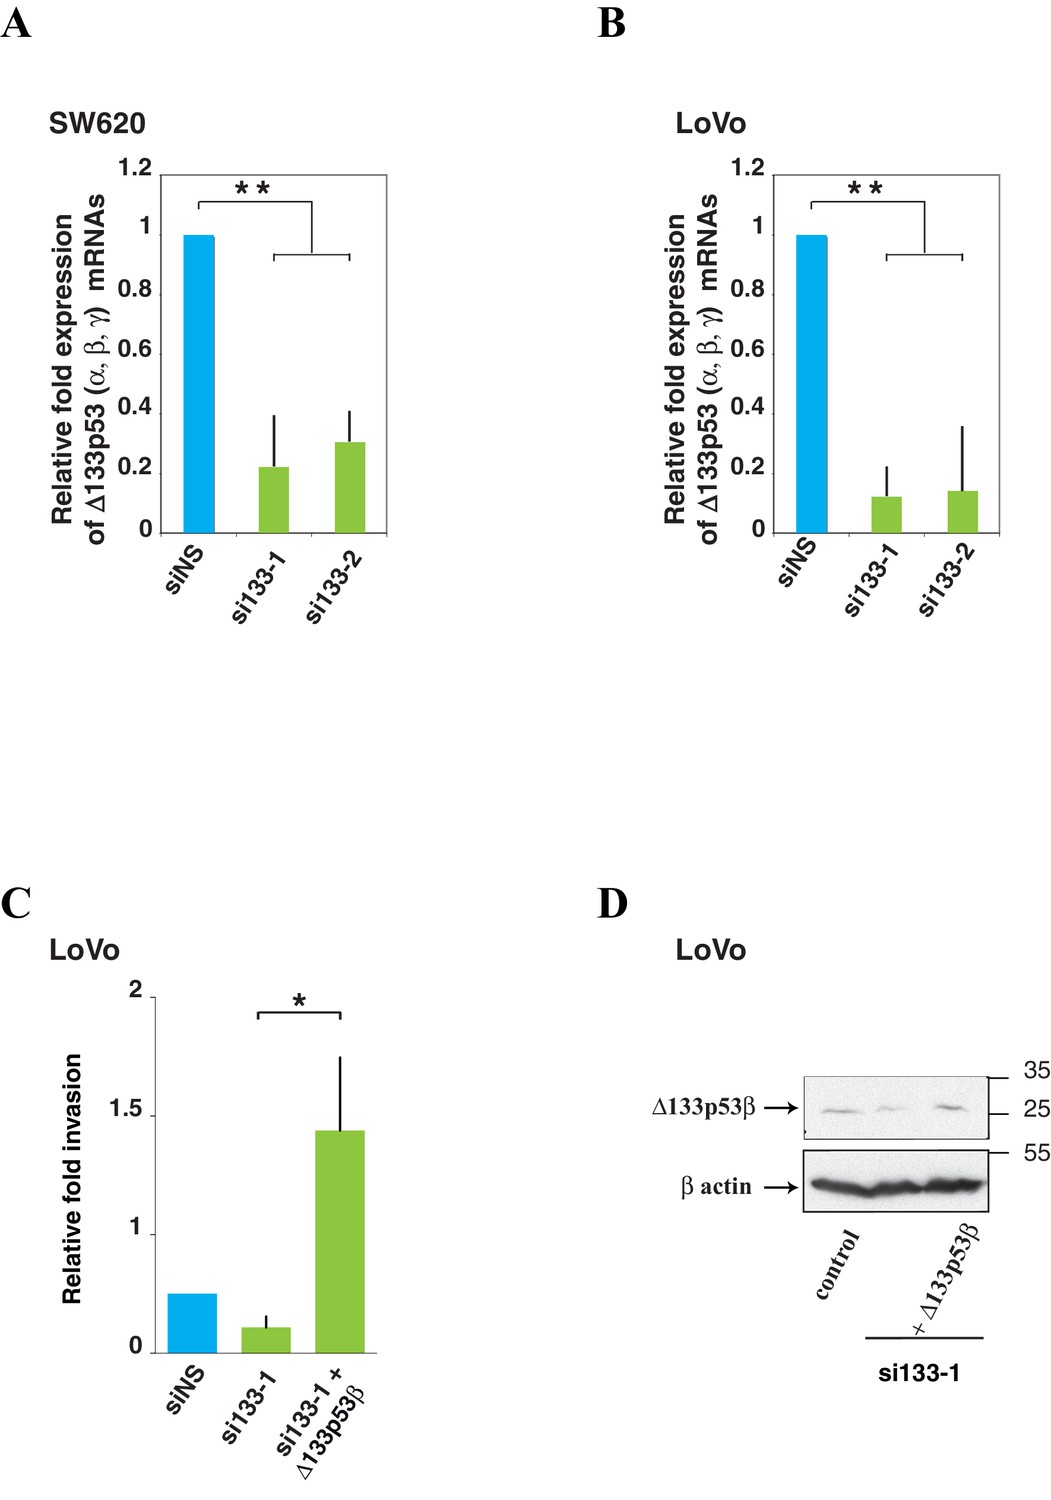
A and B Quantitative RT-PCR (Taqman) of all Δ133p53 (α, β and γ) mRNA in SW620 (A) or LoVo (B) cells transfected with siRNA si133-1, si133-2 or siNS(as negative control).(related to Figure 4). For all RT-qPCR experiments, mRNA expression levels were normalized to TBP mRNA. Results are expressed as relative expression to TBP mRNA and represent means ± SEMs of N = 4 independent experiments; **p<0.01. (C) Re-introduction of si133-resistant WT Δ133p53β isoform restores invasiveness of LoVo colon cancer cells previously depleted of all Δ133p53 (α, β, γ) isoforms with si133-1 (n = 4). (D) Western blot of ectopically expressed Δ133p53β in LoVo cells using KJC8 antibody after Δ133p53 depletion with si∆133–1.
Figure 5 with 1 supplement
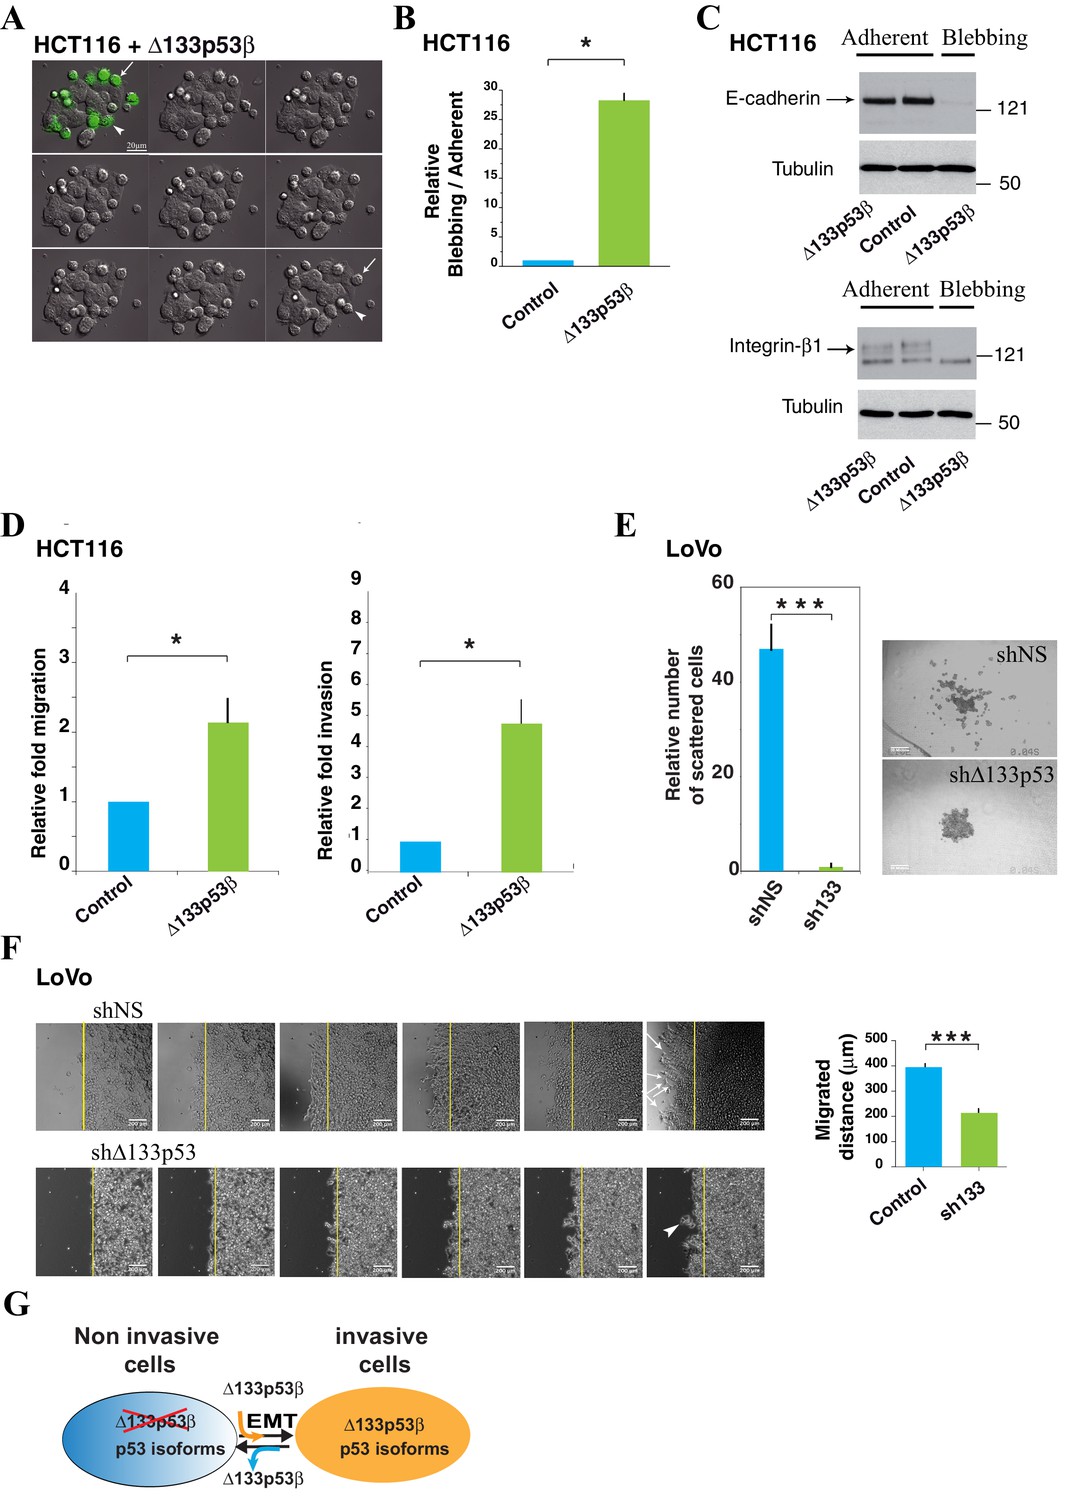
HCT116 cells expressing the Δ133p53β isoform display amoeboid-like movements.
(A) Still time-lapse images of the accompanying video (Supplementary data, video1) of HCT116 cells transfected with the GFP-tagged Δ133p53β isoform. Cells were observed 48 hr after transfection. For the video, images were captured every 4 min during 12 hr. The panel represents 1/10 images i.e. one image every 40 min. Δ133p53β-transfected cells can be distinguished from non-transfected cells through expression of GFP (green). The Δ133p53β-transfected cells are rounded and exhibit blebbing movements on their surface. The arrow shows a cell that detaches from the others and from the dish during the time-lapse. The arrowhead shows a cell that still adheres to the other epithelial cells and to the substratum at the beginning of the experiment and then becomes progressively rounded. (B) Quantitative analysis of blebbing versus adherent cell number in the Myc positive cells. FACS analysis of the percentage of non-apoptotic blebbing Myc-positive HCT116 cells compared to total Myc-positive transfected with cells upon transfection of Myc-Δ133p53β, or Myc-empty expression vector (vector). Results were normalized to Myc-empty vector transfected cells. (C) Western blot analysis of the expression of E-Cadherin and β1-integrin in HCT116 cells expressing the GFP-tagged Δ133p53β isoform; Control: GFP-tag vector. Adherent: cells still adherent to the substratum; Blebbing: cells detached from the substratum and showing blebbing movements. Loading normalization was performed using an anti-α-tubulin antibody. (D) Δ133p53β-transfected HCT116 cells were quantified for their migration ability after 2 hr of migration through the Boyden chamber or for their invasiveness after 24 hr of the invasion through Matrigel, as indicated. The values are plotted as means ± SEMs of at least 3 independent experiments. (E) 3-D LoVo cell scattering. The numbers of scattered cells were quantified using Metamorph software (left). Cells were judged as « scattered » when individual cells or clusters of cells had lost contact with the main colony, as visualized (right). Values (means ± SEMs) were calculated from 4 independent experiments (n = 48) ***p<0.001. (F) Wound healing assay in LoVo cells infected with shRNA non relevant (shNS: shLuciferase) or sh∆133p53. Cells were observed 25 hr after infection. Still time-lapse images of the accompanying videos (Supplementary data, Videos 2 and 3) For the videos, images were captured every 1 hr during 25 hr. The arrows show cells detaching from the others and migrating as individual cells. The arrowhead shows a cluster of cells which leaves the cohesive epithelium and which collectively migrate and enter into the gap. (G) Schematic representation of the role for ∆133p53β in reprogramming cells toward the invasive process. For WT or mutant TP53 cells devoid of ∆133p53b expression, introduction of ∆133p53β promotes EMT and invasion. Reciprocally WT or mutant TP53 cells expressing ∆133p53β have enhanced invasive activity. Depletion of ∆133p53β reverts EMT and inhibits invasion.
Figure 5—figure supplement 1
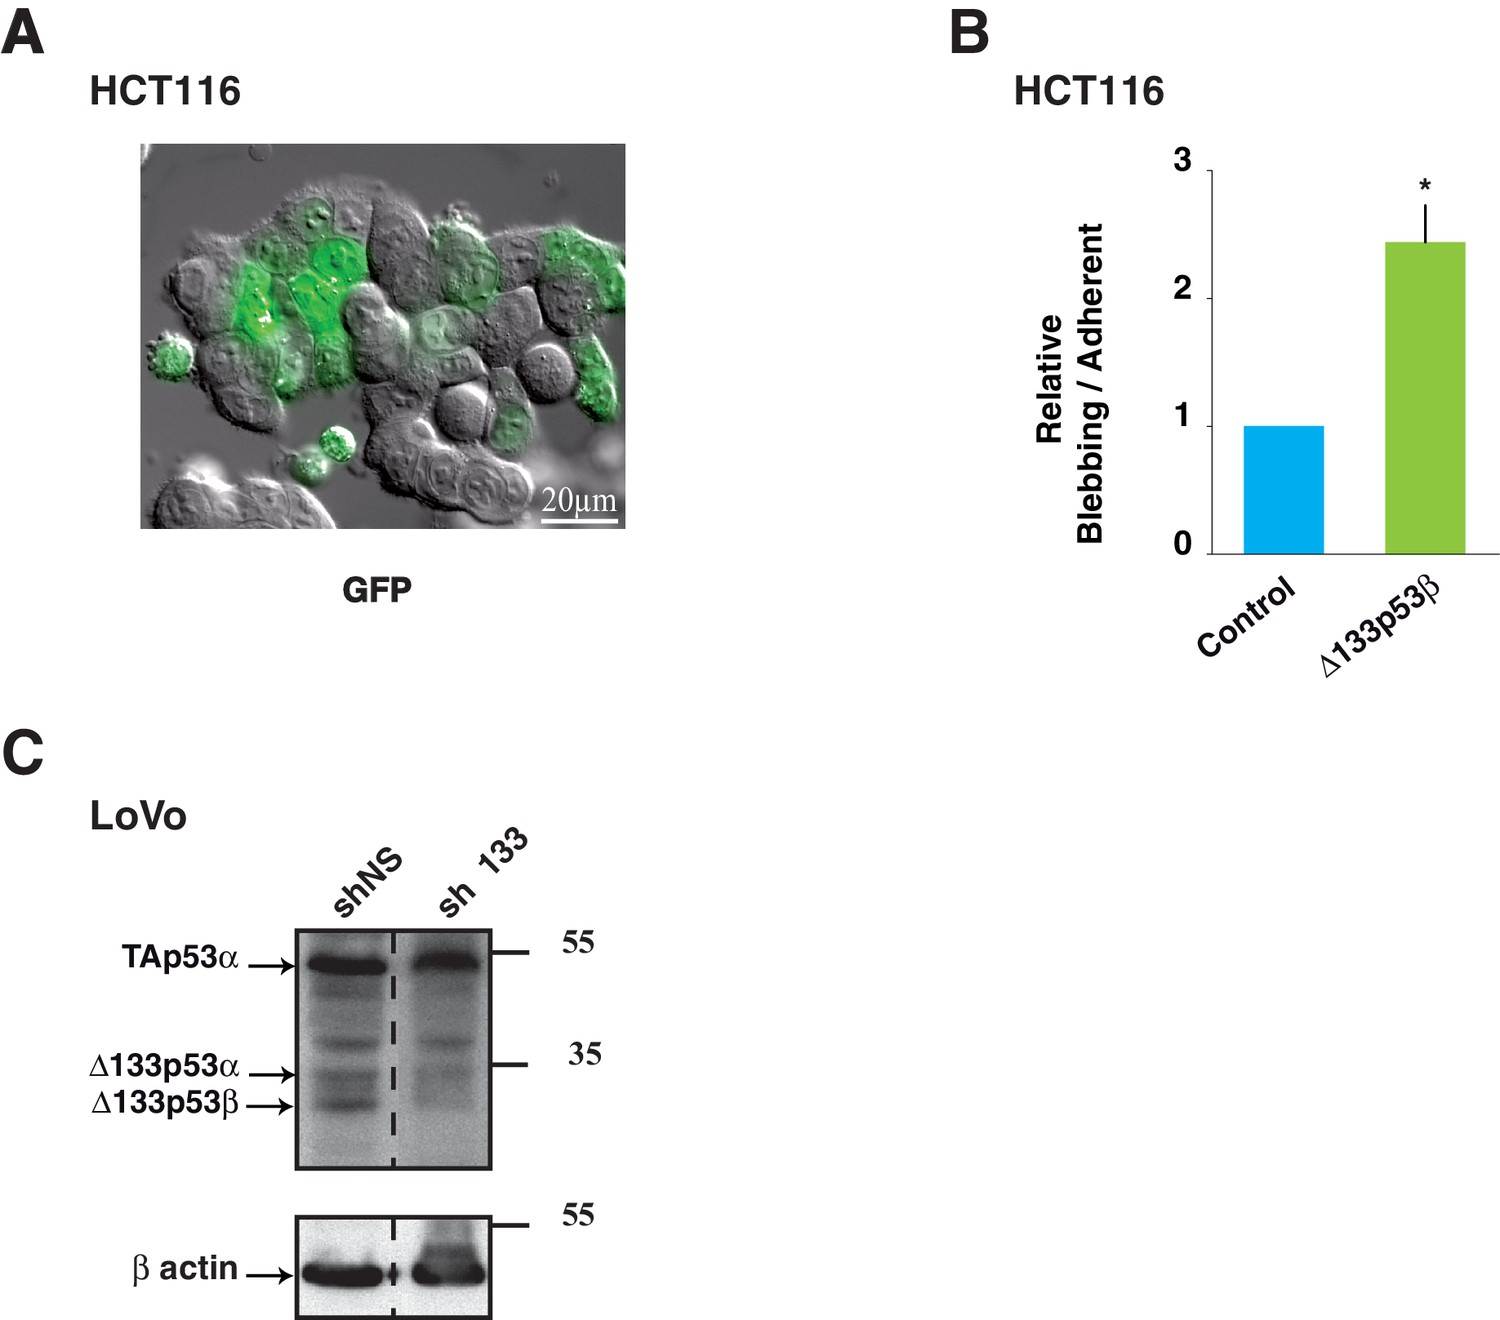
Control experiments of Δ133p53β expression and effects in colon cancer cells.
(A) Image of HCT116 cells transfected with GFP-empty vector as control. Cells were treated as in Figure 5A. (B) (related to Figure 5A): Quantitative analysis of blebbing- versus adherent-cell number in the GFP positive cells as in Figure 5A and Figure 5—figure supplement 1A. FACS analysis of the percentage of non-apoptotic blebbing GFP-positive HCT116 cells compared to total GFP-positive transfected cells after transfection of GFP-Δ133p53β or GFP-empty expression vector. Results were normalized to GFP-empty vector transfected cells. (C) (related to Figure 5G): Western-blot of p53 protein isoforms with the p53 pantropic antibody Sapu in LoVo cells infected with shRNA non relevant (shNS: shLuciferase), sh∆133p53 and used for 3-D cell scattering. Actin was used as a loading control.
Videos
Video 1
(related to Figure 5A): DIC light microscopy of HCT116 cells expressing GFP-Δ133p53β.
https://doi.org/10.7554/eLife.14734.016
Video 2
(related to Figure 5—figure supplement 1F, upper panels).
https://doi.org/10.7554/eLife.14734.019
Video 3
(Related to Figure 5—figure supplement 1F, lower panels): DIC light microscopy of Wound healing assay in LoVo cells infected with shRNA non relevant (shNS: shLuciferase; Video 2) or sh∆133p53 (Video 3).
Cells were observed 25 hr after infection. Images were captured every 1 hr during 25 hr.
Tables
Table 1
Primers for specific amplification of Δ133p53 isoforms mRNAs by nested RT-PCR. The specific region (exon or intron) that each of the primers target is indicated (Ex: exon; Int: intron), the sequences corresponding to the exon junction are underlined. (F): Forward, (R): Reverse. PCR fragment sizes (bp) corresponding to p53 isoforms are also highlighted. Quality of reverse-transcription is assessed by quantitative RT-PCR amplification (SybrGreen) of actin and p53 mRNAs (primers are included)
| p53 mRNA variant | PCR | Primer name and targeted region | 5’ – 3’ sequence |
|---|---|---|---|
| All p53 mRNA | For6 (F) (Ex6) | TTGCGTGTGGAGTATTTGGAT | |
| Rev7 (R) (Ex7) | TGTAGTGGATGGTGGTACAGTCAGA | ||
| Δ133p53α | 1st | D133F1 (F) (Int4) | TAGACGCCAACTCTCTCTAG |
| Rev10 (R) (Ex10) | CTT CCC AGC CTG GGC ATC CTT G | ||
| 2nd (670bp) | D133F2 (F) (Int4) | ACT CTG TCT CCT TCC TCT TCC TAC AG | |
| RDNp53 (R) (Ex9/Ex10) | CTC ACG CCC ACG GAT CTG A | ||
| Δ133p53β | 1st | D133F1 (F) (Int4) | TAGACGCCAACTCTCTCTAG |
| Rev10 (R) (Ex10) | CTT CCC AGC CTG GGC ATC CTT G | ||
| 2nd (700bp) | D133F2 (F) (Int4) | ACT CTG TCT CCT TCC TCT TCC TAC AG | |
| p53β (R) (Ex9β) | TCA TAG AAC CAT TTT CAT GCT CTC TT | ||
| Δ133p53γ | 1st | D133F1 (F) (Int4) | TAGACGCCAACTCTCTCTAG |
| Rev10 (R) (Ex10) | CTT CCC AGC CTG GGC ATC CTT G | ||
| 2nd (670bp) | D133F2 (F) (Int4) | ACT CTG TCT CCT TCC TCT TCC TAC AG | |
| p53γ (R) (Ex9/Ex9γ) | TCGTAAGTCAAGTAGCATCTGAAGG | ||
| actin | actin (F) | ATCTGGCACCACACCTTCTACAATGAGCTGCG | |
| actin (R) | CGTCATACTCCTGCTTGCTGATCCACATCTGC | ||
Table 2
characteristics of breast tumors in the Tayside cohort.
| Variables | ||
|---|---|---|
| Primary breast tumors | 273 | |
| median age follow up | 61.5 (range 28.7–89.1 years) 6.85 (0.29–13.7 years) | |
| grade | 1 2 3 unknown | 25 85 159 4 |
| type | ductal others | 220 53 |
| clinico‐pathological subtype | triple‐negatif luminal A luminal B HER2+ luminal/HER2+ | 49 112 43 20 49 |
| size | <20 mm >20 mm unknown | 91 180 2 |
| invaded lymph nodes (node>0) | negatif positif unknown | 132 140 1 |
| patient outcome | disease free recurrence alive death | 201 72 196 77 |
| p53 | Wild‐type mutant unknown* | 196 64 13 |
| ∆133p53α | ‐ + | 176 97 |
| ∆133p53β | ‐ + | 250 23 |
| Δ133p53γ | ‐ + unknown* | 165 56 52 |
Table 3
Repartition of Δ133p53 isoforms in the Tayside breast cancer cohort (2x2 table). (A) Δ133p53α X Δ133p53β. (B) Δ133p53α X Δ133p53γ. (C) Δ133p53β X Δ133p53γ (−) not detected, (+) amplified.
| A | ||||
|---|---|---|---|---|
| Δ133p53α | ||||
| − | + | Total | ||
| Δ133p53β | − + | 174 2 | 76 21 | 250 23 |
| Total | 176 | 97 | 273 | |
| B | ||||
|---|---|---|---|---|
| Δ133p53α | ||||
| − | + | Total | ||
| Δ133p53γ | − + | 138 3 | 27 53 | 165 56 |
| Total | 141 | 80 | 221 | |
| C | ||||
|---|---|---|---|---|
| Δ133p53γ | ||||
| − | + | Total | ||
| Δ133p53β | − + | 156 9 | 42 14 | 198 23 |
| Total | 165 | 56 | 221 | |
Table 4
Univariate analysis of Δ133p53 isoforms expression in relation to clinical pathological markers. Tumor grade, cancer type (ductal or others), tumor size (>or < 20 mm) were analyzed by Fisher’s t-test. Association with the number of invaded lymph nodes were analyzed by Mann-Whitney method.
| grade | type | size | nb invaded Lymph nodes | ||||||||
|---|---|---|---|---|---|---|---|---|---|---|---|
| 1-2 | 3 | p value | ductal | others | p value | <20 mm | >20 mm | p value | |||
| ∆133p53α | − + | 76 34 | 98 61 | p<0.21 | 140 80 | 36 17 | p<0.56 | 62 29 | 113 67 | p<0.39 | p<0.97 |
| ∆133p53β | − + | 102 8 | 144 15 | p<0.54 | 201 19 | 49 4 | p<0.8 | 81 10 | 167 13 | p<0.30 | p<0.60 |
| ∆133p53γ | − + | 75 21 | 87 35 | p<0.25 | 133 46 | 32 10 | p<0.8 | 59 19 | 105 37 | p<0.79 | p<0.78 |
Table 5
Multivariate analysis of predictor. (A) Multivariate Cox’s Regression analyses utilizing the forward step-wise elimination method to determine the degree of inter-dependence between the breast cancer subtypes (triple negative, Luminal A, Luminal/HER2+, Luminal B, and HER2+), Δ133p53β, TP53 mutation status, lymph node metastasis (present versus absent), tumor size and tumor grade in relation to disease-free survival and overall survival. (B) Multivariate Cox’s Regression analyses utilizing the forward step-wise elimination method to determine the degree of inter-dependence between Δ133p53βTP53 mutation status, lymph node metastasis (present versus absent), tumor size and tumor grade in the luminal A breast cancer patient population. The Fitted model was assessed by an Omnibus test. Hazard Ratio (HR), 95% confidence interval (CI), p values, number of iteration (itr) are indicated.
| A | |||||||||
|---|---|---|---|---|---|---|---|---|---|
| n = 273 | omnibus test of model coefficients | ||||||||
| itr. | predictor | χ2 | df | p-value | HR | 95% CI | p-value | ||
| Disease-free survival | 1 | Luminal A | 17.389 | 1 | 3.00E-05 | 3.09 | 1.78 | 5.38 | 1.00E-04 |
| Overall survival | 1 | Luminal A | 17.088 | 1 | 3.50E-05 | 4.15 | 2 | 8.62 | 1.60E-4 |
| B | |||||||||
|---|---|---|---|---|---|---|---|---|---|
| n = 112 | omnibus test of model coefficients | ||||||||
| itr. | predictor | χ2 | df | p-value | HR | 95% CI | p-value | ||
| Recurrence | 1 | Δ133p53β | 17.589 | 1 | 2.70E-05 | 7.93 | 2.52 | 24,96 | 4.31E-04 |
| Death | 1 | Δ133p53β | 5.31 | 1 | 2.10E-02 | 3.29 | 1.12 | 9.63 | 3.00E-02 |
Download links
A two-part list of links to download the article, or parts of the article, in various formats.
Downloads (link to download the article as PDF)
Open citations (links to open the citations from this article in various online reference manager services)
Cite this article (links to download the citations from this article in formats compatible with various reference manager tools)
TP53 drives invasion through expression of its Δ133p53β variant
eLife 5:e14734.
https://doi.org/10.7554/eLife.14734


