A Herpesviral induction of RAE-1 NKG2D ligand expression occurs through release of HDAC mediated repression
- University of California, United States
- Oregon Health and Science University, United States
Figures
Figure 1

MCMV gene m18 is required for the induction of Raet1 by MCMV.
(A) RT-qPCR analysis of Raet1 expression during WT and ∆m1-m22 MCMV infection. Data are normalized to uninfected fibroblasts (NI). *p<0.05 n.s., not significant (1-way ANOVA with Bonferroni’s multiple comparison post-test). (B) RT-qPCR analysis of MCMV ie1 expression during WT and ∆m1-m22 infection. n.s., not significant (student’s t-test). (C, D) RT-qPCR analysis of Raet1 expression during infection with WT or mutant MCMV lacking the indicated ORFs. Data are normalized to uninfected fibroblasts (NI). (E, F) RT-qPCR analysis of Raet1 expression in mouse fibroblasts infected with mutant MCMV lacking the indicated ORFs and subsequently transfected with m18, m19, or empty vector control. Data are normalized to uninfected fibroblasts (NI). All data were obstained by RT-qPCR and are represented as mean±SEM. All data are representative of at least three independent experiments.
Figure 2 with 1 supplement
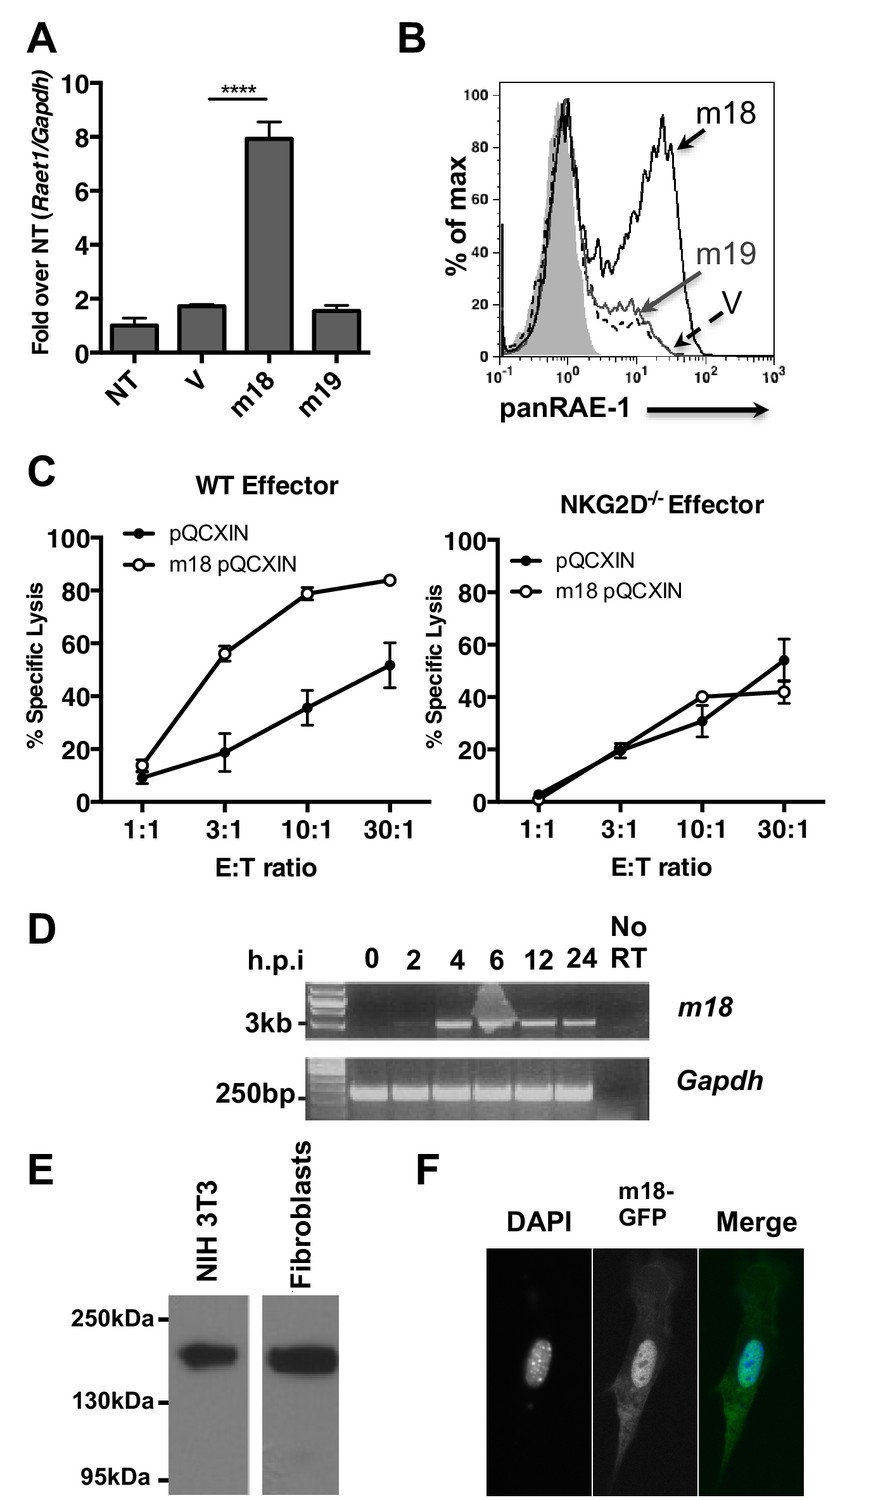
m18 expression is sufficient to induce RAE-1 expression and NK cell killing.
(A) Mouse fibroblasts were transfected with m18, m19, or vector control and analyzed for Raet1 expression by RT-qPCR Data are normalized to non-transfected fibroblasts (NT) and represented as mean±SEM. Data are representative of three independent experiments. ****p<0.00005 (1 way ANOVA with Bonferroni’s multiple comparison post-test). (B) Mouse fibroblasts transfected with m18, m19, or vector control plasmid were analyzed for RAE-1 surface expression by flow cytometry. Data are representative of three independent experiments. (C) Chromium release assay was performed on fibroblasts transduced with m18 or empty vector control and IL-2 activated NK cells from WT or NKG2D KO b6 littermates. Data are represented as mean ±SEM. Data are representative of three independent experiments. (D) Semi quantitative PCR analysis of m18 expression in fibroblasts infected with MCMV at the indicated times. (E) NIH3T3 or mouse fibroblasts were transfected with an expression plasmid encoding an m18-HA fusion protein, and lysates were analyzed for m18-HA expression by western blot. (F) NIH 3T3 transfected with an expression plasmid encoding an m18-GFP fusion protein, and analyzed for localization of m18-GFP fusion protein by confocal microscopy.
Figure 2—figure supplement 1
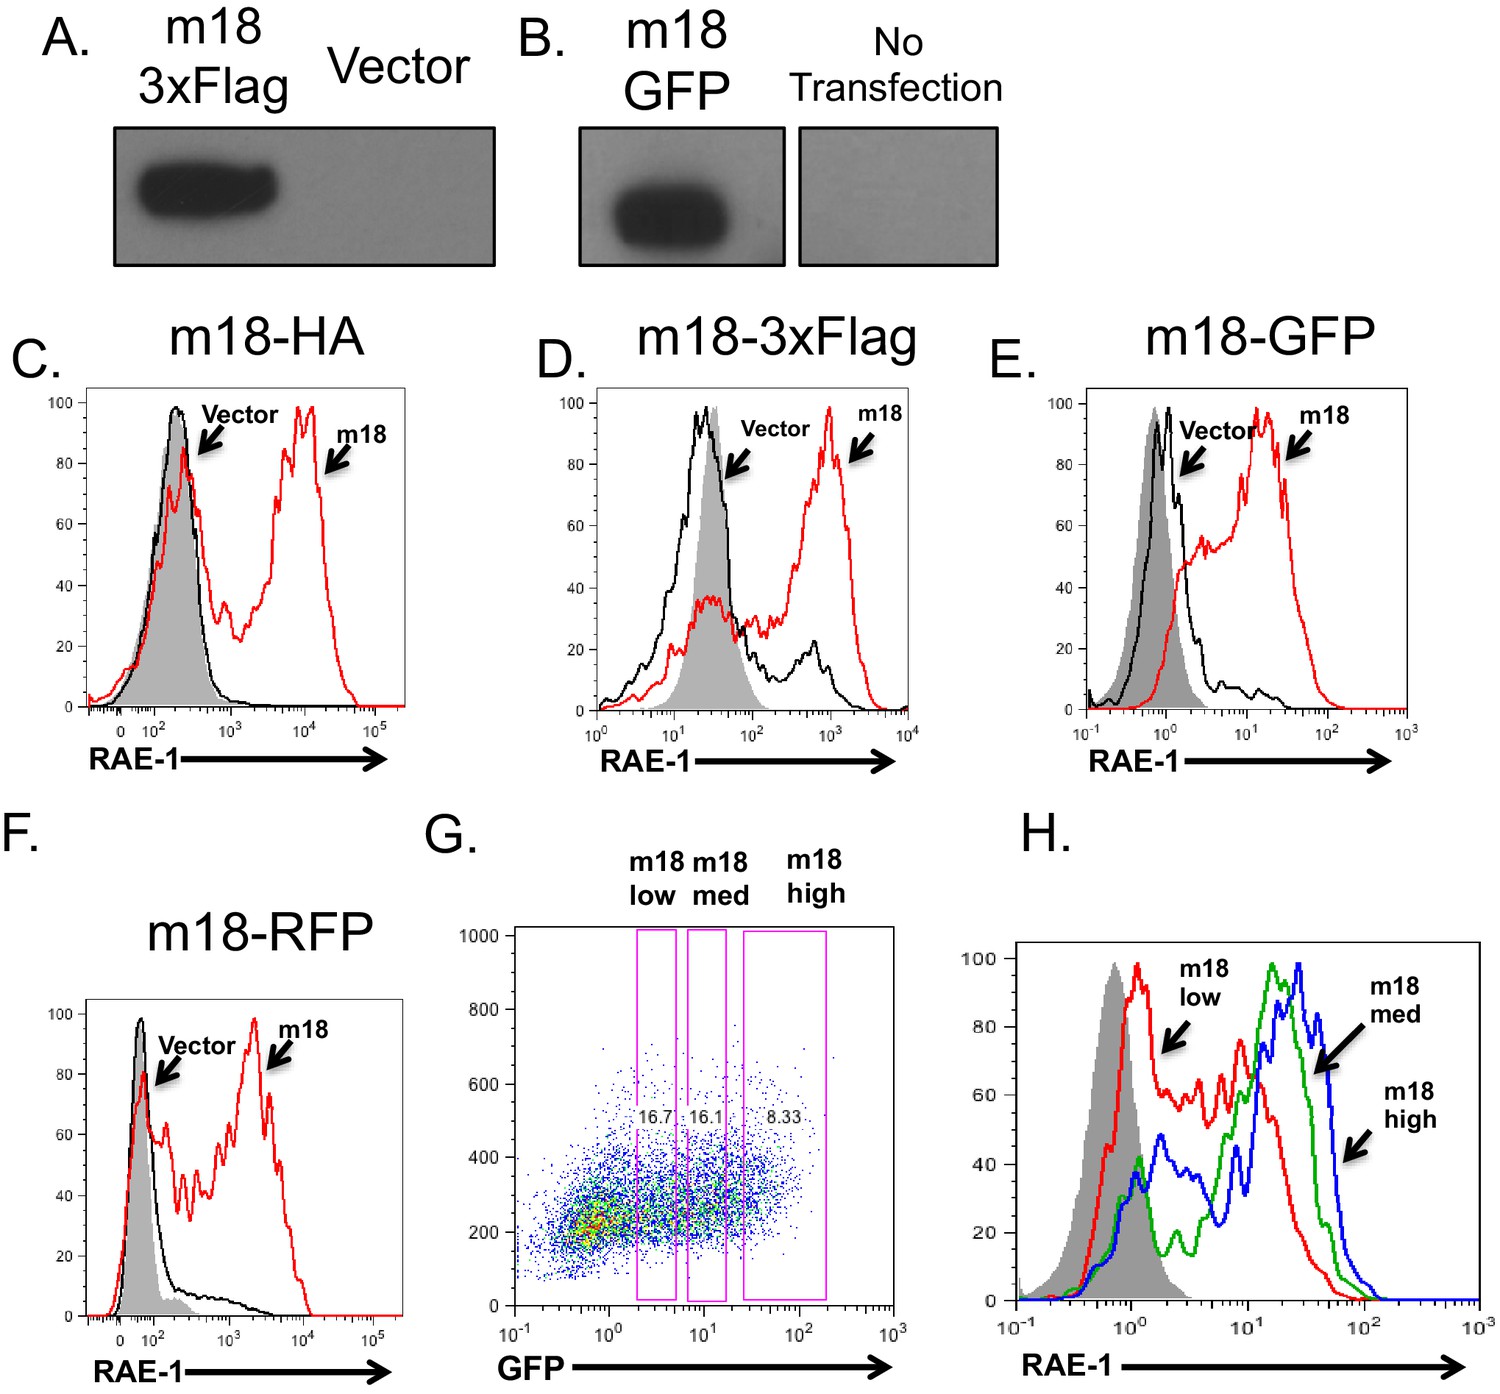
m18 fusion constructs express protein and induce RAE-1 expression.
(A,B) Lysates from mouse fibroblasts transfected with a mammalian expression construct encoding m18 C-terminally fused to 3xFlag epitope tag (A), mammalian expression construct encoding m18 C terminally fused to GFP (B) or vector control. (C–F) Mouse fibroblasts were transfected with the indicated constructs and analyzed for RAE-1 expression by flow cytomotry. (G) Mouse fibroblasts were transfected with a mammalian expression construct encoding m18 C-terminally fused to GFP, and analyzed for RAE-1 expression. From these data gates of GFP low, GFP medium, and GFP high (Left) were analyzed for RAE-1 expression (Right).
Figure 3 with 2 supplements
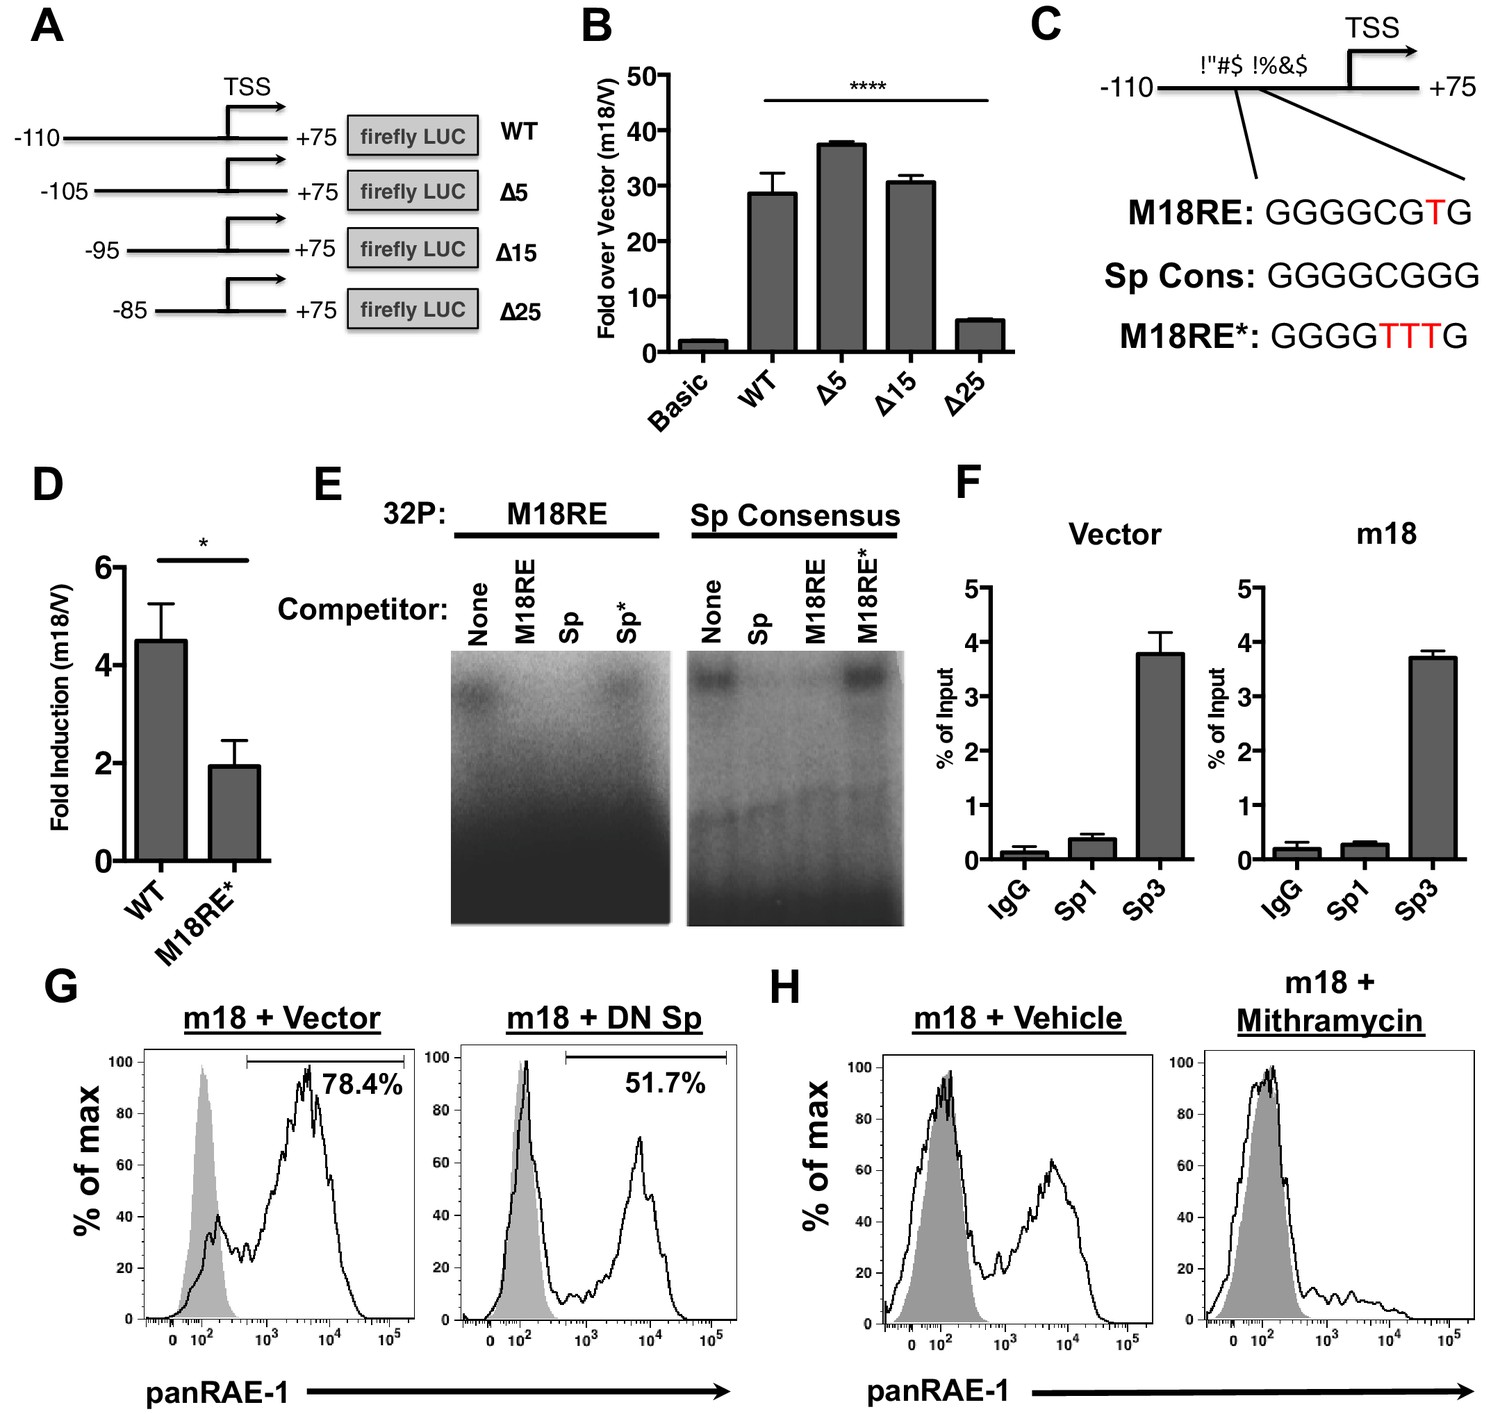
m18 activates the Raet1e promoter activity through an Sp-transcription factor binding element.
(A) A graphic representation of Raet1e promoter luciferase constructs used in (B). (B) Raet1e promoter activity was measured by quantifying luminescence in lysates of cells transfected with the indicated luciferase promoter constructs in combination with m18 or vector control. Data are represented as fold increase in luminescence over vector control. Data are represented as mean±SEM. Data are representative of three independent experiments. ****p<0.00005 (1 way ANOVA with Bonferroni’s multiple comparison post-test). (C) Alignment of the WT m18RE (top), Sp consensus binding sequence (middle) and mutant m18RE (bottom). (D) Raet1e promoter activity was measured in cells co-transfected with a luciferase construct containing WT Raet1e promoter or Raet1e promoter containing a mutation in the Sp-binding site (m18RE*) and either m18 or vector control. Data shows fold increase in luminescence over vector control. Data are represented as mean (±SEM). Data are representative of three independent experiments. *p<0.05 (Student’s T-test). (E) EMSA was performed on mouse fibroblast nuclear extracts incubated with radio-labeled m18RE (left panel) or radio-labeled Sp consensus sequence (right panel). The indicated non-radiolabeled oligos were added in 1000-fold excess before separation by non-denaturing PAGE. Data is representative of three experiments. (F) ChIP was performed on MCA-205 cells using the indicated antibodies and enrichment of the Raet1e promoter was assayed by qPCR. Values were normalized to input chromatin. Data are representative of three independent experiments. (G) Mouse fibroblasts were co-transfected with m18-RFP and DN-Sp1 GFP or GFP vector control and cells expressing both GFP and RFP were analyzed for RAE-1 expression by flow cytometry. Data is representative of three experiments. (H) Mouse fibroblasts were transfected with m18-GFP and treated with Mithramycin or vehicle control were analyzed for expression of RAE-1 by flow cytometry. Data is representative of three experiments.
Figure 3—figure supplement 1
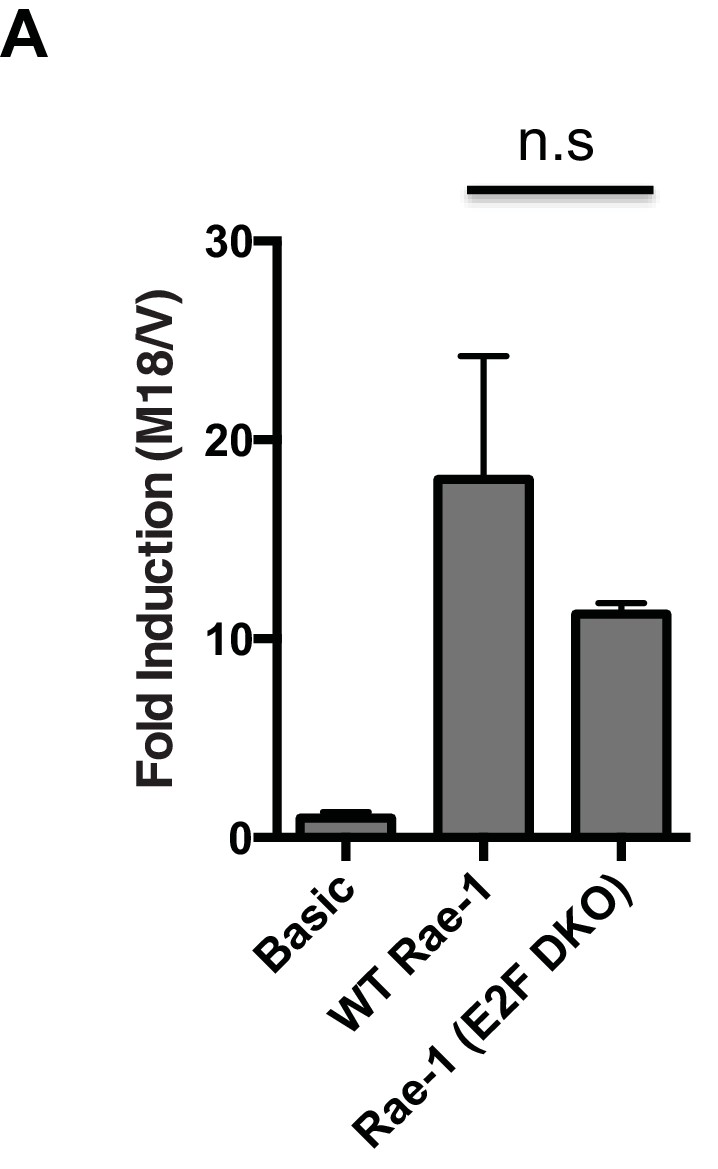
m18 induces transcription from the Raet1e promoter independent of E2F binding sites.
(A) Mouse fibroblasts were transfected with m18 or vector control plasmids along with with luciferase reporter constructs containing the RAE-1 promoter (WT Rae-1) or a Rae-1 promoter with both E2F binding elements mutated (E2F DKO). Data are represented as fold difference between promoter construct transfected with m18 over promoter construct transfected with vector control. Values are shown as mean±SEM. Data are representative of three independent experiments. n.s.: Not significant (1-way ANOVA with Bonferroni’s multiple comparison post-test).
Figure 3—figure supplement 2
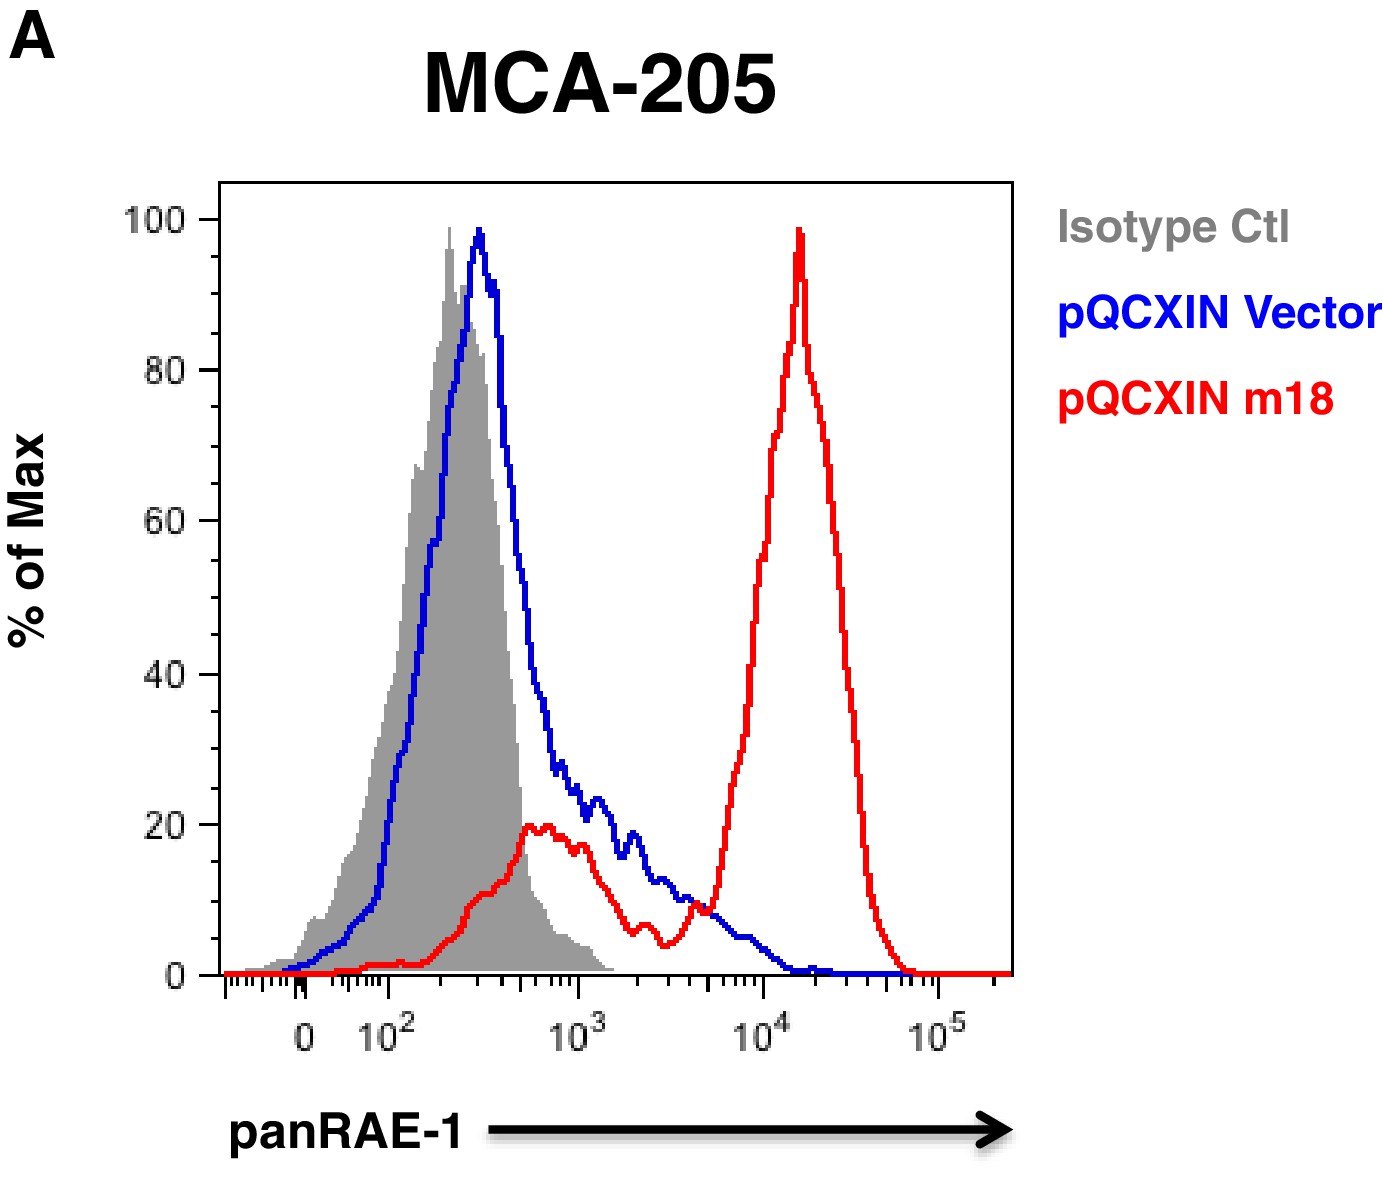
MCA-205 carcinoma cell line is inducible for RAE-1 expression by m18.
(A) MCA-205 cells stably tranduced with either vector control or m18 and analyzed for RAE-1 expression by flow cytometry. Data are representative of three independent experiments.
Figure 4
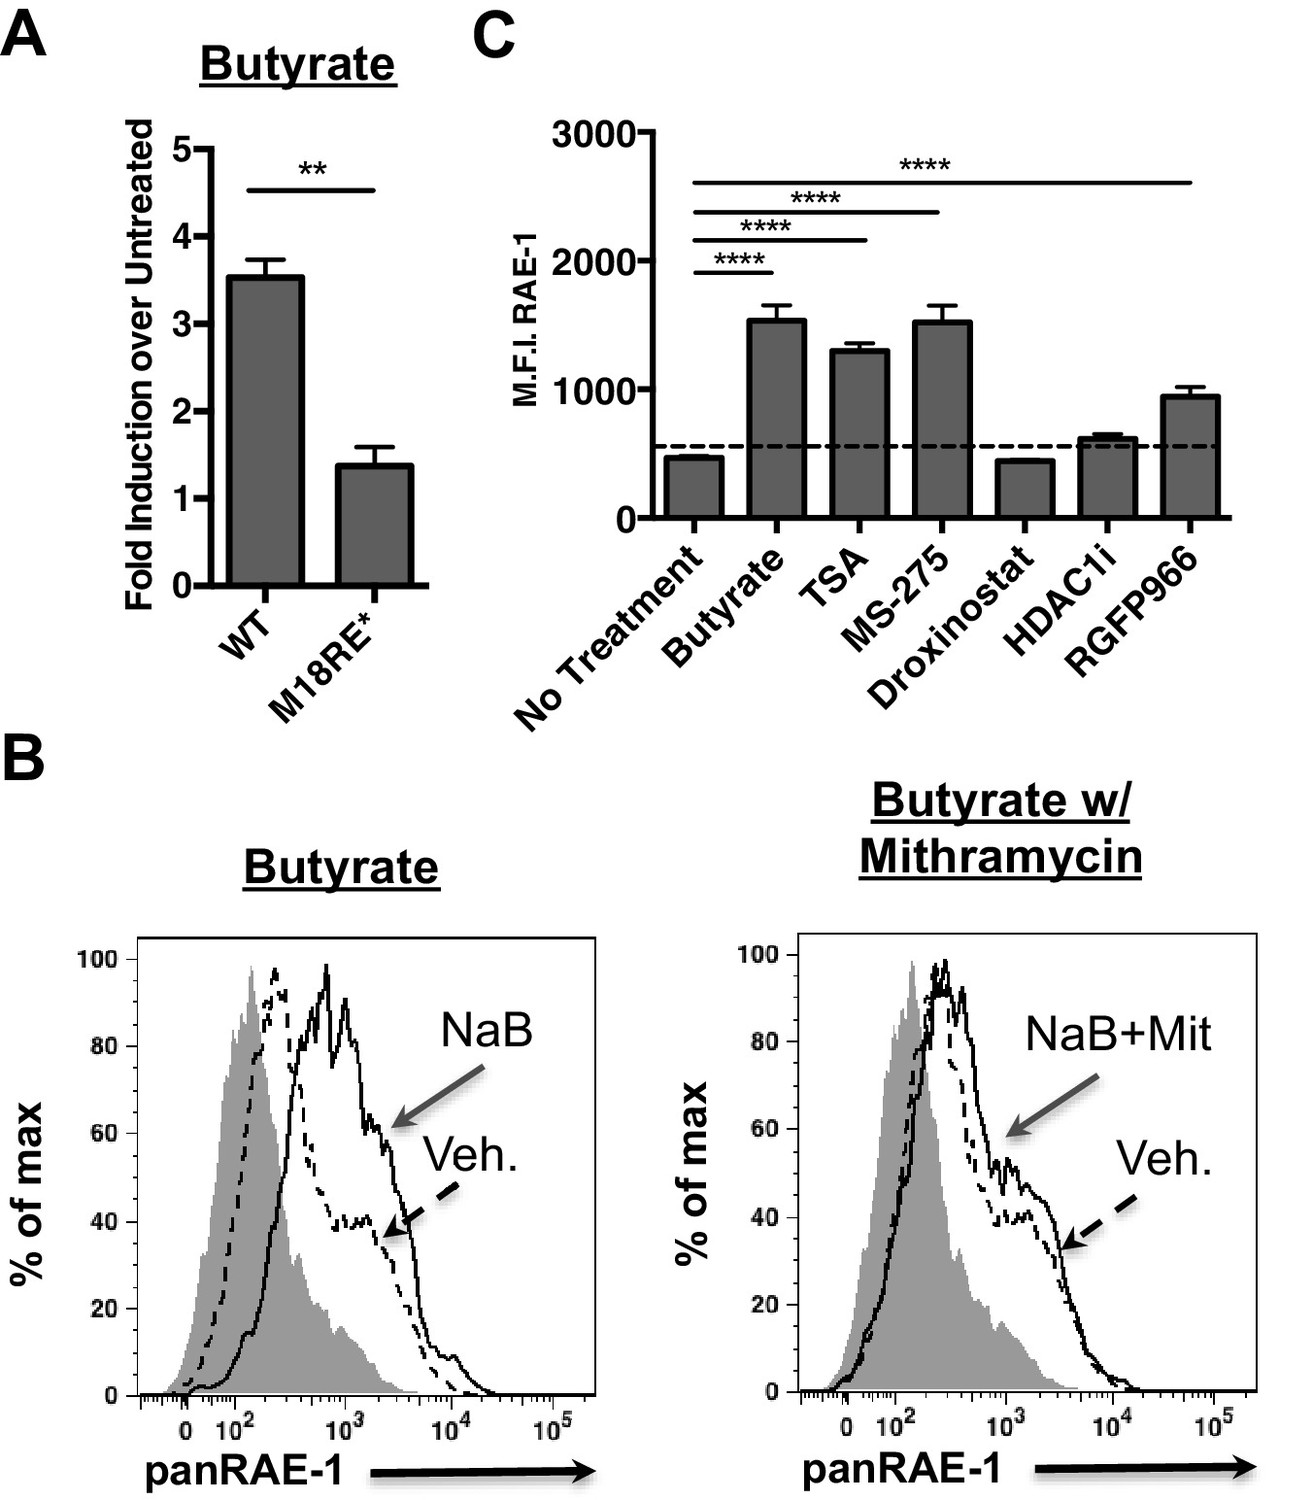
HDAC inhibition drives RAE-1 expression in an Sp factor dependent manner.
(A) Raet1e promoter activity was measured in lysates from mouse fibroblasts transfected with either WT Raet1e promoter or the m18RE* promoter treated with sodium butyrate (NaB) (1 mM). Data are expressed as fold change between butyrate treated and untreated promoter. Data are represented as mean±SEM. Data are representative of three independent experiments. **p<0.005 (Student’s T-test). (B) Cells treated with NaB (1 mM) with or without Mithramycin (1.5 μM) were analyzed for RAE-1 expression by flow cytometry. Data are representative of five independent experiments. (C) Cells were treated with HDAC inhibitors TSA (1 nM) (pan-HDACi), NaB (0.1 mM) (Class I and IIa), MS-275 (800 nM) (HDAC1,3), RGFP966 (640 nM) (HDAC3) 4-(dimethylamino)-N-[6-(hydroxyamino)−6-oxohexyl]-benzamide (HDAC1i) (1 μM) (HDAC1), or Droxinostat (3 μM) (HDAC6,8) and analyzed for RAE-1 expression by flow cytometry. Data are represented as mean fluorescent intensity±SEM. Data are representative of three independent experiments. ****p<0.00005 (1 way ANOVA with Bonferroni’s multiple comparison post-test).
Figure 5 with 1 supplement
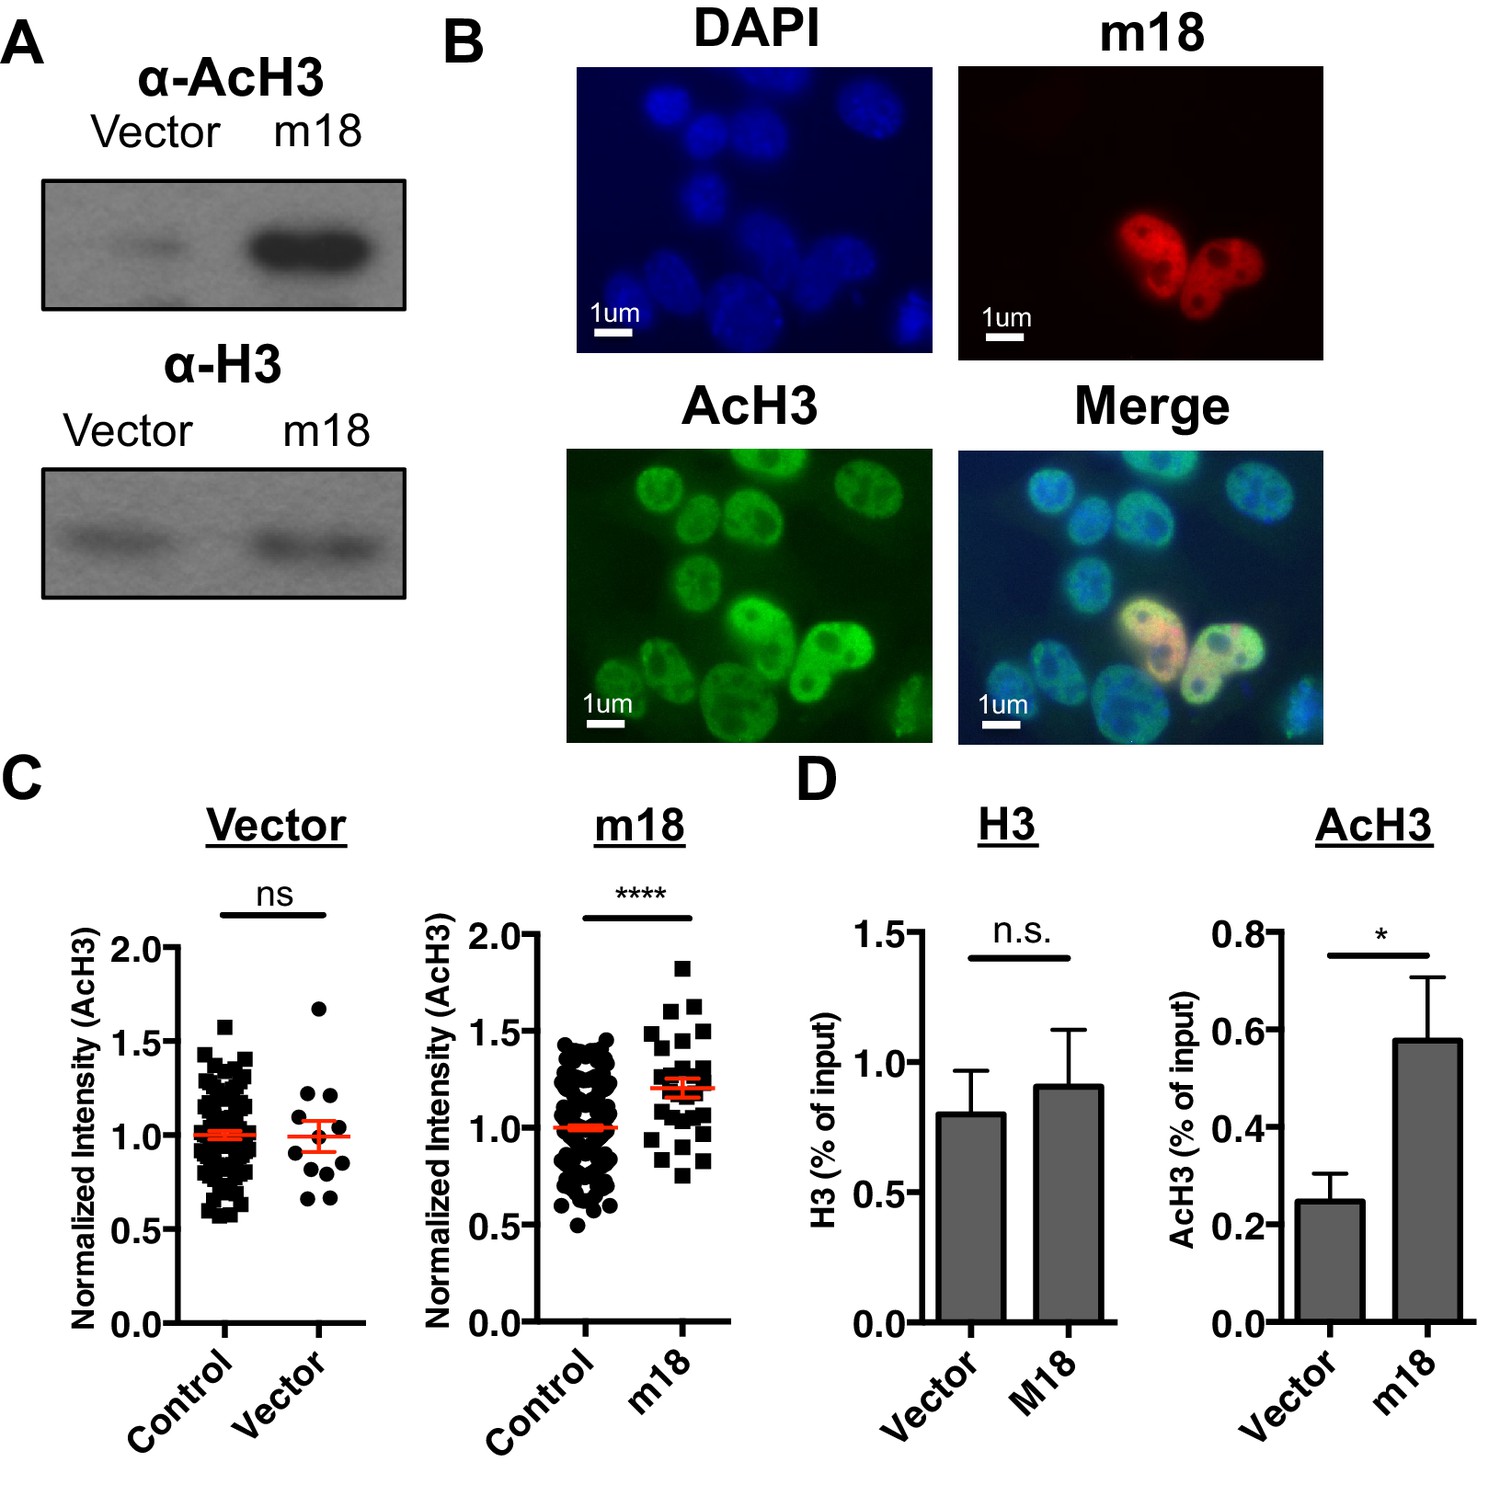
m18 expression increases levels of histone acetylation.
(A) Mouse fibroblasts stably expressing m18 or vector control were analyzed for H3 and AcH3 expression by western blot. Data are representative of three independent experiments. (B) Representative image of cells transiently transfected with vector encoding m18 with a C-terminal fusion to RFP (m18-RFP) and stained for AcH3. (C) Quantification of AcH3 levels in cells expressing m18-RFP or RFP control vector from compared to non-transfected controls in same field of view. Red bars are representative of mean±SEM. Data are representative of three independent experiments. ****p<0.00005. n.s., not significant. (Student’s T-test). (D) ChIP was performed for AcH3 and H3 in MCA-205 mouse carcinoma cells stably expressing m18 or vector control. Data are normalized to input chromatin and represented as mean±SEM. Data are representative of three independent experiments. *p<0.05, n.s., not significant (Student’s t-test).
Figure 5—figure supplement 1
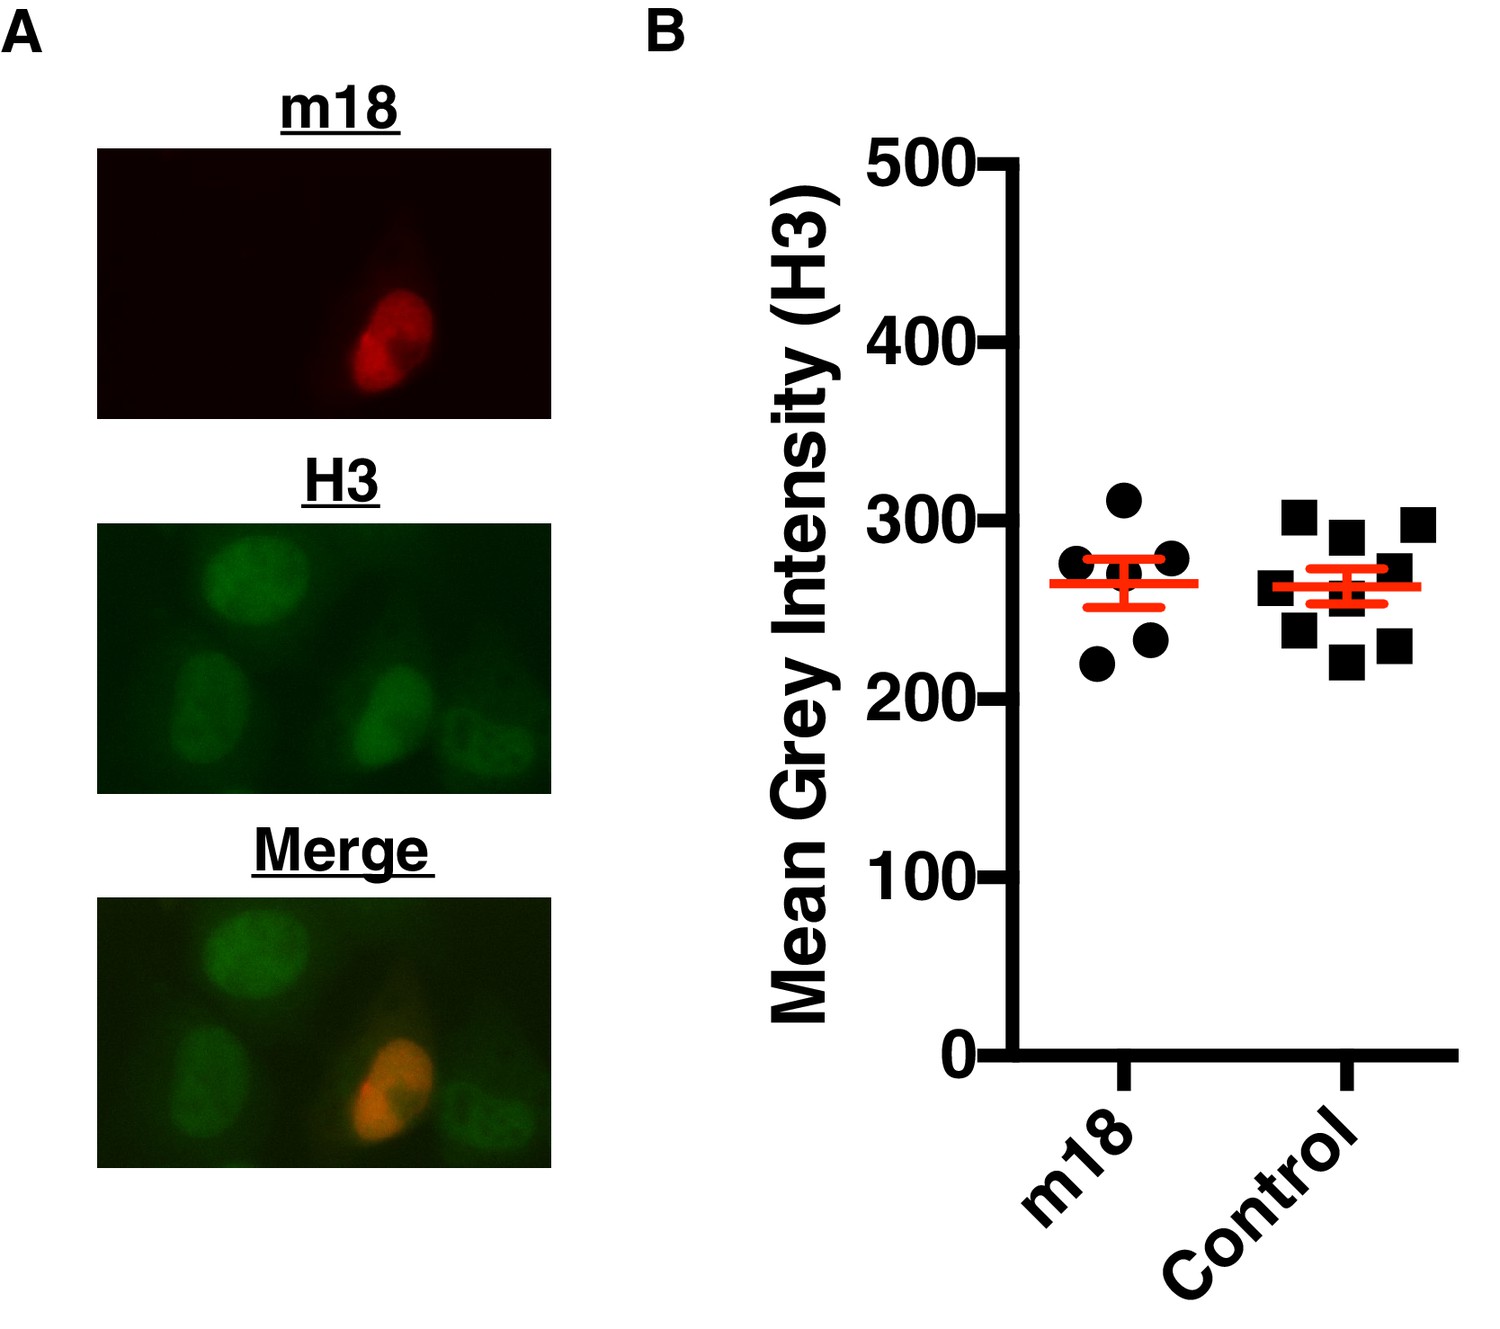
m18 expression does not change Histone three levels.
(A) Representative picture of H3 staining in m18-RFP transfected cells. (B) Nuclear staining of H3 was quantified in FIJI. Red bars are representative of mean±SEM. Data are representative of three independent experiments. n.s., Not significant (Students T-test).
Figure 6 with 1 supplement
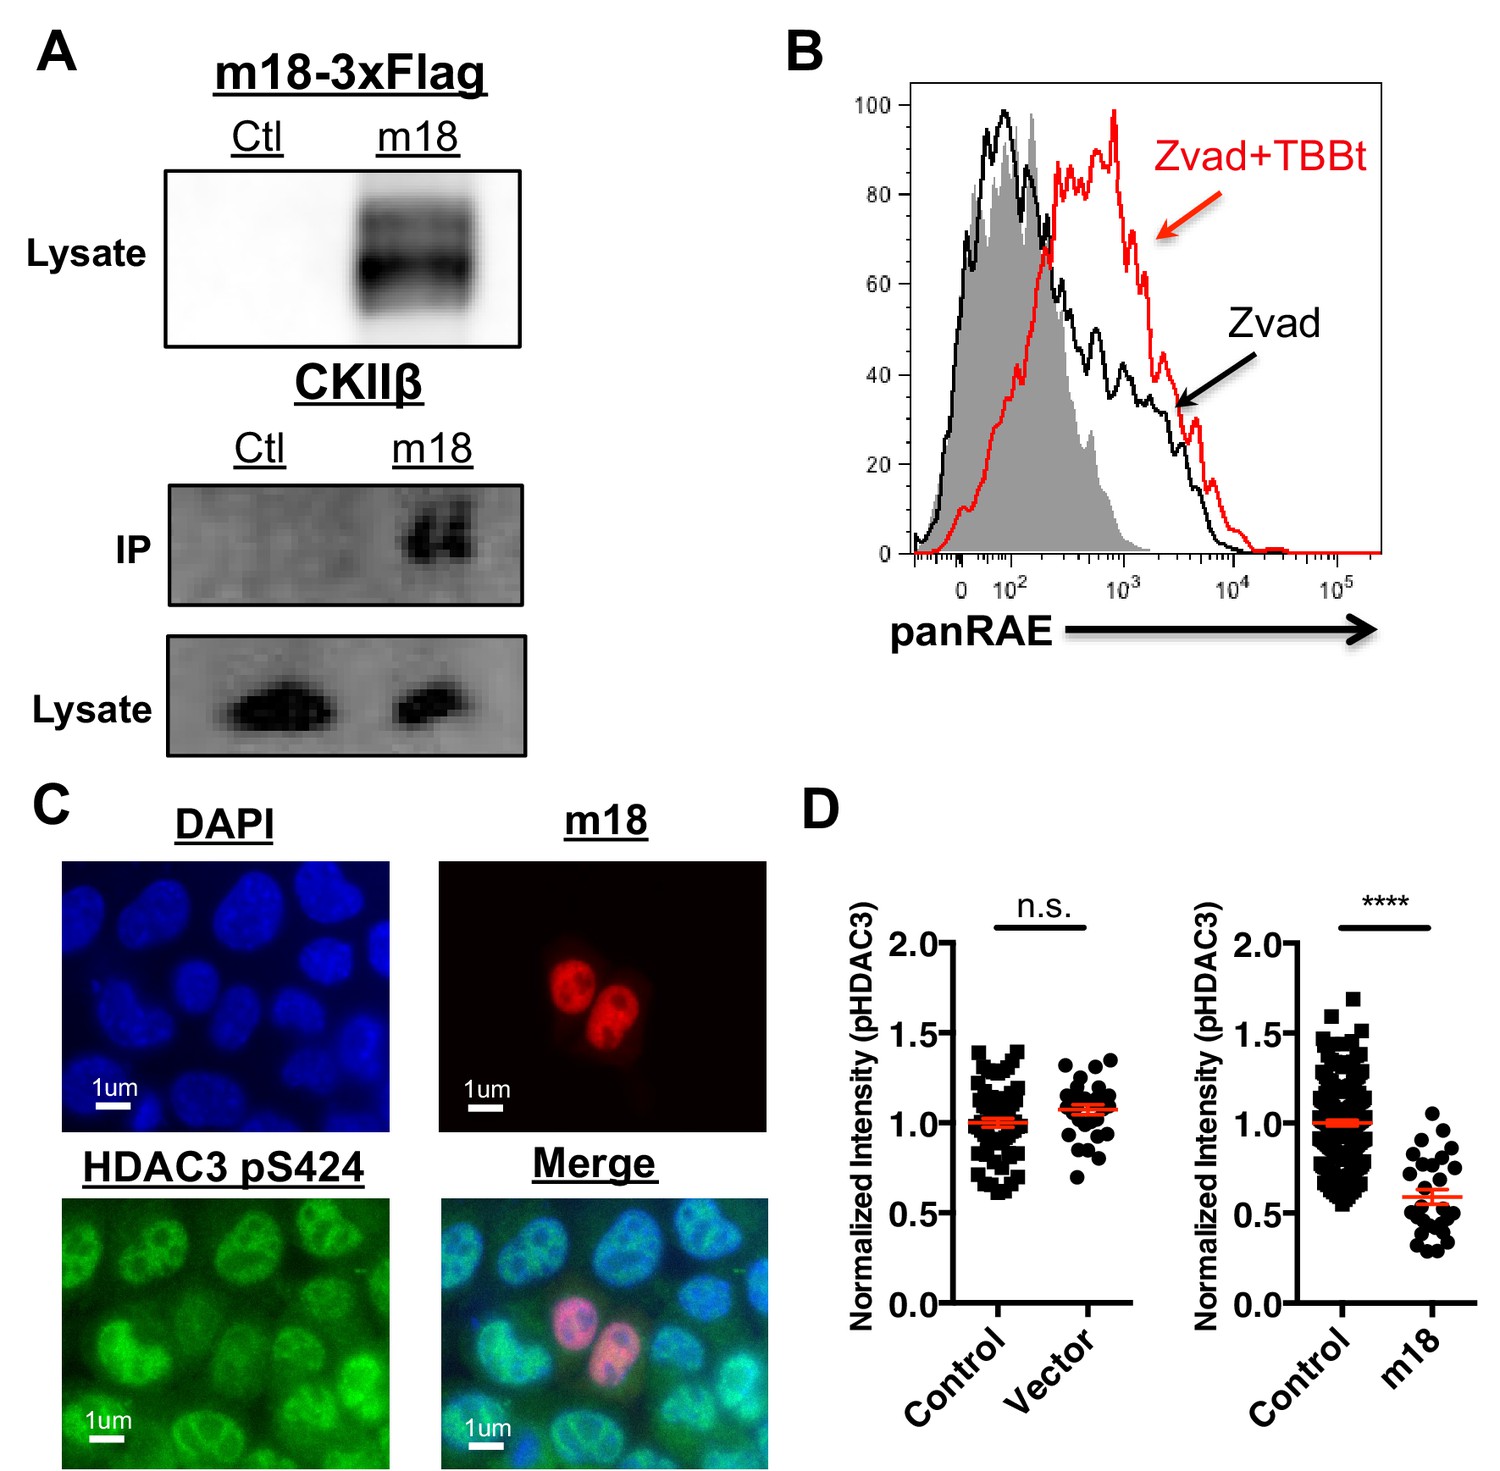
CK2 directly interacts with m18 and represses HDAC function.
(A) Immunoprecipitation (IP) of m18 was performed in lysates of cells expressing m18-3xFlag or empty 3xFlag vector, and the products were analyzed for FLAG and CK2β by western blot. Data are representative of three independent experiments. (B) Mouse fibroblasts were treated with CK2 inhibitor TBBt in conjunction with zVAD or zVAD alone and analyzed for RAE-1 expression by flow cytometry. Data is representative of three independent experiments. (C) Representative image of fibroblasts expressing m18-RFP and stained for HDAC3 pS424. (D) Quantification of HDAC3 pS424 levels in cells expressing m18-RFP or RFP control vector from compared to non-transfected controls in same field of view. Red bars are representative of mean±SEM. Data are representative of three independent experiments. ****p<0.00005. n.s., not significant. (Student’s T-test).
Figure 6—figure supplement 1
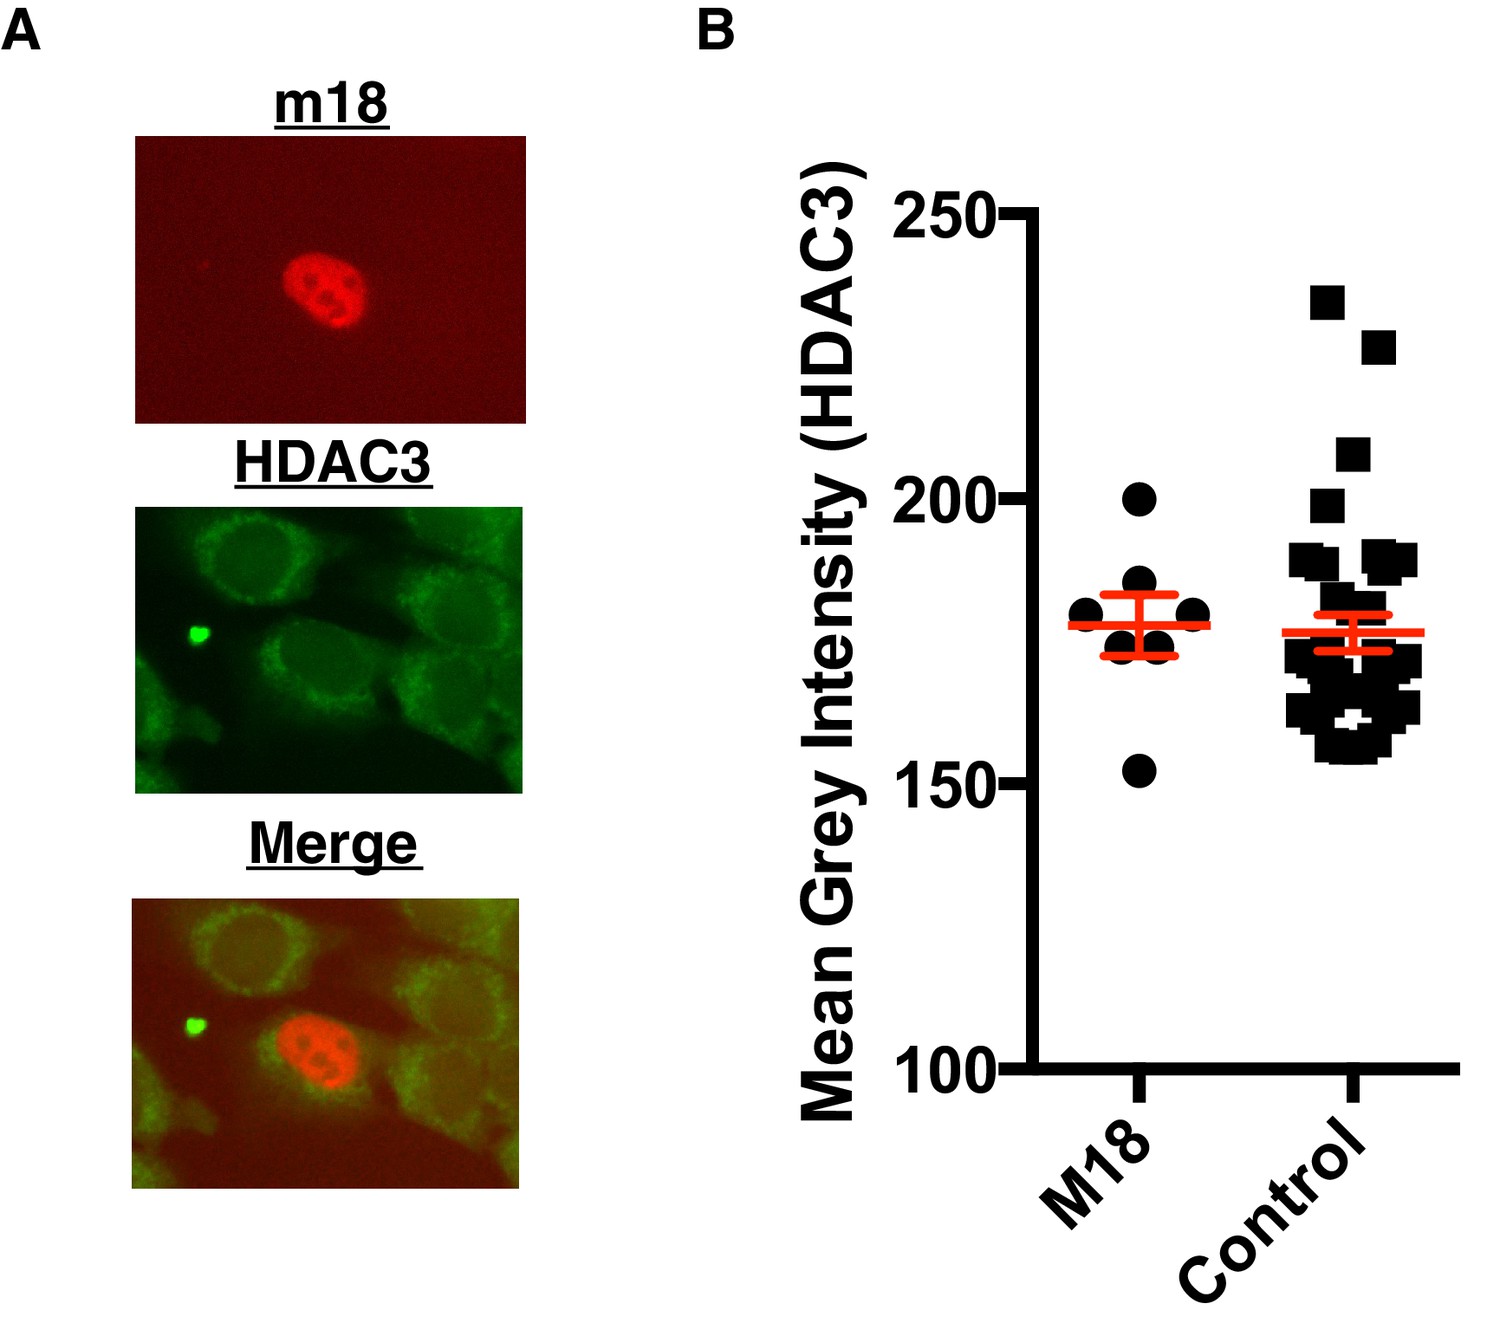
m18 expression does not change HDAC3 levels.
(A) Representative picture of HDAC3 staining in m18-RFP transfected cells. (B) Nuclear staining of HDAC3 was quantified in FIJI. Data are representative of mean±SEM. Data are representative of three independent experiments. n.s., Not significant (Students T-test).
Figure 7 with 1 supplement
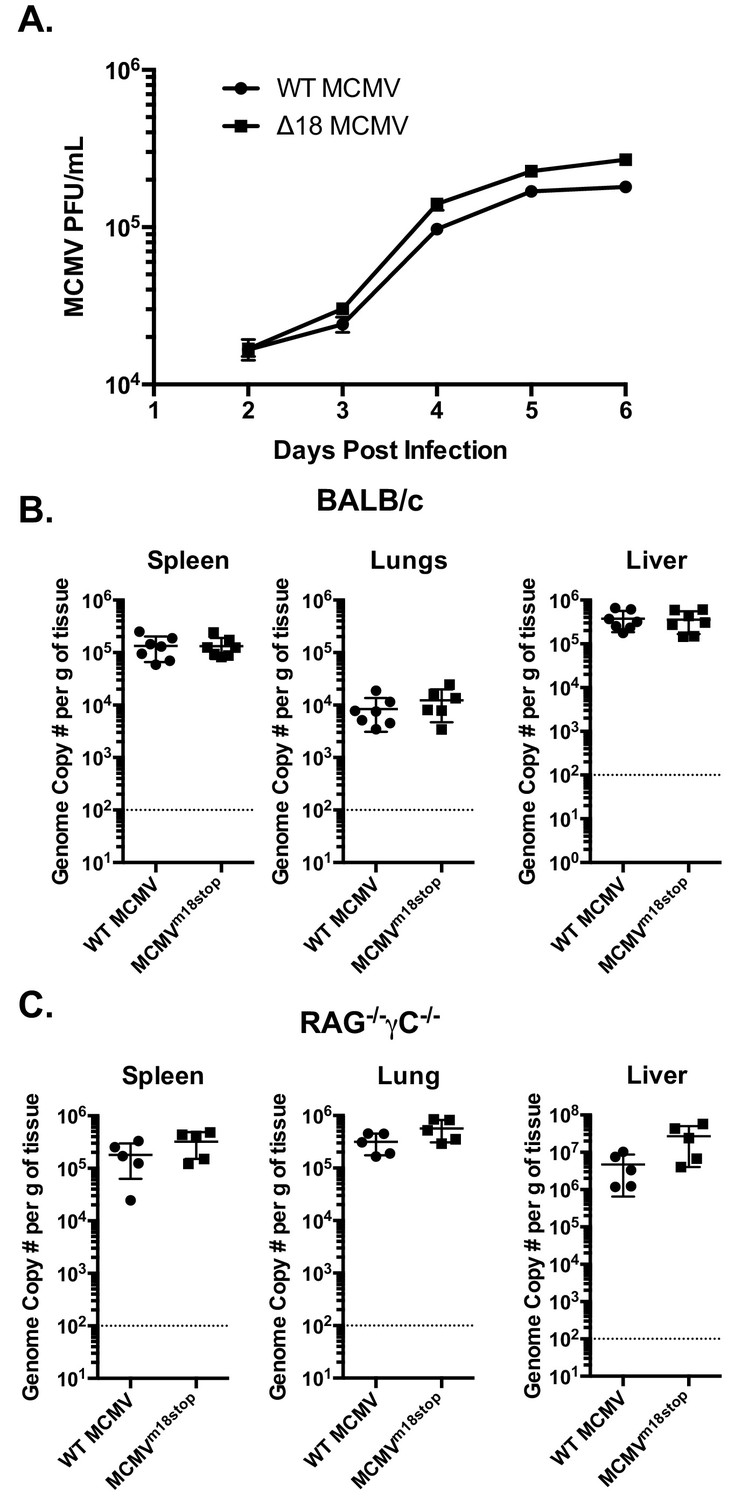
m18 is dispensable for MCMV growth in vitro and acutely in vivo.
(A) MCMV titers in supernatents of NIH-3T3 cells infected with either WT or ∆18 MCMV. (B) qPCR analysis of MCMV genome copy number from spleen, lung, and liver tissues of BALB/c mice infected with 500,000 p.f.u. of WT or MCMVm18stop. (C) qPCR analysis of MCMV genome copy number from spleen, lung, and liver tissues of RAG-/-γC-/- Mice infected with 50,000 p.f.u. of WT or MCMVm18stop.
Figure 7—figure supplement 1
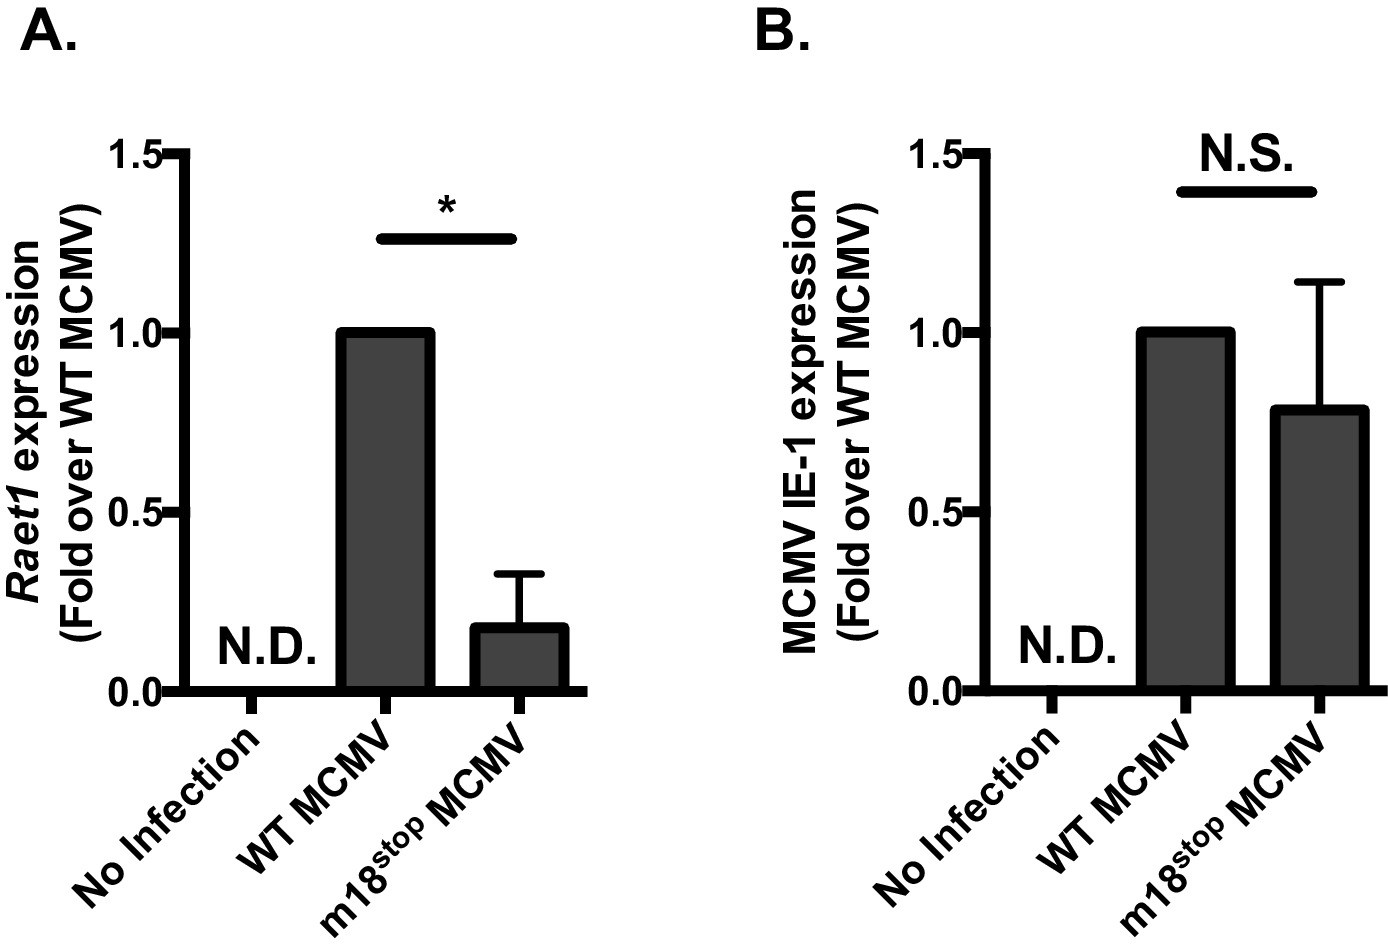
MCMVm18stop does not induce RAE-1 expression or cause a defect in IE-1 expression.
(A) RT-qPCR analysis of Raet1 expression in mouse fibroblasts infected with WTMCMV or MCMVm18stop. (B) RT-qPCR analysis of MCMV IE-1 expression in mouse fibroblasts infected with WTMCMV or MCMVm18stop. **p<0.05. n.s., Not significant (Students T-test).
Figure 8
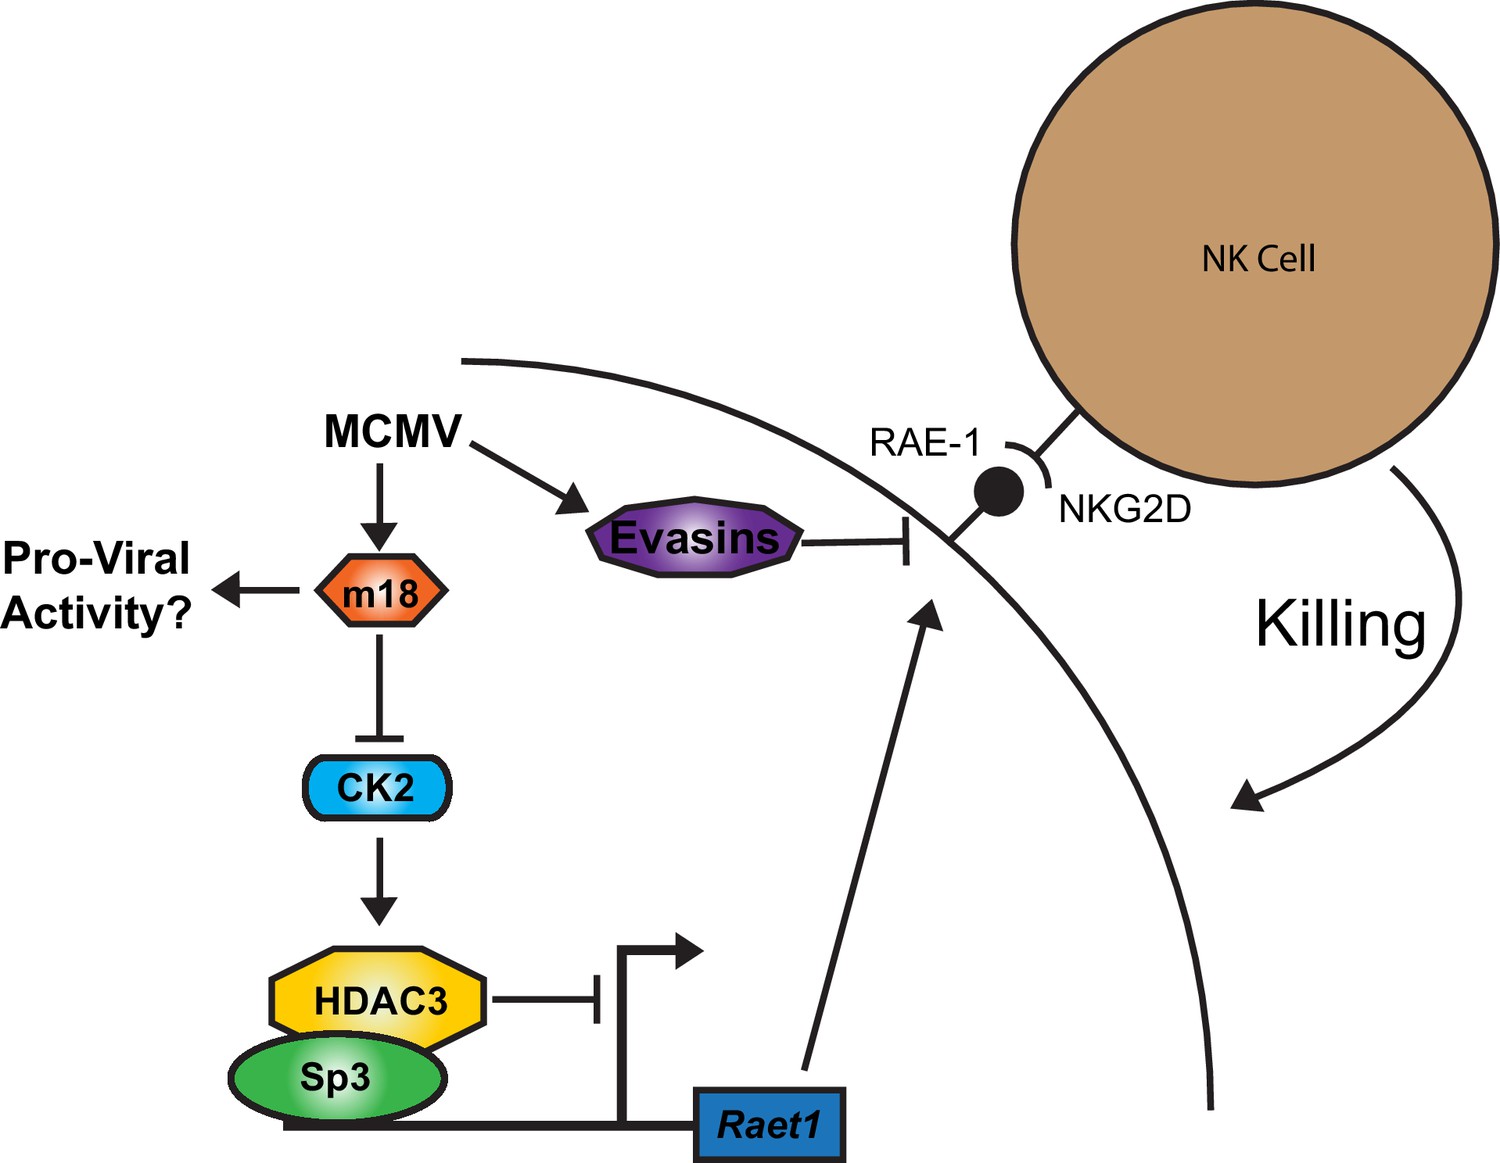
A model for RAE-1 induction by m18 during MCMV infection.
In the absence of stimulus CK2 phosphoylates and activates HDAC3, which represses the Raet1 promoter. During MCMV infection m18 directly interacts with CK2 preventing activation of HDAC3 and allowing the Raet1 promoter to become de-repressed, and permiting the expression of Raet1. MCMV also encodes a variety of evasins that prevent the cell surface expression of RAE-1 in order to evade recognition and killing by NK cells. Together these systems allow the virus to inhibit HDAC3 activity, while evading the deleterious effects of inducing NKG2D ligands.
Figure 9

Virally encoded HDAC inhibitors from human herpesviruses induce human NKG2D ligand expression.
(A, B) RT-qPCR analysis of ULBP1 expression in Human foreskin fibroblasts (HFFs) transfected with empty vector or IE-1 (HCMV), or ICP0 (HSV-1). Data are normalized to vector control and represented as mean±SEM. Data are representative of three independent experiments.
Tables
Table 1
qPCR primers.
Gene symbol | Accession number | Forward | Reverse | Amplicon length | Location |
|---|---|---|---|---|---|
ULBP1 | Q9BZM6 | gccaggatgtcttgtgagcatgaa | ttcttggctccaggatgaagtgct | 134 | Exon 3 |
HPRT | P00492 | ggtgaaaaggaccccacgaag | ggactccagatgtttccaaac | 205 | Exon Spanning (7–9) |
Table 2
BAC mutagenesis primers.
Primer pair | Forward | Reverse |
|---|---|---|
Kanamycin* | CGATTTATTCAACAAAGCCACGTTGTGTCT | GCCAGTGTTACAACCAATTAACCAATTCTGA |
Δ1-6 | gtgtcacgcgcacgtgttagcataggaatccagacgcgcgctcgcctgag | atttacatactcaggacaggtgtgggcggttccaggtgtacgtaagcaga |
Δ6-12 | acacgcccaaaatcacgcaatcatatataaatggacaatgaagccaatct | gttctaagtaaaaggggatacgggcgggcgatacagatgtacgaacccaa |
Δ12-18 | caacaaataaaaattgtacgctcattttatcgcgtctctgtcatgtgttc | gaggggttggtacggttcgagcgattttggtagtccgagacgtccgccgc |
Δ18-22 | ttgaatacgattgtttttattggcagcactgagcacacgtcccccccacc | atccgctcgaggccatgctcaccaagaagaccgagtgtcccaacaacttc |
Δ1-22 | gtgtcacgcgcacgtgttagcataggaatccagacgcgcgctcgcctgag | atccgctcgaggccatgctcaccaagaagaccgagtgtcccaacaacttc |
Δ12 | caacaaataaaaattgtacgctcattttatcgcgtctctgtcatgtgttc | gttctaagtaaaaggggatacgggcgggcgatacagatgtacgaacccaa |
Δ13 | tagaacaatatgtaaaccatctctcattcagctacatacagacaagggac | Tgataagaattatactttaatgggggacacgttctagaacacgataaact |
Δ14 | Agtataattcttatcaattataccagagtttggtatttttttaatctgag | Cgagtgtgaaatggggaaactggcgcgtcttttcattcgtgctccacagc |
Δ15/16 | cactcgctatccttcgaccacactttcgagtcttttaccgtatcaagaag | Acaataaagatttcagacaaaaagtatggattgtgtgataatttattaaa |
Δ17 | catactttttgtctgaaatctttattgtacgccatcgaaataaggggagc | gtctgctttctttgaaatcggacgaccgatcagaacgtccgccttcgaga |
∆18 | ttgaatacgattgtttttattggcagcactgagcacacgtcccccccacc | Gaggggttggtacggttcgagcgattttggtagtccgagacgtccgccgc |
∆19 | ccaagacgctcgtcttataacaccgactgacgtttactccgactcaggat | Tcgaggcgagtcttcggagctgtacgctagggcgatcgccatcaccctct |
∆20/21 | Cggcgacgacggcgatcacggcgagggtgaagagggtgatggcgatcgcc | Gctgtcatgtaaatggacggttattaaaagatgaggtcgtgtgacctctg |
∆22 | Gggtagcgcctcgatcgacgagcgtcggacaaagaaaccgggagaagaag | Atccgctcgaggccatgctcaccaagaagaccgagtgtcccaacaacttc |
MCMVm18stop | gcagcggttccgccgtccccatcgcgacgatgggcgctccgaattcctaataaaccgactcccgtccccaccaaggatgacgacgataagtaggg | ggagcgcccatcgtcgcgatttattaggaattccgcgctgctggcgatgagcgtggtggggacgggagtcggtaaccaattaaccaattctgattag |
-
*Kanamycin specific oligos were added to the 3 the 3ggaattccgcgctgctggcgatgagcgtggtgggga.
Table 3
EMSA Oligos.
Primer pair | Forward |
|---|---|
m18RE | ggctcgcaggtccacgccccttggcaccggag |
m18RE* | ggctcgcaggtccaaaccccttggcaccggag |
Sp Consensus | attcgatcggggcggggcgagc |
Sp* Consensus | attcgatcggttcggggcgagc |
Table 4
Cloning and Mutagenesis primers.
Primer pair | Forward | Reverse |
|---|---|---|
m18RE mutant Quickchange | ggaggctcgcaggtccaaaccccttggcaccggag | ctccggtgccaaggggtttggacctgcgagcctcc |
m18 | atggctgacactgggc | tcaatcatcccaccagagag |
m19 | gatcgaattcATGAGTATCATCGCCACACCCATCC | gatcgcggccgcTCACCCTCGCCGTGATCG |
EBNA-1 | ATCGGAATTCGCCACCATGTCTGACGAGGGGCCAG | AATTCTCGAGCTCCTGCCCTTCCTCACC |
Additional files
-
Supplementary file 1
Proteins identified by LC-MS/MS for M18-CS expressed in HEK293 cells.
Reported here are the Protein Prospector data search results including number of unique peptides, the peptide count, and percent sequence coverage for a given protein identified, as well as best discriminant score and best expectation values. Protein Prospector data search parameters were reported in Materials and methods; a minimum of two unique peptides in at least one experiment were required for a protein to be reported. Known background proteins are reported in Supplemental Table 2 (after Greninger et al., 2012).
- https://doi.org/10.7554/eLife.14749.021
-
Supplementary file 2
Frequent Background proteins identified in LC-MS/MS analysis of N- or C-terminally tagged M18 APMS samples.
Reported here are the Protein Prospector data search results as in Supplemental Table 1. These background proteins appeared with ≥10% frequency among APMS experiments in our database of 2X-Strep-tagged protein expression in HEK293 cells for picornavirus-host AP-MS experiments (Greninger et al., 2012).
- https://doi.org/10.7554/eLife.14749.022
-
Supplementary file 3
Z-scores for proteins identified by APMS.
Proteins identified by APMS were scored for specificity by Z-score using a previously reported method (Greninger et al., 2012). N = 3 M18 APMS experiments included one N-term and two biological replicate C-term experiments. Background dataset included 598 unrelated picornavirus-host APMS experiments assayed in the same experimental system (Greninger et al., 2012).
- https://doi.org/10.7554/eLife.14749.023
-
Supplementary file 4
LC/MS/MS identified peptides for m18.
Provided here is a peptide report output from Protein Prospector, listing the LC-MS/MS identified peptides for m18 with N- or C-terminal 2X-Strep-Tag (sequences below). Provided are the observed mass to charge ratio (m/z) and charge (z) for each parent ion, with an error (in ppm) from the theoretical mass. Protein Prospector Peptide Score and Expectation Values are also provided. Variable modification sites are reportedwith protein numbering within the canonical M18 sequence using the '@' to indicate the position. A site localization probability (SLIP) score ≥6 corresponds to >95% confident site assignment. Unambiguous SLIP scores are reported after the '=' symbol, and sites indicated with a vertical bar '|' show alternative matches that fit the spectrum.
- https://doi.org/10.7554/eLife.14749.024
Download links
A two-part list of links to download the article, or parts of the article, in various formats.
Downloads (link to download the article as PDF)
Open citations (links to open the citations from this article in various online reference manager services)
Cite this article (links to download the citations from this article in formats compatible with various reference manager tools)
A Herpesviral induction of RAE-1 NKG2D ligand expression occurs through release of HDAC mediated repression
eLife 5:e14749.
https://doi.org/10.7554/eLife.14749


