EphrinB2 drives perivascular invasion and proliferation of glioblastoma stem-like cells
- MRC Clinical Sciences Centre (CSC), United Kingdom
- Imperial College London, United Kingdom
- University of Cambridge, United Kingdom
- European Bioinformatics Institute, United Kingdom
- MRC Clinical Sciences, United Kingdom
- Centro Nacional de Investigaciones Oncologicas, Spain
- Imperial College Healthcare Trust, United Kingdom
- The University of Edinburgh, United Kingdom
- University of Manchester, United Kingdom
Figures
Figure 1 with 1 supplement
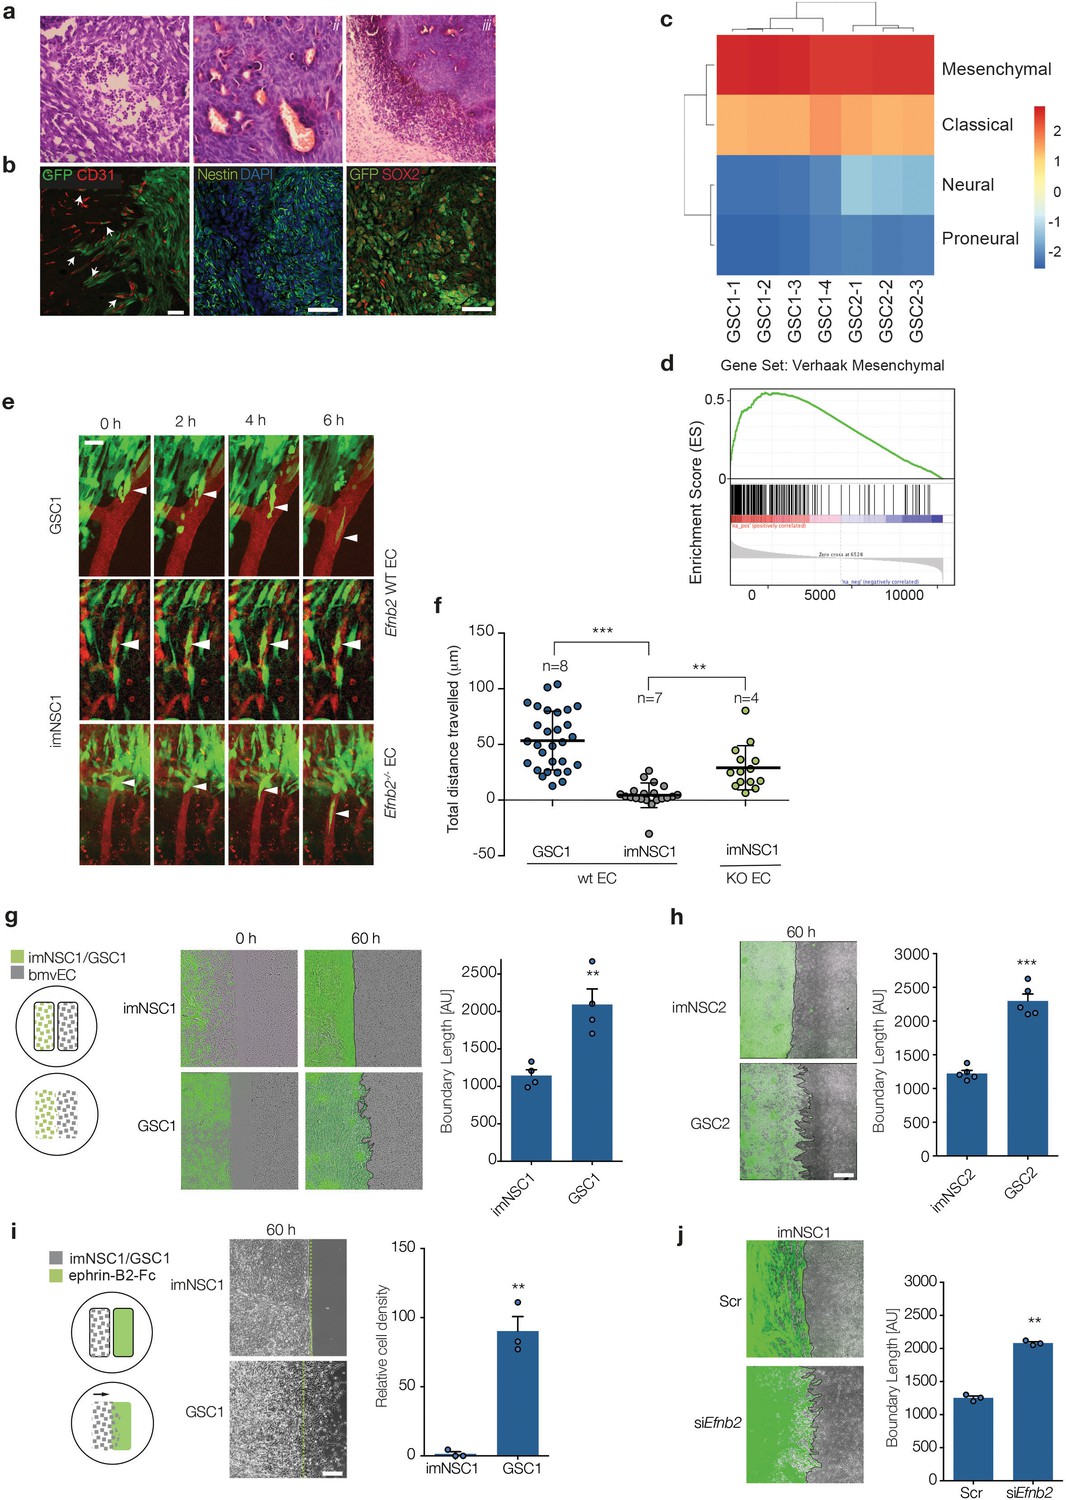
The vasculature compartmentalises immortalised neural but not glioma stem cells through endothelial ephrin-B2.
(a) Representative H&E staining of GSC1 tumours 60 days after intracranial injection into nude mice. Neovascularisation (i), focal necrosis (ii) and increased cellular density (iii) can be observed. (b) Representative fluorescent images of GFP-labeled GSC1 tumours stained for the vascular marker CD31 (red) and GFP to identify tumour cells (green, left), the stem cell markers nestin (green, middle) and Sox2 (red, right), as indicated. The arrows indicate examples of GFP-labeled GSC1 that have migrated away from the tumour mass and are invading along the vasculature as single cells or in small groups. Scale bars = 50 μm. (c) Heatmap showing Verhaak subtype classification of 4 GSC1 and 3 GSC2-derived tumours in vivo. Colour scale with corresponding normalised enrichment scores is shown on the right. All tumours classified as mesenchymal with a nes >2.6. (d) Mean GSEA enrichment plot for the Verhaak mesenchymal gene signature in the GSC lines. Both nom p-val and FDR q-val = 0. (e) Intravital 2-photon micrographs of GFP-labeled imNSC1 and GSC1 cells injected into the cortex of wildtype (Efnb2 WT EC) and endothelial specific Efnb2 knockout mice (Efnb2-/- EC) and imaged 7 days later over 6 hr through an intracranial window at a depth of 200 μm. The vasculature was labeled by tail-vein injection of Tx-red conjugated Dextrans (3000 MW). Arrowheads indicate representative perivascular migration patterns for each genotype. Scale bar = 50 μm. (f) Quantification of the migrated distance of the cells depicted in (c). Each dot represents one cell. n indicates number of animals imaged. One way ANOVA with Tukey post hoc test. (g) Left: schematic representation of the experimental set up for in vitro migration assays with endothelial cells. Middle: merged fluorescent and phase contrast still images taken from time-lapse microscopy experiments of GFP-labeled imNSC1 and GSC1 (green) migrating towards brain microvascular endothelial cells (bmvEC, unlabeled cells) at the indicated time points. Right: quantification of boundary length at 60 hr. Students t-test. Scale bar = 500 μm. (h) Still fluorescence and phase contrast merged images of GFP-labeled imNSC2 and GSC2 migrating towards bmvEC (unlabeled, left) for 60 hr and quantification (right) as in (e). Error bars denote s.e.m., Students t-test. Scale bar = 500 μm. (i) Schematic representation of the experimental set up for in vitro migration assays toward recombinant ephrin-B2-Fc (left), phase contrast images (middle) and quantification (right) of imNSC1 and GSC1 migration against coated ephrinB2-Fc pre-clustered with fluorescently-labelled anti-Fc antibodies at 60 hr. Error bars denote s.e.m., Students t-test. Scale bar = 500 μm. Green dots denote boundary of ephrin-B2 coating identified by fluorescence. (j) Still images (left) and quantification (right) of GFP-labeled imNSC (GFP) migrating towards bmvEC (unlabeled) treated with control siRNA (Scr) or siRNA against Efnb2 (siEfnb2) for 60 hr. Scale bar = 500 μm. Error bars denote s.e.m., Students t-test. For this and later figures dots indicate individual data points and ***p<0.001; **p<0.01 and *<0.05. See also Figure 1—figure supplement 1 and Figure 1—source data 1.
-
Figure 1—source data 1
Raw data for all quantification of NSC/GSC migrated distance and boundary length shown in Figure 1.
- https://doi.org/10.7554/eLife.14845.004
Figure 1—figure supplement 1
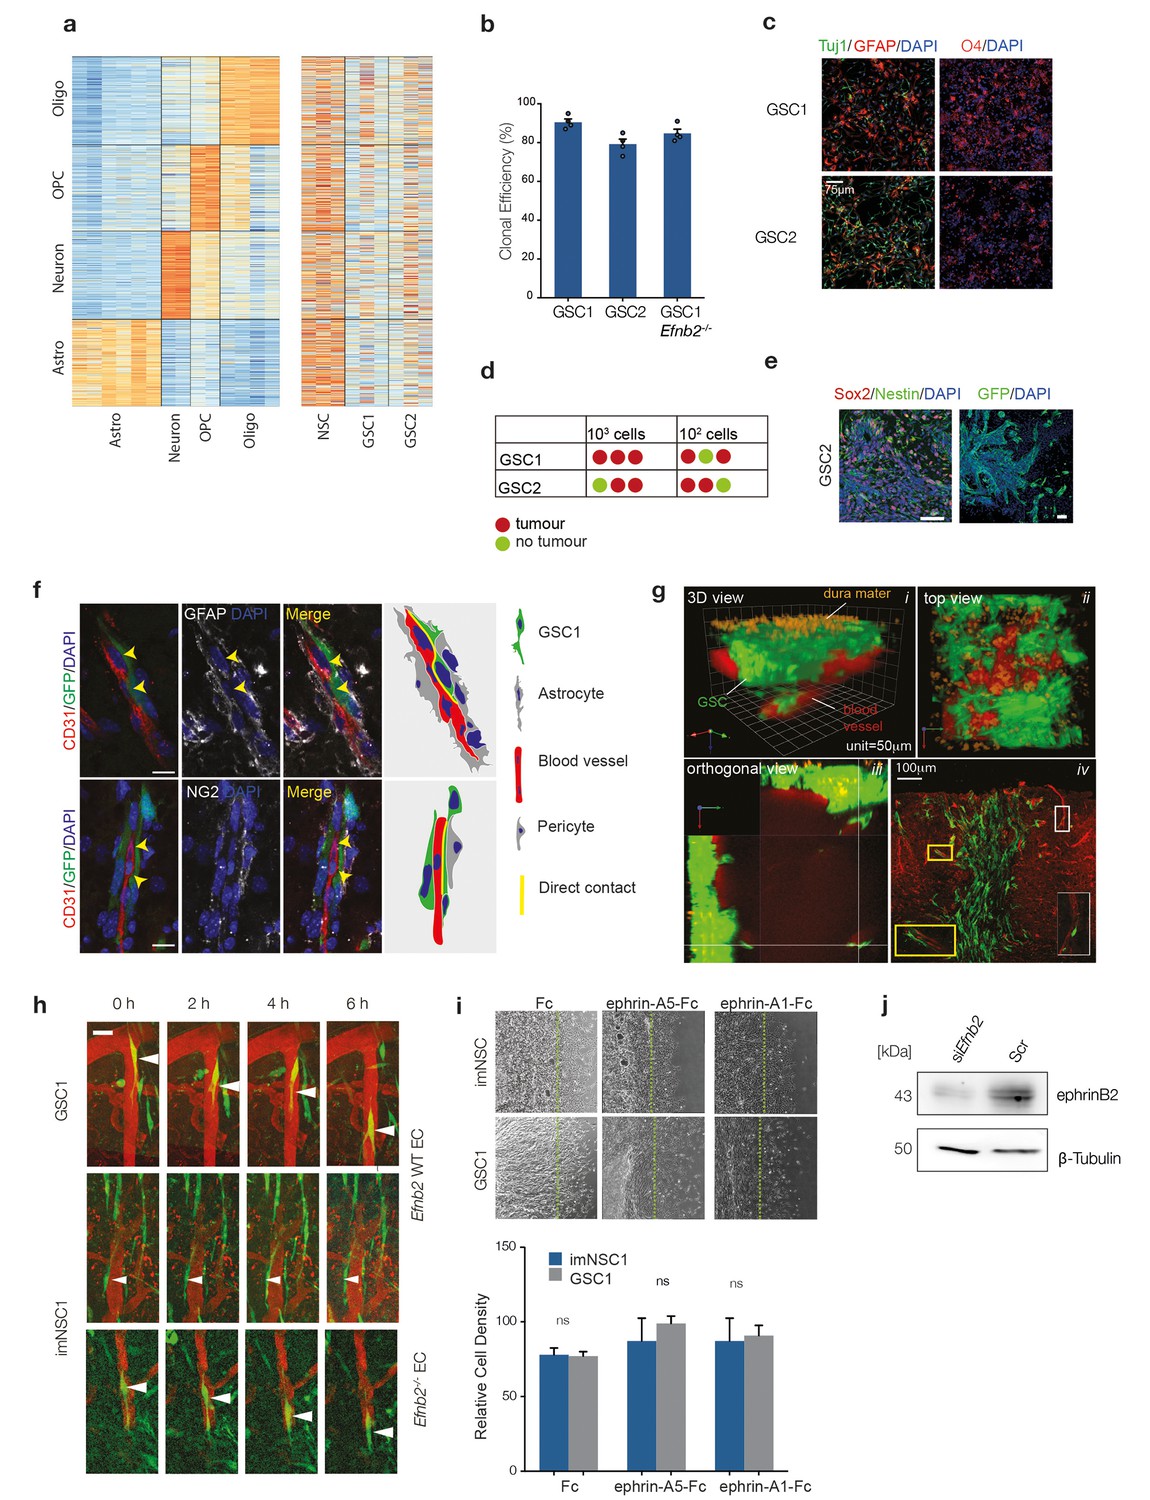
GSC1/2 resemble glioma stem-like cells.
(a) RNA-seq datasets by Zhang et al. were used to generate sets of astrocyte-, oligodendrocyte-, OPC- and neuron-specific marker genes (left heatmap) and expression of these cell-type-specific gene sets was determined in cultured normal neural stem cells (NSC) and GSC lines 1 and 2 (right heatmap) (Zhang et al., 2014). See also Tables 1, 2 and Supplementary files 1, 2 for gene set enrichement scores. (b) Quantification of GSC1, GSC2 and GSC1 Efnb2-/- clonal efficiency expressed percentage of colonies formed over total number of cells. n = 3 (c) Representative immunofluorescence images of GSC1 and 2 differentiated for 4 days. Cells were stained for the neuronal marker Tuj (green), the astrocyte marker GFAP (red, left) and the oligodendrocyte marker O4 (red, right) and counterstained with DAPI (blue). n = 3 Scale bar = 60 μm (d) In vivo limiting dilution analysis of GSC1 and 2 tumour-initiation potency. As little as 100 were sufficient to generate an aggressive tumour mass for both GSC1 and GSC2. (e) Representative immunofluorescence images of GSC2 tumours stained for Sox2 (red) and Nestin (green, left) and GFP at the tumour margin (green, right) confirming their GBM nature and invasiveness. Scale bars = 50 μm n = 2. (f) Representative immunofluorescence images of GFP labeled GSC1 tumours stained for vascular marker CD31 (red), the astrocyte marker GFAP (grey, upper panels) and the pericyte marker NG2 (grey, lower panels). The arrows indicate sites of direct contact between GSC and endothelial cells resulting from displacement of astrocytic endfeet and pericytes. Schematic representation of the interactions is drawn on the right hand side of the picture for clarity. (g) Side and top view of intravital 3D reconstructions (i and ii) of GSC1 injected into the cortex of syngeneic mice under a chronic cranial window. Note that the cells span a depth of 25–350 μm under the dura mater (orange autofluorescence). Panel iii depicts orthogonal views taken from the same tumour, which show depth at which GSC/vascular interactions have been imaged for all experiments presented. Panel iv is a post-mortem immunofluorescence analysis of a craniotomy tumour stained for GFP (green) and CD31 (red), indicating that tumours cells are all contained within the brain parenchyma. Examples of GSC/vascular interactions analysed by intravital imaging are magnified in the boxed areas of the pictures. (h) Intravital 2-photon micrographs of GFP-labeled GSC1 and imNSC1 cells injected into the cortex of Efnb2 WT mice and endothelial-specific Efnb2-/- mice and imaged 7 days later over 6 hr through an intracranial window at a depth of 200 μm. The vasculature was labeled by tail-vein injection of Tx-red conjugated Dextrans (3000 MW). Arrowheads indicate representative perivascular migration patterns for each genotype. Note that single imNSC and GSC cells display identical behaviours as cells in groups (Figure 1c). Scale bar = 50 μm. (i) Phase contrast images (upper panels) and quantification (lower panels) of imNSC1 and GSC1 migration against coated Fc (left), ephrinA5-Fc (middle) and ephrinA1-Fc (right) ligands. Error bars denote s.e.m., Student t-test. n = 3 (j) Western analysis of ephrin-B2 levels in bmvEC transfected with control (scr) or Efnb2 specific (siEfnb2) siRNA, confirming efficiency of the knock-down. n = 2. See also Figure 1—figure supplement 1—source data 1.
-
Figure 1—figure supplement 1—source data 1
Raw data for all quantitative analyses shown in Figure 1—figure supplement 1.
- https://doi.org/10.7554/eLife.14845.006
Figure 2 with 1 supplement
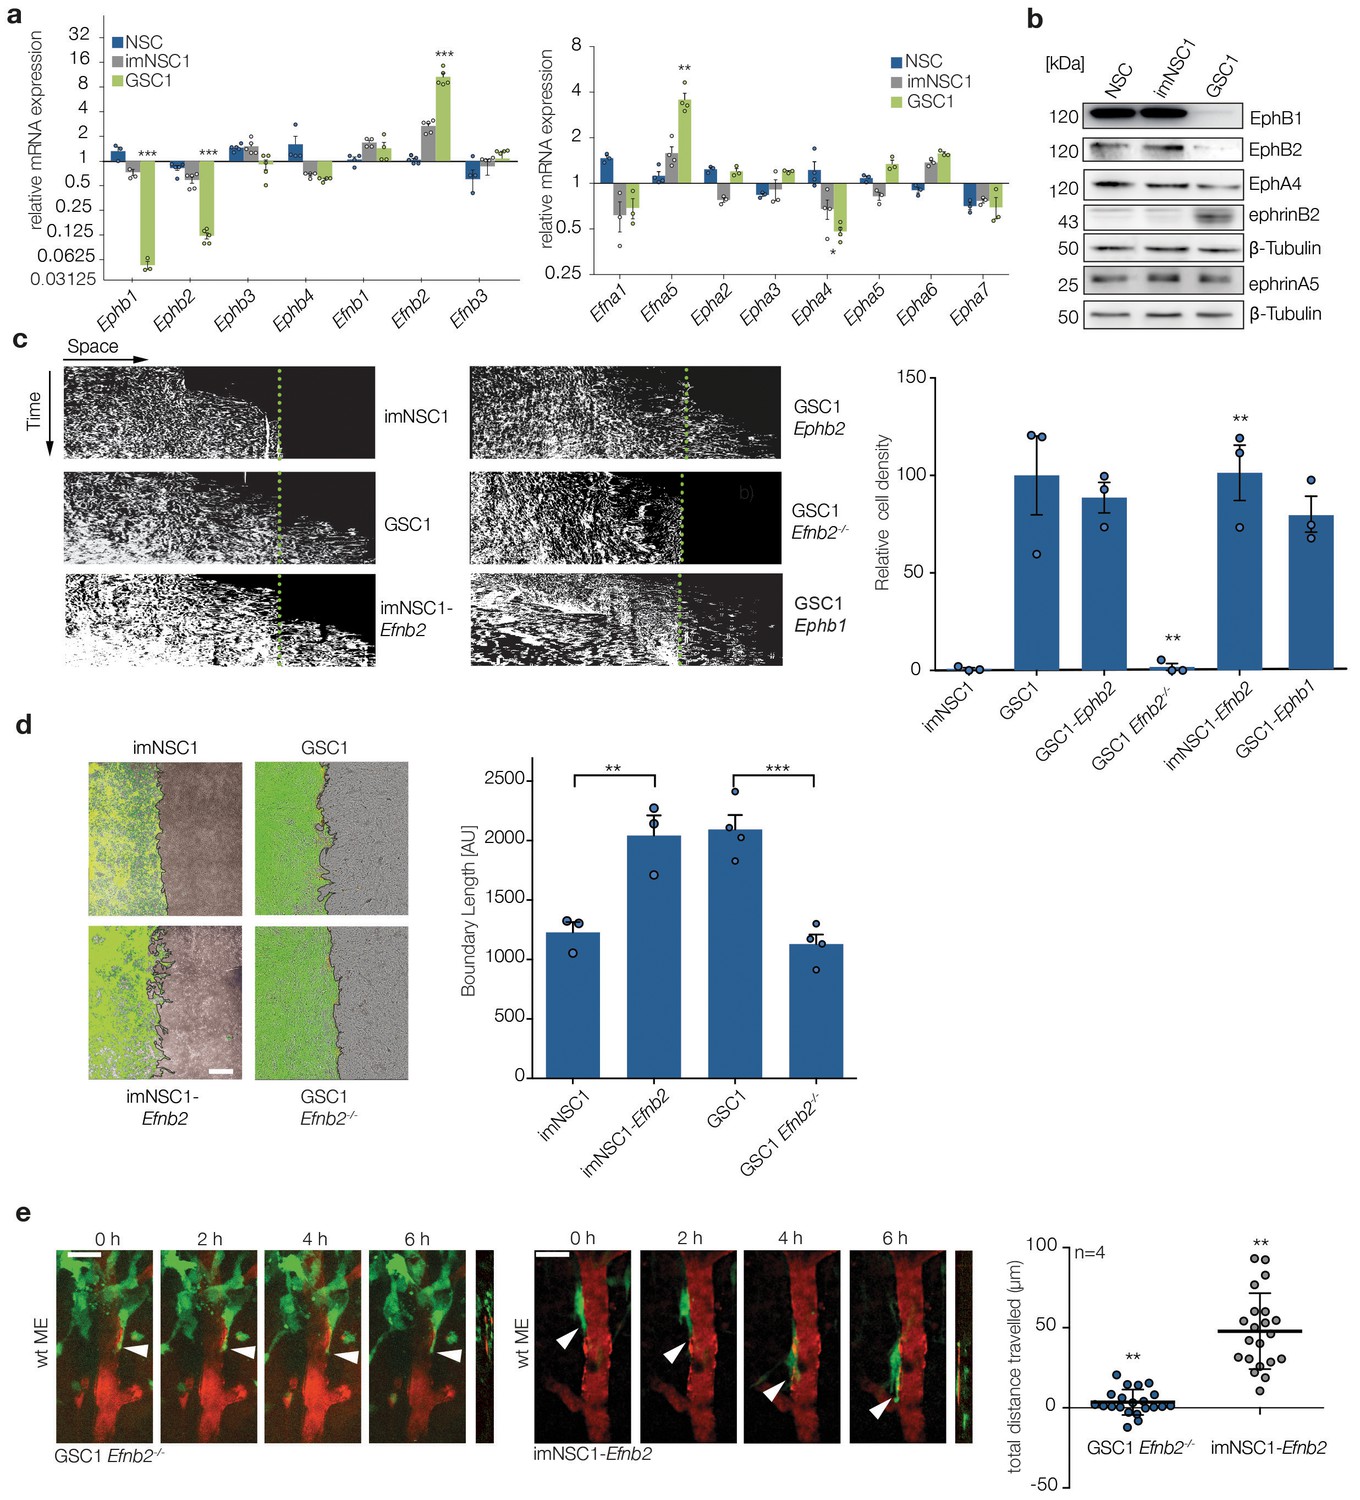
Upregulation of ephrin-B2 in GSCs enables perivascular invasion (a) Quantitative RT-PCR analysis of indicated Eph receptors and ephrin ligands.
Error bars denote s.e.m., p values of differences in expression between imNSC1 and GSC1 are shown. Multiple t-test analysis. (b) Western analysis of levels of the indicated proteins in normal neural stem cells (NSC), imNSC1 and GSC1. n = 3 (c) Kymographs from time-lapse experiments of the indicated cell types migrating against coated ephrinB2-Fc over 60 hr. Quantification of the kymographs is shown on the right. Error bars denote s.e.m., one way ANOVA with Tukey post hoc test. (d) Overlaid fluorescent and phase contrast images (left) and quantifications (right) of boundaries formed at 60 hr of GFP-labeled imNSC1/GSC1 (green) migrating towards bmvEC (unlabeled) as indicated. Error bars denote s.e.m., one way ANOVA with Tukey post hoc test. Scale bar = 500 μm. (e) Representative 2-photon microscopy micrographs of GFP-labeled imNSC1-Efnb2 and GSC1Efnb2-/- imaged as in 1e. Quantification of migrated distances is shown on the right. Dots represent single cells measured across multiple animals. One way ANOVA with Tukey correction. p values are given compared to GSC1 for GSC1Efnb2-/- and imNSC1 for imNSC1-Efnb2. Scale bar = 50 μm. See also Figure 2—figure supplement 1 and Figure 2—source data 1.
-
Figure 2—source data 1
Raw data for qRT-PCR analysis and quantifications of kymographs, boundary assays and migrated distance in vivo of NSC/GSC cells shown in Figure 2.
- https://doi.org/10.7554/eLife.14845.014
Figure 2—figure supplement 1
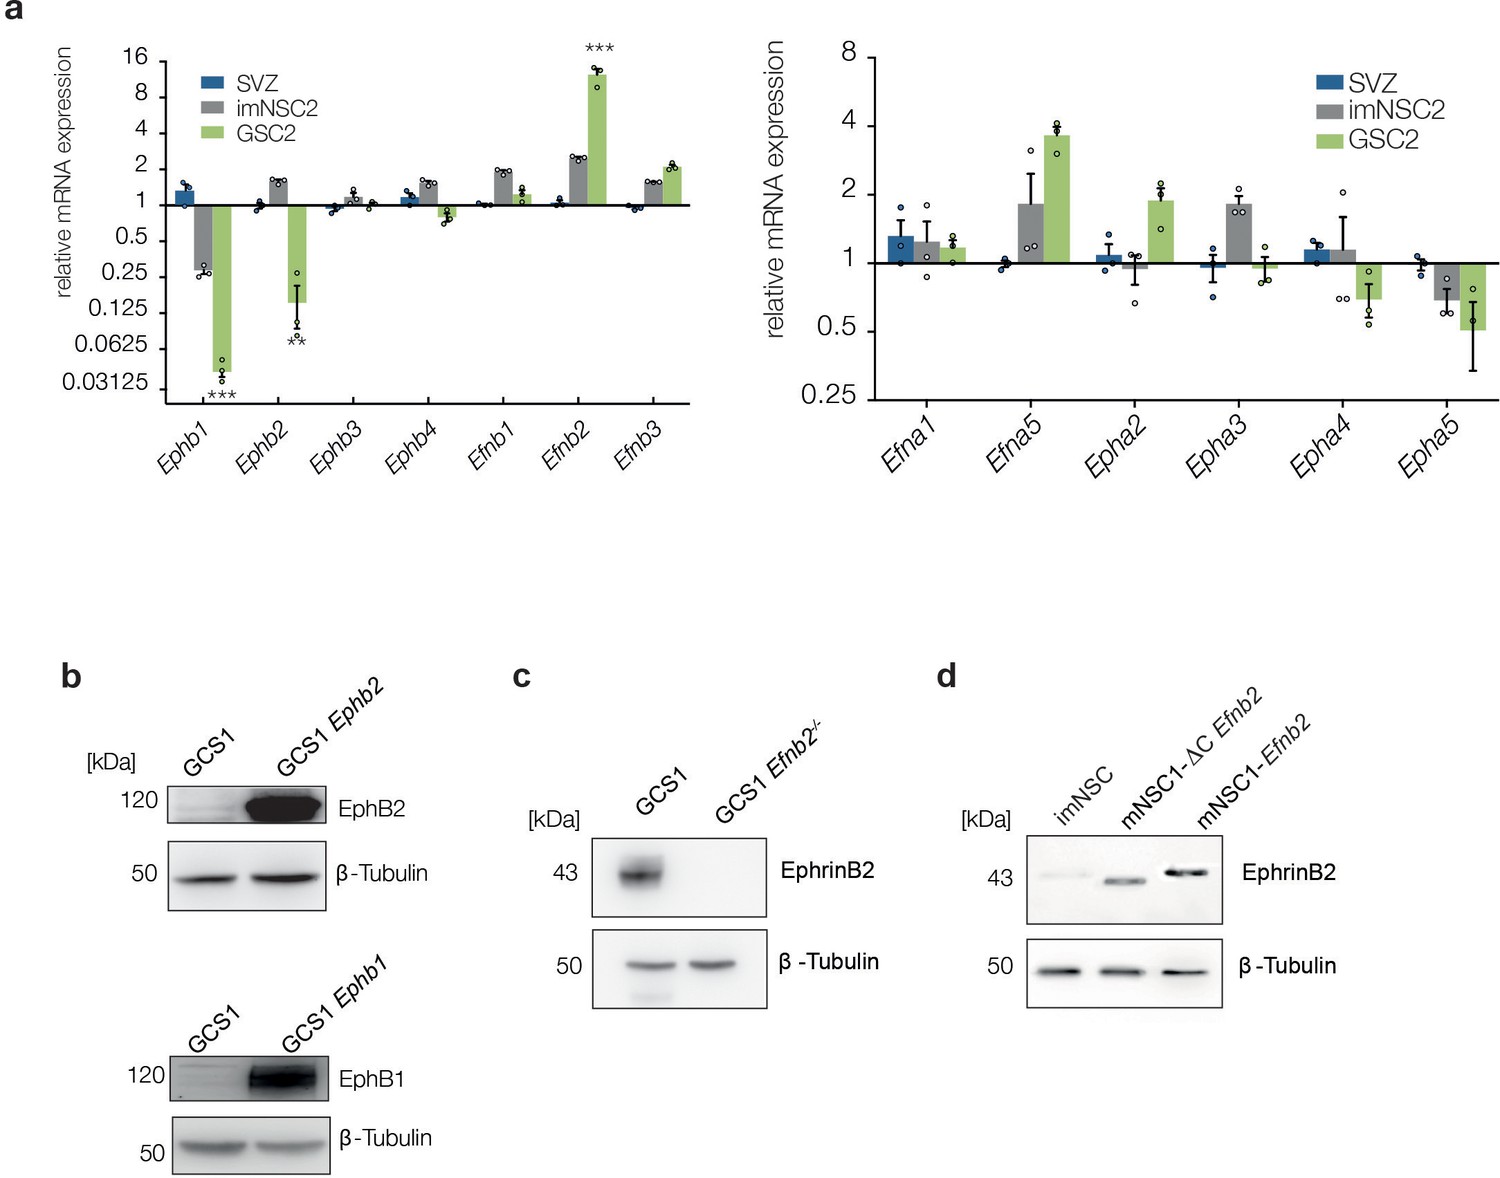
GSC2 show similar changes in Eph/ephrin levels as GSC1.
(a) Quantitative RT-PCR analysis of indicated Eph receptors and ephrin ligands in normal NSC, imNSC2 and GSC2 cells. Error bars denotes s.e.m. Multiple t-test. (b–d) Western analysis of EphB2, EphB1 and Ephrin-B2 in GSC1 cells and imNSC of indicated genotype. β-tubulin served as loading control. See also Figure 2—figure supplement 1—source data 1.
-
Figure 2—figure supplement 1—source data 1
Raw data for all quantitative analyses shown in Figure 2—figure supplement 1.
- https://doi.org/10.7554/eLife.14845.016
Figure 3 with 1 supplement
ephrin-B2 upregulation drives perivascular migration by saturating Eph forward signalling through homotypic cell-cell interactions.
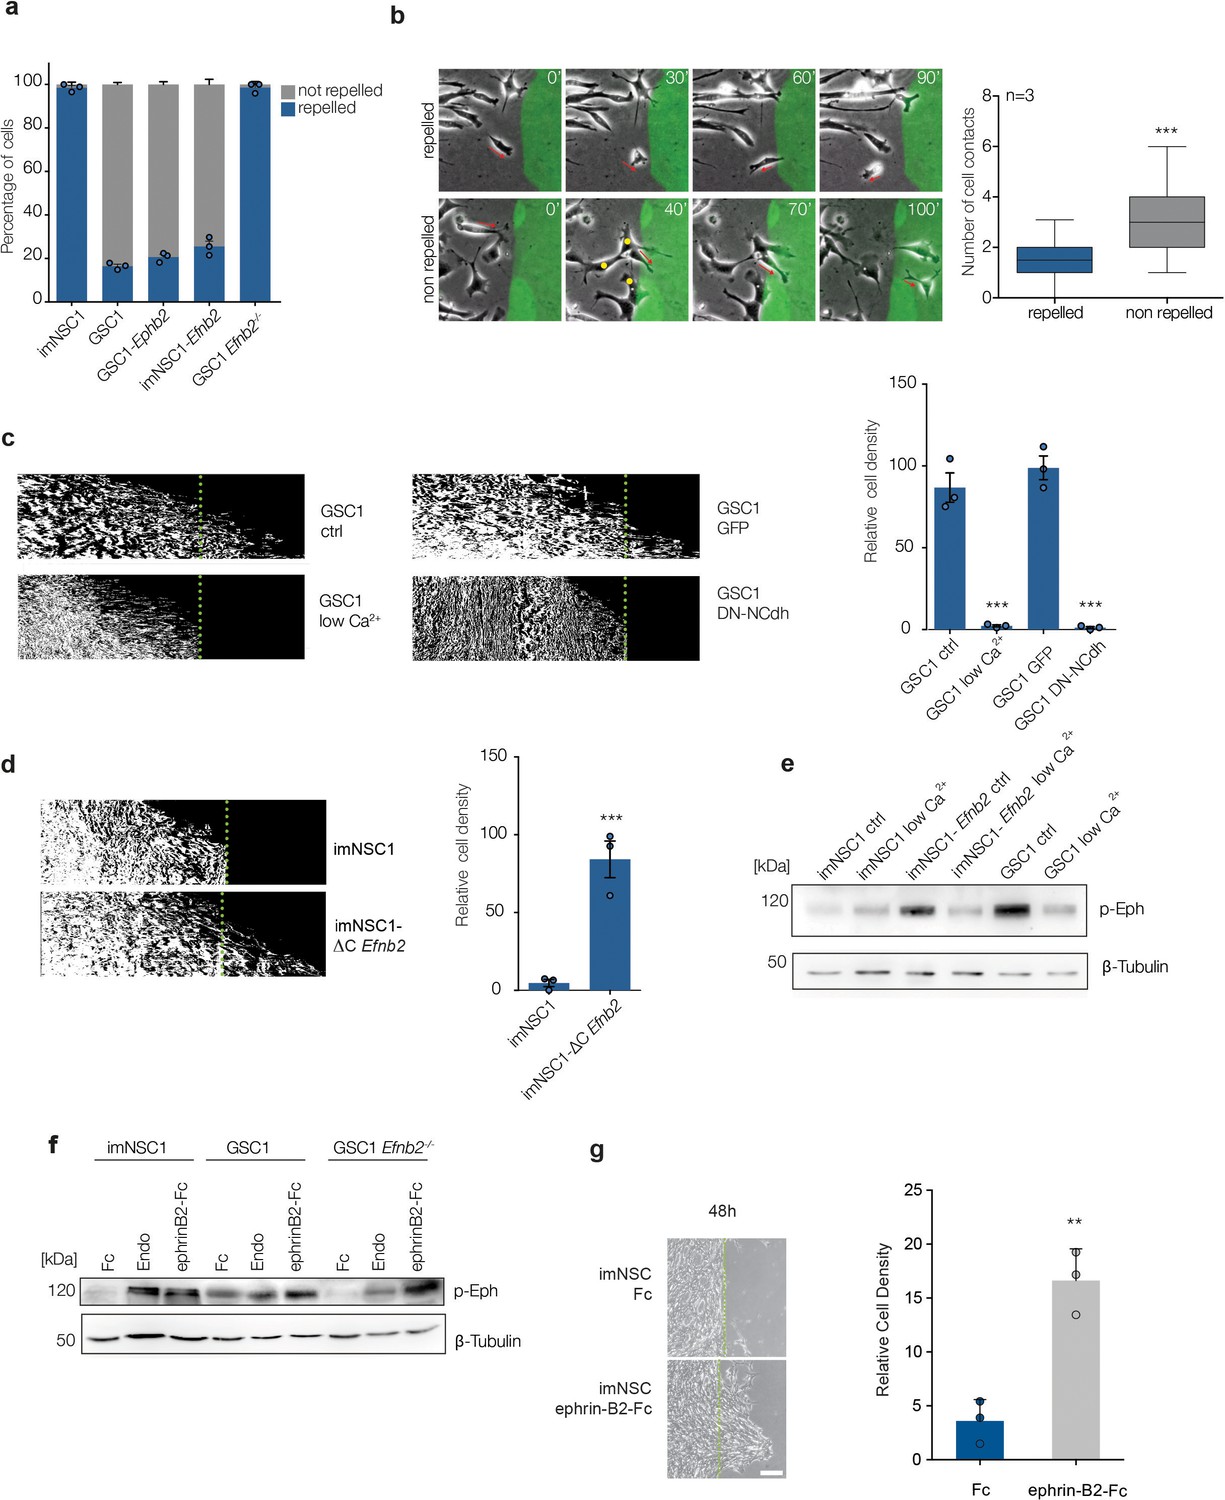
(a) Quantification of cell behavior upon initial contact with coated ephrin-B2. n = 3, error bars denote s.e.m. (b) Left: representative images taken from videos of GSC1 cells as they first come in contact with coated ephrin-B2 (green). Right: quantification of the number of homotypic GSC1 cell-cell contacts at time of initial interaction with ephrin-B2. A minimum of 50 cells were counted in each experiment. Error bar denotes St.D, Student t-test. (c) Representative kymographs (left) and quantifications (right) of GSC1 migrating towards ephrin-B2 that were either cultured in normal media (ctrl) or low Ca2+ conditions (low Ca2+), or transduced with GFP control (GFP) or dominant negative N-Cadherin (DN-NCdh) adenoviral constructs. Dotted lines demarcate coated ephrin-B2 boundary. n = 3, error bars denote s.e.m., Student t-test. (d) Kymographs and quantifications of the responses of imNSC1 and imNSC1-∆CEfnb2 to coated ephrin-B2 ligands. n = 3, error bars denote s.e.m., Student t-test. (e) Western analysis of the levels of activated Eph receptors (p-Eph) in the indicated cell types cultured in either normal growth media (ctrl) or calcium depleted (low Ca2+) conditions. β-tubulin served as loading control. n = 3 (f) Western blots of p-Eph levels in indicated cells cultured either with control proteins (Fc), endothelial cells (Endo) or ephrinB2-Fc (ephrinB2-Fc) for 18 hr. β-tubulin is used as loading control. n = 3 (g) Phase contrast images (left) and quantification (right) of imNSC1 migration towards coated ephrin-B2-Fc following pre-treatment with either control (Fc) or clustered ephrinB2-Fc to activate Eph forward signalling. Experiments were stopped at 48 hr to assure maximal stimulation of the cells throughout the assay. Green dots denote boundary of ephrin-B2 coating identified by fluorescence. n = 3, error bars denote s.e.m., Students t-test. Scale bar = 250 μm. See also Figure 3—figure supplement 1 and and Figure 3—source data 1.
-
Figure 3—source data 1
Raw data for all quantifications of NSC/GSC migration assays shown in Figure 3.
- https://doi.org/10.7554/eLife.14845.018
Figure 3—figure supplement 1
Increased repulsion between ephrin-B2 expressing cells leads to greater migration velocity and distance.
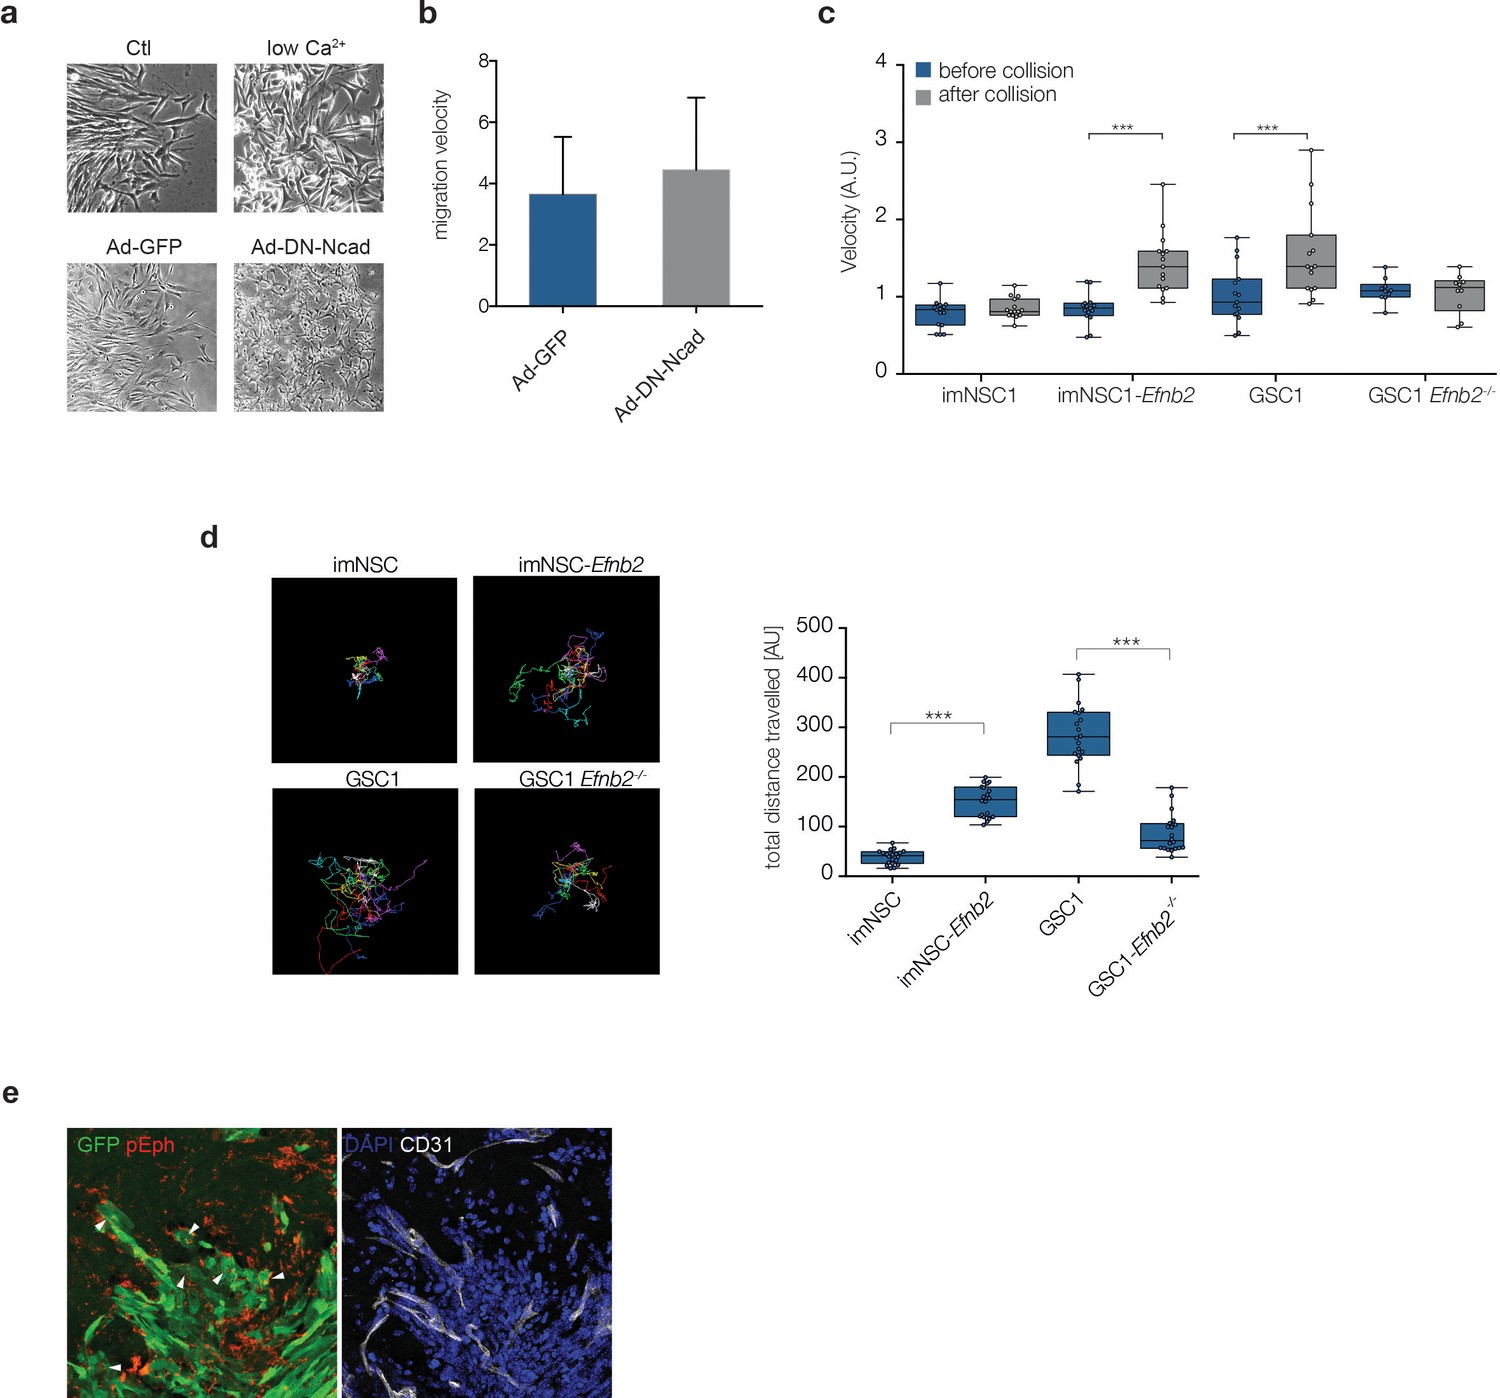
(a) Representative phase contrast images of GSC1 cultured either in normal media (Ctl) or low Ca2+ conditions (low Ca2+), or transduced with GFP control (Ad-GFP) or dominant negative N-Cadherin (Ad-DN-NCdh) adenoviral constructs. Note the loss of cell-cell contacts in both treatment conditions. (b) Quantification of migration velocity of Ad-GFP and Ad-DN-Ncad GSC1 cells, indicating no change in GSC1 cell motility following disruption of cell-cell junctions. (c) Quantification of the velocity of indicated cell types 60 min before (blue) and after (grey) homotypic collisions in sparse cultures. Error bars denote St.D., One-way ANOVA with Bonferonni post-hoc test. (d) Visual representation of the migration path of individual cells tracked over 20 hr . Migration tracks are plotted from a common origin for clarity (left). Right: quantification of total migrated distance. Error bars denote St.D., One way ANOVA. (e) Representative immunofluorescence images of GFP labelled GSC1-derived tumours stained for pEph (red) and GFP (green, left) and the vascular marker CD31 (grey, right). Arrows indicate examples of active Eph signaling within GFP-labelled tumour cells. See also Figure 3—figure supplement 1—source data 1.
-
Figure 3—figure supplement 1—source data 1
Raw data for all quantitative analyses shown in Figure 3—figure supplement 1.
- https://doi.org/10.7554/eLife.14845.020
Figure 4 with 1 supplement
ephrin-B2 is a glioblastoma oncogene controlling anchorage independent proliferation.
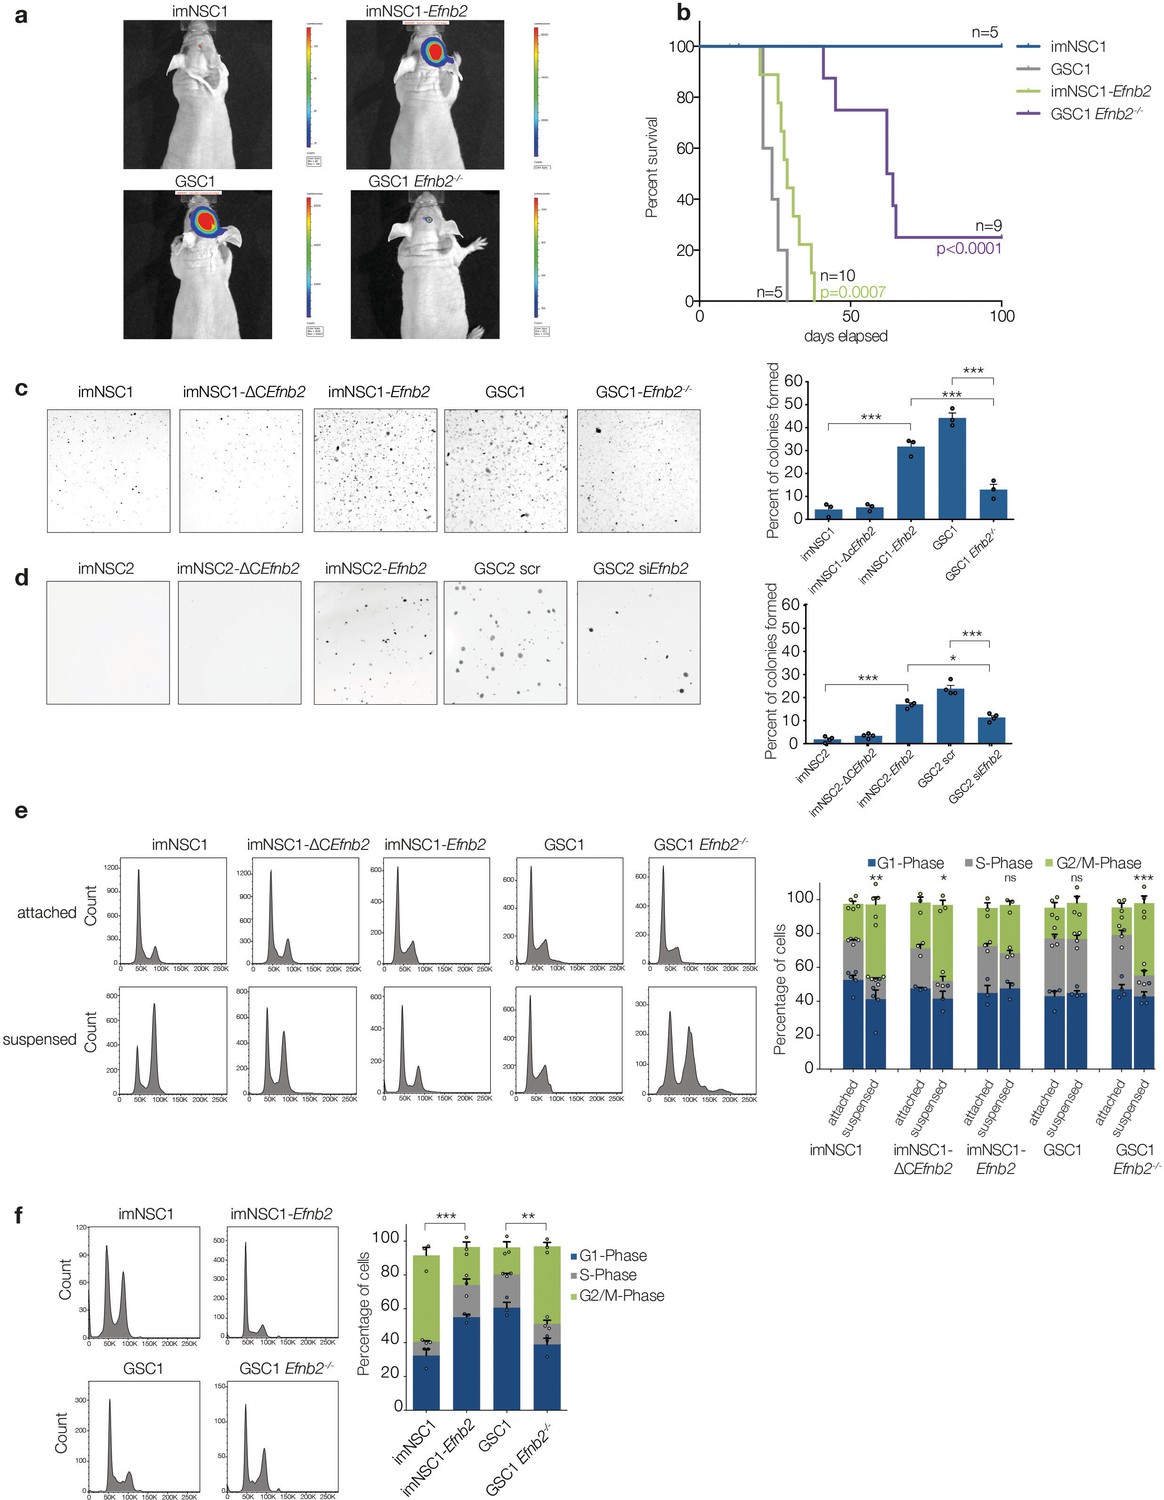
(a) Representative bioluminescent images of nude mice 20 days after intracranial injection of imNSC1, imNSC1-Efnb2, GSC1, GSC1Efnb2-/-. (b) Kaplan-Meier survival plots of the mice depicted in (a). Significance is given relative to imNSC1 for imNSC1-Efnb2 and to GSC1 for GSC1-Efnb2-/-. Log Rank Mantel Cox. (c, d) Left: Representative micrographs of GSC1 (c) and GSC2 (d) cells of indicated genotype grown in soft agar for 10d. Right: quantification of number of colonies formed in soft agar in all cultures, expressed as percentage over total number of seeded cells. n = 3, error bars depict s.e.m. One way ANOVA with Tukey correction. (e) Left: representative FACS profiles of cells grown in attachment or methylcellulose for 72 hr, showing DNA content by propidium iodide (PI) staining. Right: quantification of cell cycle phases from the FACS profiles. n = 3–5 as indicated by the dots. Error bars depict s.e.m., p values indicate significance of changes in G2/M phase. (f) Representative PI FACS profiles and quantifications of imNSC and GSC1 isolated from brain tissue 7 days after intracranial injection. n = 3. Error bars depict s.e.m. One way ANOVA with Tukey post hoc test shown for G2/M phase. See also Figure 4— figure supplement 1 and Figure 4— source data 1.
-
Figure 4—source data 1
Raw data for Kaplan Meier analysis, number of colonies formed in soft agar and cell-cycle analysis presented in Figure 4
- https://doi.org/10.7554/eLife.14845.022
Figure 4—figure supplement 1
Anchorage-independent proliferation is independent of homotypic cell-cell contacts.
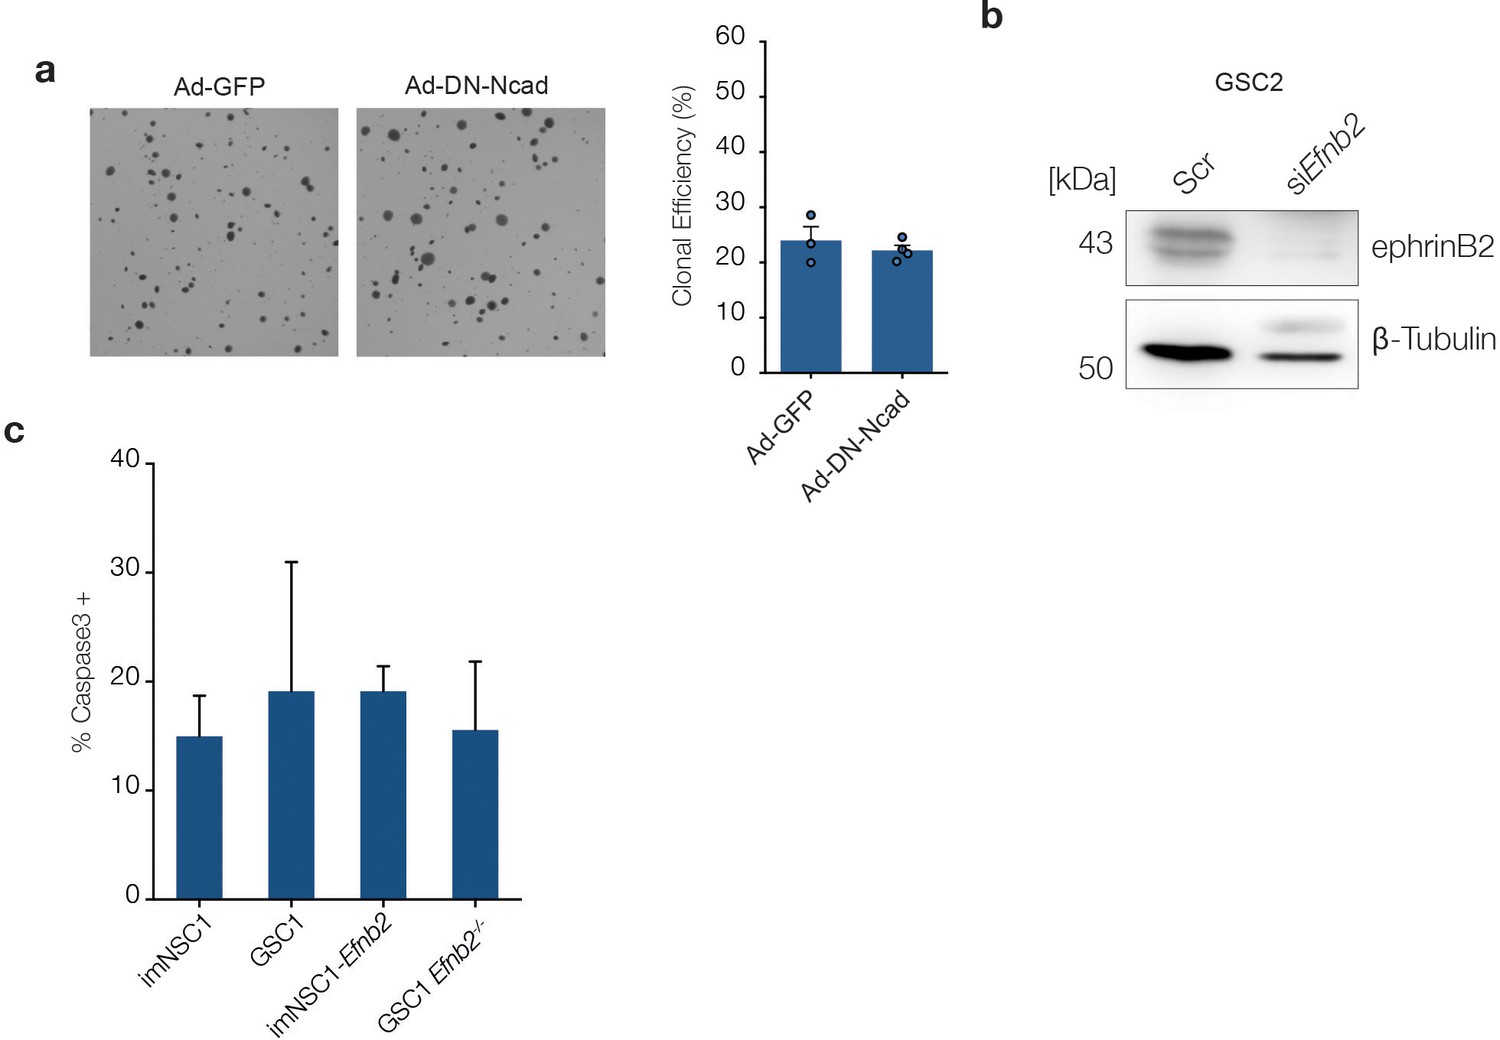
(a) Left: representative phase contrast images of imNSC1-Efnb2 cells transduced with GFP- (Ad-GFP) or dominant negative N-Cadherin- adenoviruses (Ad-DN-Ncad) and cultured in soft agar for 10 days. Right: quantification of the percentage of cells forming colonies in soft agar. Error bars denote s.e.m. n = 3. (b) Western analysis of ephrin-B2 levels in GSC2 transfected with scrambled (scr) or Efnb2-specific (siEfnb2) siRNAs, confirming efficiency of the knock-down. n = 2 (c) Quantification of activated caspase3 positive cells in the indicated methylcellulose cultures. Values are expressed as percentage of total number of cells. See also Figure 4—figure supplement 1—source data 1.
-
Figure 4—figure supplement 1—source data 1
Raw data for all quantitative analyses shown in Figure 4—figure supplement 1
- https://doi.org/10.7554/eLife.14845.024
Figure 5 with 1 supplement
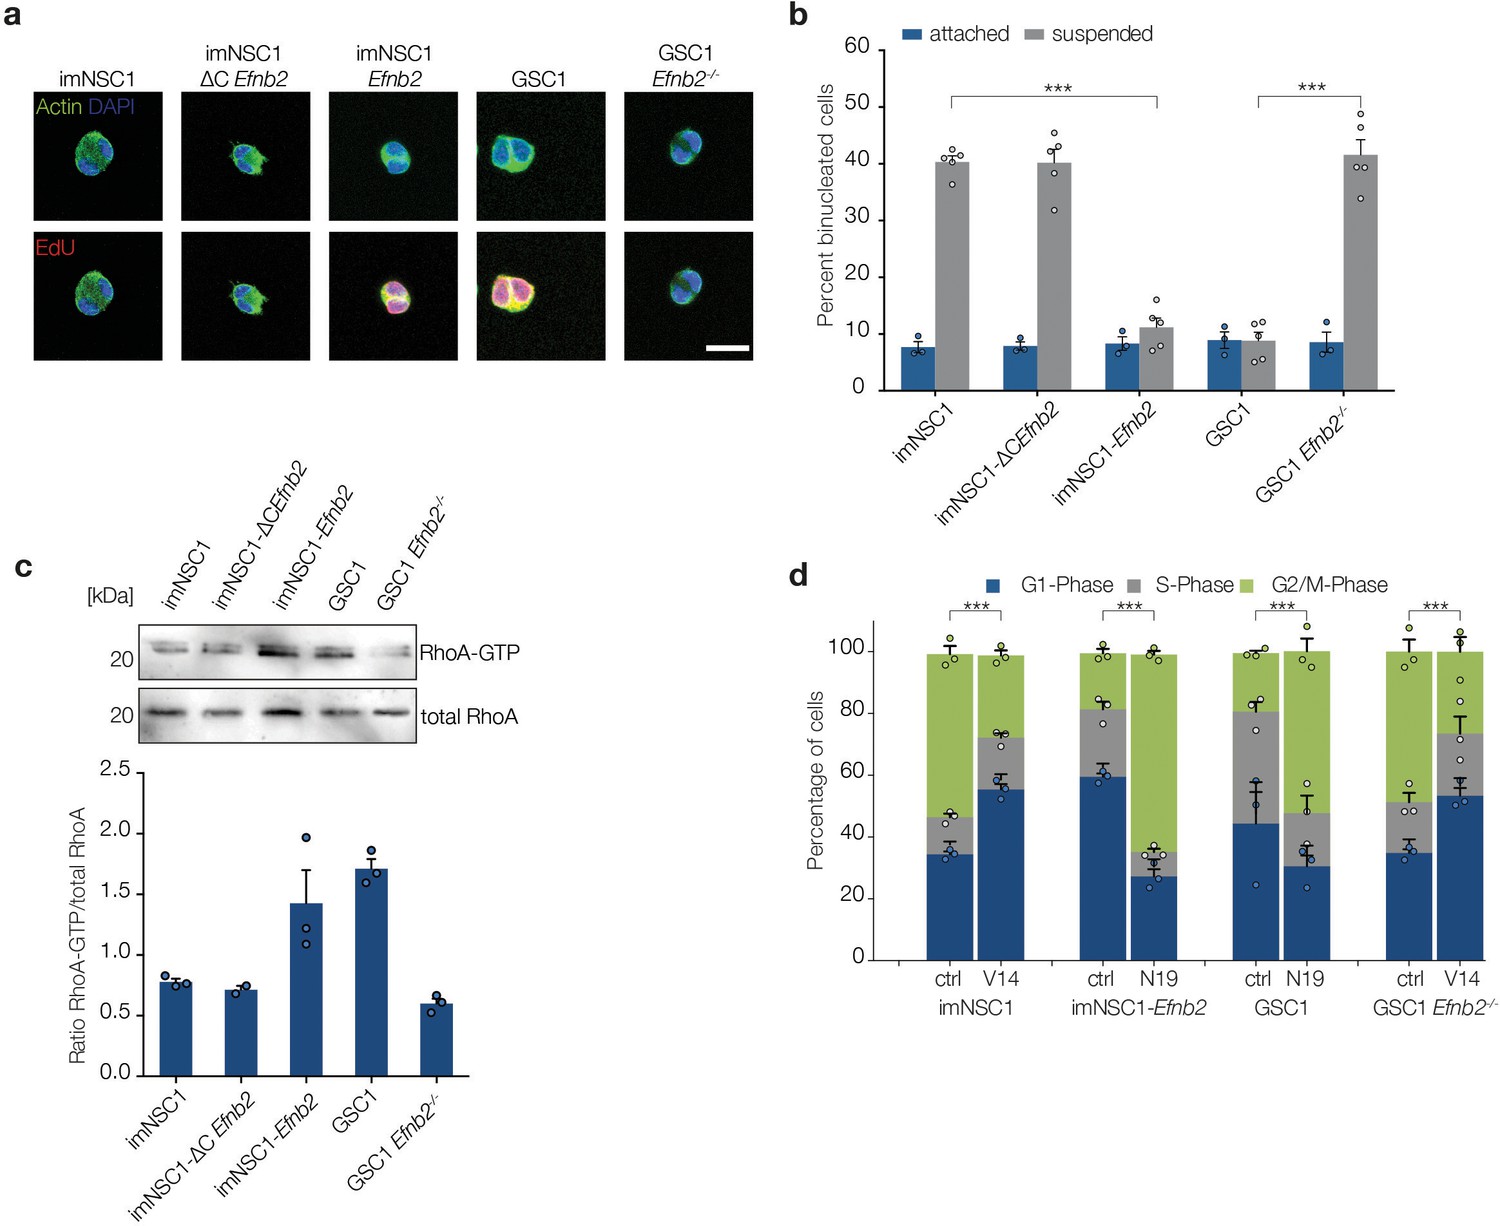
ephrin-B2 mediates cytokinesis in the absence of anchorage through RhoA.
(a) Representative fluorescent images of binucleated cells grown in suspension for 24 hr and stained with phalloidin (green) to label cortical actin and EdU (red) to distinguish cycling from arrested cells. Scale bar = 20 μm. (b) Quantification of binucleated cells in indicated attached and suspended cultures. Values represent percentages over total number of cells. n = 4, error bars denote s.e.m. Two way ANOVA with Tukey post hoc test. (c) Western analysis of RhoA pulldown assays showing levels of activated RhoA (RhoA-GTP) and total RhoA levels in indicated cells grown in suspension for 24 hr . Bottom graph shows quantifications of activated RhoA levels from the western blots. n = 3. Error bars indicate s.e.m. (d) Quantification of the PI cell cycle profile as measured by FACS. Cells transfected with either constitutively active RhoA (V14) or dominant negative RhoA (N19) were grown in suspension for 24 hr . n = 3, error bars depict s.e.m. One way ANOVA with Tukey post hoc test was used to calculate p values for differences in G2/M phase of each suspended culture relative to corresponding attached cultures. See also Figure 5—figure supplement 1 and Figure 5—source data 1.
-
Figure 5—source data 1
Raw data for quantifications of binucleated cells and cell cycle analysis presented in Figure 5.
- https://doi.org/10.7554/eLife.14845.026
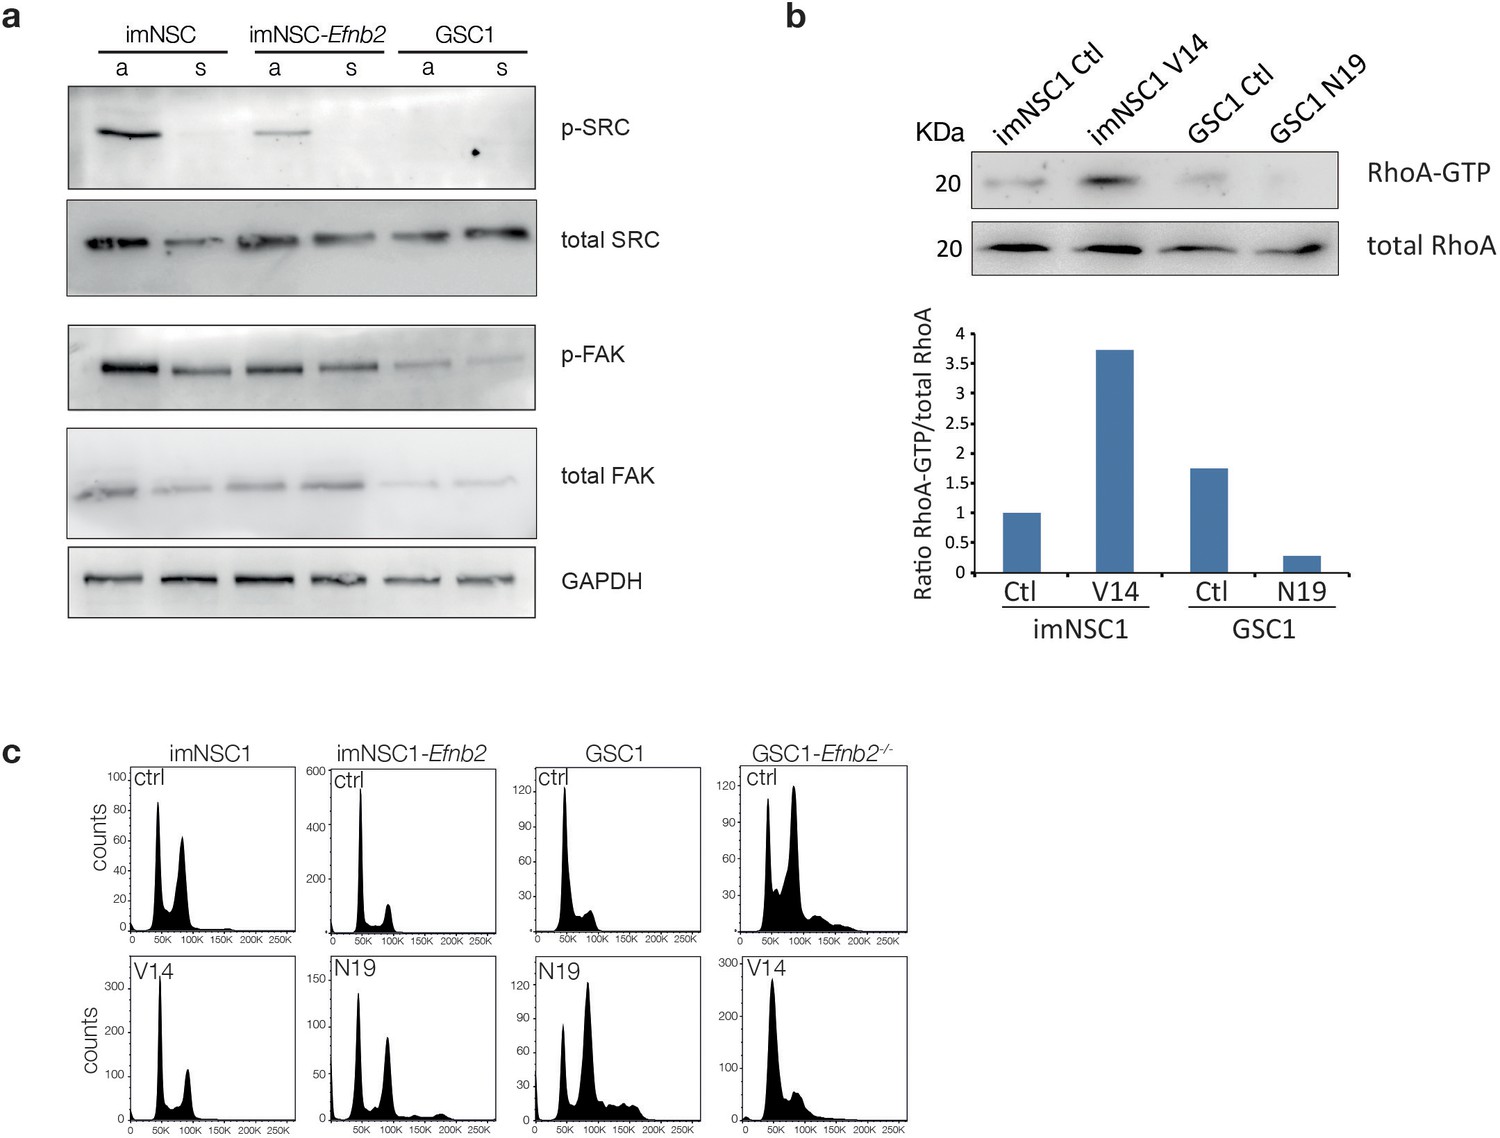
Figure 5—figure supplement 1
Src and FAK do not mediate anchorage-independent proliferation downstream of ephrin-B2.
(a) Western analysis of levels of indicated proteins in imNSC1, imNSC1-Efnb2 and GSC1 cultured in attachment (a) and suspension (s). n = 2 (b) Western analysis of RhoA pulldown assays showing levels of activated RhoA (RhoA-GTP) and total RhoA levels following transfection of imNSC1 with constitutively active RhoA (V14) and GSC1 with dominant negative RhoA (N19). Note that as expected V14 activates RhoA and N19 inhibits RhoA, confirming efficacy of the mutant constructs. Bottom graph shows quantifications of activated RhoA levels from the western blots. n = 2. (c) Representative DNA cell-cycle profiles of indicated cells transfected with empty vector control (ctrl), dominant negative RhoA (N19) or constitutively active RhoA construct (V14) and cultured in methylcellulose for 24 hr. n = 3.
Figure 6 with 1 supplement
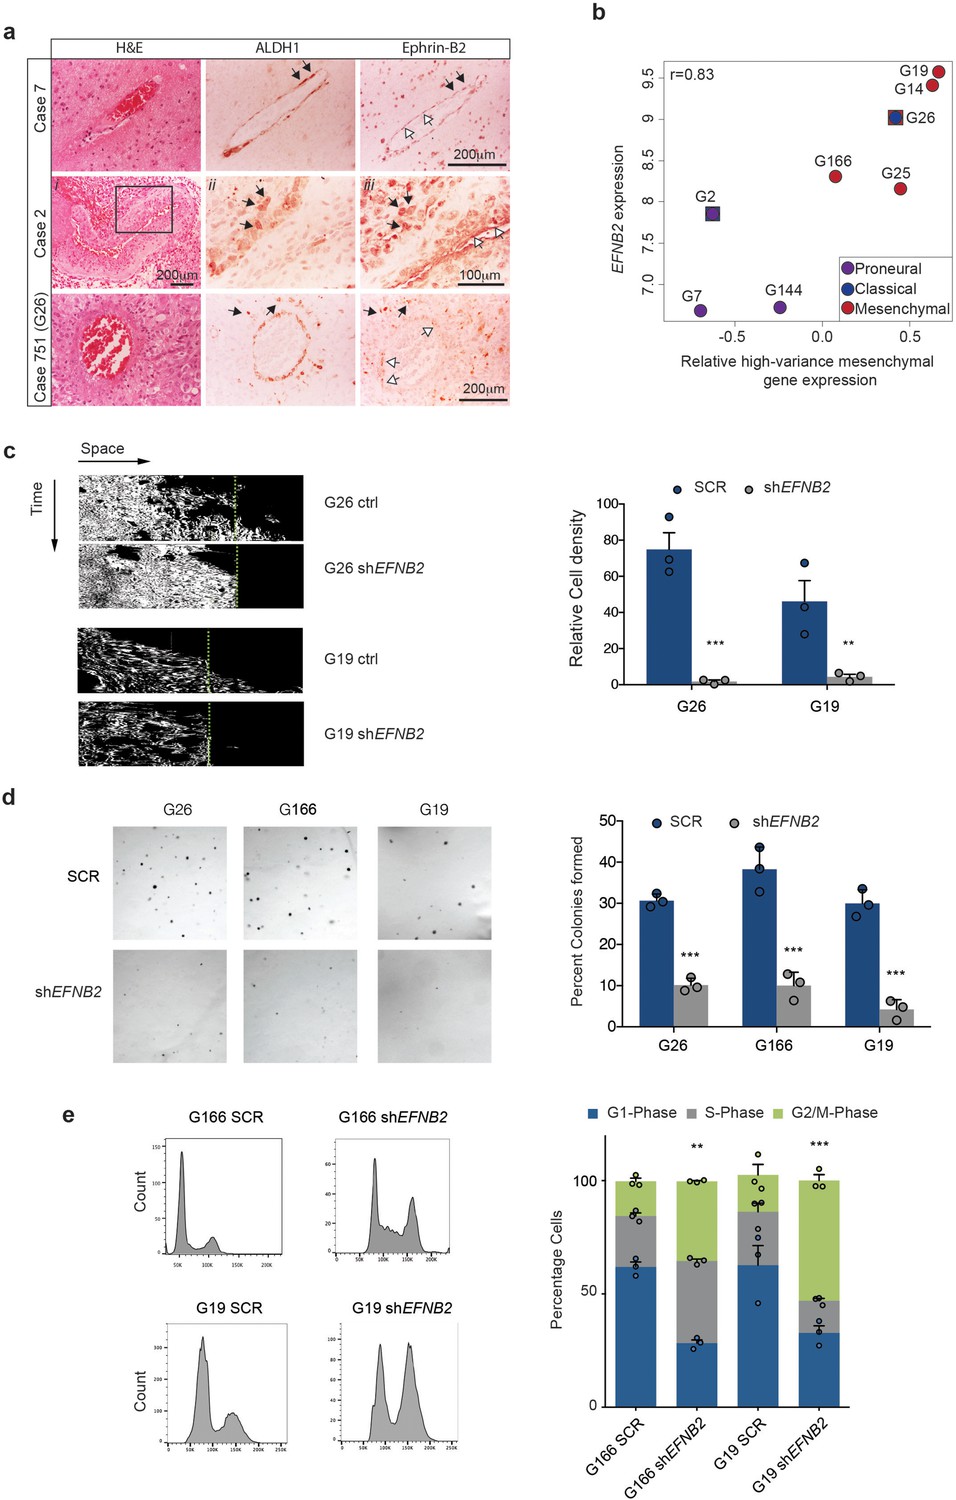
Ephrin-B2 is expressed in human GSC and drives their invasion and proliferation in vitro.
(a) Haematoxylin-eosin (H&E), ALDH1 and Ephrin-B2 HRP staining of infiltrative margins of patient tumours. Three different glioblastomas of 10 analysed are shown. Atypical tumour cells expressing both ALDH1 and EphrinB2 (black arrows) can be identified around both normal and fibrotic co-opted vessels (white arrows) in all cases. Images ii and iii for Case 2 are close ups of the artery in i, showing that ALDH1+/EphrinB2+ cells present irregular and hyperchromatic nuclei characteristic of tumour cells. Box denotes magnified area. Case 751 is the original tumour from which G26 cells have been isolated. (b) Correlation plot between EFNB2 and mesenchymal gene expression levels (Z-score) in 8 primary human GSC lines. Mesenchymal Z-score was calculated using signature marker genes with a variance greater than 0.1 (high-variance genes) across GSC lines. Verhaak classification of each line into disease subtype using the same cutoff is also shown. Of note, G2 and G26 display dual signatures as indicated. G26 carries a deletion in the NF1 gene. (c) Representative kymographs (left) and quantifications (right) of human primary GSC lines G26 and G19, stably expressing scrambled shRNA (ctrl,) or shRNA directed against EFNB2 (shEFNB2). Note that while migration of human GSC is less pronounced than in mouse cells, EFNB2 depletion results in complete inhibition of migration. Error bars denote s.e.m., n = 3. Students t-test. Green dots denote boundary of ephrin-B2 coating identified by fluorescence. (d) Left: Representative micrographs of SCR or shEFNB2 transduced G26, G166 and G19 cells cultured in soft agar for 14d. Right: quantification of number of colonies formed in soft agar in all cultures, expressed as percentage over total number of seeded cells. n = 3, error bars depict s.e.m. One way ANOVA with Tukey correction. (e) Left: representative FACS profiles of G166 and G19 cells ctrl or shEFNB2 grown in soft agar for 72 hr, showing DNA content by propidium iodide (PI) staining. Right: quantification of cell cycle phases from the FACS profiles. n = 3 as indicated by the dots. Error bars depict s.e.m., One way ANOVA with Tukey post hoc test shown for G2/M phase. See also Figure 6—figure supplement 1 and Figure 6—source data 1.
-
Figure 6—source data 1
Raw data for quantifications of kymographs, number of colonies formed in soft agar and cell-cycle analysis of human GSC presented in Figure 6.
- https://doi.org/10.7554/eLife.14845.029
Figure 6—figure supplement 1
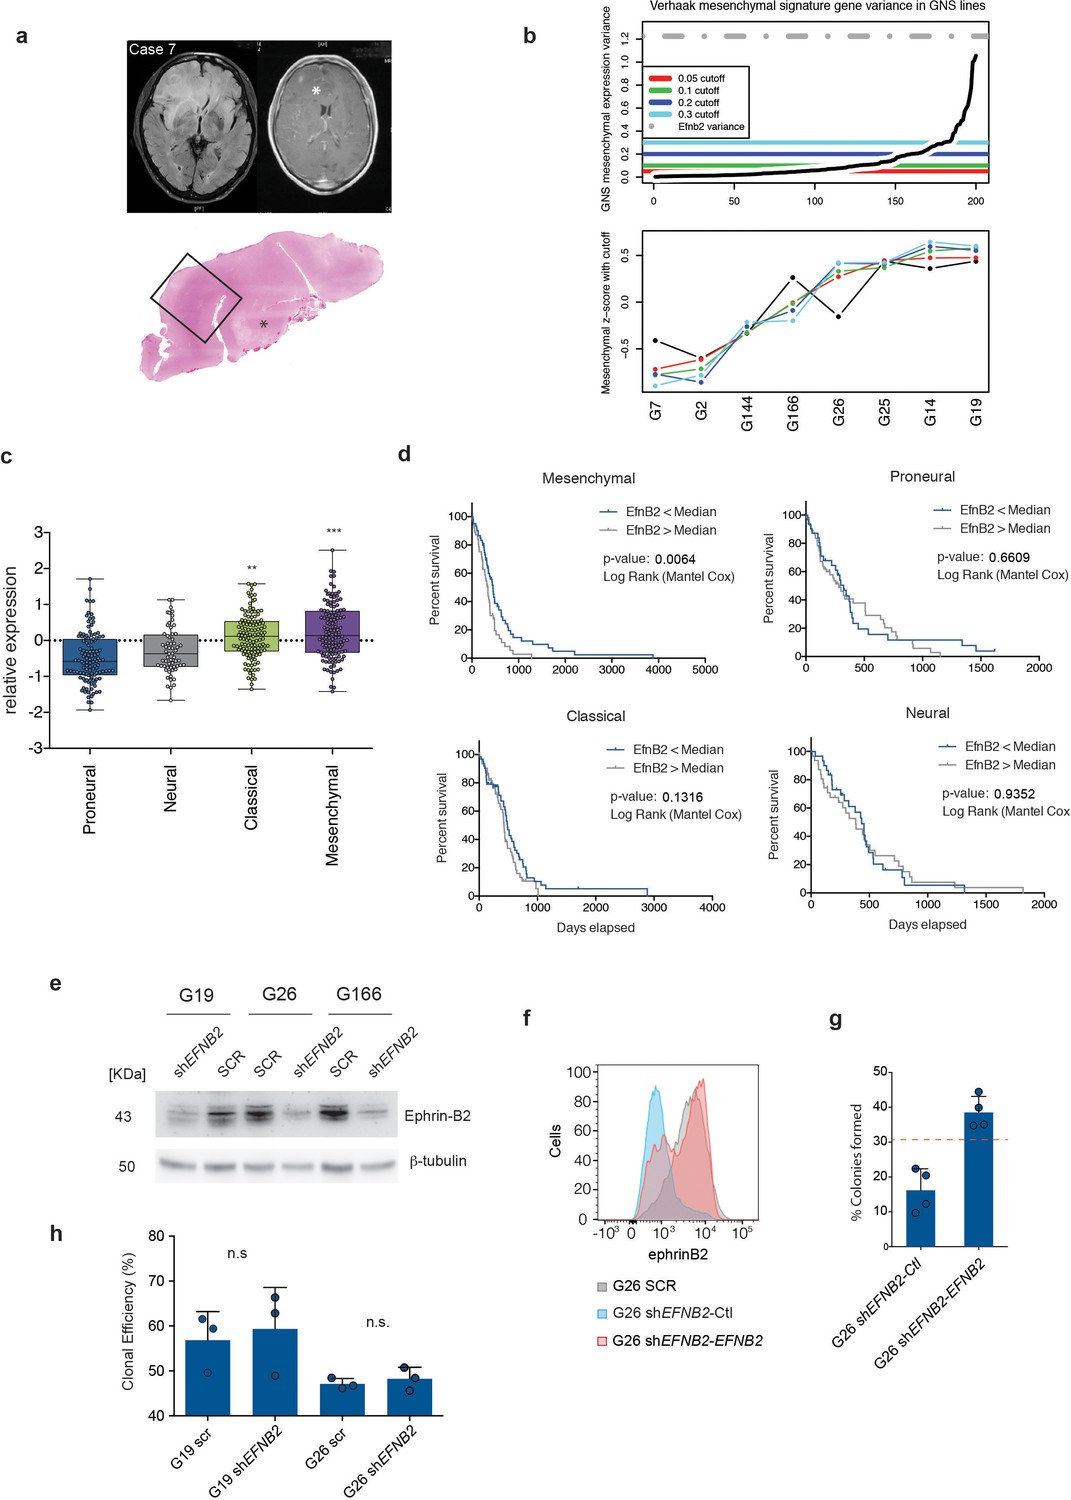
Ephrinb2 expression is increased and correlates inversely with patient survival in mesenchymal human GBM.
(a) Representative MRI scans (Case 7) illustrating methodology for the identification of the infiltrative edge of the tumours. The extent of neoplastic infiltration of the cortical ribbon and white matter is assessed at structural MRI, on the T2-weighted FLAIR sequences (left scan) as compared to the T1-weighted post-contrast images (right scan); the axial T1-weighted post-contrast image shows focal enhancement following administration of the paramagnetic agent gadolinium; the area of contrast enhancement indicating disruption of the blood brain barrier appears as a brighter spot and it is indicated by the asterisk. The whole mount tissue section stained with H&E of the right frontal lobe (bottom) has the same orientation as the MRI scans and it allows extensive mapping of the infiltrative edge of the lesion. The asterisk indicates the same regions that enhanced after gadolinium administration. (b) Top panel: Sorted variance of Verhaak et al Mesenchymal subtype signature genes across 8 GNS lines. Colored lines indicate low variance genes removed at different cutoff values. Grey dotted line indicates the variance of EFNB2 expression. Bottom panel: Mean z-score expression of high variance mesenchymal marker genes at different cuttoff points. Removing low variance tumor derived mesenchymal marker genes that are non-informative in GNS lines, with a variance below 0.05 (Red line, Top panel), improves the correlation of sample mean mesenchymal expression estimates across a range of increasing variance cutoff points. (c) Relative mRNA expression levels of EFNB2 in the four GBM subtypes of the TCGA dataset. Levels are calculated relative to the average expression levels of EFNB2 in all tumours. One-way ANOVA with Tukey post-hoc test. (d) Kaplan Meier analysis of mesenchymal, proneural, neural and classical glioblastoma subtypes stratified on EFNB2 levels defined as above (high) and below (low) the median EFNB2 levels for each subtype. Proneural tumours are corrected for IDH1 status. n = 128 for mesenchymal, 116 for proneural, 61 for neural and 126 for classical GBM. (e) Western analysis of Ephrin-B2 levels in G19, G26 and G166 human GSC transduced with control (SCR) or Efnb2 specific (shRNA) lentiviral shRNA constructs. n = 3. (f) FACS profiles of EphrinB2 expression in G26 SCR and G26 shEfnb2 cells transduced with empty vector control plasmid (Ctl) or EFNB2 overexpression constructs (EFNB2). Quantification of soft agar assays on G26 shEFNB2-Ctrl and G26 shEFNB2-EFNB2 cells. Percentage of cells forming colonies over total number of cells is shown. Dashed line indicates mean % of colonies formed in parental G26 SCR cells. Error bars denote s.e.m. Student t-test. n = 4. (h) Quantification of clonal efficiency of G19 and G26 transduced with either SCR and shEFNB2 cells and cultured at limiting dilution. Note that EFNB2 downregulation does not affect clonogenicity of the cells. Error bars denote s.e.m. Student t-test. n = 3. See also Figure 6—figure supplement 1—source data 1.
-
Figure 6—figure supplement 1—source data 1
Raw data for all quantitative analyses shown in Figure 6—figure supplement 1.
- https://doi.org/10.7554/eLife.14845.031
Figure 7 with 1 supplement
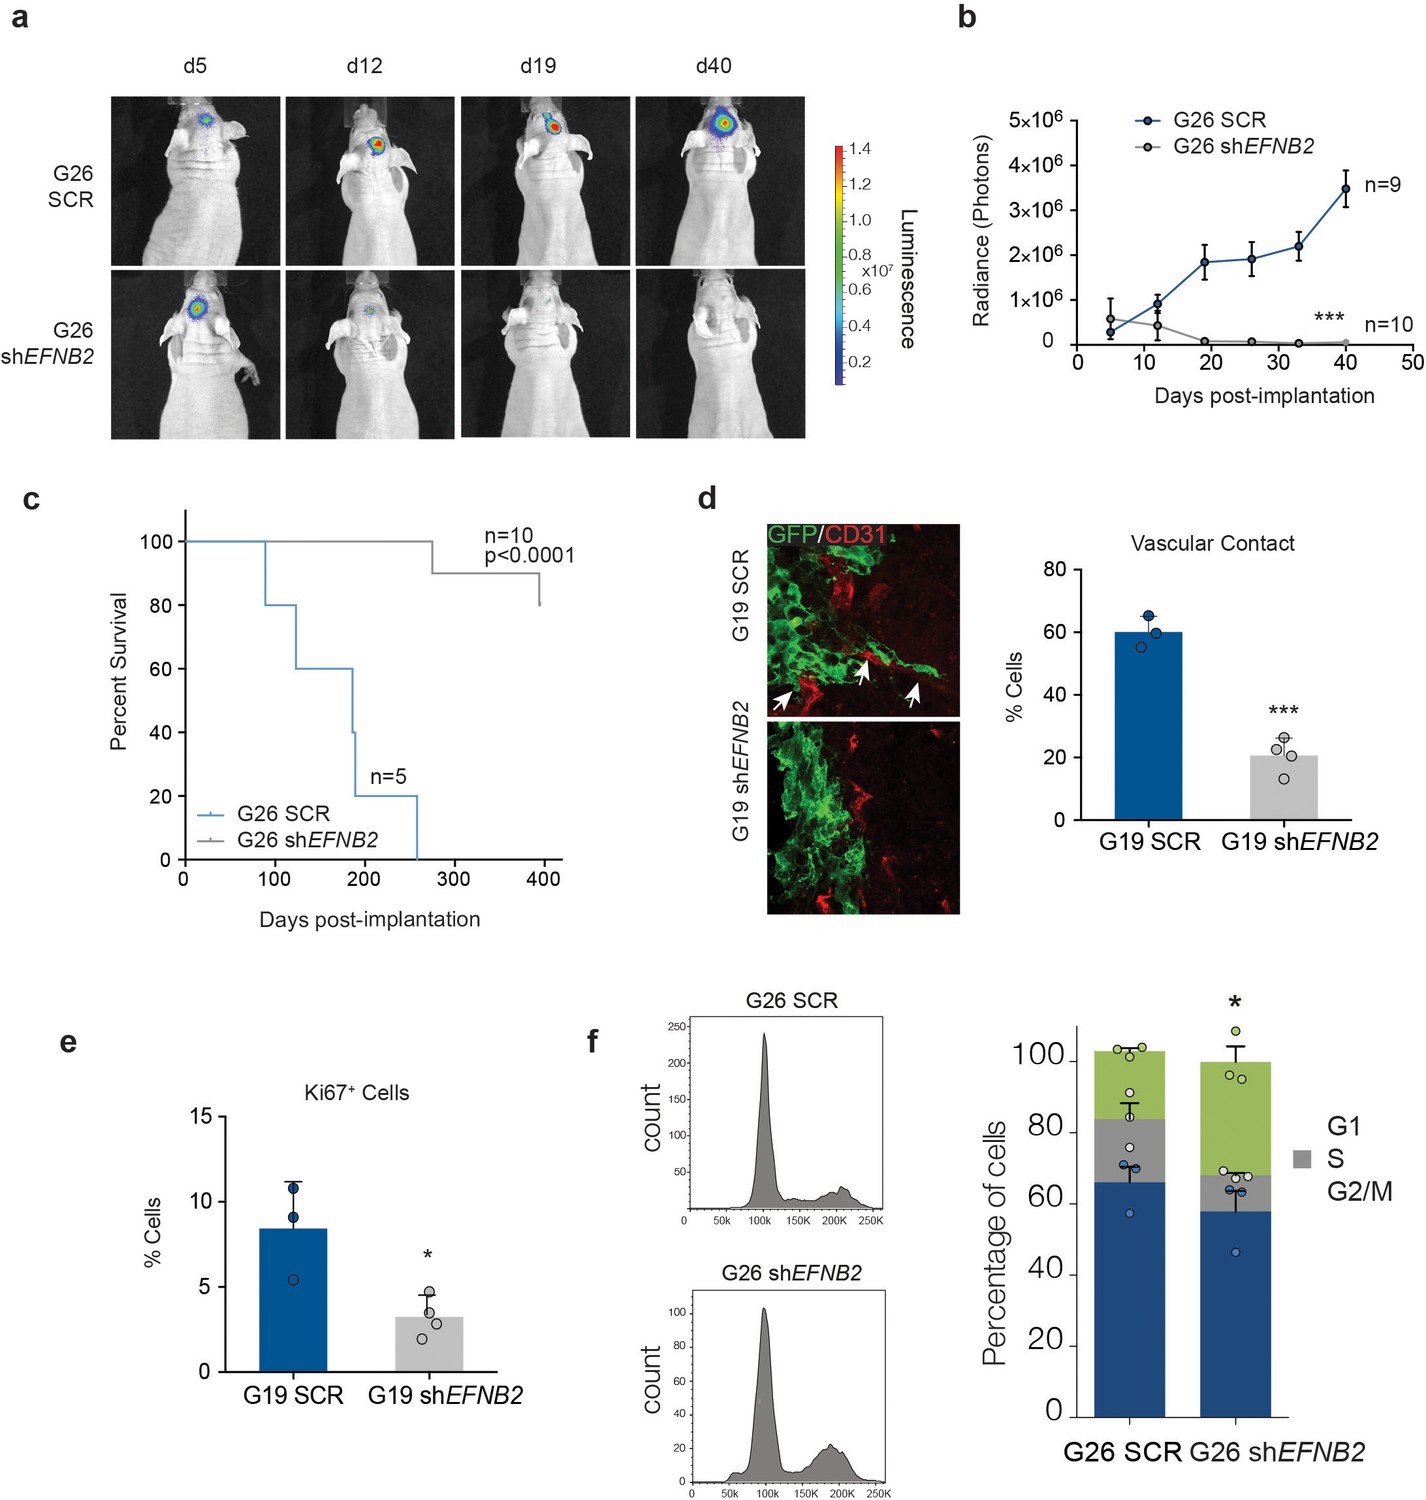
EFNB2 silencing abolishes hGSC tumorigenicity.
(a) Representative bioluminescent images of nude mice injected at d0 with 105 luciferase-labeled G26 cells, stably expressing scrambled shRNA (SCR, top) or shRNA directed against EFNB2 (shEFNB2, bottom). (b) Quantification of luciferase bioluminiscence measured at the indicated time points in both groups. n = 9 for ctrl and 10 for shEFNB2, error bars denote s.e.m. Two-way ANOVA with Tukey correction. (c) Kaplan-Meier survival plots of the mice depicted in (a). n = 5 for SCR, 10 for shEFNB2. Log Rank Mantel Cox test. (d) Representative fluorescence images (left) and quantification (right) of GSC/vascular interactions in tumors derived from G19 SCR and G19 shEFNB2 cells at 10 days post-implantation. Sections were stained for GFP to identify tumor cells and CD31 (red) to label pre-existing blood vessels. Arrows indicate vascular association and co-option in SCR tumours, which is reduced in shEFNB2 tumours. (e) Quantification of percentages of Ki67+ cells over total GFP+ cells in G19 SCR and shEFNB2 tumors. n = 4, error bars denote s.e.m. Students t-test. (f) PI FACS plots (left) and quantifications (right) of cell cycle profiles of G26 SCR and shEFNB2 cells retrieved from brain tissue 10 days after intracranial injection. n = 3 error bar denotes s.e.m. Significance is given for G2/M phase, one way ANOVA with Tukey post hoc test. See also Figure 7—figure supplement 1 and Figure 7—source data 1.
-
Figure 7—source data 1
Raw data for quantifications of tumour growth by bioluminescence analysis, survival by Kaplan-Meier analysis, tumour cell intractions with the vasculature, Ki67 labelling and cell-cycle analysis of human GSC-derived tumours presented in Figure 7.
- https://doi.org/10.7554/eLife.14845.034
Figure 7—figure supplement 1
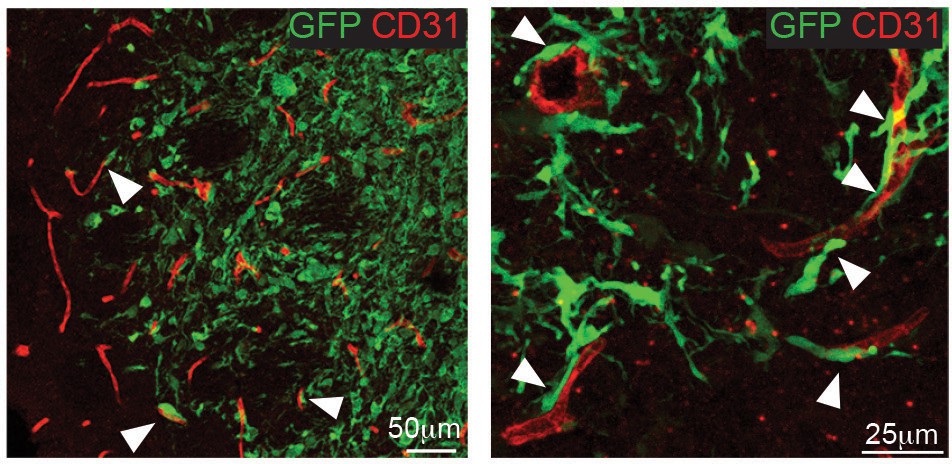
G26 cells associate with blood vessels.
Representative immunofluorescence images of tumour xenografts derived from GFP-labelled G26 cells stained for the vascular marker CD31 (red) and GFP to identify tumour cells. Tumours were collected at the end of the survival studies. At the infiltrative edge of the tumour invading G26-GFP cells are frequently associated with blood vessels (arrows).
Figure 8 with 1 supplement
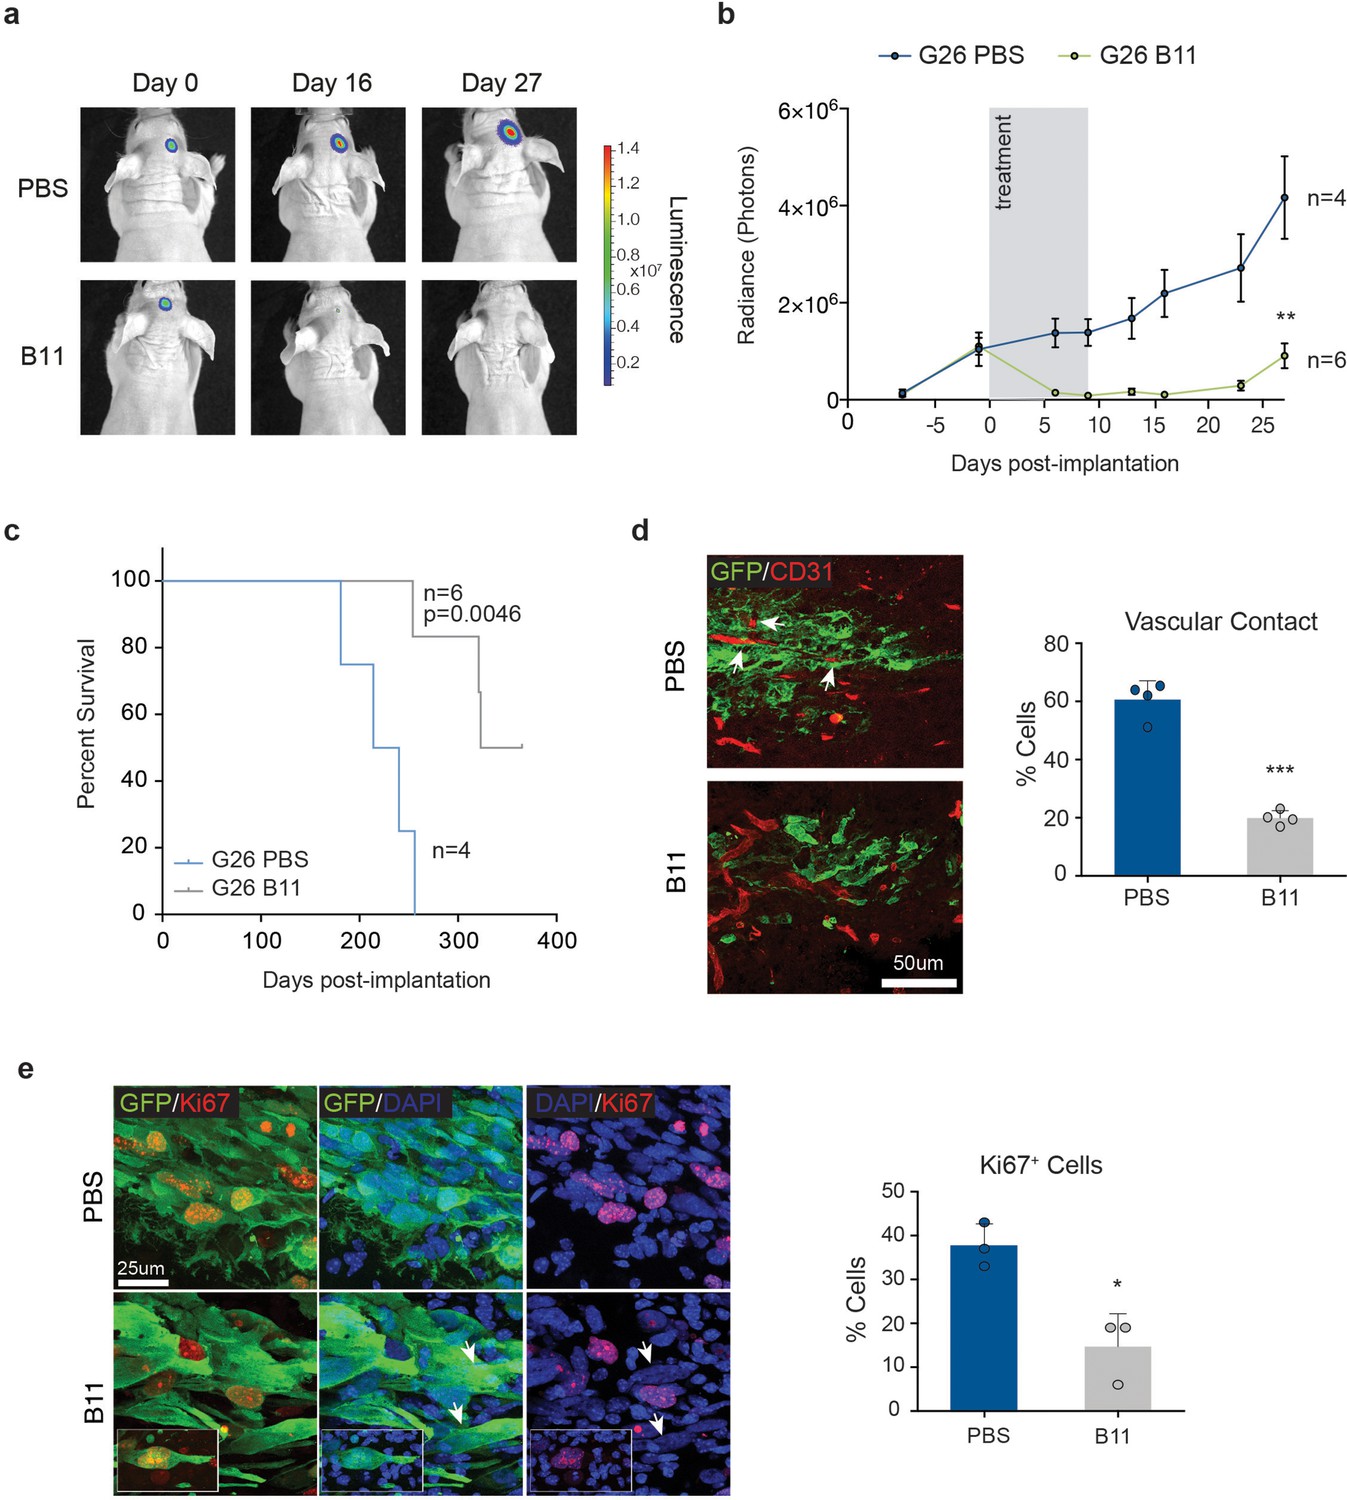
Treatment with anti-EphrinB2 ScFv blocking antibodies suppresses progression of established GBMs.
(a,b) Representative images (a) and quantification (b) of bioluminescence radiance of PBS or anti-Ephrin-B2 scFv antibody (B11) injected mice. n = 4 for PBS ctrl and 6 for B11 treatment groups. (c) Kaplan-Meier survival plots of the mice depicted in a and b. n = 4 for PBS-treated, 6 for B11-treated G26 tumours. Log Rank Mantel Cox test. (d) Representative immunofluorescence images (left) of PBS and B11-treated G26 tumours 5 days after the first B11 injection, stained for GFP (green) to identify tumour cells and CD31 (red) to label the endogenous vasculature. Quantification of vascular association is shown on the right. Arrows indicate co-opted blood vessels in PBS-treated tumours. Scale bar 50 μm. Error bars denote s.e.m. Student t-test. (e) Representative immunofluorescence images (left) PBS and B11-treated G26 tumours stained for GFP and the proliferation marker Ki67. Quantification of the percentage of Ki67+ cells over total number of GFP+ tumour cells is shown on the right. Note the presence of multinucleated cells (arrows and inset) in B11-treated tumours. Scale bar=25 μm, n = 3, error bars denote s.e.m. Students t-test. See also Figure 8—figure supplement 1 and Figure 8—source data 1.
-
Figure 8—source data 1
Raw data for quantifications of tumour growth by bioluminescence analysis, survival by Kaplan-Meier analysis, tumour cell intractions with the vasculature and Ki67 labelling of human GSC-derived tumours presented in Figure 8.
- https://doi.org/10.7554/eLife.14845.037
Figure 8—figure supplement 1
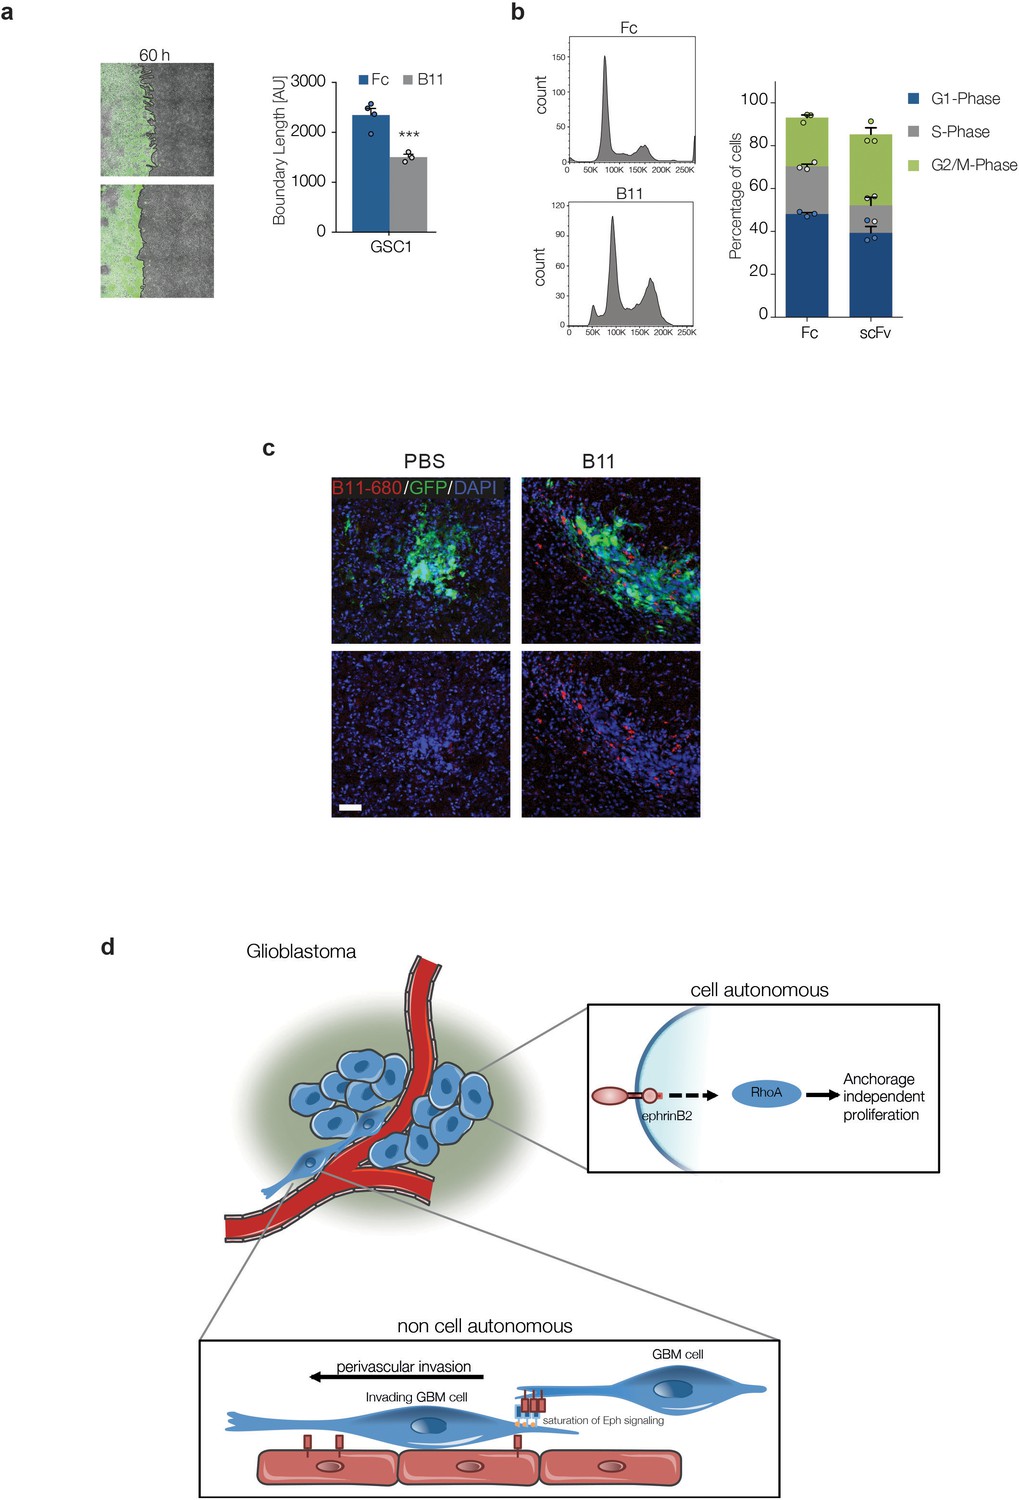
B11 crosses the blood/tumour barrier and inhibits Ephrin-B2 on tumour cells.
(a) Left: representative fluorescence and phase contrast merged images of GFP-labelled GSC1 (Green) migrating towards bmVECs (unlabelled) for 60 hr in the presence of 20 µg/ml Fc control (Fc) or anti ephrinB2-scFv (B11), respectively. Right: quantification of boundary length. n = 4, error bars denote s.e.m., Students t-test. (b) PI FACS quantifications of GSC1 cells treated with 20 µg Fc control (fc) or anti ephrinB2-scFv (B11) for 18 hr. n = 3, error bars denote s.e.m., Students t-test. (c) Representative fluorescence images of G26 tumours treated with vehicle (PBS) or Alexa-680 labelled B11 (red), showing efficient delivery of the ScFv antibody to the tumous cells. (d) Model of ephrin-B2 functions in GSC tumorigenesis. See also Figure 8—figure supplement 1—source data 1.
-
Figure 8—figure supplement 1—source data 1
Raw data for all quantitative analyses shown in Figure 8—figure supplement 1.
- https://doi.org/10.7554/eLife.14845.039
Videos
Video 1
Endothelial cells compartmentalise imNSC.
Merged fluorescent and phase contrast movie from time-lapse microscopy experiments of cell-tracker labelled imNSC1 (green) migrating towards brain microvascular endothelial cells (bmvEC, unlabelled cells). Images were taken every 10 min for 60 hr.
Video 2
GSC escape endothelial compartmentalisation.
Merged fluorescent and phase contrast movie from time-lapse microscopy experiments of cell-tracker labelled GSC1 (green) migrating towards brain microvascular endothelial cells (bmvEC, unlabelled cells). A slight decrease in fluorescence was observed due to higher proliferation rate of the cells. Images were taken every 10 min for 60 hr.
Video 3
imNSC are strongly compartmentalised by ephrinB2 ligand.
Merged fluorescent and phase contrast movie from time-lapse microscopy of imNSC1 migrating towards coated ephrinB2-Fc labelled with fluorescent antibody (green). Images were taken every 10 min for 60 hr.
Video 4
GSC become insensitive to ephrinB2 ligand.
Merged fluorescent and phase contrast movie from time-lapse microscopy of GSC1 migrating towards coated ephrinB2-Fc labelled with fluorescent antibody (green). Images were taken every 10 min for 60 hr.
Tables
Table 1
Gene set enrichment analysis FDR q-values for astrocyte, oligodendrocyte, OPC and neuron signatures in GSC lines vs NSC.
| GAGE analysis q-value (FDR) | ||||
|---|---|---|---|---|
| GSCvsNS | GSC1vsNS | GSC2vsNS | Cell type term gene number | |
| oligo | 1 | 1 | 1 | 497 |
| neuron | 1 | 1 | 1 | 497 |
| astro | 1 | 1 | 1 | 486 |
| opc | 1 | 1 | 1 | 490 |
Table 2
Gene set enrichment analysis FDR q-values for astrocyte, oligodendrocyte, OPC and neuron signatures in NSC vs GSC lines.
| GAGE analysis q-value (FDR) | ||||
|---|---|---|---|---|
| NSvsGSC | NSvsGSC1 | NSvsGSC2 | Cell type term gene number | |
| astro | 4.06848E-22 | 2.84603E-23 | 2.04565E-19 | 490 |
| opc | 1.57235E-16 | 7.01306E-17 | 3.24522E-14 | 486 |
| neuron | 1.51727E-06 | 4.55938E-07 | 4.58202E-05 | 497 |
| oligo | 0.064920265 | 0.06708047 | 0.222744258 | 497 |
Table 3
Patient information for tumours 1–8 used for Ephrin-B2 IHC
| name | gender | age | site | IDH1/2 | MGMT | ATRX | Grade |
|---|---|---|---|---|---|---|---|
| case 1 | M | 69 | left temporal | wt | 0 | retained | IV |
| case2 | M | 45 | left temporal | wt | 0 | retained | IV |
| case 3 | M | 54 | right temporo-parietal | wt | <10% | retained | IV |
| case 4 | M | 55 | right temporal | wt | 0 | retained | IV |
| case 5 | F | 61 | right parietal | wt | 25% | retained | IV |
| case 6 | M | 57 | right frontal | G395A | 0 | lost | IV (secondary) |
| case 7 | F | 73 | left frontal / crossed midline | wt | 0 | retained | Iv |
| case 8 | F | 39 | left temporo-parietal | wt | 0 | retained | IV |
Additional files
-
Supplementary file 1
List of significantly enriched GO terms in GSC vs NSC listing FDR q-values
- https://doi.org/10.7554/eLife.14845.040
-
Spplementary file 2
List of significantly enriched GO terms in NSC vs GSC listing FDR q-values
- https://doi.org/10.7554/eLife.14845.041
-
Supplementary file 3
Mouse Primers used for qRT-PCR
- https://doi.org/10.7554/eLife.14845.042
Download links
A two-part list of links to download the article, or parts of the article, in various formats.
Downloads (link to download the article as PDF)
Open citations (links to open the citations from this article in various online reference manager services)
Cite this article (links to download the citations from this article in formats compatible with various reference manager tools)
EphrinB2 drives perivascular invasion and proliferation of glioblastoma stem-like cells
eLife 5:e14845.
https://doi.org/10.7554/eLife.14845


