mTORC1 is necessary but mTORC2 and GSK3β are inhibitory for AKT3-induced axon regeneration in the central nervous system
- Temple University Lewis Katz School of Medicine, United States
- University of Florida College of Medicine, United States
Figures
Figure 1
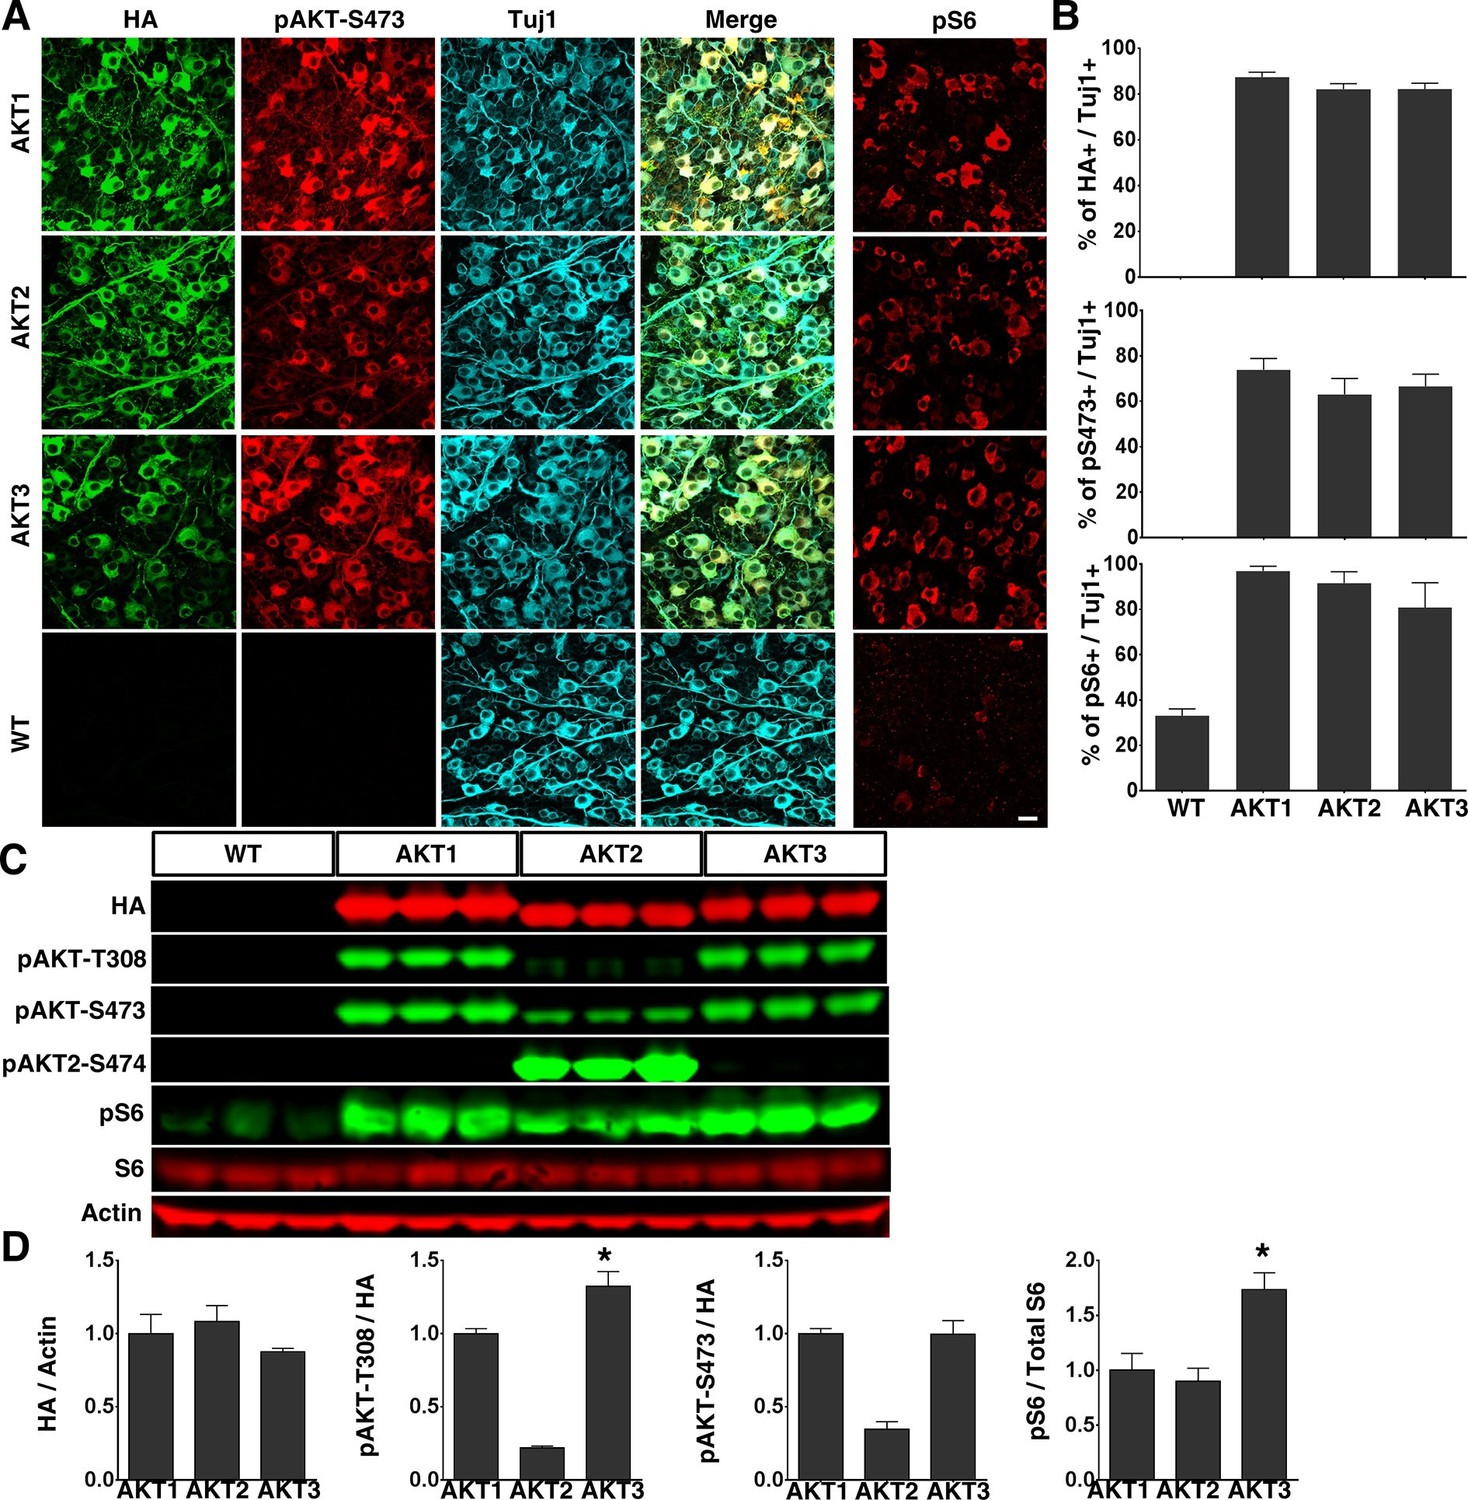
Overexpression of three constitutively active AKT isoforms in RGCs.
(A) Confocal images of flat-mounted retinas showing co-labeling of HA tag, Tuj1, pAKT-S473 and their merged images, and pS6 in a separate retina sample. Scale bar, 20 µm. (B) Quantification of HA, pAKT-S473 or pS6 positive RGCs. Data are presented as means ± s.e.m, n=6. (C) Western blot of retina lysates from three biological replicates showing expression levels of HA-AKT isoforms, and phosphorylation levels of AKT-T308, AKT-S473 and S6. (D) Quantification of Western blots. *p<0.05. Data are presented as means ± s.e.m, n=3.
Figure 2 with 2 supplements
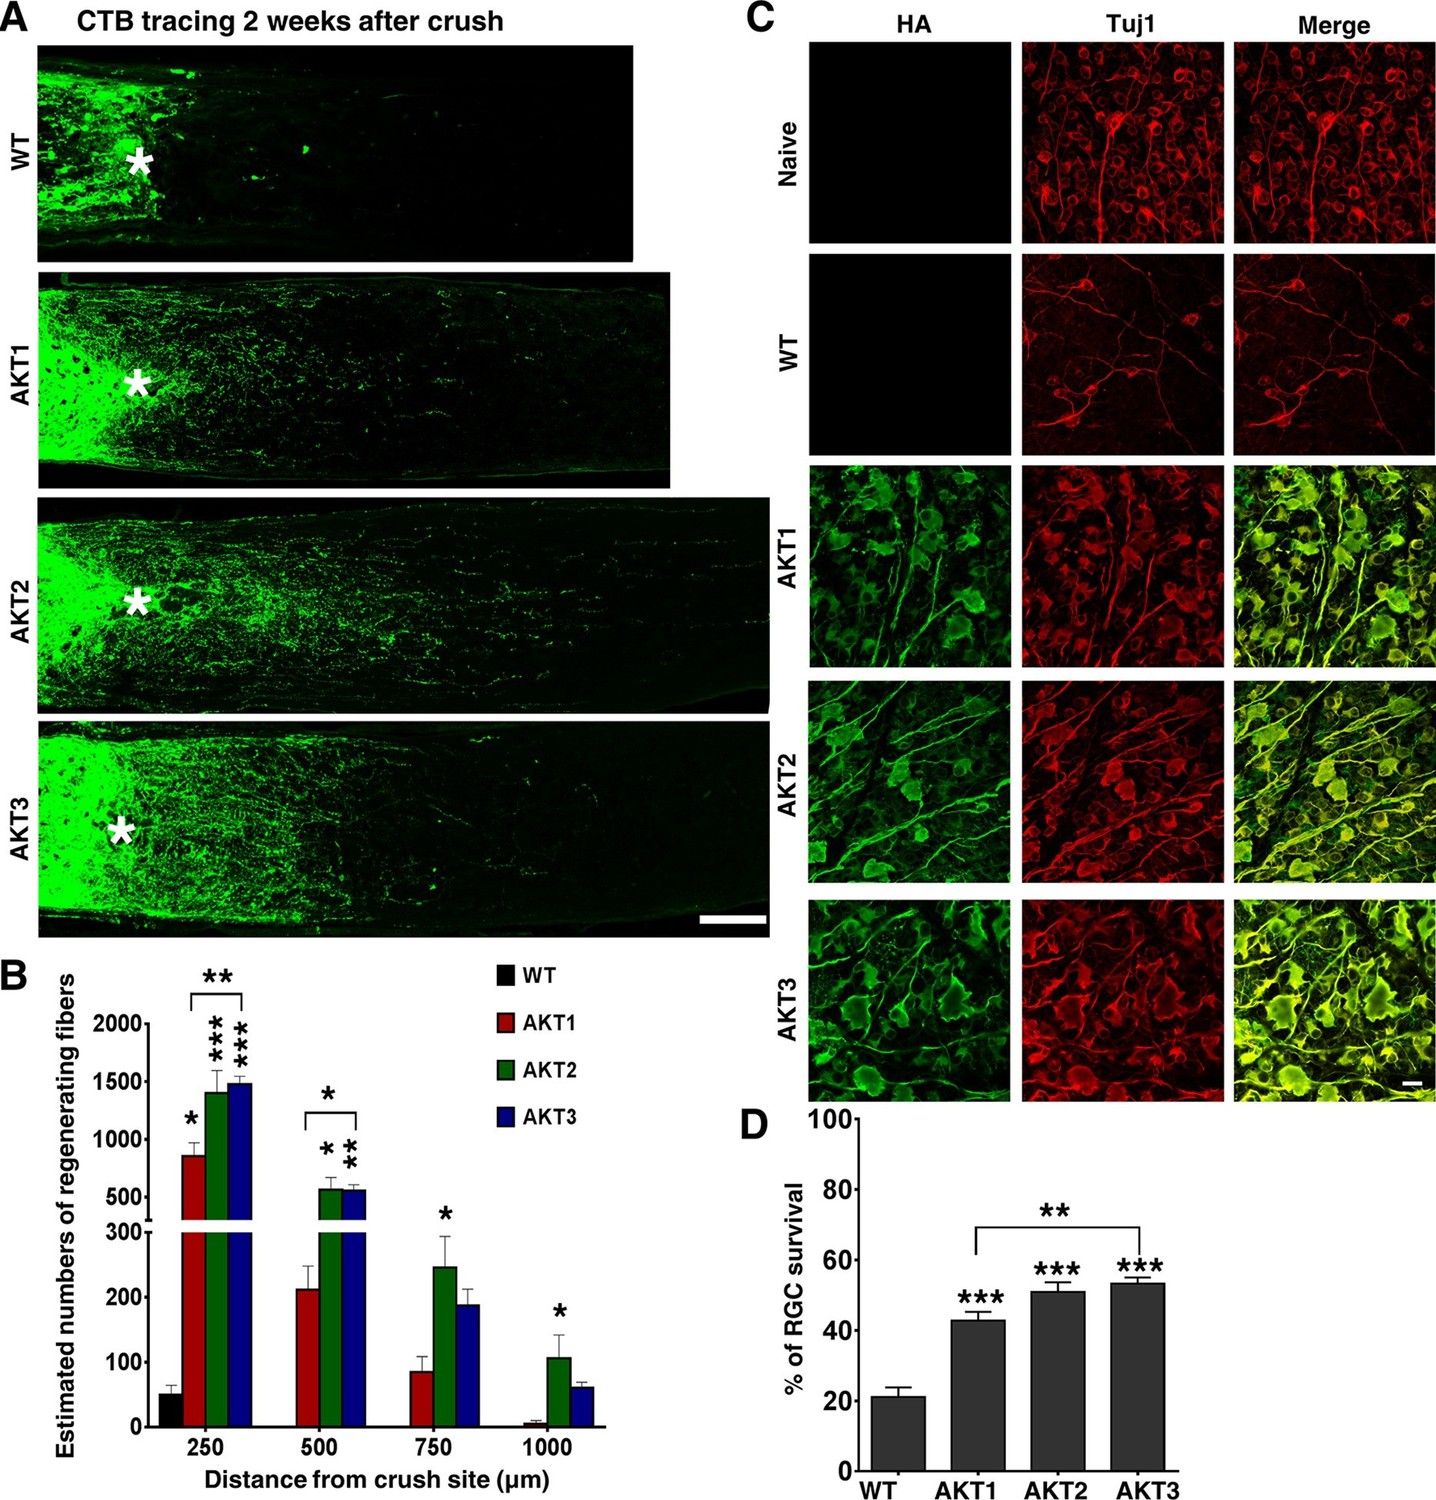
Differential effects of three AKT isoforms on axon regeneration and RGC survival.
(A) Confocal images of ON longitudinal sections showing regenerating fibers labeled with CTB-Alexa 488 2 weeks after ON crush. Scale bar, 100 µm. *crush site. (B) Quantification of regenerating fibers at different distances distal to the lesion site. Data are presented as means ± s.e.m, n=10–20. (C) Confocal images of flat-mounted retinas showing co-labeling of HA-AKTs and Tuj1, 2 weeks after ON crush. Scale bar, 20 µm. (D) Quantification of surviving RGCs, represented as percentage of Tuj1 positive RGCs in the injured eye, compared to the intact contralateral eye. Data are presented as means ± s.e.m, n=8–10. *p<0.05, **p<0.01, ***p<0.001.
Figure 2—figure supplement 1
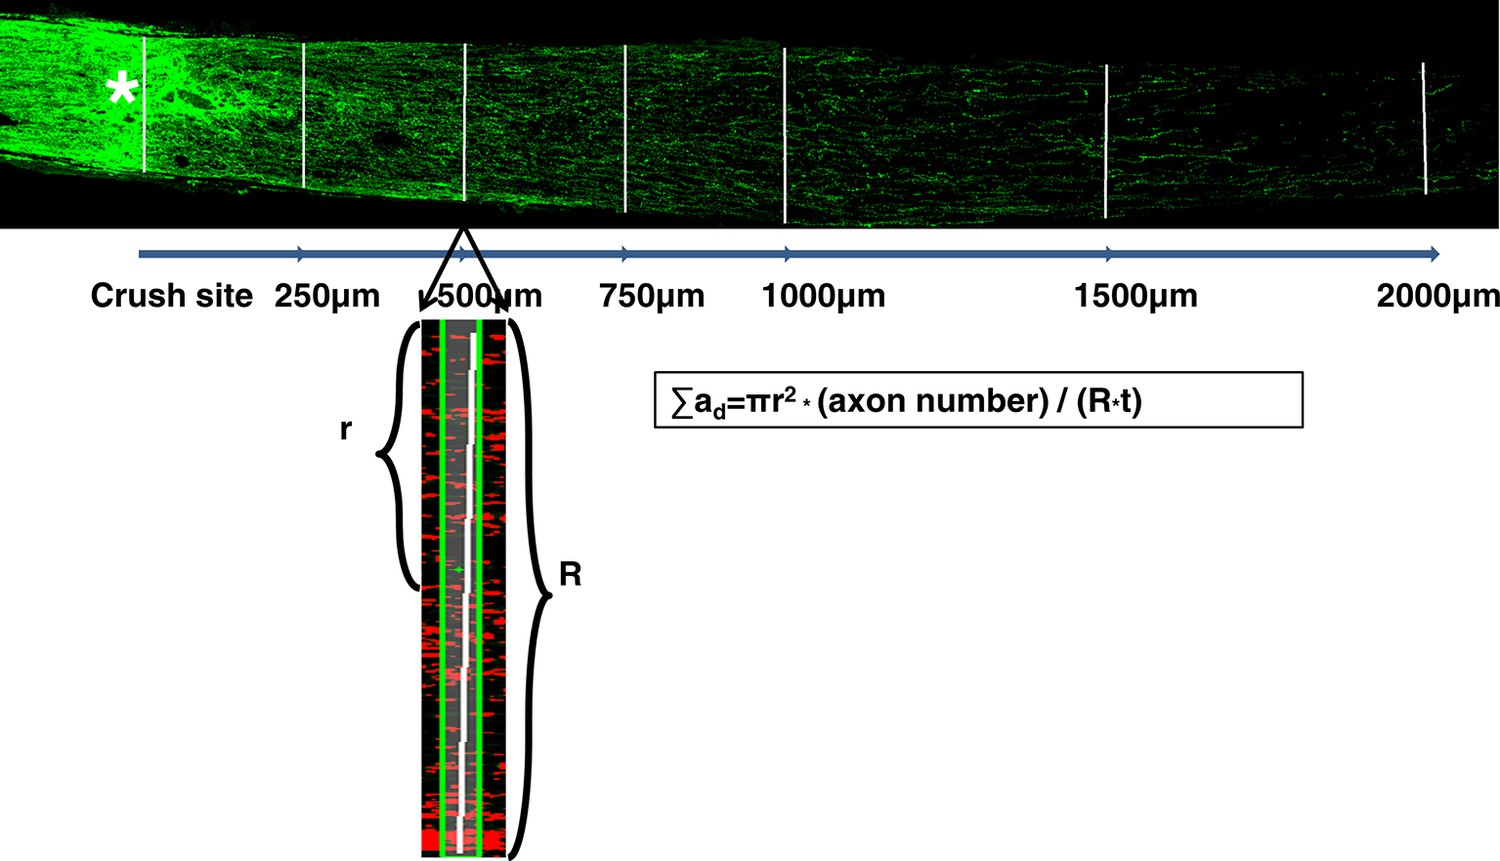
Illustration of the regenerating axon quantification procedure.
Perpendicular lines on the ON sections were drawn distal to the crush site in increments of 250 µm till 1000 µm, then every 500 µm till no fibers were visible. The regenerating fibers that crossed the perpendicular lines were counted. The width of the nerve (R) was measured at the point (d) at which the counts were taken and used together with the thickness of the section (t = 8 μm) to calculate the number of axons per µm2 area of the nerve. The total number of axons per section was calculated based on the formula: ∑ad= πr2 * (axon number) / (R*t), which then was averaged over 3 sections per animal. All CTB signals that were in the range of intensity that was set from lowest intensity to the maximum intensity after background subtraction were counted as individual fibers by Nikon NIS Element R4 software.
Figure 2—figure supplement 2
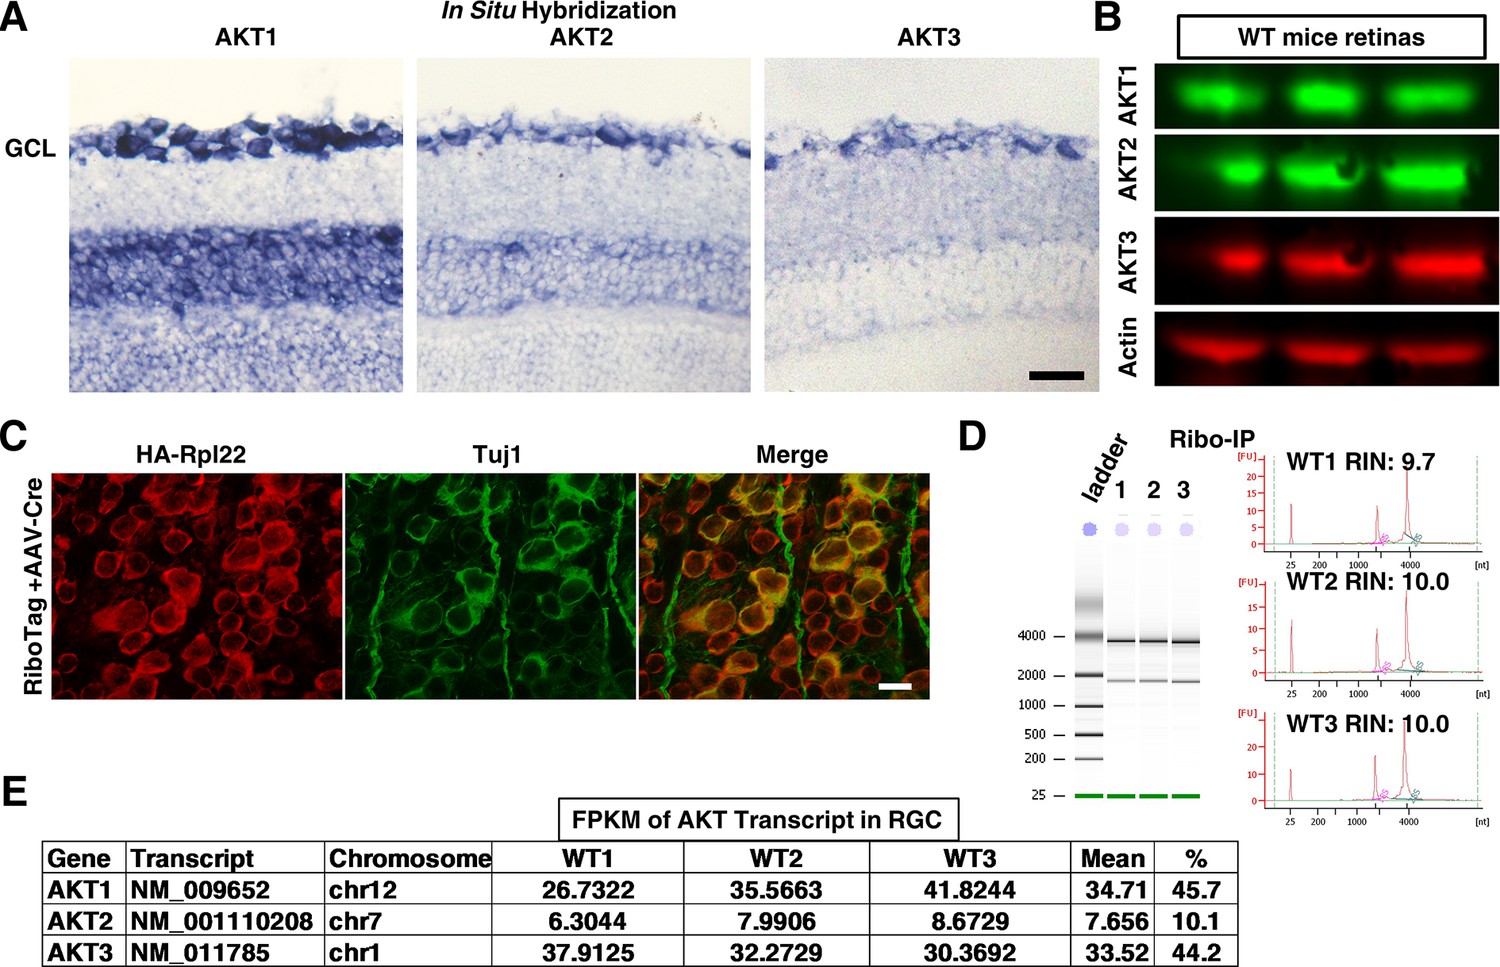
Endogenous expression of three AKT isoforms in RGCs.
(A) In situ hybridization images of retina sections showing expression of three AKT isoforms in ganglion cell layer (GCL). Scale bar, 20 µm. (B) Western blots of retina lysates from three biological replicates showing expression of three AKT isoforms. (C) Confocal images of flat-mounted retinas showing co-labeling of HA tag and Tuj1. Scale bar, 20 µm. (D) RGC-specific ribosome-associated translating mRNA purified by Ribo-IP from three replicates of WT mice. (E) RNA-seq showing expression levels of three AKT isoforms in RGCs.
Figure 3

Over expression of three AKT3 mutants in RGCs.
(A) Confocal images of flat-mounted retinas showing co-labeling of HA tag, Tuj1, pAKT-S473 and their merged images, and pS6 in a separate retina sample. Scale bar, 20 µm. (B) Western blot of retina lysates from three biological replicates showing expression level of HA-AKT, and phosphorylation level of AKT-T308, AKT-S473 and S6. (C) Quantification of Western blots. *p<0.05, **p<0.01, ***p<0.001. Data are presented as means ± s.e.m, n=3.
Figure 4 with 3 supplements
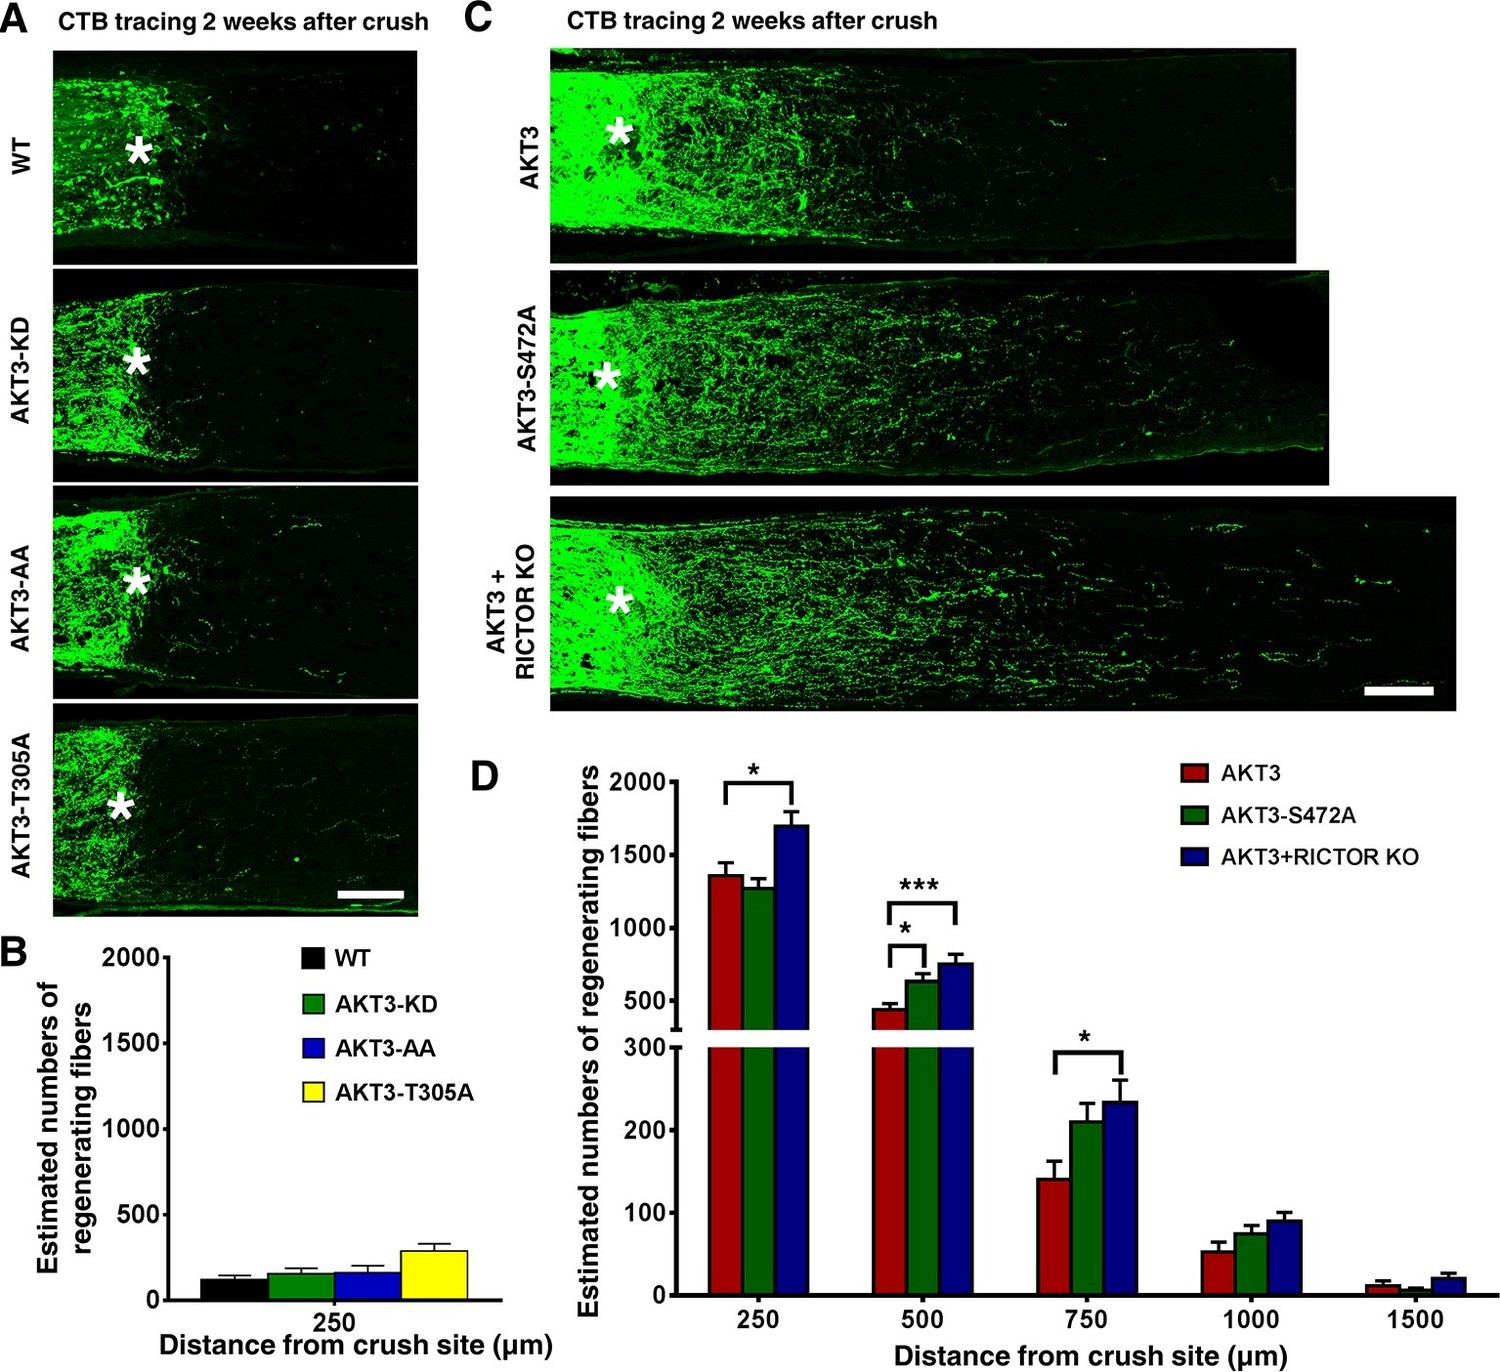
Phosphorylation of AKT3-T305 is necessary but phosphorylation of AKT3-S472 by mTORC2 is inhibitory for axon regeneration.
(A) Confocal images of ON longitudinal sections showing lack of regenerating fibers 2 weeks after ON crush. Scale bar, 100 µm. *crush site. (B) Quantification of regenerating fibers at different distances distal to the lesion site. Data are presented as means ± s.e.m, n=6–8. (C) Confocal images of ON longitudinal sections showing regenerating fibers labeled with CTB 2 weeks after ON crush. Scale bar, 100 µm. *crush site. (D) Quantification of regenerating fibers at different distances distal to the lesion site. *p<0.05, ***p<0.001. Data are presented as means ± s.e.m, n=20–30.
Figure 4—figure supplement 1
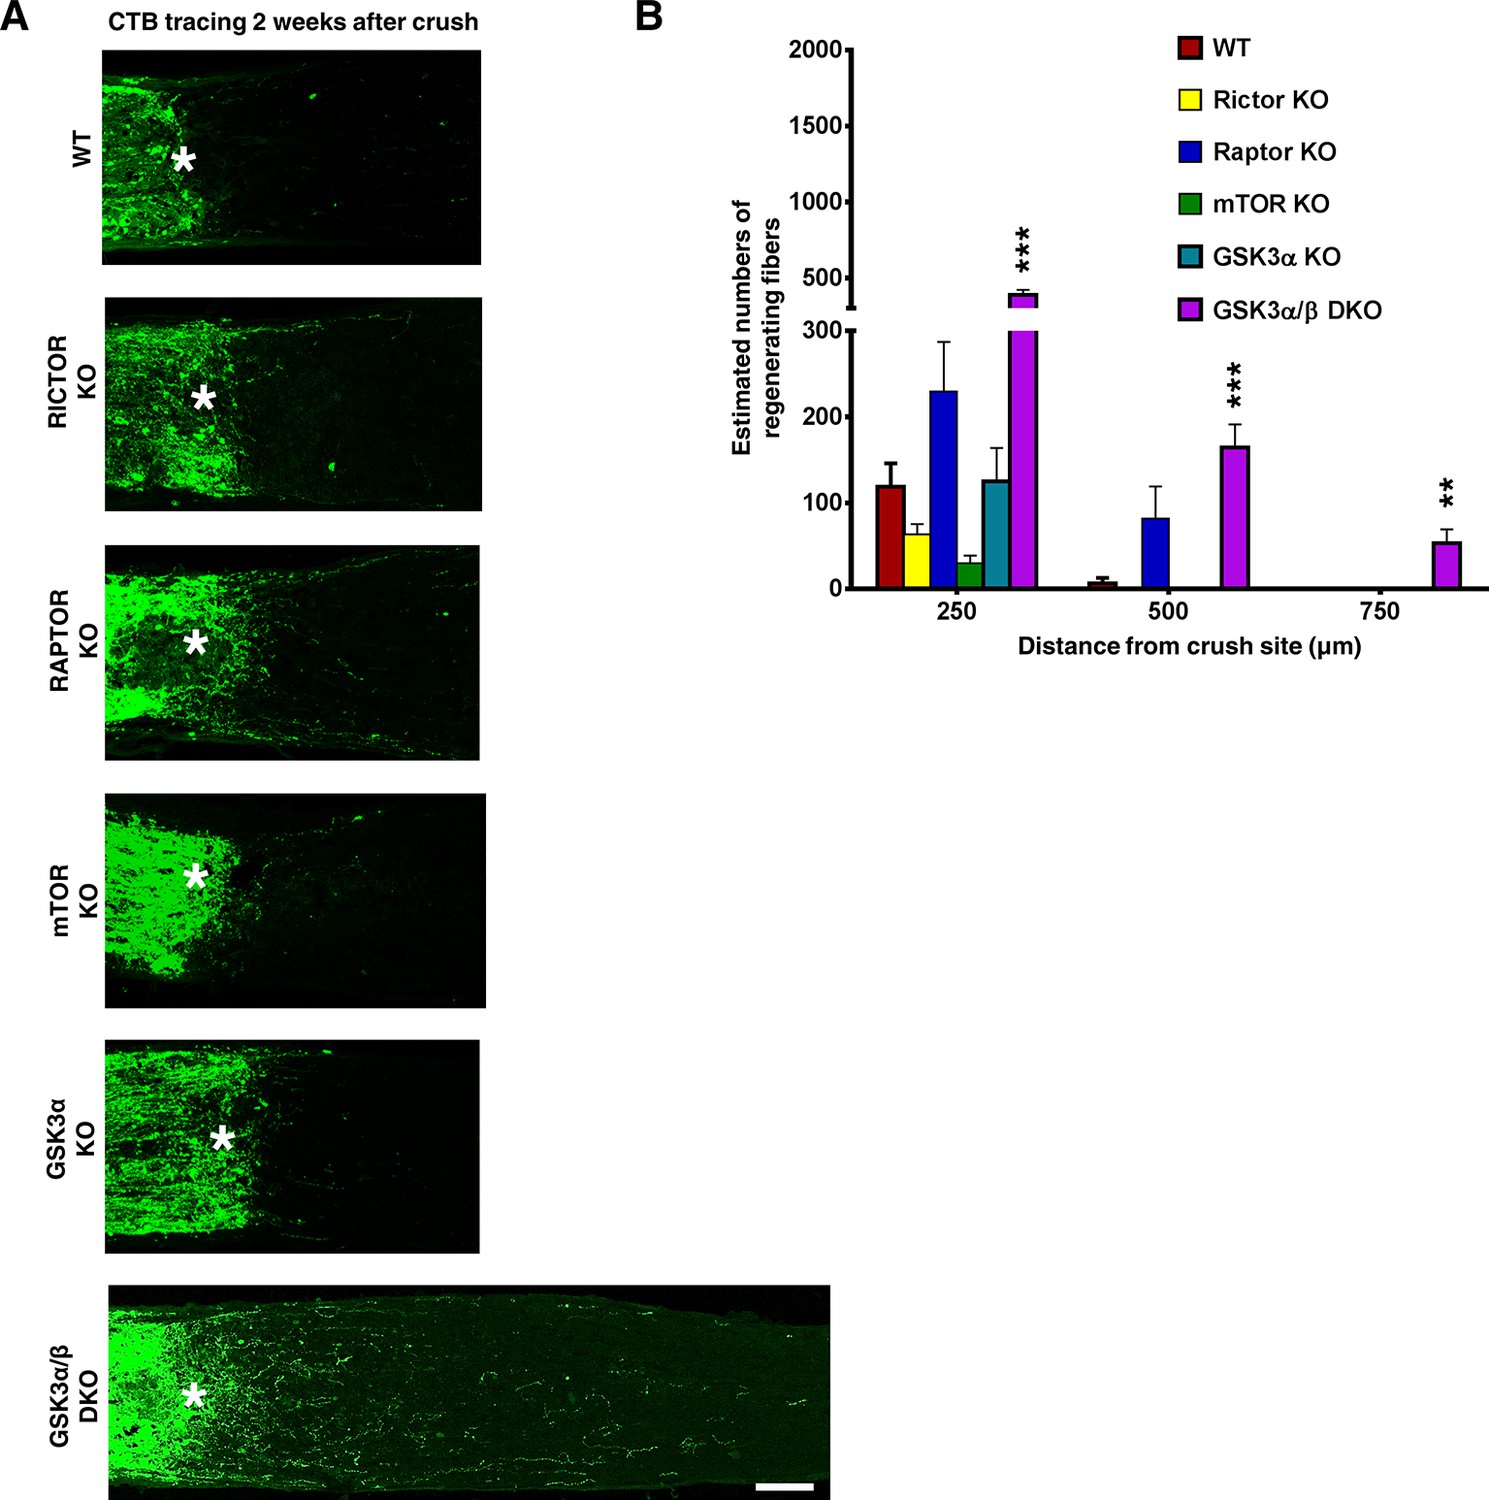
AAV-Cre-mediated RGC-specific deletion of Rictor, Rptor, Mtor or Gsk3a did not induce axon regeneration.
(A) Confocal images of ON longitudinal sections showing regenerating fibers labeled with CTB, 2 weeks after ON crush. Scale bar, 100 µm. *crush site. (B) Quantification of regenerating fibers at different distances distal to the lesion site. Data are presented as means ± s.e.m, n=6. **p<0.01, ***p<0.001
Figure 4—figure supplement 2
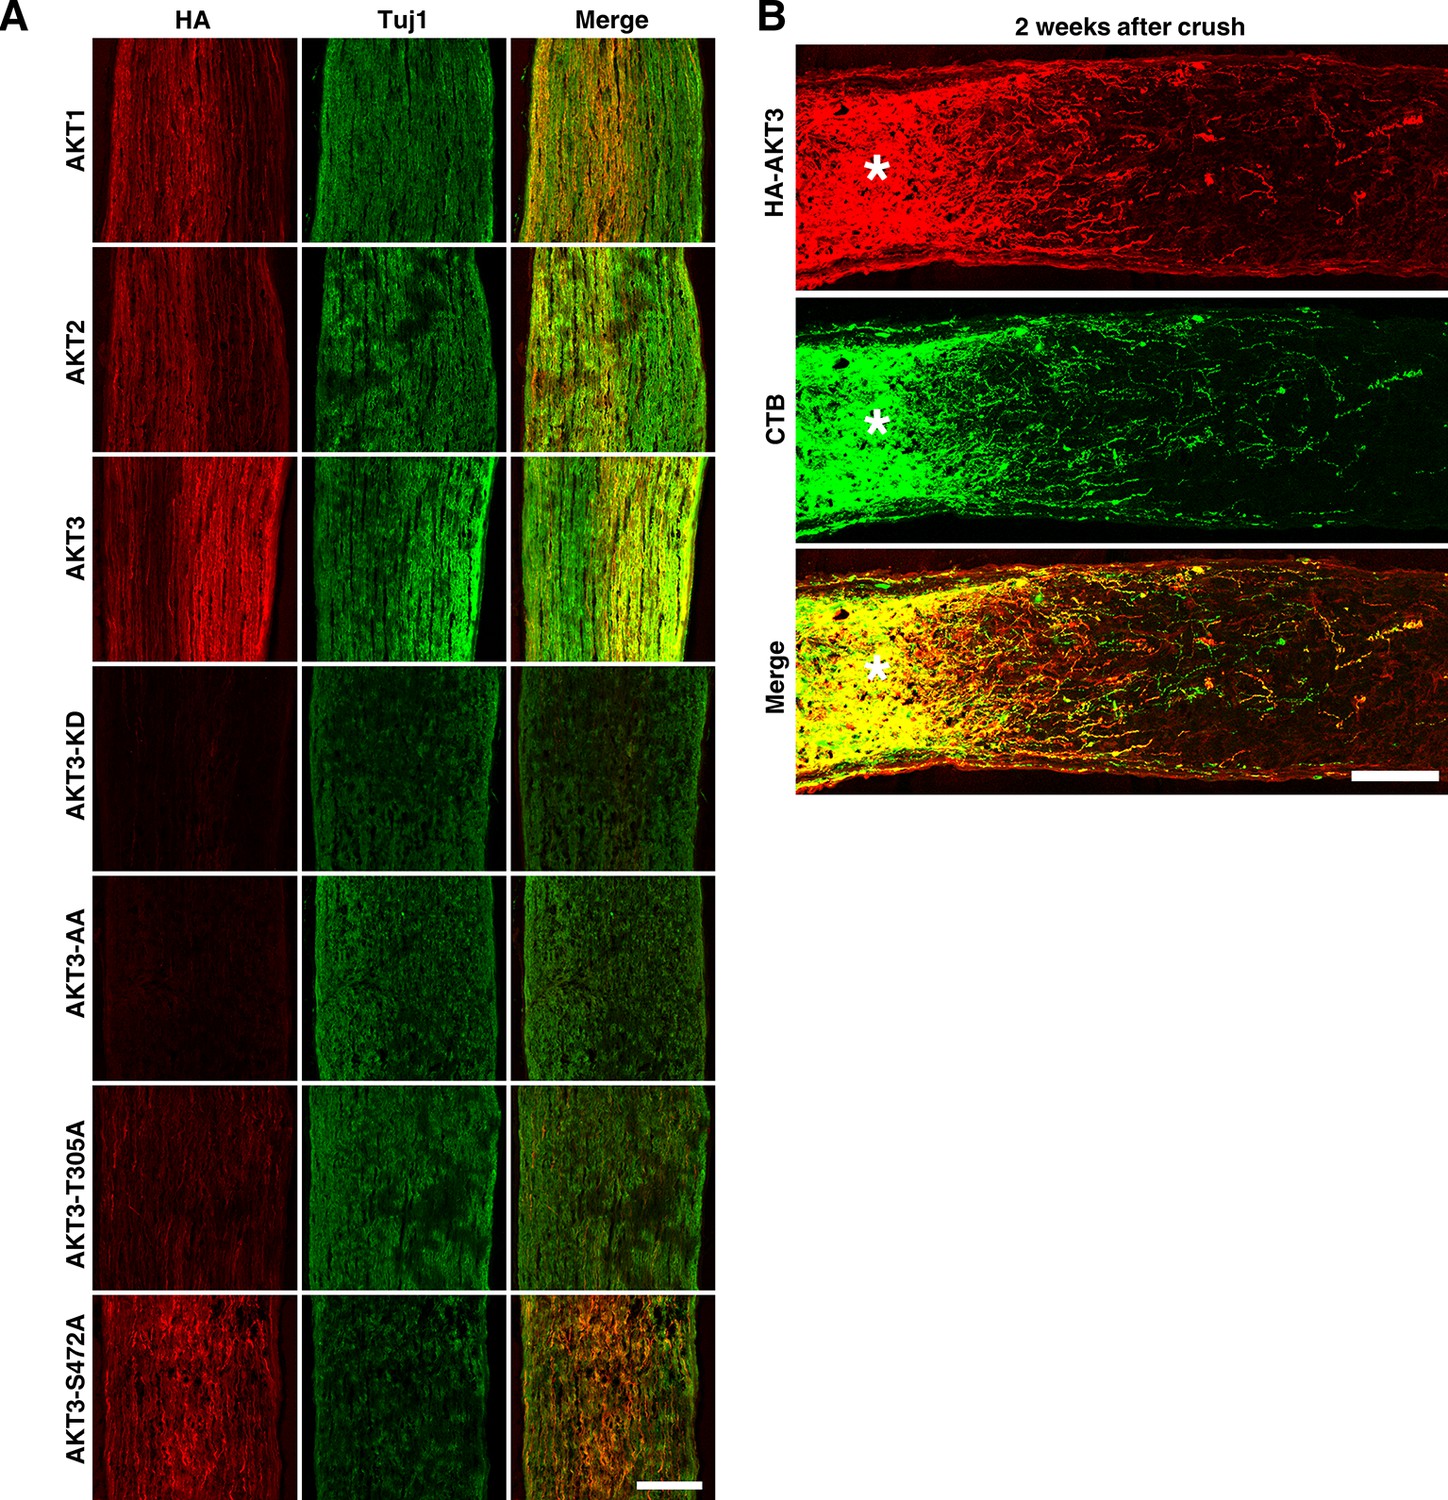
Translocation of AKT in ON.
(A) Confocal images of ON longitudinal sections showing axons co-labeled with HA tag and Tuj1. Scale bar, 100 µm. (B) Confocal images of ON longitudinal sections showing regenerating fibers co-labeled with HA tag and CTB, 2 weeks after ON crush. Scale bar, 100 µm. *crush site.
Figure 4—figure supplement 3

The effects of AKT3 mutants on RGC survival.
(A) Confocal images of flat-mounted retinas showing Tuj1 positive RGCs, 2 weeks after ON crush. Scale bar, 20 µm. (B) Quantification of surviving RGCs, represented as percentage of Tuj1 positive RGCs in the injured eye, compared to the intact contralateral eye. *p<0.05, ***p<0.001. Data are presented as means ± s.e.m, n=8–10.
Figure 5
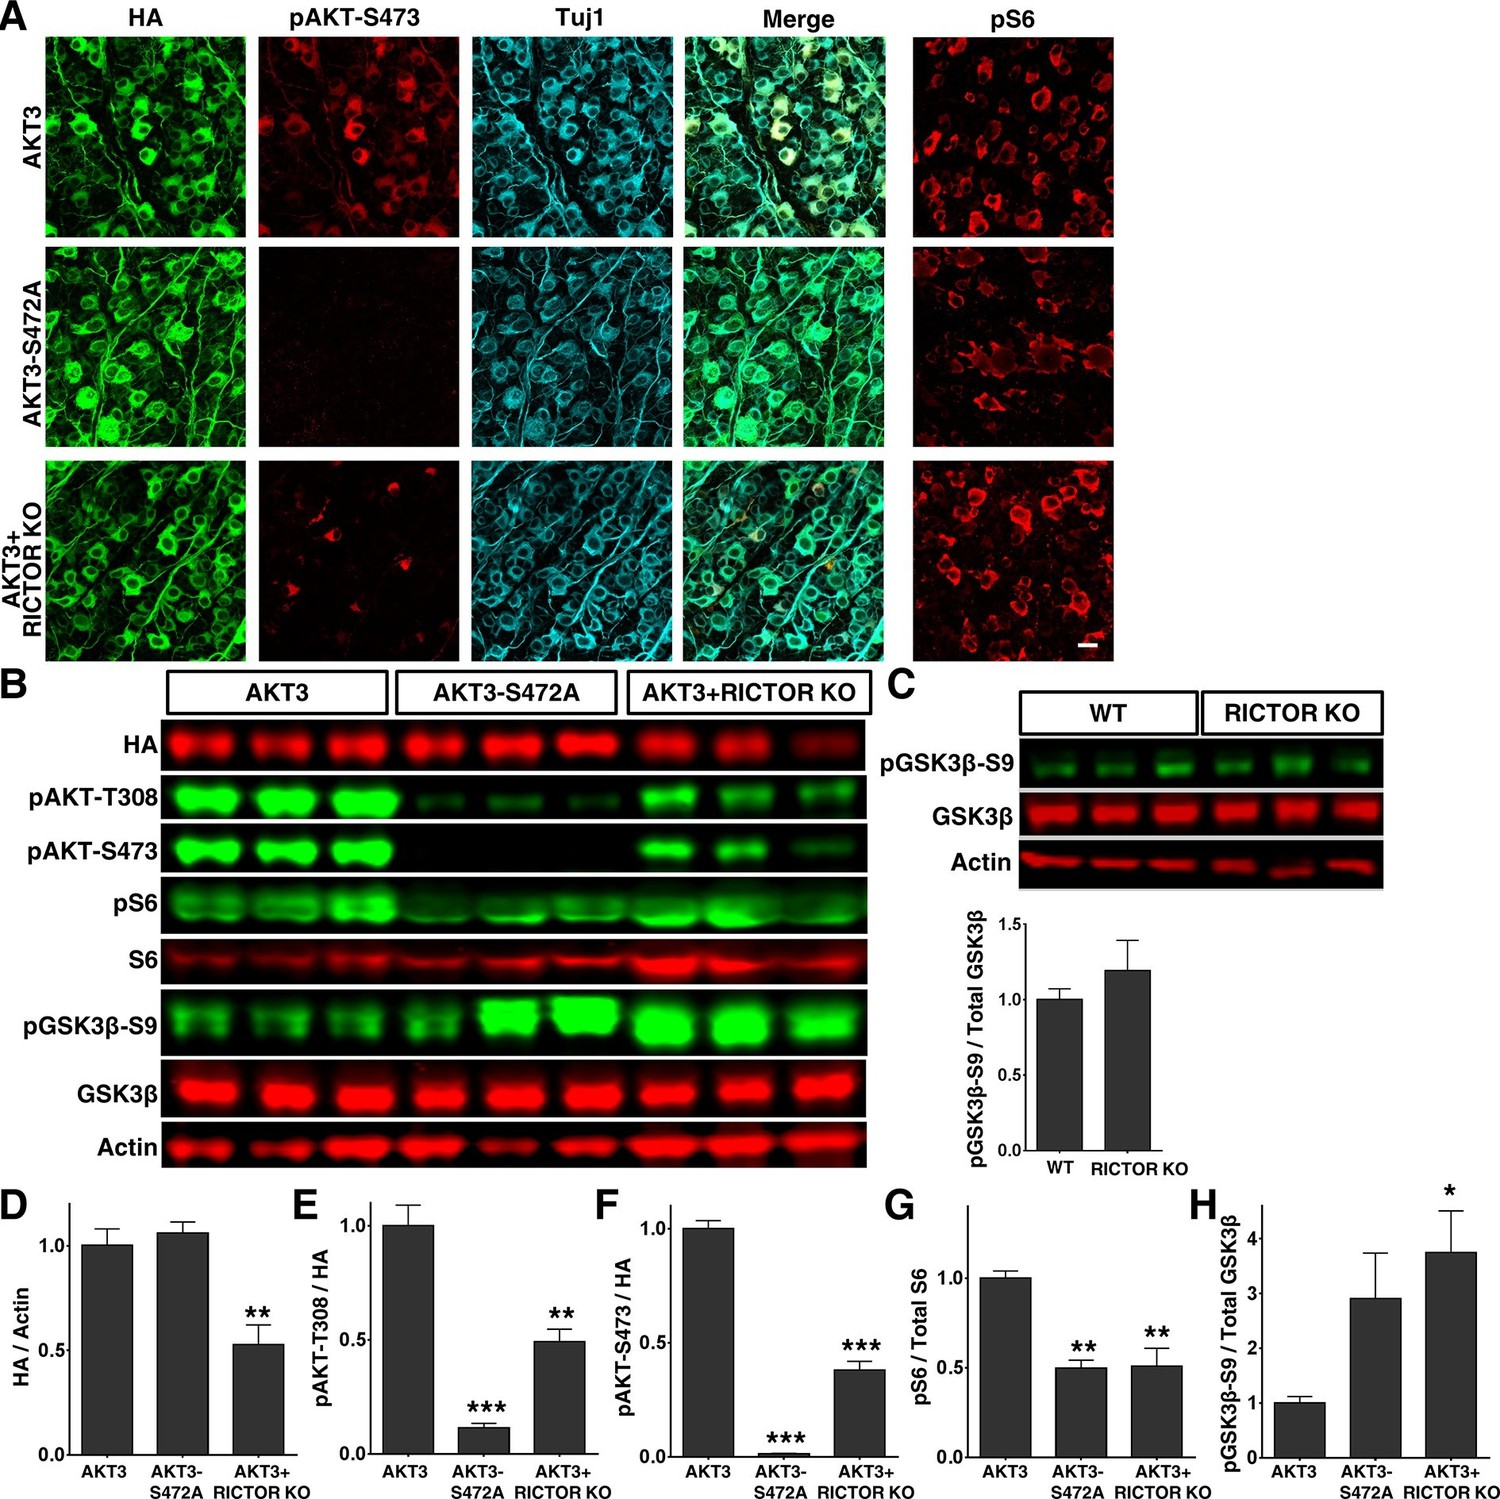
Increased phosphorylation of GSK3β-S9 after blocking AKT-S473 phosphorylation in RGCs.
(A) Confocal images of flat-mounted retinas showing co-labeling of HA tag, Tuj1, pAKT-S473 and their merged images, and pS6 in a separate retina sample. Scale bar, 20 µm. (B) Western blots of retina lysates from three biological replicates showing expression level of HA, and phosphorylation levels of AKT-T308, AKT-S473, S6 and GSK3β-S9. (C) Western blots of retina lysates from three biological replicates showing phosphorylation levels of GSK3β-S9. (D-H) Quantification of Western blots. *p<0.05, **p<0.01, ***p<0.001. Data are presented as means ± s.e.m, n=3.
Figure 6

mTORC1 and its downstream effectors are essential for AKT3-induced axon regeneration.
(A) Confocal images of ON longitudinal sections showing regenerating fibers labeled with CTB 2 weeks after ON crush. Scale bar, 100 µm. *crush site. (B) Quantification of regenerating fibers at different distances distal to the lesion site. *p<0.05, **p<0.01, ***p<0.001. Data are presented as means ± s.e.m, n=8–10. (C, D) Western blots of retina lysates from three biological replicates showing expression levels of HA-AKT3, and phosphorylation levels of S6. (E) Confocal images of flat-mounted retinas showing pS6 levels and Tuj1 positive RGCs, 2 weeks after ON crush. Scale bar, 20 µm. (F) Quantification of surviving RGCs, represented as percentage of Tuj1 positive RGCs in the injured eye, compared to the intact contralateral eye. Data are presented as means ± s.e.m, n=8–14.
Figure 7 with 1 supplement
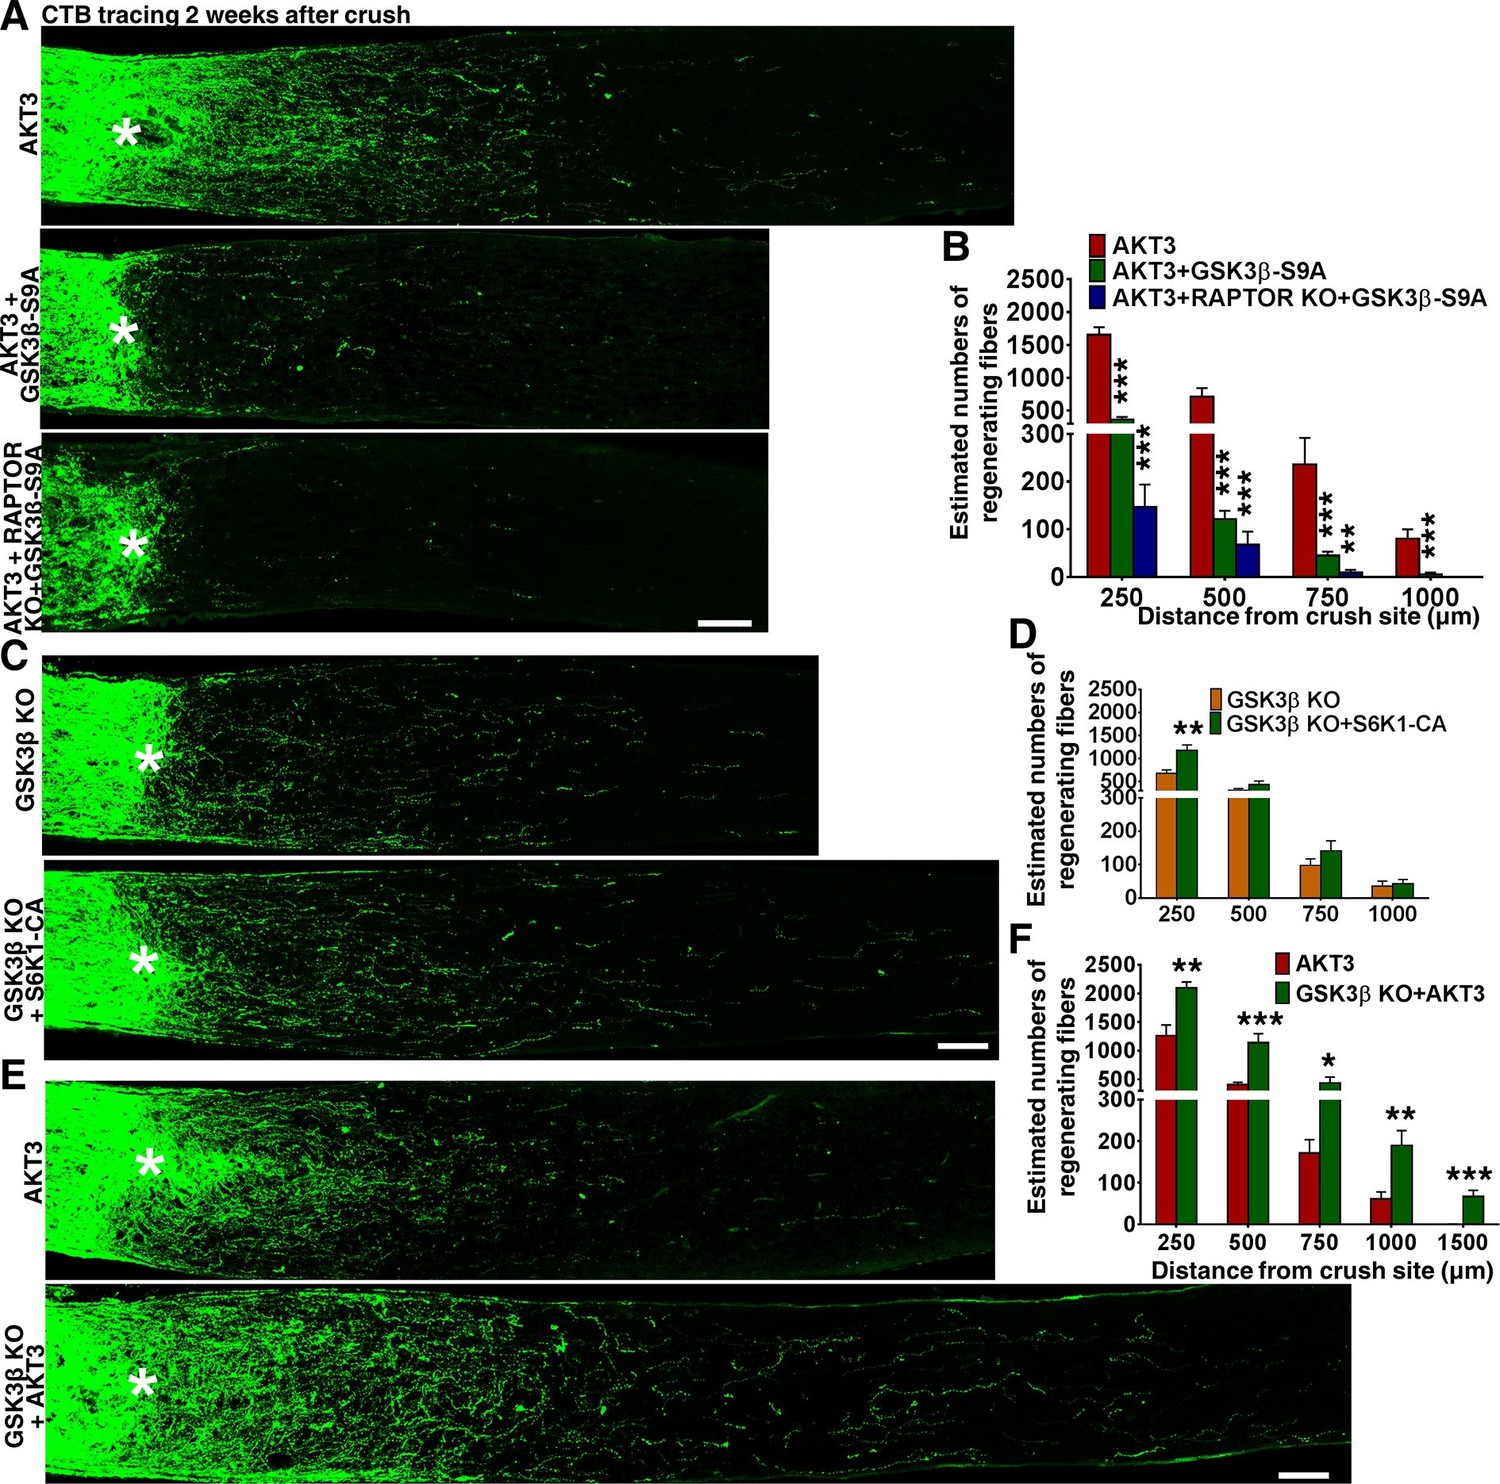
GSK3β phosphorylation and inhibition by AKT is necessary and sufficient for axon regeneration.
(A,C,E) Confocal images of ON longitudinal sections showing regenerating fibers labeled with CTB 2 weeks after ON crush. Scale bar, 100 µm. *crush site. (B,D,F) Quantification of regenerating fibers at different distances distal to the lesion site. *p<0.05, **p<0.01, ***p<0.001. Data are presented as means ± s.e.m, n=8–15.
Figure 7—figure supplement 1
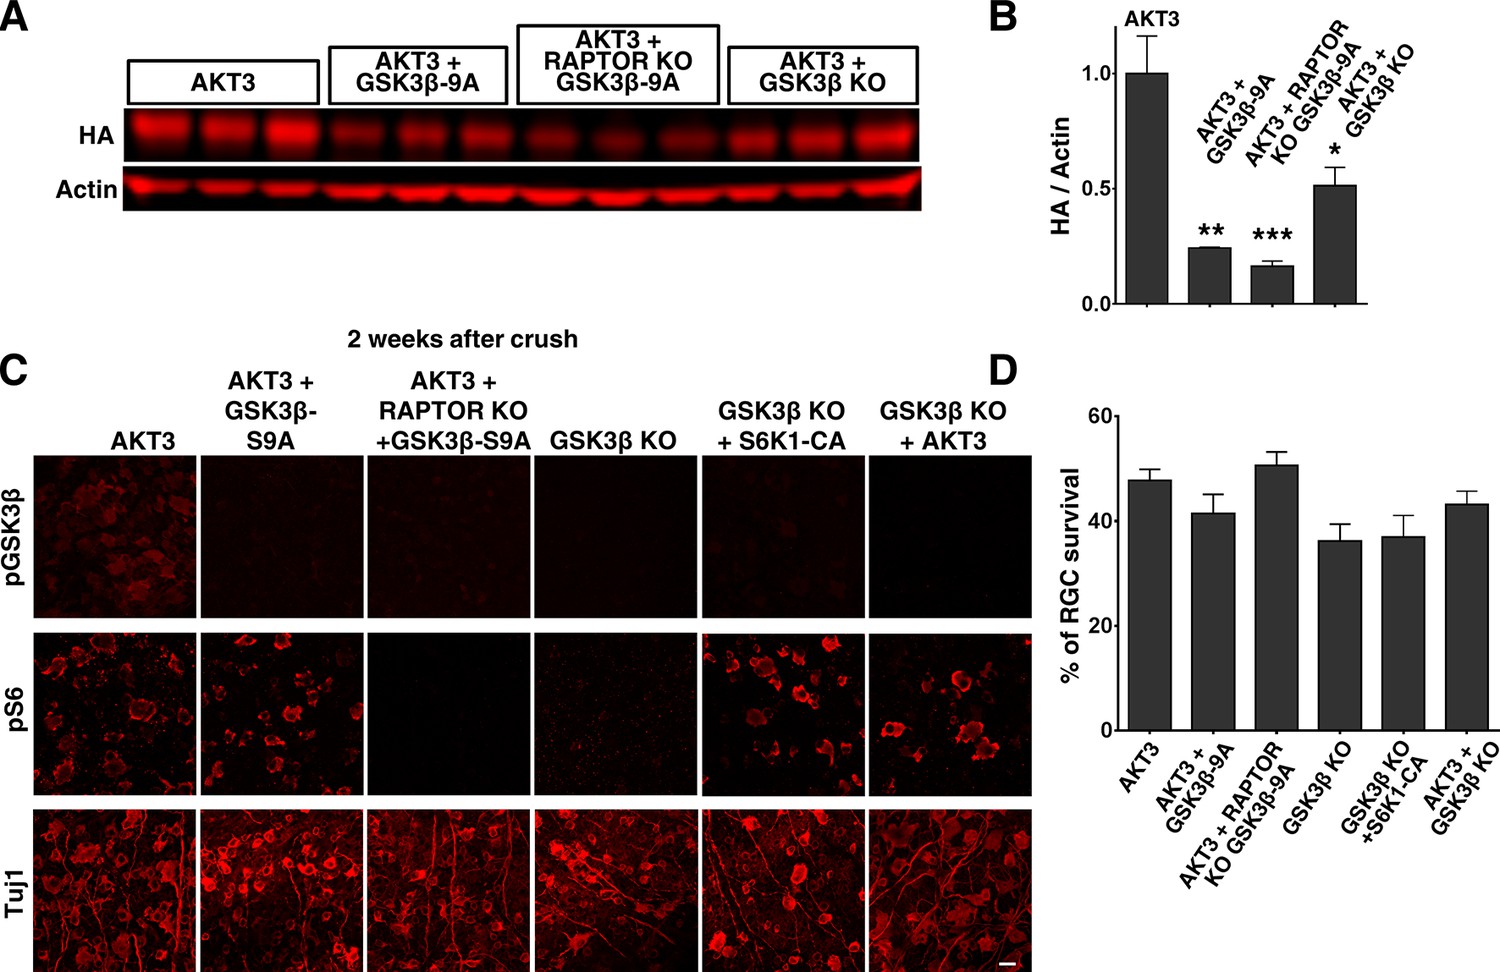
AKT3 expression and RGC survival after GSK3β manipulation.
(A) Western blots of retina lysates from three biological replicates showing expression level of HA-AKT3. (B) Quantification of Western blots. *p<0.05, **p<0.01, ***p<0.001. Data are presented as means ± s.e.m, n=3. (C) Confocal images of flat-mounted retinas showing individual labeling of pGSK3β, pS6 and Tuj1, 2 weeks after ON crush. Scale bar, 20 µm. (D) Quantification of surviving RGCs, represented as percentage of Tuj1 positive RGCs in the injured eye, compared to the intact contralateral eye. Data are presented as means ± s.e.m, n=8–10.
Figure 8
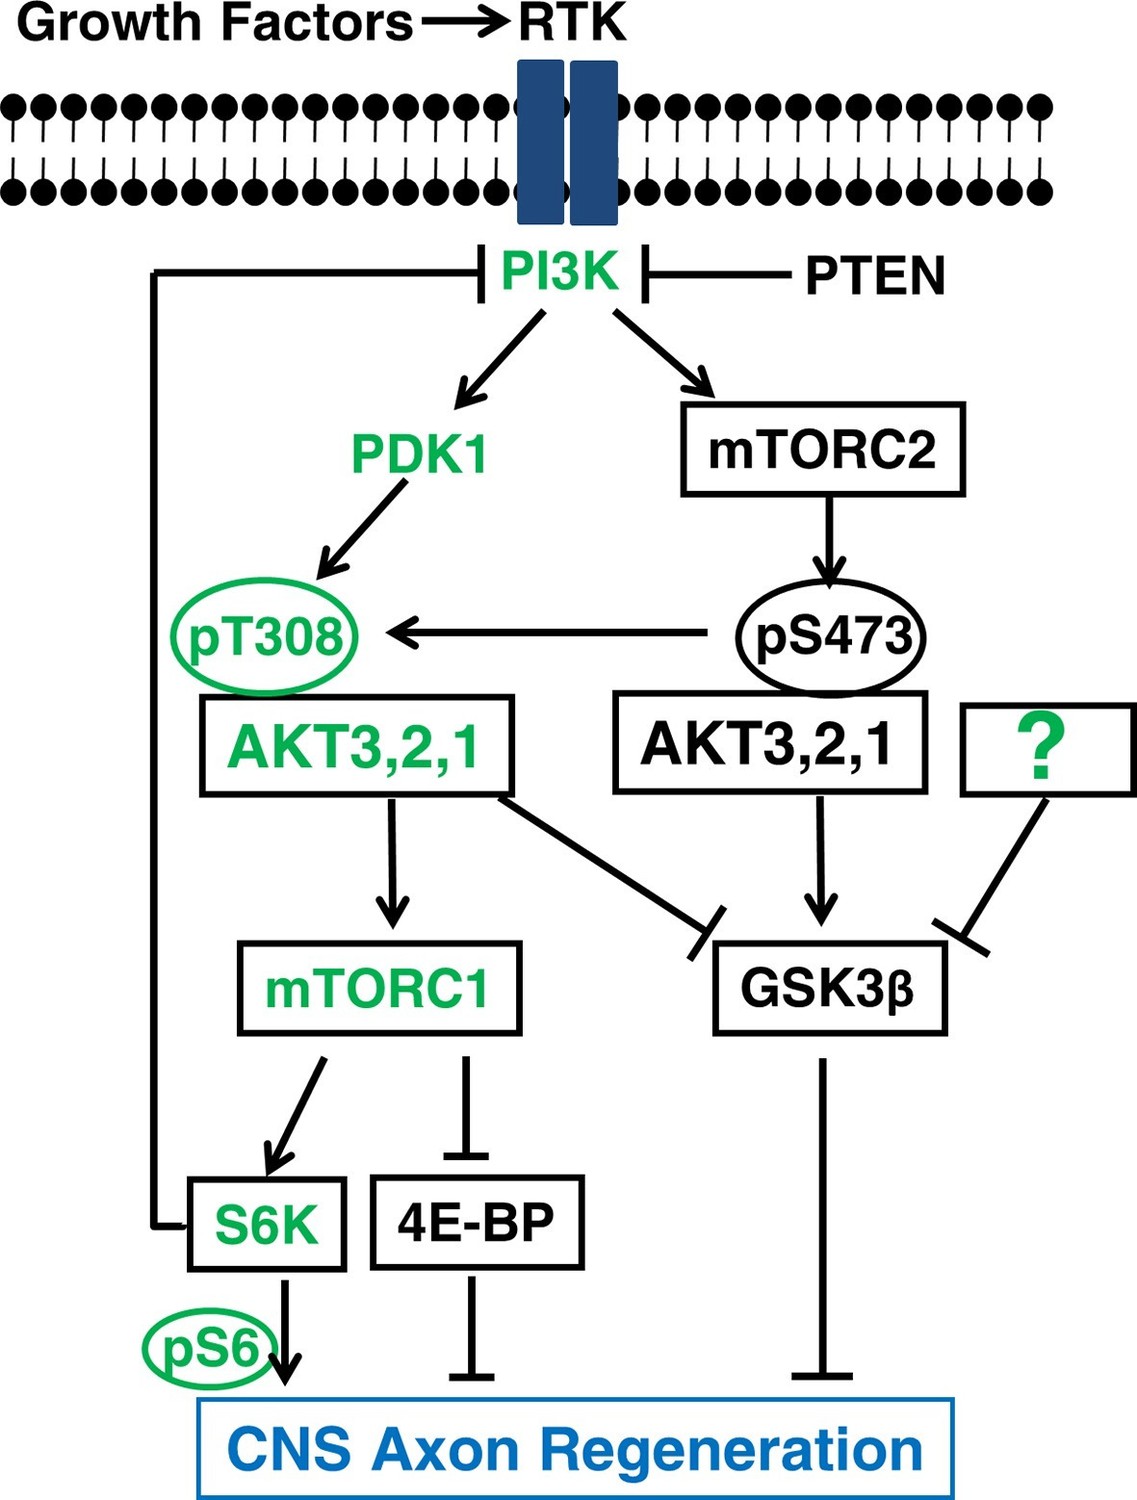
A schematic illustration depicting the interplay between AKT, mTORC1/2 and GSK3β in CNS axon regeneration.
The predominant isoform of AKT in brain and retina, AKT3, generates the most robust axon regeneration. Its function in axon regeneration is positively regulated by the PI3K/PDK1 pathway through phosphorylation of T308 (T305 in AKT3), and negatively regulated by the PI3K/mTORC2 pathway through phosphorylation of S473 (S472 in AKT3), through at least partially regulation of GSK3β phosphorylation and inhibition. Both AKT downstream effectors, activation of mTORC1 and phosphorylation/inhibition of GSK3β, synergistically promote axon regeneration; inhibition of GSK3β alone is also sufficient for axon regeneration. The question mark represents other upstream regulators of GSK3β that may also promote axon regeneration. Green color-coated molecules are pro-axon regeneration and dark color-coated molecules are anti-axon regeneration.
Download links
A two-part list of links to download the article, or parts of the article, in various formats.
Downloads (link to download the article as PDF)
Open citations (links to open the citations from this article in various online reference manager services)
Cite this article (links to download the citations from this article in formats compatible with various reference manager tools)
mTORC1 is necessary but mTORC2 and GSK3β are inhibitory for AKT3-induced axon regeneration in the central nervous system
eLife 5:e14908.
https://doi.org/10.7554/eLife.14908


