Polycomb enables primitive endoderm lineage priming in embryonic stem cells
- University of Edinburgh, United Kingdom
- University of Copenhagen, Denmark
- Univeristy of Edinburgh, United Kingdom
Figures
Figure 1 with 1 supplement
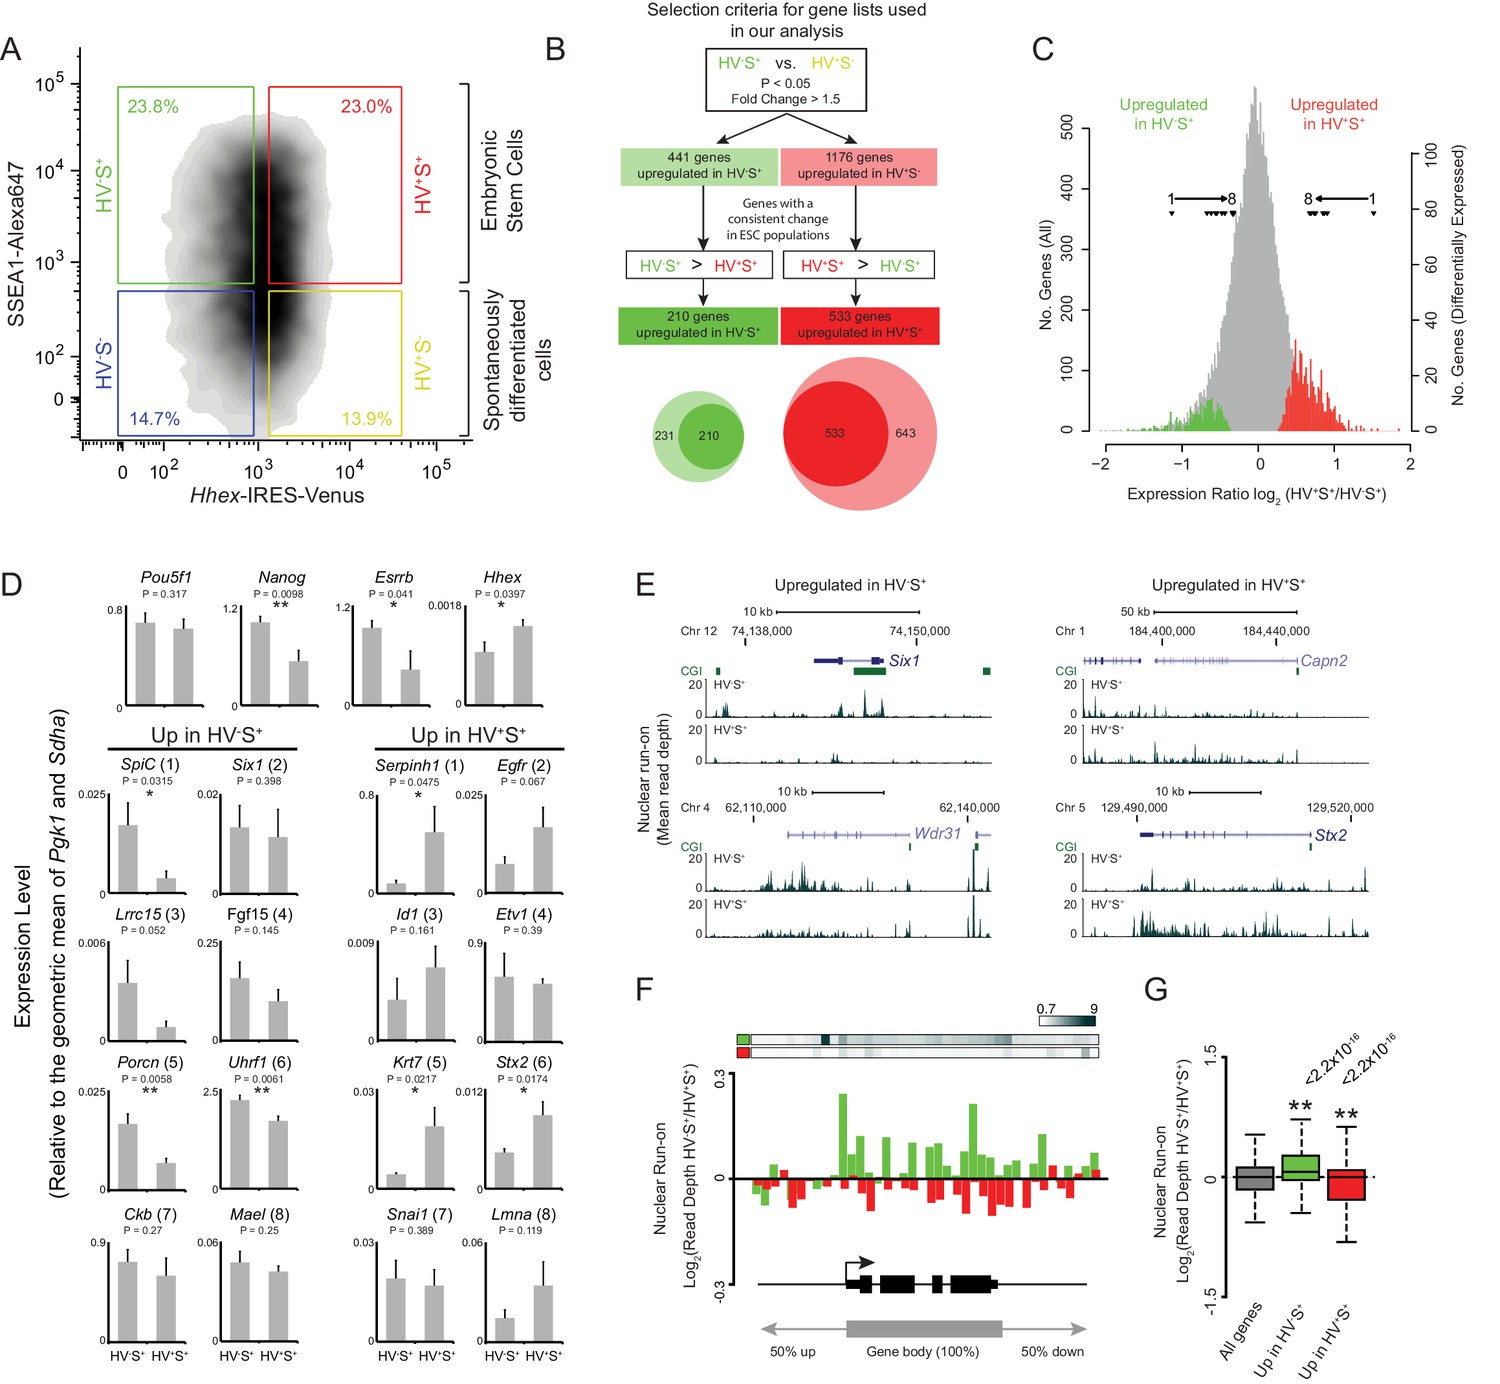
Heterogeneous Hhex reporter expression reflects coordinate changes in transcription.
(A) FACS density plot showing ESC populations in Hhex-Venus reporter cells co-stained for the pluripotency marker SSEA1 by indirect immunofluorescence. Coloured boxes show the gating used to define the two spontaneously differentiated cell populations, HV-S- (blue) and HV+S- (yellow), and the two primed ESC populations, HV-S+ (green) and HV+S+ (red). (B) Strategy used to select gene lists for analysis. The Venn diagram shows the overlap between the genes identified by comparing HV-S+ to HV+S- (light circles) and those with a consistent gene expression change when comparing HV-S+ to HV+S+ (dark circles). (C) Distribution of log2 HV+S+/HV-S+ expression ratios for all genes (grey), genes upregulated in HV-S+ (green), and genes upregulated in HV+S+ (red; see also Figure 1—figure supplement 1). The location of differentially expressed genes which are assessed by quantitative RT-PCR in (D) are indicated (filled triangles). (D) Quantitative RT-PCR validation of the microarray results. Bar graphs showing the mean + standard error of 4 biological replicates (2 independently grown clones of 2 independent Hhex reporter cell lines; Hhex-IRES-Venus (HV) and Hhex-3xFLAG-IRES-H2b-mCherry (HFHC)). The differential expression levels of these candidate genes are indicated in (C) and are ranked accordingly (labeled 1–8). Statistical analysis was performed using a homoscedastic one-tailed t-test (significant results are indicated* and p values are given above each graph). Samples were sorted by FACS as indicated in (A). For primer details see Supplementary file 5 and for additional qPCR validation, see (Canham et al., 2010). (E) Example GRO-seq profiles (normalised read depth) at differentially expressed genes Six1 and Wdr31 (upregulated in HV-S+) and Capn2 and Stx2 (upregulated in HV+S+). Profiles were generated using the UCSC genome browser with bp coordinates given for mm9. (F) Log2 GRO-seq HV-S+/HV+S+ read depth across a composite gene with normalised length representative of genes upregulated in HV-S+ (green) and genes upregulated in HV+S+ (red). The bars at the top show the average GRO-seq signal in each of the gene lists, while the graph shows the average differential transcript level for each of the gene lists. (G) Boxplots showing the log2 ratio of GRO-seq signal between HV-S+ and HV+S+ ESC populations for all genes (grey), genes upregulated in HV-S+ (green) and genes upregulated in HV+S+ (red). Two-sample permutation tests (oneway test) were used to compare the GRO-seq signal at priming vs all genes. p values of < 0.01 are indicated** and noted above the plot. See Figure 1—figure supplement 1D for individual biological replicates.
Figure 1—figure supplement 1
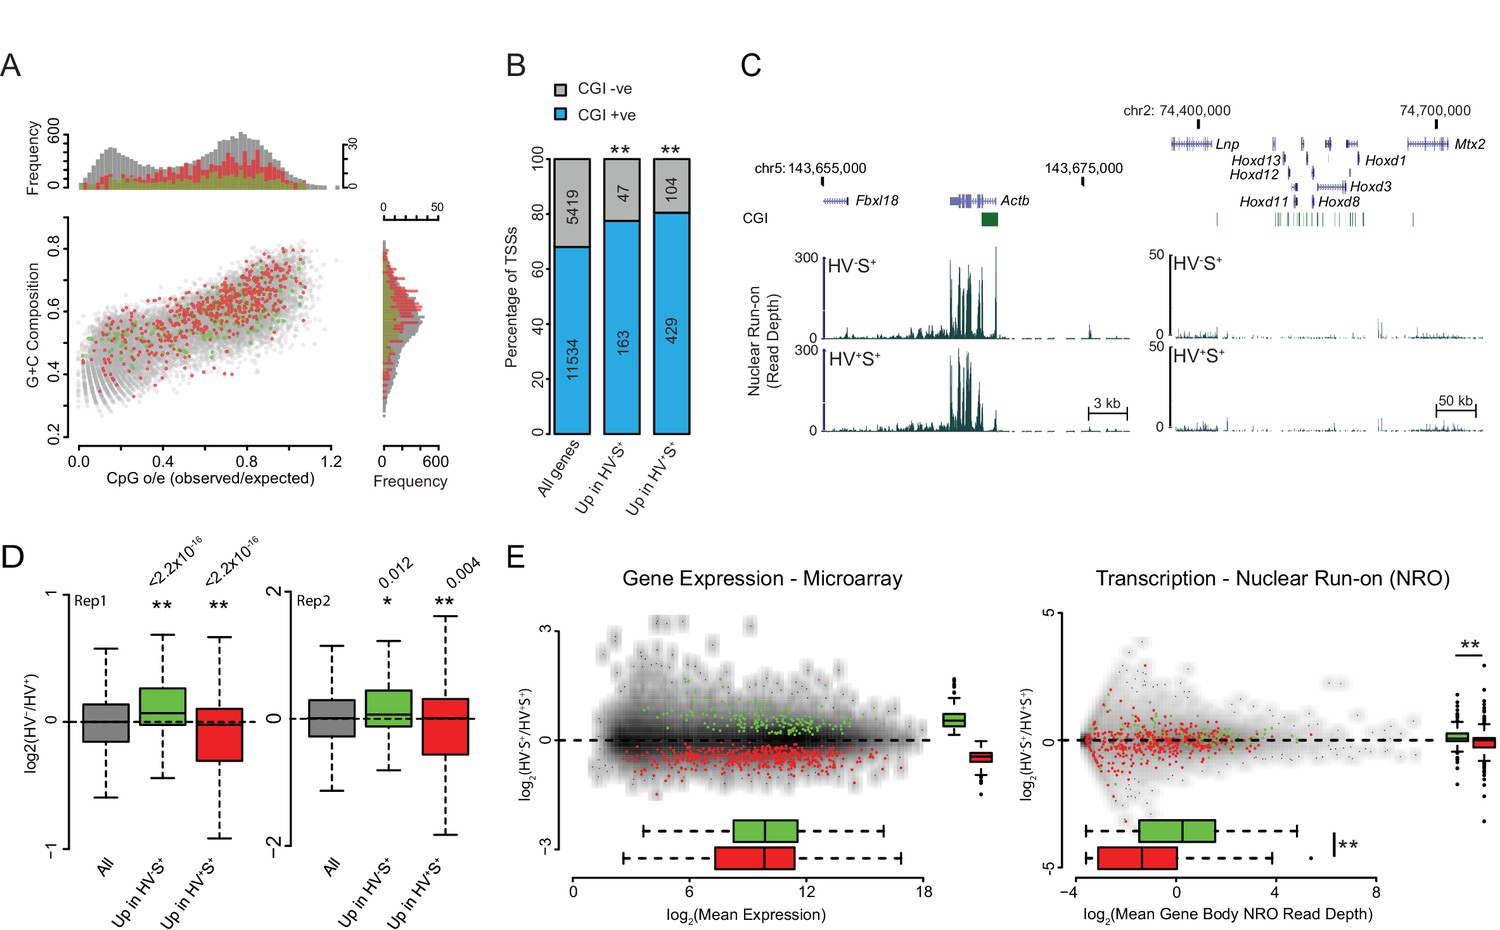
Validation and characterisation of priming genes.
(A) Scatter plot comparing CpG observed/expected (o/e) ratio vs G+C composition at the TSS (+/- 500bp) for all genes (grey) and for those upregulated in the HV-S+ (green) and HV+S+ (red) populations of ESCs. (B) Barplot showing the percentage of TSSs that overlap a CGI for all genes and for those upregulated in the HV-S+ and HV+S+ populations of ESCs. Significant over-representation with p values of < 0.01 as determined using a Fisher’s test are indicated**. (C) Example GRO-seq profiles (normalized read depth) at the ‘control’ loci Actb (constitutively expressed) and Hoxd (canonical Polycomb target and silent in ESCs). Profiles were generated using the UCSC genome browser with coordinates given for mm9. (D) Boxplots depicting the two GRO-seq replicates (independently grown ES cultures) which were combined to produce the data shown in Figure 1E–G. The boxplots show the log2 ratio of GRO-seq signal between HV-S+ and HV+S+ ESC populations for all genes (grey), genes upregulated in HV-S+ (green) and genes upregulated in HV+S+ (red). Two-sample permutation tests (oneway test) were used to compare the GRO-seq signal at priming vs all genes. p values of < 0.01 are indicated** and noted above the plot. (E) MA plots depicting steady-state mRNA levels as measured by Microarray (left panel) and nascent RNA levels as measured by GRO-seq (right panel) for genes up in HV-S+ (green) and HV+S+ (red). Significant results with a p value < 0.01 as determined by a Wilcoxon Rank Sum Test (comparing GROseq read depth) and a two-sample permutation test (comparing Log2 ratio values) are indicated**.
Figure 2 with 4 supplements

PrEn priming genes are enriched for polycomb targets.
(A) Example H3K27me3 ChIP-seq profiles (log2(IP/Input)) for Actb and Hoxd (Control Loci), Aldh1b1 (Upregulated in HV-S+) and Zmiz1 (Upregulated in HV+S+). Coordinates given are for the mm9 genome build. (B) Schematic representation of the stratification used to bin H3K27me3 signal with respect to genes (upper panel) and boxplots showing the ratio and average read depths (middle and lower panels respectively) of H3K27me3 ChIP-seq signal. The ratios represent the comparison of H3K27me3 ChIP-seq signal between the HV-S+ and HV+S+ ESC populations for both native and formaldehyde cross-linked ChIP (indicated as ‘native’ and ‘X-link’ respectively; the data is presented as in Figure 1G). Genes were defined as ‘PRC2 Targets’ if they were enriched for H3K27me3 at their TSS (± 100 bp) and were also upregulated in cells deficient for the PRC2 component EED (Leeb et al., 2010). Two-sample permutation tests (oneway test) were used to compare the H3K27me3 ChIP-seq signal at priming vs all genes. P values of < 0.01 are indicated** (all indicated p values are < 2.2 × 10⁻¹⁶). (C) H3K27me3 ratios (log2(IPHV-S+/InputHV-S+)-log2(IPHV+S+/InputHV+S+)) between the HV-S+ and HV+S+ populations presented as for Figure 1F. (D) TSS (± 2.5 kb) heatmaps and summary plots of H3K27me3 signal (log2(IP/Input)) for genes with differential expression between the HV-S+ and HV+S+ ESC populations. (E) Barplot representing the percentage of genes that are enriched for H3K27me3 within 100 bp of their TSS. Significance enrichment versus all genes was tested using a Fisher’s test and ** indicates a p value of < 0.01 (actual value of 3.4 × 10–36). (F) Barplots depicting the proportion of priming-genes that are up- or down-regulated in Ring1b-/-, Eed-/- or Ring1b-/-/Eed-/- double knockout ESCs (blue, black and blue/black labelled bars, respectively). Significant enrichment or depletion relative to all genes was assessed using a Fisher’s exact test and significant enrichment or depletion for each comparison is indicated (*0.05 > p ≥ 0.01 and **p < 0.01). Significant p values indicated*/** are 7.5 × 10⁻³, 3.51 × 10⁻¹¹, 1.08 × 10⁻³³, 7.49 × 10–89, 2 × 10⁻², 2 × 10⁻³, 1.34 × 10⁻¹¹ and 2.99 × 10⁻¹³ (left to right).
Figure 2—figure supplement 1
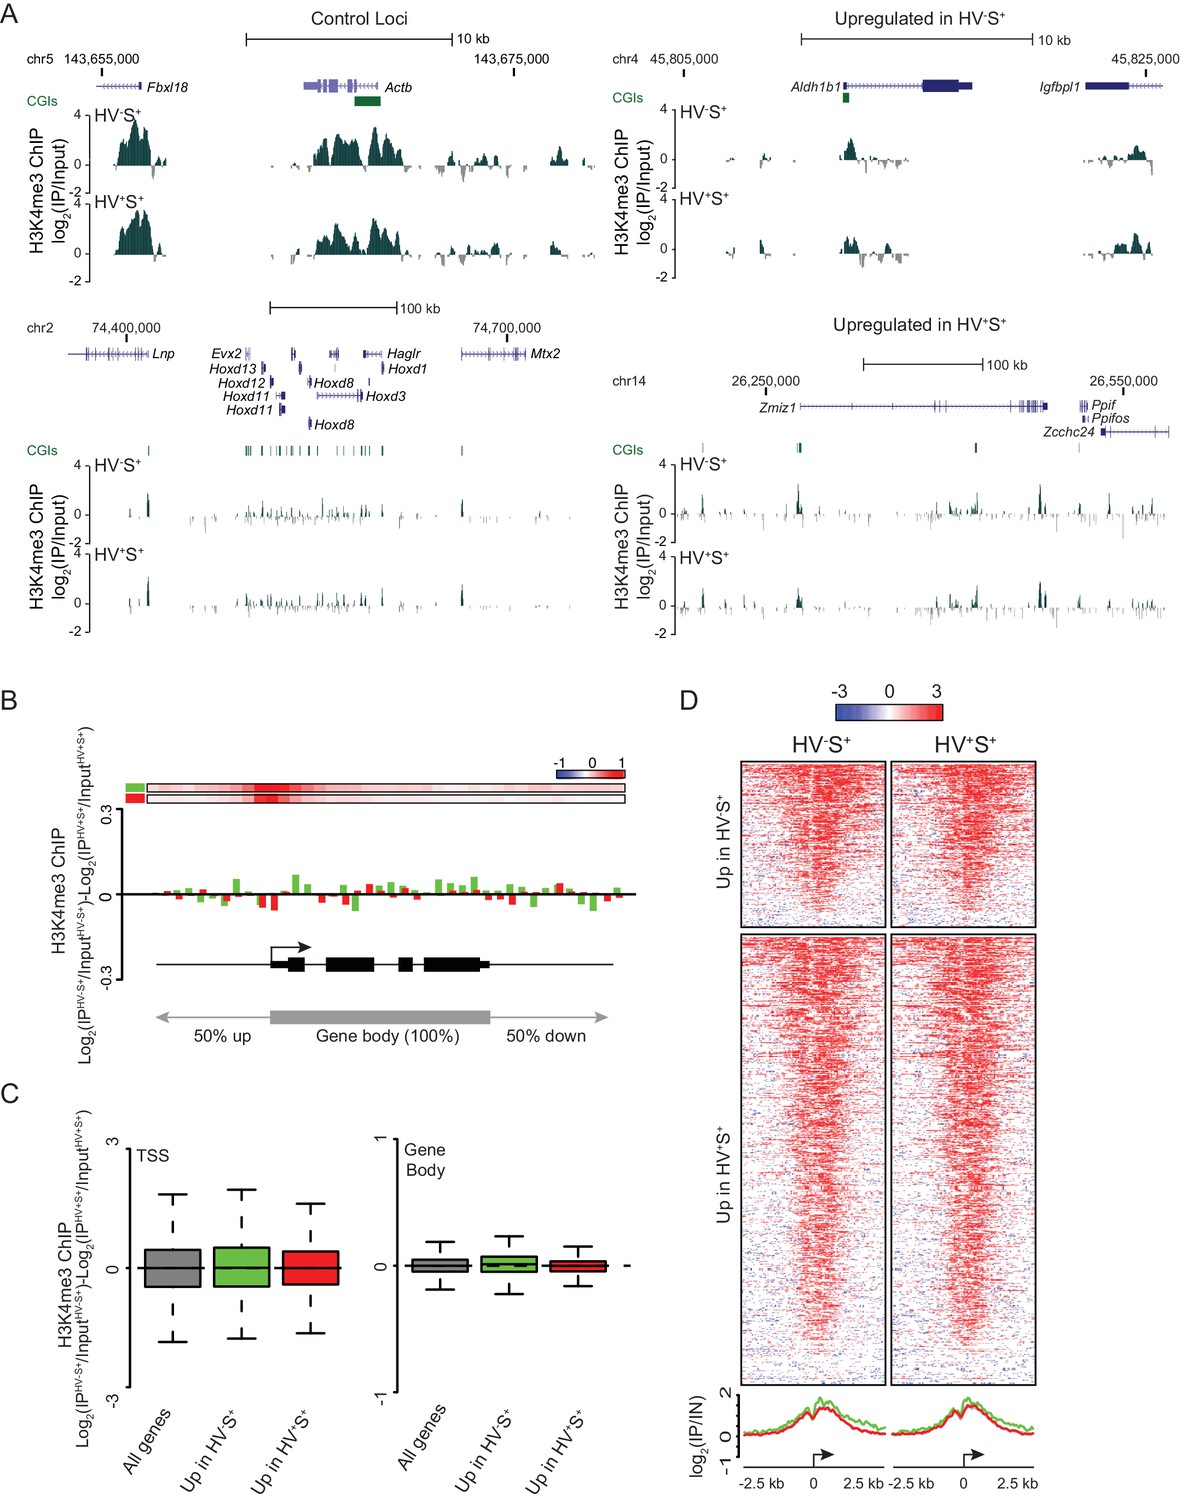
Invariant H3K4me3 levels at Epi- and PrEn-primed genes.
(A) Example H3K4me3 ChIP-seq profiles (log2(IP/Input)) for Actb and Hoxd (control), Aldh1b1 (upregulated in HV-S+) and Zmiz1 (upregulated in HV+S+). Profiles were generated using the UCSC genome browser with coordinates given for mm9. (B) H3K4me3 ratios (log2(IPHV-S+/InputHV-S+)-log2(IPHV+S+/InputHV+S+)) between the HV-S+ and HV+S+ populations across a composite gene with normalized length representing genes upregulated in HV-S+ (green) and HV+S+ (red). The bars at the top represent mean read depth of both populations across the locus. (C) Boxplots showing the ratio of H3K4me3 ChIP-seq signal between HV-S+ and HV+S+ ESC populations for TSS (left; ± 500 bp) and gene body (right) for all genes (grey), genes upregulated in HV-S+ (green) and genes upregulated in HV+S+ (red). (D) Heatmaps and summary plots of H3K4me3 (log2 (IP/Input)) around the TSS (± 2.5 kb) for differentially expressed gene sets in both the HV-S+ and HV+S+ ESC populations.
Figure 2—figure supplement 2
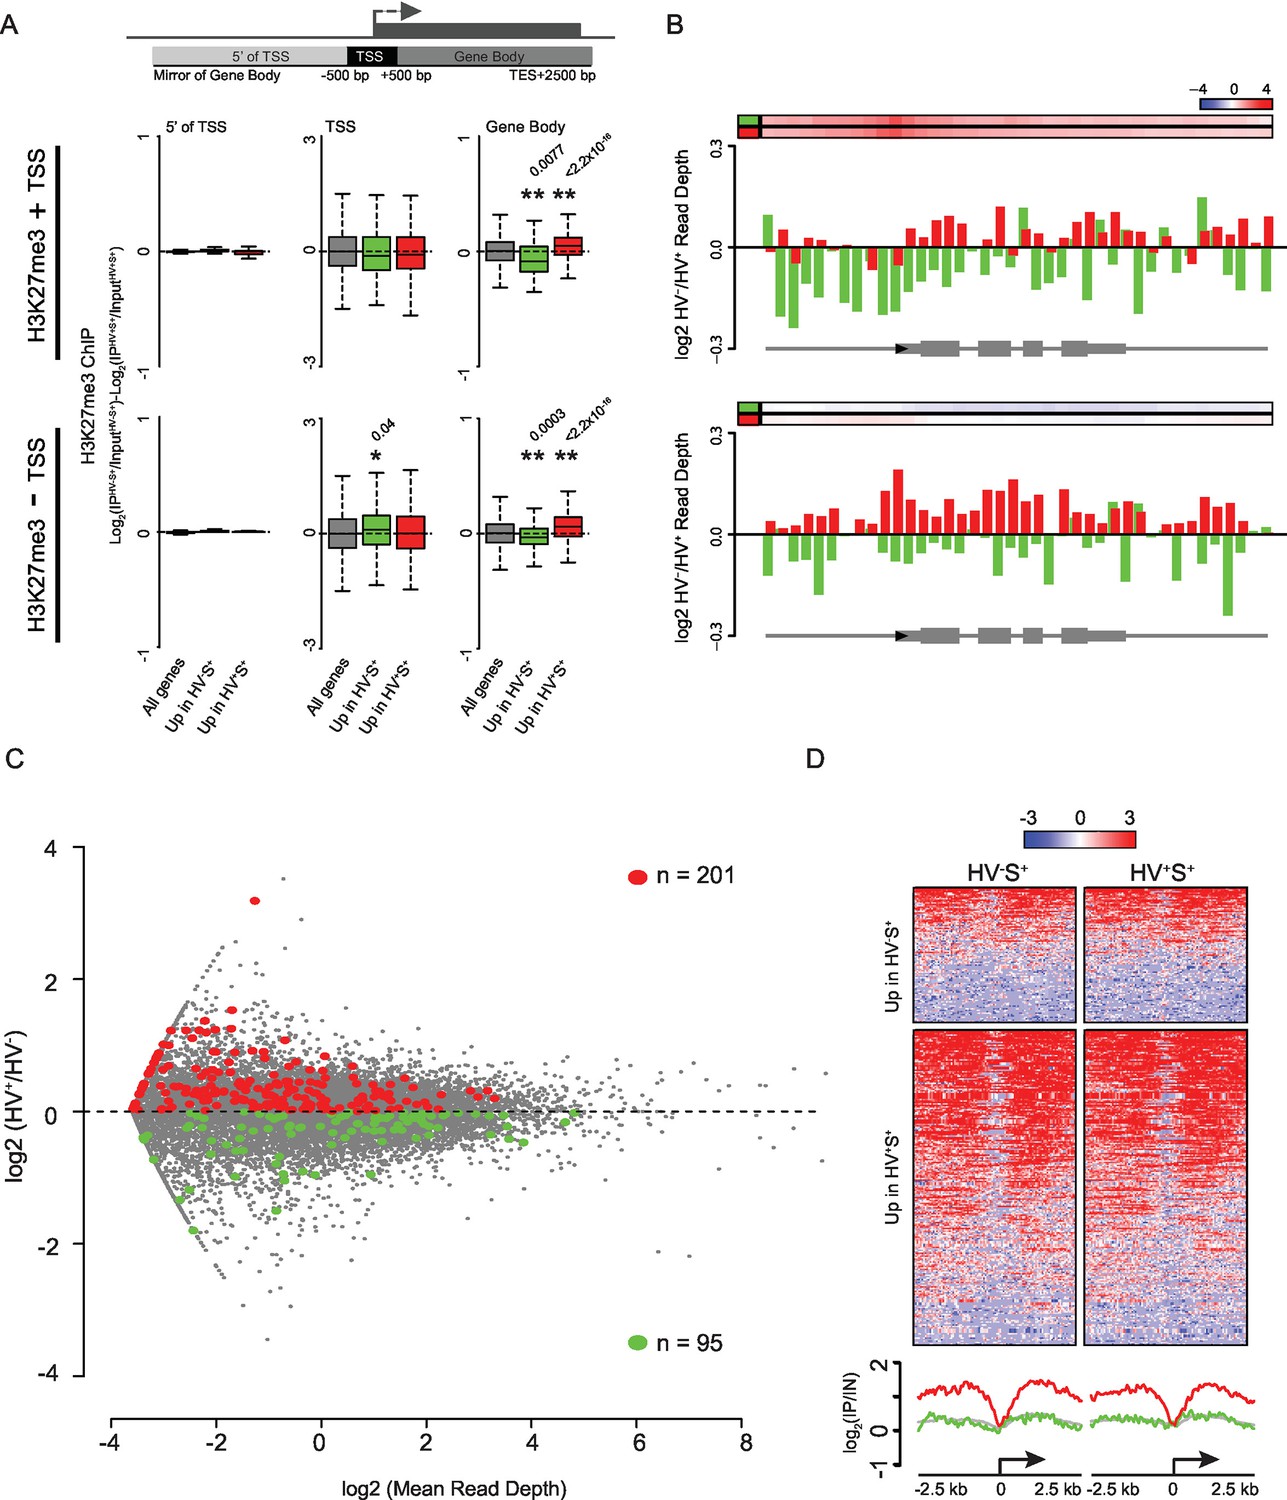
Dynamic changes in gene-body H3K27me3 levels contrasts with a specific enrichment of H3K27me3 at the promoters of PrEn-primed genes.
(A) Schematic representation of the stratification used to bin H3K27me3 signal with respect to genes (upper panel). Boxplots showing the log2 ratios of H3K27me3 ChIP-seq signal between the two primed ESC populations for genes with or without an H3K27me3 ‘peak’ at their TSS (middle and lower panels respectively; presented as in Figure 1G). Refseq genes were scored as H3K27me3 +ve if a ‘peak’ was found within 100 bp of the annotated TSS. Two-sample permutation tests (oneway test) were used to compare the H3K27me3 ChIP-seq signal at priming vs all genes. Significant p values are indicated* and their values shown above the plot. (B) H3K27me3 ratios (log2(IPHV-S+/InputHV-S+)-log2(IPHV+S+/InputHV+S+)) between the HV-S+ and HV+S+ populations presented as for Figure 1F. Barplots are presented for priming genes sub-divided into those with or without an associated ‘peak’ of H3K27me3 at their TSS (upper and lower panels respectively; association scored as for (A). (C) MA plot comparing nascent RNA levels (measured by GRO-seq) between HV-S+ and HV+S+ cell populations. Genes found to show a consistent differential RNA signal in both steady-state and GRO-seq datasets are highlighted in green and red (upregulated in HV-S+ and HV+S+ respectively; numbers of genes are indicated within the plot). (D) TSS (± 2.5 kb) heatmaps and summary plots depicting H3K27me3 signal (log2(IP/Input)) for genes with differential steady-state and nascent RNA levels (selection based on panel C) between the HV-S+ and HV+S+ ESC populations.
Figure 2—figure supplement 3

More pronounced changes in H3K27me3 levels are observed in differentiating cells.
(A) Venn diagrams showing the overlap of genes with elevated expression in Rex+ and HV-S+ ESC populations (left) and elevated expression in Rex- and HV+S+ (right) ESC populations. Numbers of overlapping genes are given for each comparison with significant over/under representation determined using a Fisher’s test. (B) Boxplots showing the ratio of H3K27me3 ChIP-seq signal between Rex+ and Rex- ESC populations for TSS (left) and gene body (right) for all genes (grey), genes upregulated in Rex+ (green), and genes upregulated in Rex- (red). Two-sample permutation tests (oneway test) were used to compare the H3K27me3 ChIP-seq signal between all vs. differentially expressed genes. P values of < 0.01 are indicated** (all indicated p values are < 2.2 x 10⁻¹⁶). (C) FACS density plot showing the gating used to isolate the Epi-primed (HV-S+; green gate) and spontaneously differentiated PrEn (HV+S-; yellow gate) populations from the Hhex-Venus reporter ESCs co-stained for the pluripotency marker SSEA1. (D) Schematic representation of the stratification used to bin H3K27me3 signal with respect to genes (upper panel) and boxplots showing the ratio of H3K27me3 ChIP-seq signal between HV-S+ and HV+S- ESC populations (presented as in Figure 1G). Significance was tested and indicated as for panel B (indicated p values from left to right as shown are 0.004, 0.02 and < 2.2 × 10⁻¹⁶).
Figure 2—figure supplement 4
Differential gene-body H3K27me3 and the re-equilibration dynamics of Hhex defined lineage priming.
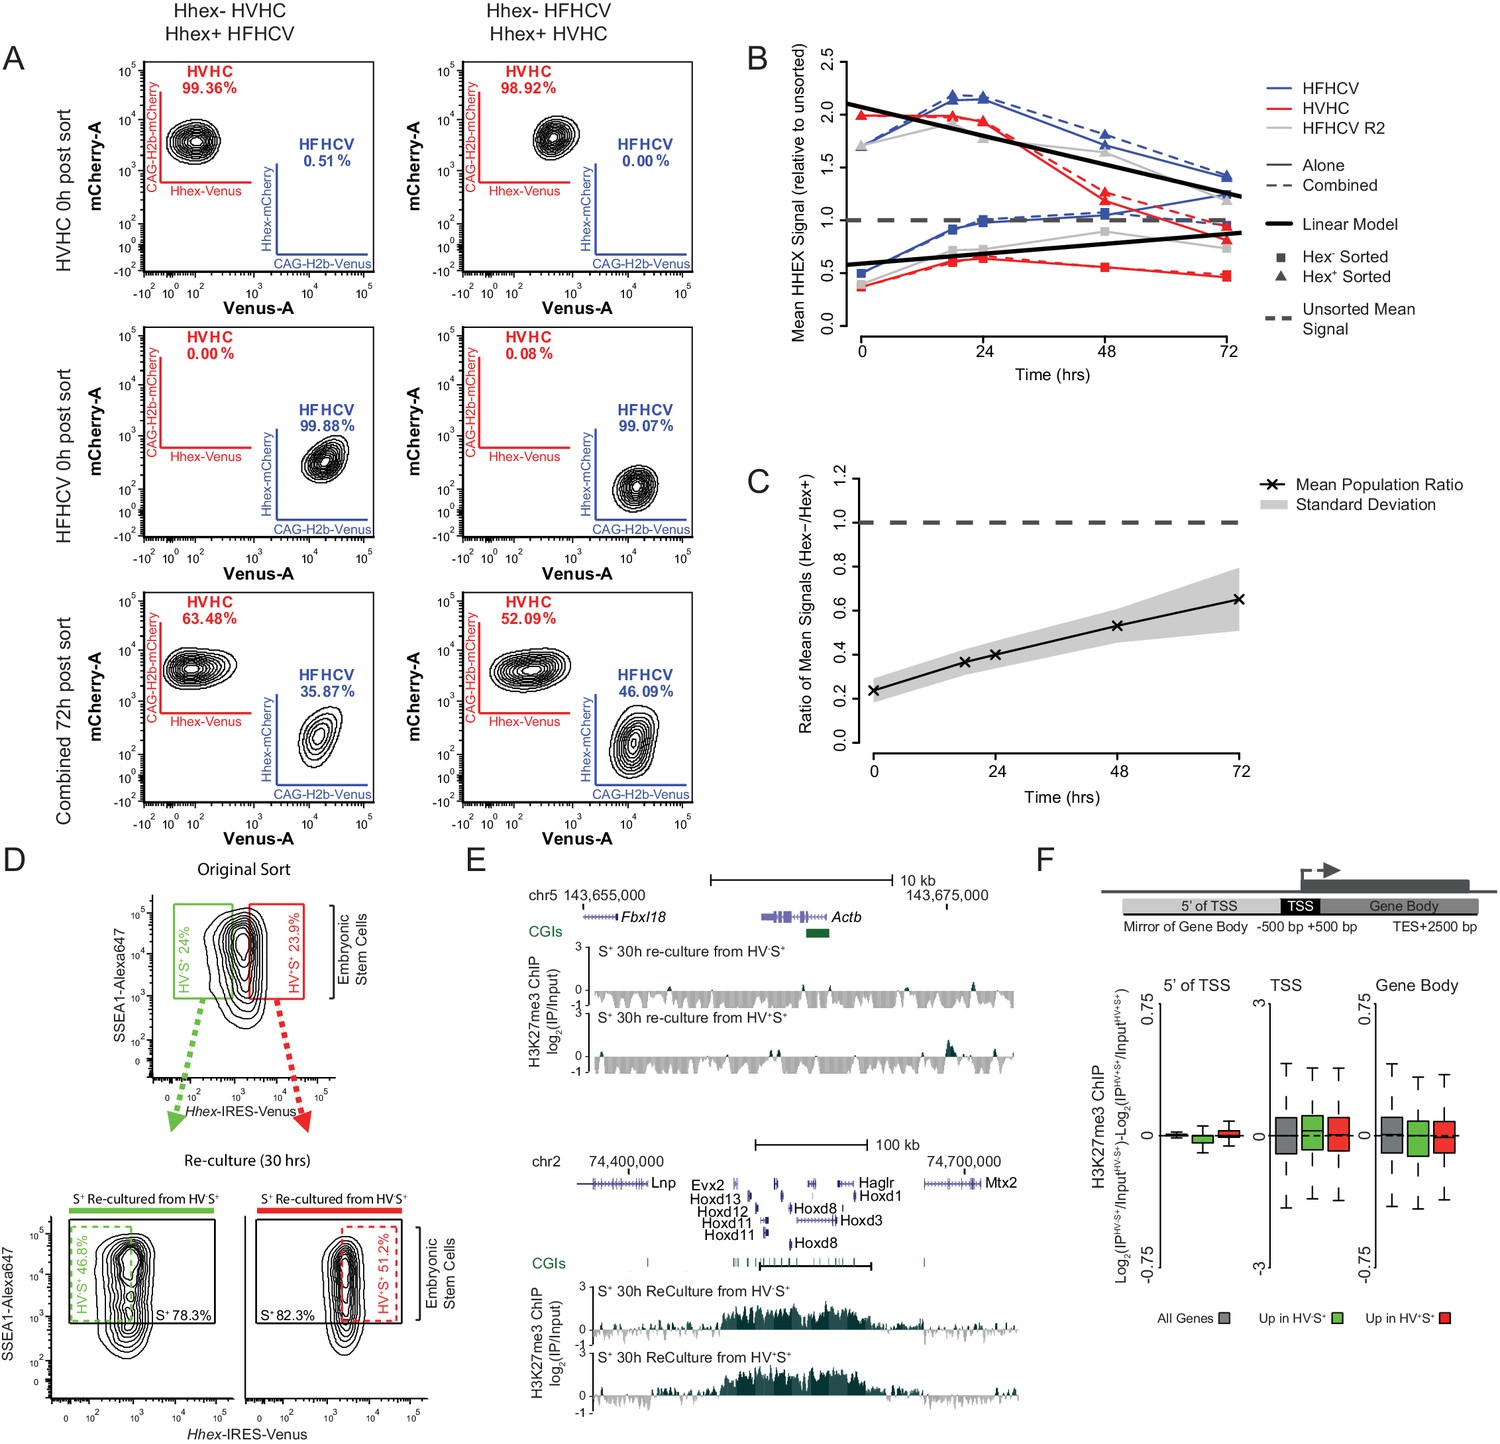
(A) FACS density plots showing the primed cell populations isolated from the HVHC and HFHCV reporter cell lines (Hhex expression monitored by venus and cherry expression respectively; see materials and methods for details) and the pluripotency cell surface marker SSEA1. To monitor the rate at which these populations return to equilibrium, Epi- and PrEn-primed cells were isolated from each reporter line (upper panels) and re-cultured either individually or in combination for a total of 72 h (bottom panel). In both cases a lineage reporter, either H2b-mCherry (HVHC) or H2b-Venus (HFHCV), expressed at an order of magnitude higher levels than the Hhex reporter allows the identification of specific cell lines, regardless of Hhex expression (e.g. compare the Cherry expression in the HVHC cells on the top line, to those derived from the HFHCV, second line). This enables the identification of originating cell/population from which Hhex is expressed in mixing experiments. (B) Summary plot showing the population averaged Hhex expression when the Epi- and PrEn-primed cells (squares and triangles respectively) are re-cultured either alone or in combination (solid and dashed coloured lines respectively). Hhex expression values for each population represent the mean population signal relative to the initial unsorted mean value. (C) Summary plot showing the arithmetic mean Hex- vs. Hex+ ratio plotted against time in culture post-sorting. The standard deviation for this data is highlighted in grey. (D) FACS density plots showing the Hhex and SSEA1 profiles of Epi- and PrEn primed populations (green and red gates respectively) isolated from HV5.1 reported ESCs. Shown are the primed populations at the point of sorting (upper panel) and following 30 h of re-culture (lower panel). H3K27me3 ChIP was performed on the total SSEA1 positive gate (S+; black box) from the re-cultured populations (see E and F). (E) Example H3K27me3 ChIP-seq profiles (log2(IP/Input)) for Actb and Hoxd (Control Loci) for the 30 h re-cultured populations shown in (D). Coordinates are for the mm9 mouse genome assembly. (F) Schematic representation of the stratification used to bin H3K27me3 signal with respect to genes (upper panel) and boxplots showing the ratio of H3K27me3 ChIP-seq signal between the two re-cultured primed ESC populations from formaldehyde cross-linked ChIP. The presented data was generated from cells re-cultured from the sorts presented in Figure 2B. Two-sample permutation tests (oneway test) identified no significant differential H3K27me3 levels between the re-cultured populations.
Figure 3 with 2 supplements
Polycomb deficiency results in reduced cell to cell expression heterogeneity of key pluripotency and PrEn priming genes.
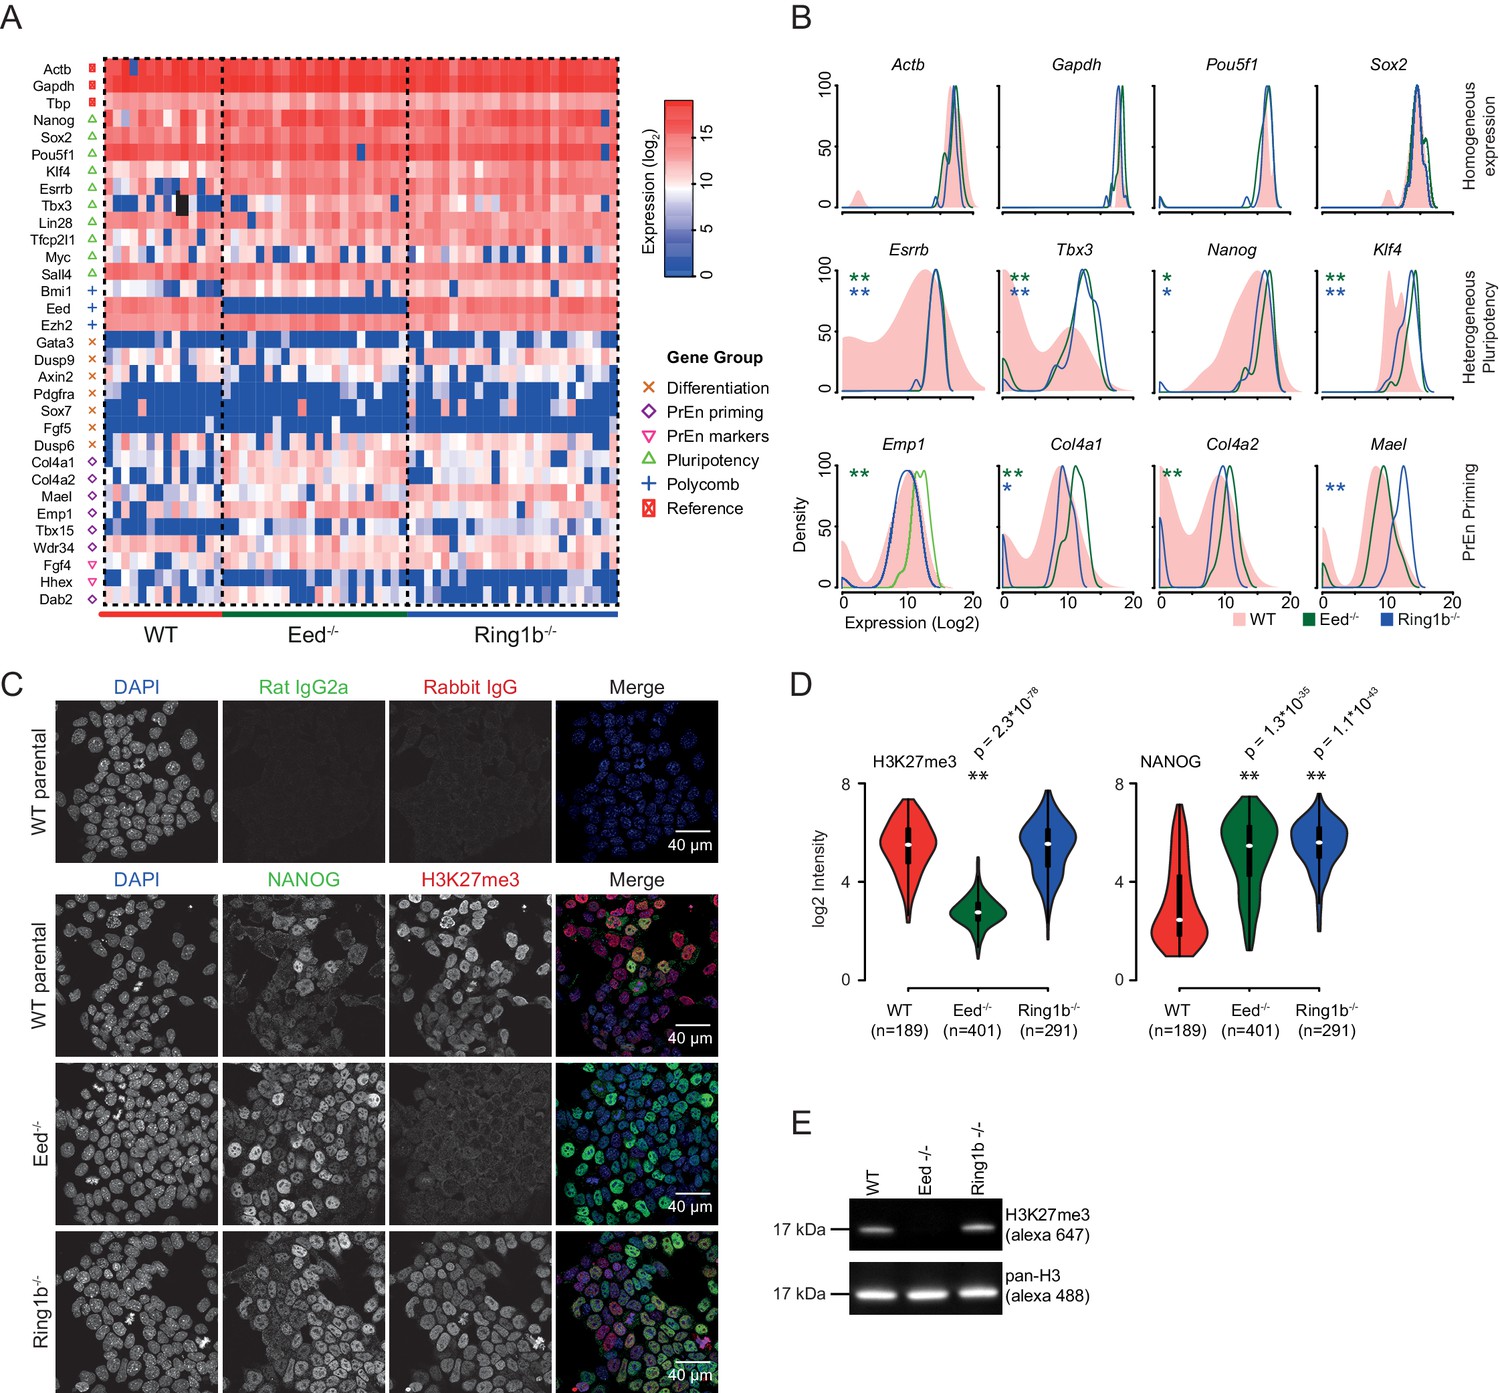
(A) Heatmap representing the log2 expression values for individual cells for each gene (columns and rows respectively) measured by single cell qRT PCR (see also Figure 3—figure supplement 1A). Dashed lines, group cells based on genotype (WT - light red, Eed-/- - green and Ring1b-/- - blue). (B) Density plots showing the per cell distribution of log2 gene expression values for each of the WT (light red), Eed-/- (green) and Ring1b-/- (blue) genotypes at a subset of key genes taken from (A). The expression profiles between WT and Eed-/- or WT and Ring1b-/- cells were assessed for significance using a Kolmogorov-Smirnov (KS) test under the null hypothesis that there was no shift in the distribution of expression values between these comparisons. Significant results are indicated (green and blue asterisks respectively; p values are presented in the left panel of Figure 3—figure supplement 1B). (C) Immunofluorescence labelling of NANOG (green) and H3K27me3 (red) in WT, Eed-/- andRing1b-/- mouse ESCs. Scale bar = 40 µm. (D) Violin plots showing the quantification of immunofluorescent signal presented in (C). For each cell line, three fields of view were analysed and significance of the differential signal between WT and mutant cells was determined using a Wilcoxon Rank Sum test. Significant results are indicated with asterisks. (E) Example immunoblot showing H3K27me3 levels relative to total H3 in the indicated polycomb mutant ESC lines.
Figure 3—figure supplement 1

Single cell quantitative RT-PCR shows reduced cell to cell expression heterogeneity of key pluripotency and PrEn priming genes.
(A) Violin plots showing the distribution of log2 gene expression values across WT (red), Eed-/- (green) and Ring1b-/- (blue) cells as determined by single cell qRT PCR for 32 candidate genes. (B) KS (indicated in Figure 3B) and Wilcoxon Rank Sum test results for the single cell Q-RT PCR data shown in Figure 3B.
Figure 3—figure supplement 2
Eed deficient ESCs cannot maintain Hhex priming in self-renewal.
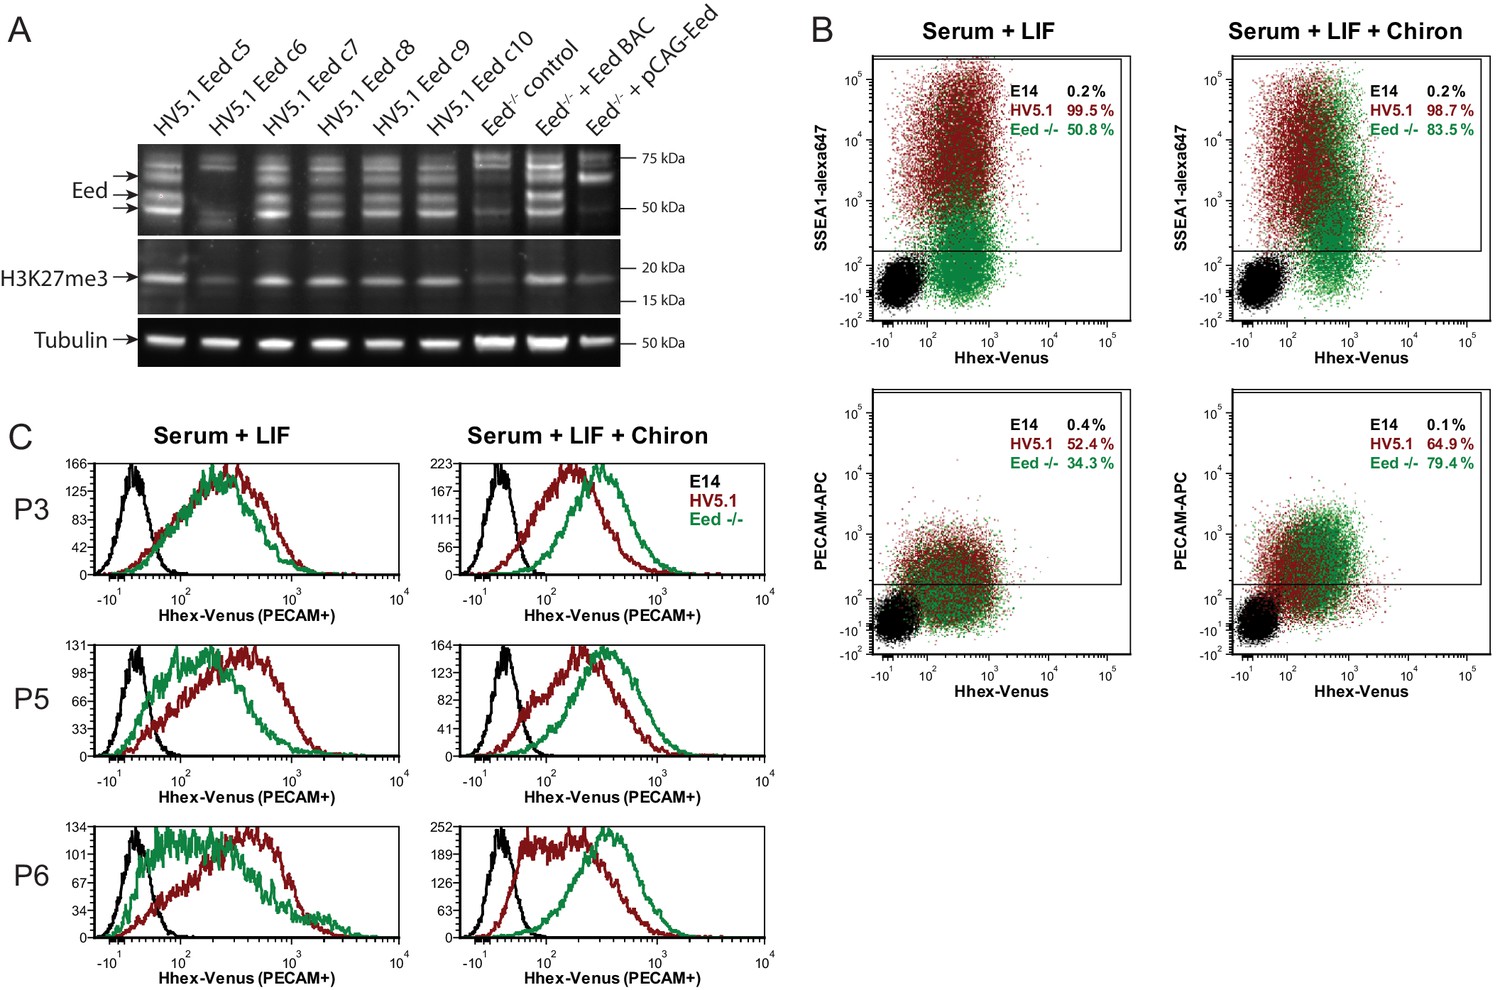
(A) Western blot for EED, H3K27me3 and Tubulin showing Eed mutation in HV5.1 Eed clone 6 induced by CRISPR. A homozygous mutant clone is shown alongside several transfected clones that were either WT or heterozygous. The absence of Eed protein in the mutant clone is apparent and consistent with the observed loss of H3K27me3, indicating that Eed has been knocked out. (B) Flow cytometry of HV5.1 parental and Eed-/- HV5.1 c6 cells stained with either SSEA1-alexa647 or PECAM-APC. Eed-/- HV5.1 cells did not proliferate well in serum + LIF and required the addition of the Gsk3 inhibitor Chiron to support efficient expansion. After three passages, Chiron could be removed without a clear effect on proliferation. Under these conditions, Eed-/- HV5.1 cells exhibited a loss of Hhex heterogeneity in standard culture, but there was a marked stimulation of Hhex expression to levels not normally observed with the HV reporter, when they were cultured in Chiron. SSEA1 and PECAM profiles of Eed-/- HV5.1 c6 cells in either serum + LIF (2 passages after Chiron removal) or serum + LIF + Chiron (2 passages) are shown. (C) Eed-/- HV5.1 c6 cells in either serum + LIF or serum + LIF + Chiron can be shifted between media states and re-establish heterogeneity or loss thereof, based on the culture media. P3, P5 and P6 to the left of the histograms are passage numbers in the indicated media.
Figure 4 with 3 supplements
Blocking H3K27 methylation in ESCs promotes endoderm priming and the contribution to extra-embryonic endoderm in vivo.
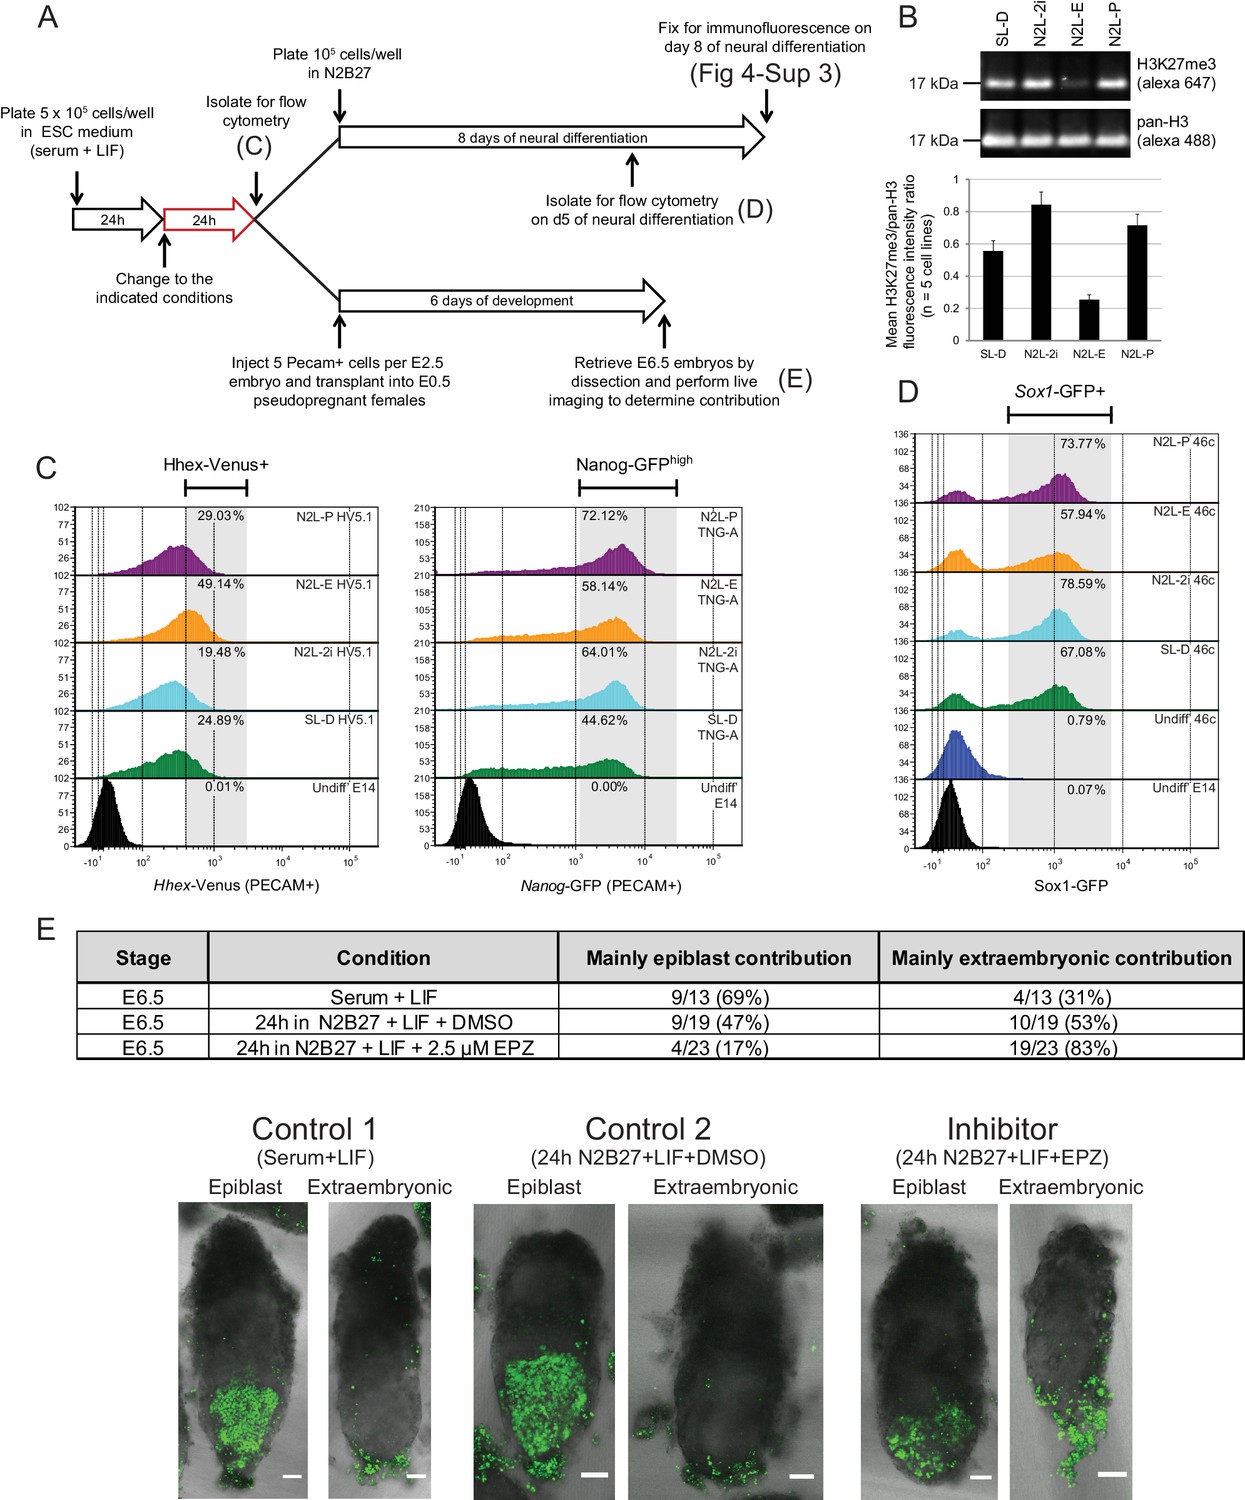
(A) Schematic overview of the experimental setup used to assess the in vitro and in vivo effects of EPZ on differentiation capacity. (B) Example immunoblot showing H3K27me3 levels relative to total H3 after 24 h of treatment in the indicated conditions. The densitometry ratio graph shows data from 5 different cell lines and error bars represent the SEM. (C) Flow cytometry after 24 h of treatment in the indicated conditions for the endoderm marker gene Hhex using HV5.1 ESCs (Hhex-IRES-Venus clone 5.1; (Canham et al., 2010)) and the epiblast marker Nanog using TNG-A ESCs (Nanog-GFP clone A; (Chambers et al., 2007)). Differentiating cells were excluded by gating for PECAM positive cells. The percentage of cells that fall within the indicated gate is shown in the upper right corner of each histogram. (D) Flow cytometry for the early neural marker Sox1 on 46c cells (Sox1-GFP; [Ying et al., 2003]) after 24 h of treatment in the indicated conditions followed by 5 days of neural differentiation. See also Figure 4—figure supplement 3. (E) Table showing the quantification of developmental potential, based on scoring E6.5 chimeric embryos as presenting with either ‘mainly epiblast’ or ‘mainly extra-embryonic endoderm’ contribution. Chi-square test result (χ2 = 9.96; p=0.007) shows a significant shift in the fraction of embryos with mainly extra-embryonic endoderm when comparing N2B27+LIF+EPZ (Inhibitor) with serum+LIF (Control 1) and N2B27+LIF+DMSO (Control 2). Representative examples of scored chimeric embryos are depicted for each condition. Treated ESC cells were FACs sorted for the cell-surface marker PECAM prior to injection into E2.5 embryos. (C–E) The conditions indicated are: N2L-P (N2B27 + LIF + 1 µM PD032); N2L-E (N2B27 + LIF + 2.5 µM EPZ6438); N2L-2i (N2B27 + LIF + 1 µM PD032 + 3 µM CHIR); SL-D (Serum + LIF + DMSO).
Figure 4—figure supplement 1
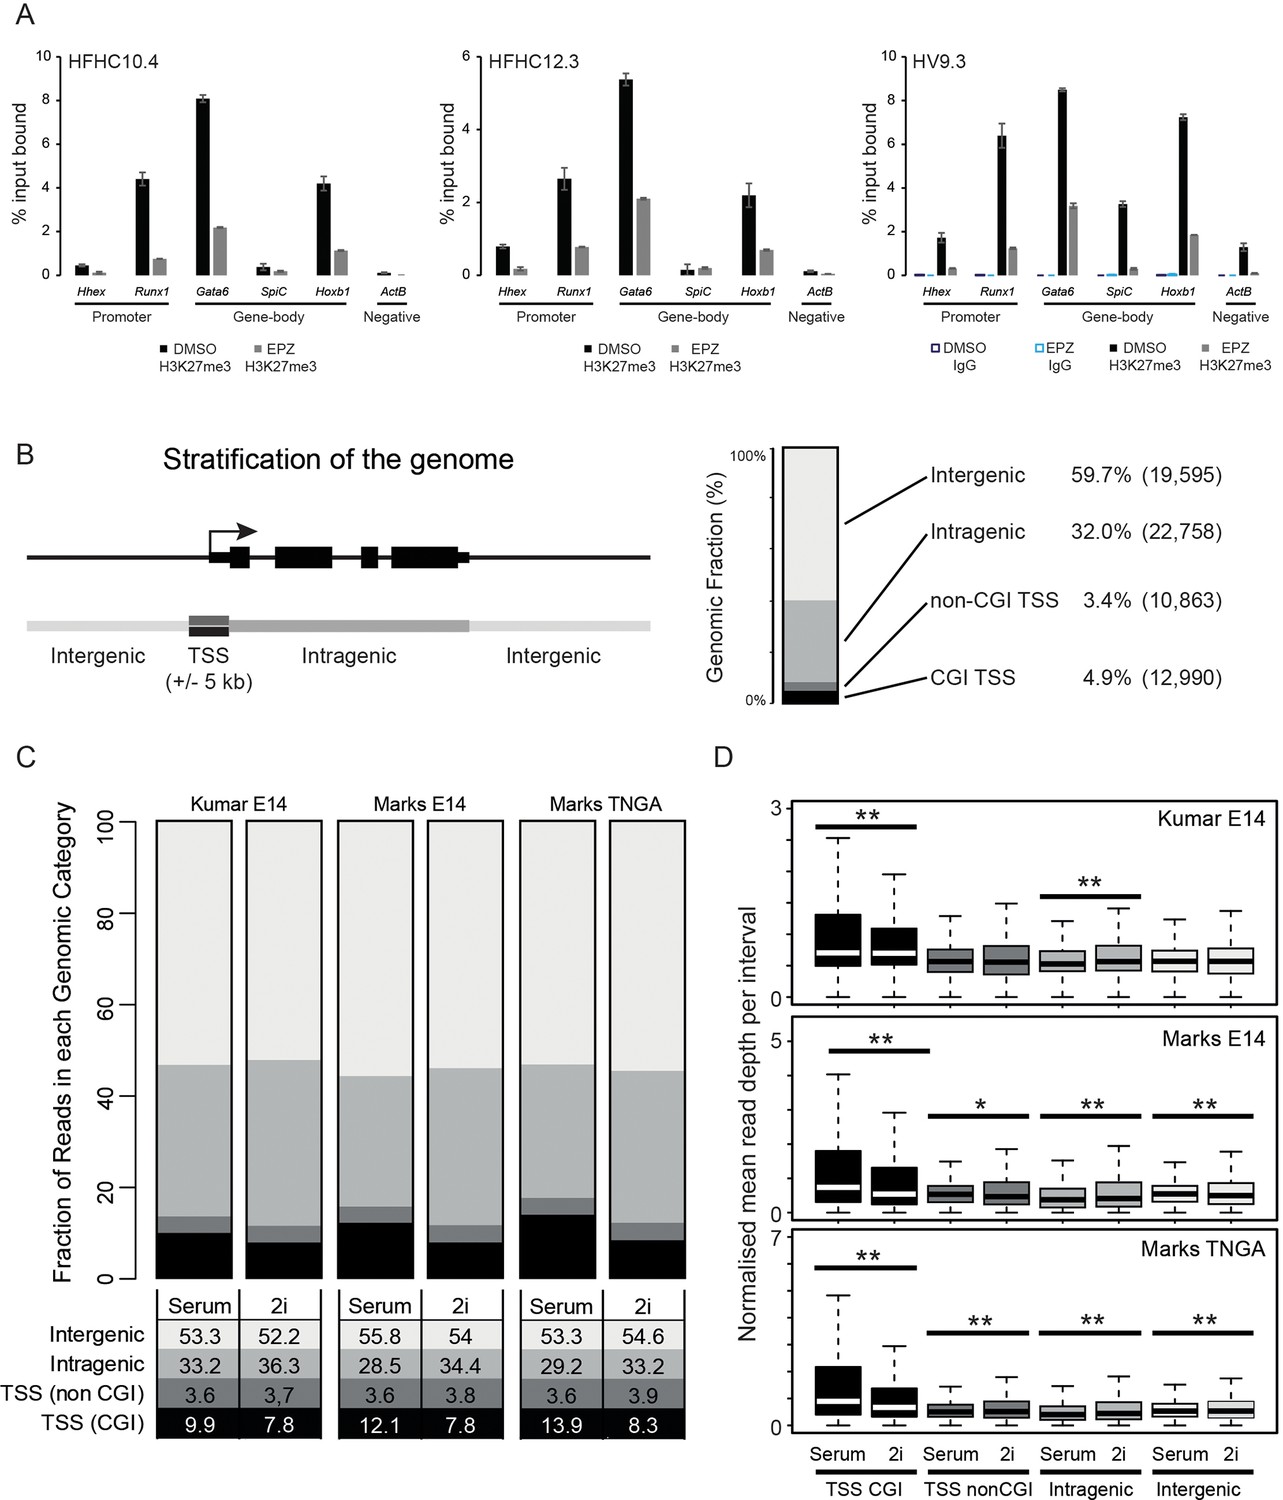
Reduction and redistribution of H3K27me3 in ESCs treated with EPZ and 2i, respectively.
(A) Barplots showing quantitative H3K27me3 ChIP-PCR from ESCs treated for 24h with either DMSO or EPZ (black and grey bars respectively). ChIP was performed in 3 independent Hhex reporter ESC lines (HFHC10.4, HFHC12.3 and HV9.3) and anti IgG ChIP was performed for clone HV9.3 as a negative control. Error bars represent the standard deviations for duplicated PCR reactions. (B) Schematic representation of the segmentation used to stratify the genomic distribution of H3K27me3 signal (left panel) and a barplot showing the fraction of the genome covered in each category (right panel). The genome is categorized into: CGI TSS (black; ± 5 kb), non-CGI TSS (dark grey; ± 5 kb), intragenic (grey) and intergenic (light grey). The percentage of the genome and the number of intervals representing each category are shown. (C) Barplot depicting the distribution of H3K27me3 ChIP-seq signal across each category as a percentage of total mappable reads for three independent datasets. Percentages for each category are tabulated below the plot. (D) Boxplots depicting the normalised read depths per genomic interval for each genomic fraction. The significance of increased/decreased signal was determined using a Wilcoxon rank-sum test and significant values are indicated (0.05>p≥0.01* and p<0.01**). Significant p values indicated*/** are 2.84 × 10⁻⁵, 1.45 × 10⁻¹⁴, 3.39 × 10–54, 9.7 × 10⁻³, 3.88 × 10⁻⁸, 1.1 × 10⁻²⁰, 2.98 × 10–174, 3.72 × 10⁻⁴, 4.36 × 10⁻⁷ and 1.04 × 10⁻⁴ (in order from top-left to bottom-right by row).
Figure 4—figure supplement 2
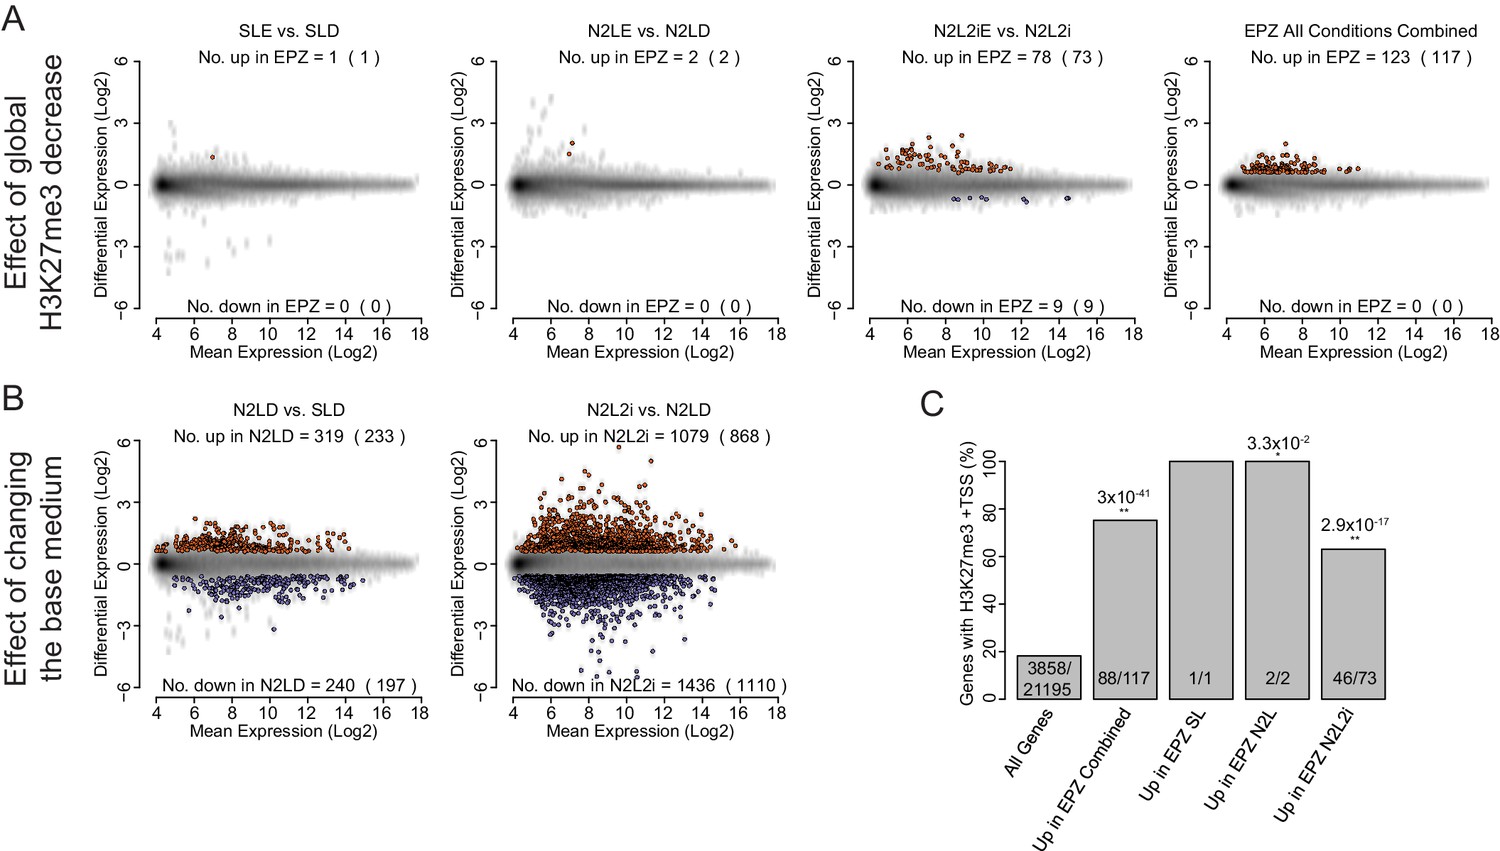
Global expression analysis of ESC following short-term EPZ treatment.
(A, B) MA plots generated from microarray experiments comparing (A) the effect of EPZ treatment on ESCs cultured for 24 h in different base medias and (B) the effect of the different base medias themselves within the same timescale. Probes were considered to be up-regulated (red) or down-regulated (blue) if they had a fold change of >1.5 or < 0.67, respectively, and a Benjamini-Hochberg-corrected p-value of <0.05. The number of differentially expressed probes and the number of genes they represent (in parenthesis) are indicated within each plot. (A, B) The conditions indicated are: SL-D (Serum + LIF + DMSO); SLE (Serum + LIF + 2.5 µM EPZ6438); N2LE (N2B27 + LIF + DMSO); N2LE (N2B27 + LIF + 2.5 µM EPZ6438); N2L2i (N2B27 + LIF + 1 µM PD032 + 3 µM CHIR); N2L2iE (N2B27 + LIF + 1 µM PD032 + 3 µM CHIR + 2.5 µM EPZ6438); Combined (all treatments vs. all controls combined at the analysis stage). (C) Barplot representing the percentage of genes with an H3K27me3 ‘peak’ associated with their TSS (± 100 bp). Significance of a differential coincidence of H3K27me3 association vs. ‘All Genes’ was determined using a Fisher’s test and significance is indicated (0.05 >p≥0.01* and p<0.01**) and p values are shown above. Indicated conditions are as for (A, B).
Figure 4—figure supplement 3
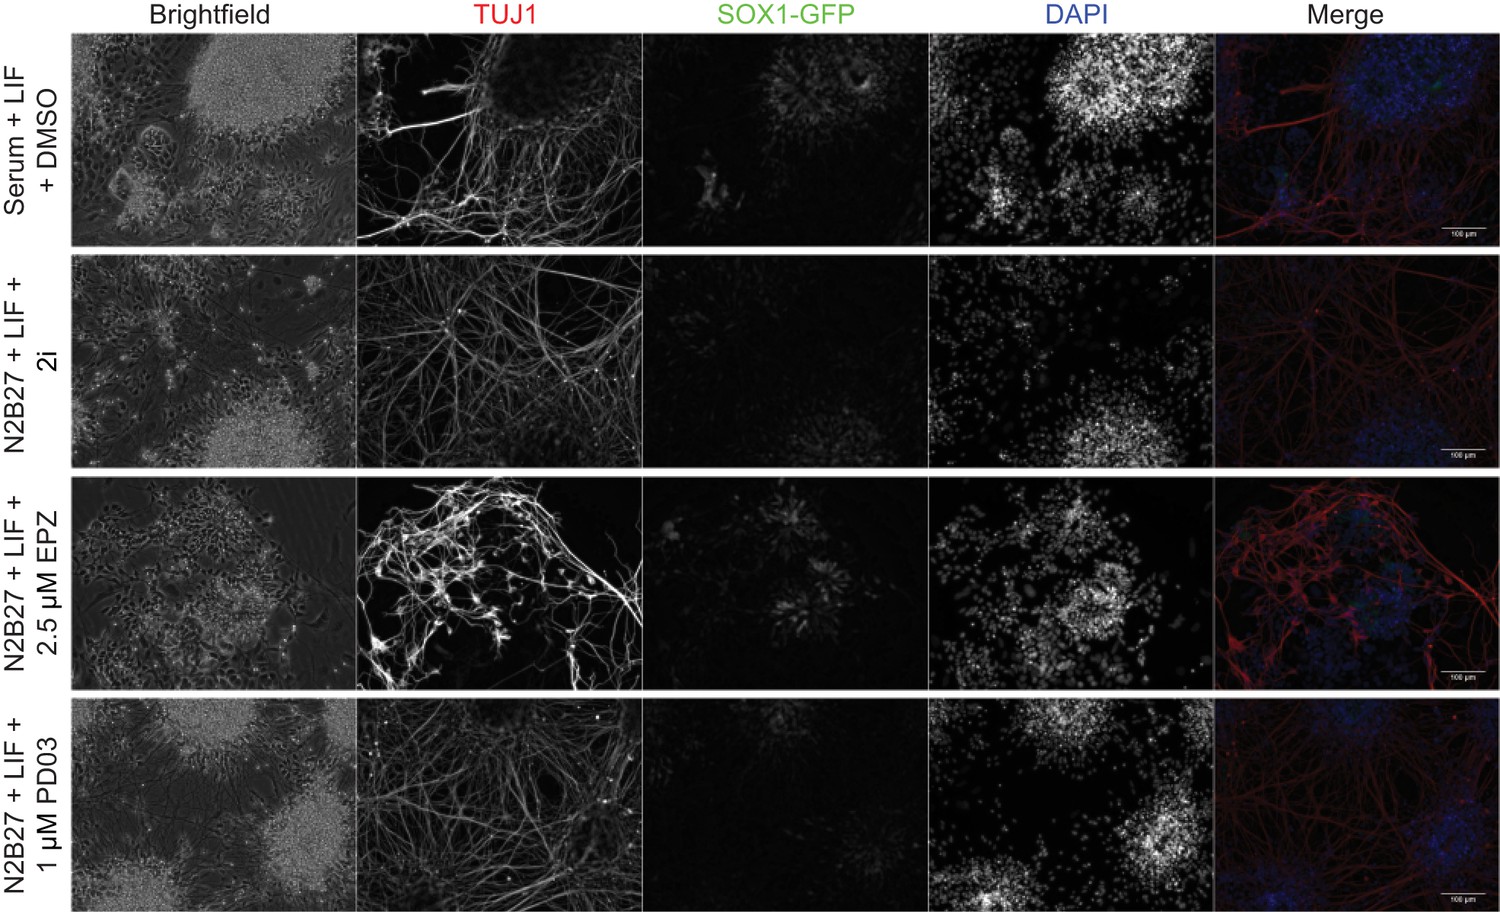
A transient block of H3K27 methylation alters the efficiency of subsequent neuronal differentiation.
Immunofluorescence on 46c cells after 24 h of treatment in the indicated conditions followed by 8 days of neural differentiation. Cells were stained for TUJ1 and GFP to visualise differentiated neurons and neural progenitors, respectively. Scale bars represent 100 μm.
Figure 5
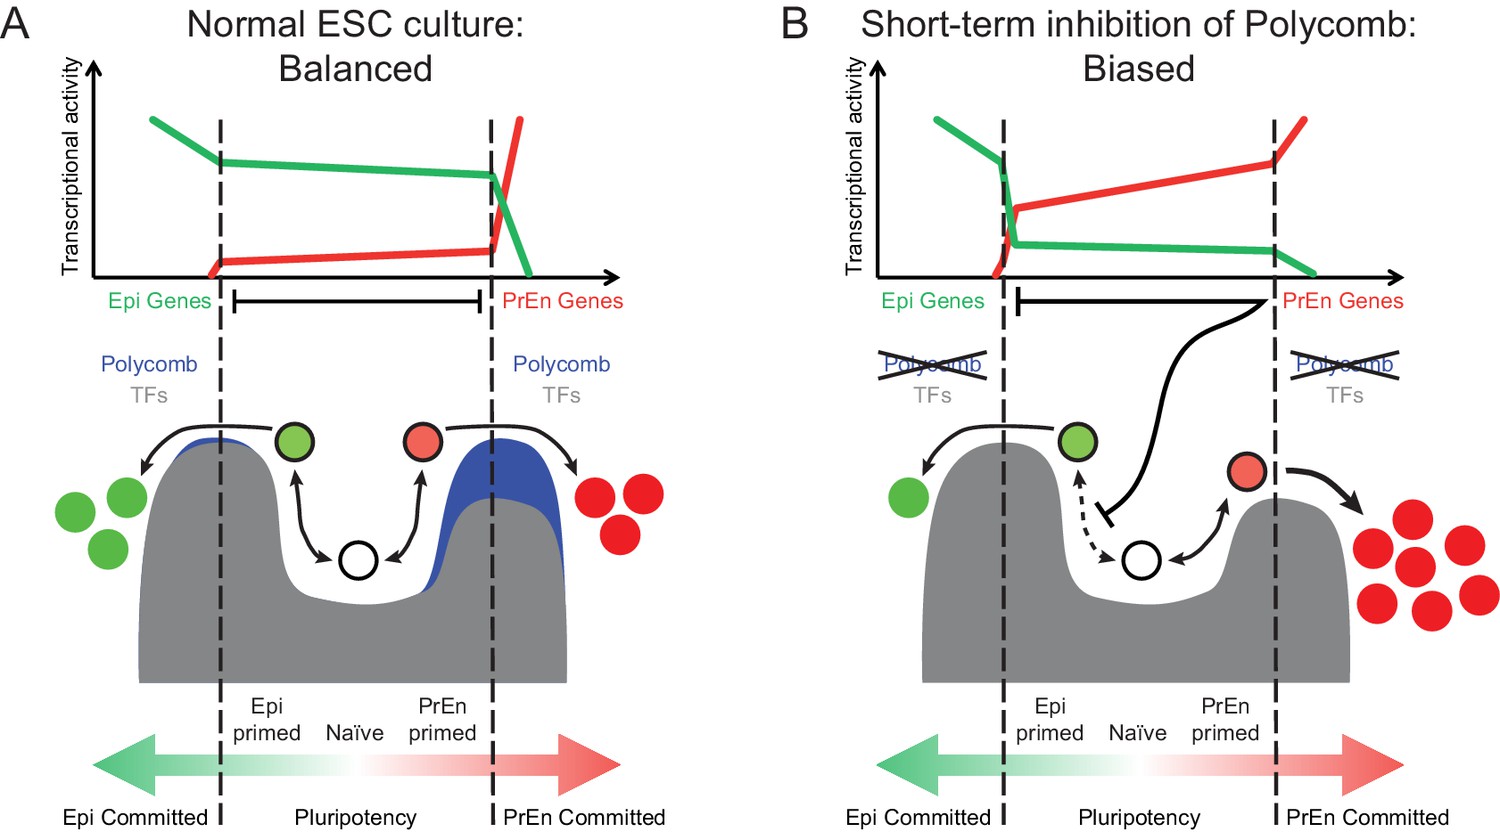
Model for the role of polycomb in lineage priming of ESCs.
(A) The model depicts the stable interconversion of Epi- and PrEn-primed cell populations when ESCs are maintained in serum + LIF culture conditions. Epi- and PrEn-primed populations are represented as green and red filled circles, respectively. While these cells express differential levels of priming genes, they maintain ESC surface markers (represented by the black boundaries of the circles). Spontaneous differentiation in ESC culture is represented by a switch from ESC surface markers to lineage specific surface markers (represented by the coloured boundaries of the circles) as well as a switch from expression of priming genes to lineage specific marker genes (represented by the change from light to dark fill of the circles). Within the dashed vertical lines, the equilibrium between these states and self-renewal continues indefinitely. This balance is maintained, in part, by forces that resist lineage commitment to either the Epi or PrEn lineages (depicted as peaks). Both transcription factors (TFs; dark grey) and polycomb mediated repression (blue) are asymmetric components of this system, with TFs mainly restricting commitment towards Epi and polycomb mainly restricting commitment towards PrEn. (B) In the absence of polycomb-mediated repression, the balance is lost and the equilibrium shifts in favour of PrEn gene expression, which disrupts Epi priming and results in reduced Epi and increased PrEn commitment upon differentiation. Relative transcription levels of genes characteristic of Epi (green line) and PrEn (red line) are shown in the top panel.
Additional files
-
Supplementary file 1
Genes with differential expression in Epi- and PrEn primed ESCs
- https://doi.org/10.7554/eLife.14926.017
-
Supplementary file 2
Functional analysis of Epi- and PrEn priming genes
- https://doi.org/10.7554/eLife.14926.018
-
Supplementary file 3
Genes with differential expression in Rex+ and Rex- cell populations
- https://doi.org/10.7554/eLife.14926.019
-
Supplementary file 4
Genes showing differential gene expression in ESCs following short-term inhibition with EPZ.
- https://doi.org/10.7554/eLife.14926.020
-
Supplementary file 5
Quantitative single-cell and qRT PCR assay information.
- https://doi.org/10.7554/eLife.14926.021
-
Source code 1
Custom R script used to identify genes with differential expression levels between experimental conditions.
- https://doi.org/10.7554/eLife.14926.022
-
Source code 2
Custom image J script used to extract intensity information from confocal immunofluorescence images.
- https://doi.org/10.7554/eLife.14926.023
-
Source code 3
Custom R script used to generate heatmaps from pre-formatted quantitation data files.
- https://doi.org/10.7554/eLife.14926.024
Download links
A two-part list of links to download the article, or parts of the article, in various formats.
Downloads (link to download the article as PDF)
Open citations (links to open the citations from this article in various online reference manager services)
Cite this article (links to download the citations from this article in formats compatible with various reference manager tools)
Polycomb enables primitive endoderm lineage priming in embryonic stem cells
eLife 5:e14926.
https://doi.org/10.7554/eLife.14926


