Sex steroids regulate skin pigmentation through nonclassical membrane-bound receptors
- Perelman School of Medicine, University of Pennsylvania, United States
- University of Pennsylvania, United States
Figures
Figure 1 with 2 supplements
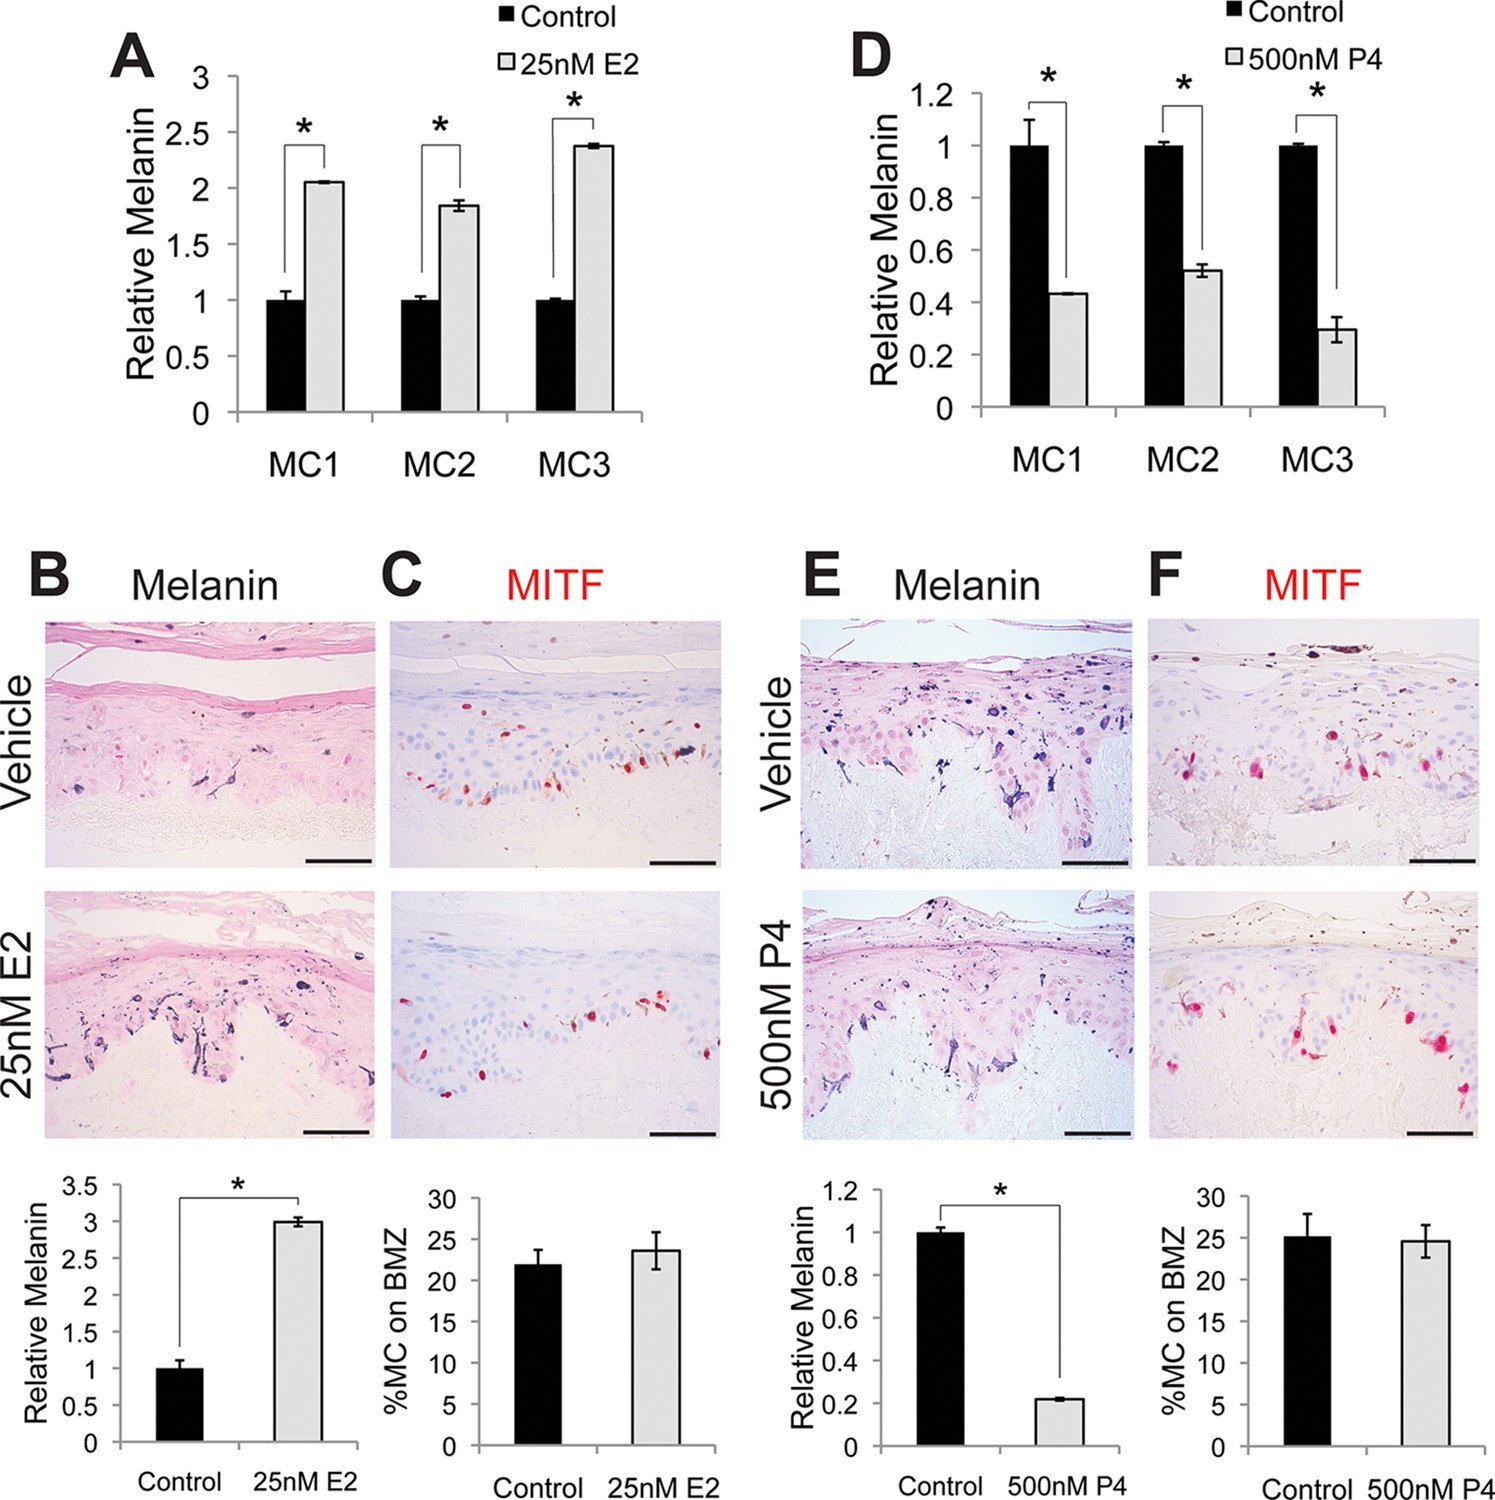
Estrogen and progesterone reciprocally regulate melanin synthesis.
(A) Melanin content of primary human melanocytes treated with estrogen (E2), compared to vehicle-treated controls. (B) Fontana-Masson (melanin) staining of organotypic skin treated with vehicle or estrogen. Relative melanin content is quantified below. (C) MITF immunohistochemistry of organotypic skin treated with vehicle or estrogen. Melanocyte population density is quantified below. (D) Melanin content of primary human melanocytes treated with progesterone (P4), compared to vehicle. (E), Fontana-Masson (melanin) staining of organotypic skin tissues treated with progesterone or vehicle. Relative melanin content is quantified below. (F) MITF immunohistochemistry of organotypic skin tissues treated with vehicle or progesterone. Melanocyte population density is quantified below. n=3 biologic replicates for each experiment. Error bars denote +/- s.d., *p<0.05, scale bar = 50 μm.
Figure 1—figure supplement 1
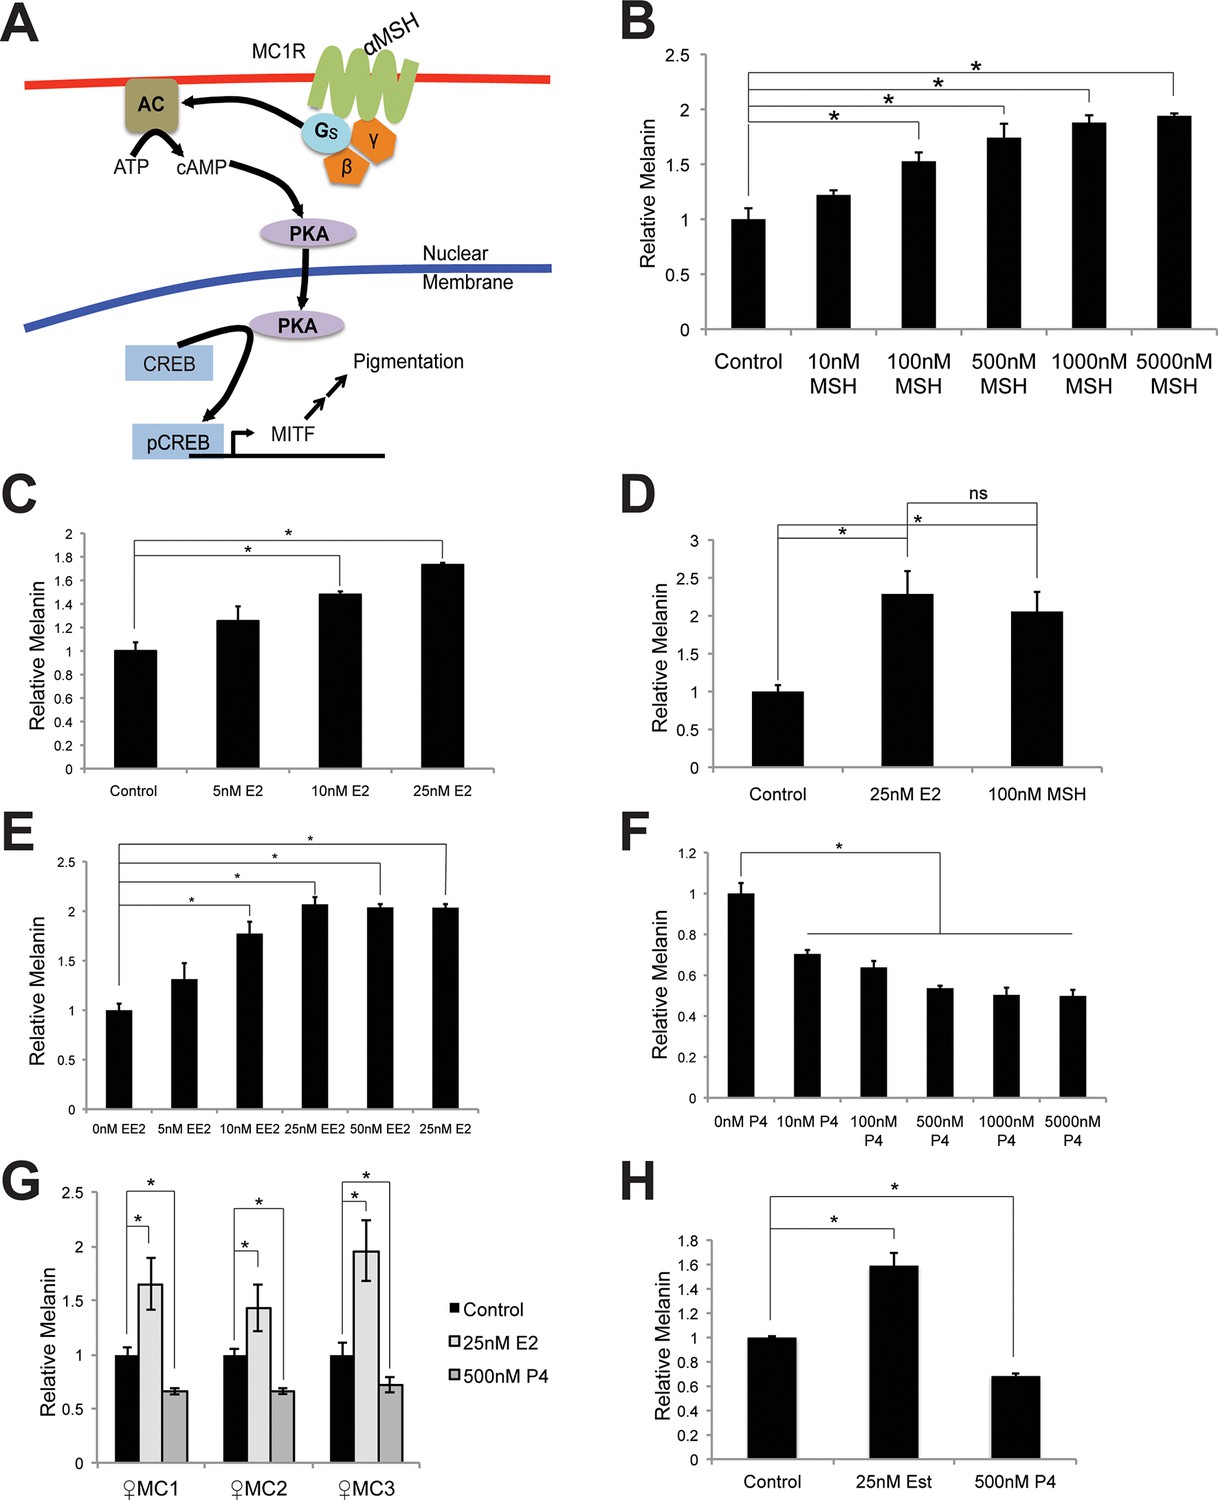
Melanin production in melanocytes.
(A) Schematic representation of the classical melanin production pathway. (B) Melanin production in response to αMSH. (C) Melanin production in response to estrogen (E2). (D) Melanin production by melanocytes treated with vehicle, αMSH, or estrogen. (E) Melanin production in response to ethinyl estradiol (EE2). (F) Melanin production in response to progesterone (P4). (G) Melanin production in response to estrogen and progesterone using iPS-derived female melanocytes. (H) Melanin production in response to estrogen and progesterone using facial, aged-adult melanocytes. n=3 biologic replicates for each experiment. Error bars denote +/- s.d., *p<0.05.
Figure 1—figure supplement 2
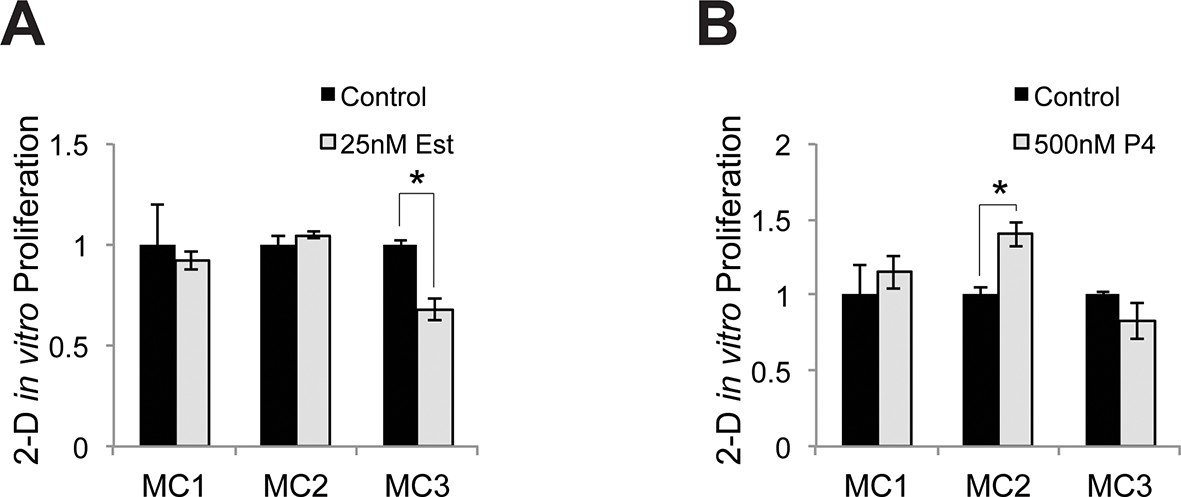
Relative proliferative response to estrogen and progesterone treatment.
(A) Identical numbers of melanocytes from 3 donors were seeded in parallel and treated with vehicle or estrogen; relative cell number after 5 days was determined. (B) Identical numbers of melanocytes from 3 donors were seeded in parallel and treated with vehicle or progesterone; relative cell number after 5 days was determined. n=3 biologic replicates for each experiment. Error bars denote +/- s.d., *p<0.05.1
Figure 2 with 2 supplements
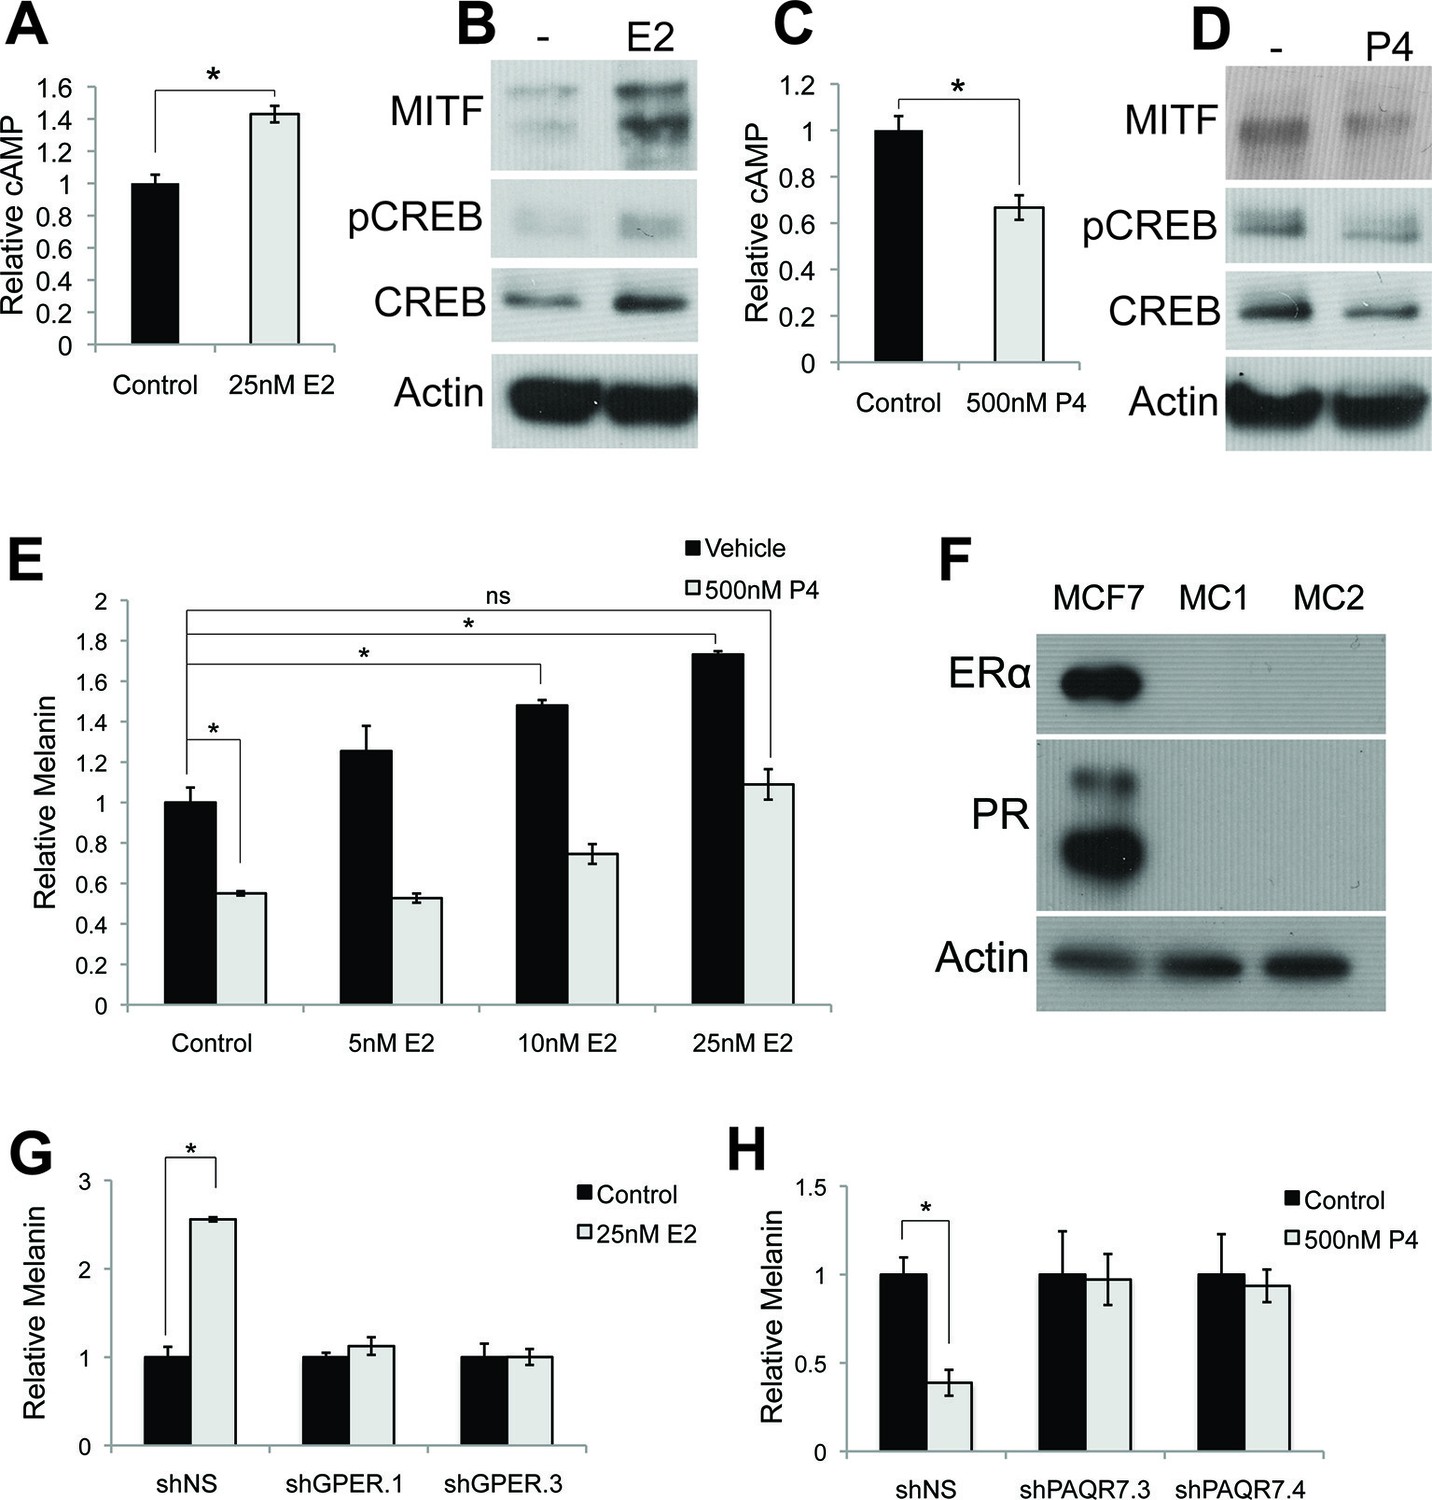
Estrogen and progesterone access the classical melanin production pathway through nonclassical receptors.
(A) cAMP ELISA from estrogen-treated melanocytes (B) Western blot demonstrating changes in classical melanin pathway regulators after a 16 hr estrogen treatment. (C) cAMP ELISA from progesterone-treated melanocytes. (D) Western blot demonstrating changes in classical melanin pathway regulators after a 16 hr progesterone treatment. (E) Melanin assay from melanocytes treated with estrogen and progesterone simultaneously. (F) Western blot for estrogen and progesterone receptors in MCF7 cells and melanocytes. (G) Melanin content of melanocytes transduced with control shRNA or shRNA targeting GPER. Cells were treated with either vehicle or estrogen. (H) Melanin assay performed on melanocytes transduced with control shRNA or shRNA targeting PAQR7. Cells were treated with either vehicle or progesterone. n=3 biologic replicates for each experiment. Error bars denote +/- s.d., *p<0.05.
-
Figure 2—source data 1
List of GPCR transcripts expressed in primary human melanocytes.
- https://doi.org/10.7554/eLife.15104.007
Figure 2—figure supplement 1
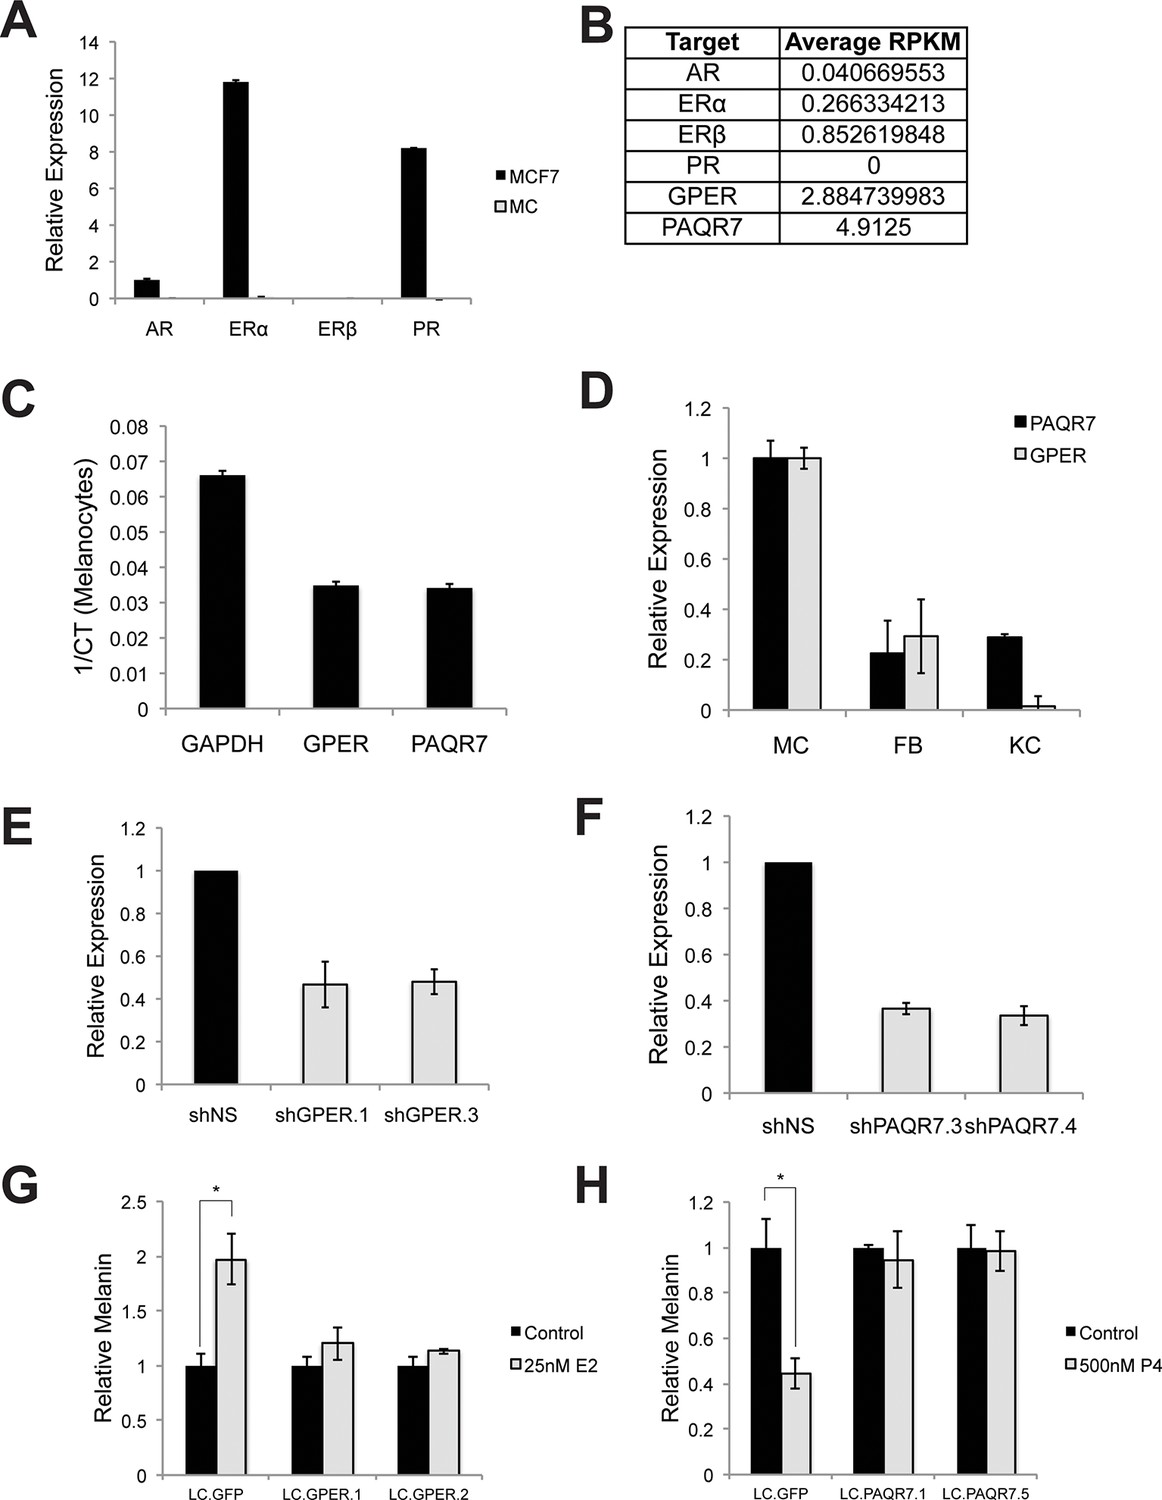
Hormone receptors in melanocytes.
(A) Relative gene expression of classical hormone receptors in MCF7 cells and melanocytes, as determined by qRT-PCR. Ct values were normalized to actin, and set relative to the expression of androgen receptor (AR) in MCF7 cells. (B) Average RPKM values for classical and nonclassical estrogen and progesterone receptor transcripts in human melanocytes, by convention, RPKM values >1 indicate the gene is expressed. (C) Expression of GPER and PAQR7 displayed as 1/Ct value. (D) Relative expression of GPER and PAQR7 transcripts in melanocytes, fibroblasts, and keratinocytes, as determined by qRT-PCR, displayed relative to the expression level in melanocytes. (E) qRT-PCR showing mRNA knockdown efficiency of the two hairpins targeting GPER. (F) qRT-PCR showing mRNA knockdown efficiency of the two hairpins targeting PAQR7. (G) Melanin content of melanocytes transduced with LentiCRISPRV2 with guide RNA targeting GFP or GPER. Cells were treated with either vehicle or estrogen. (H) Melanin content of melanocytes transduced with LentiCRISPRV2 with guide RNA targeting GFP or PAQR7. Cells were treated with either vehicle or progesterone. Error bars denote +/- s.d., *p<0.05.
Figure 2—figure supplement 2

Progesterone signals through Gi in melanocytes.
(A) Melanin synthesis in response to Pertussis Toxin (PTX), progesterone (P4), or both. n=3 biologic replicates for each experiment. Error bars denote +/- s.d., *p<0.05
Figure 3 with 3 supplements
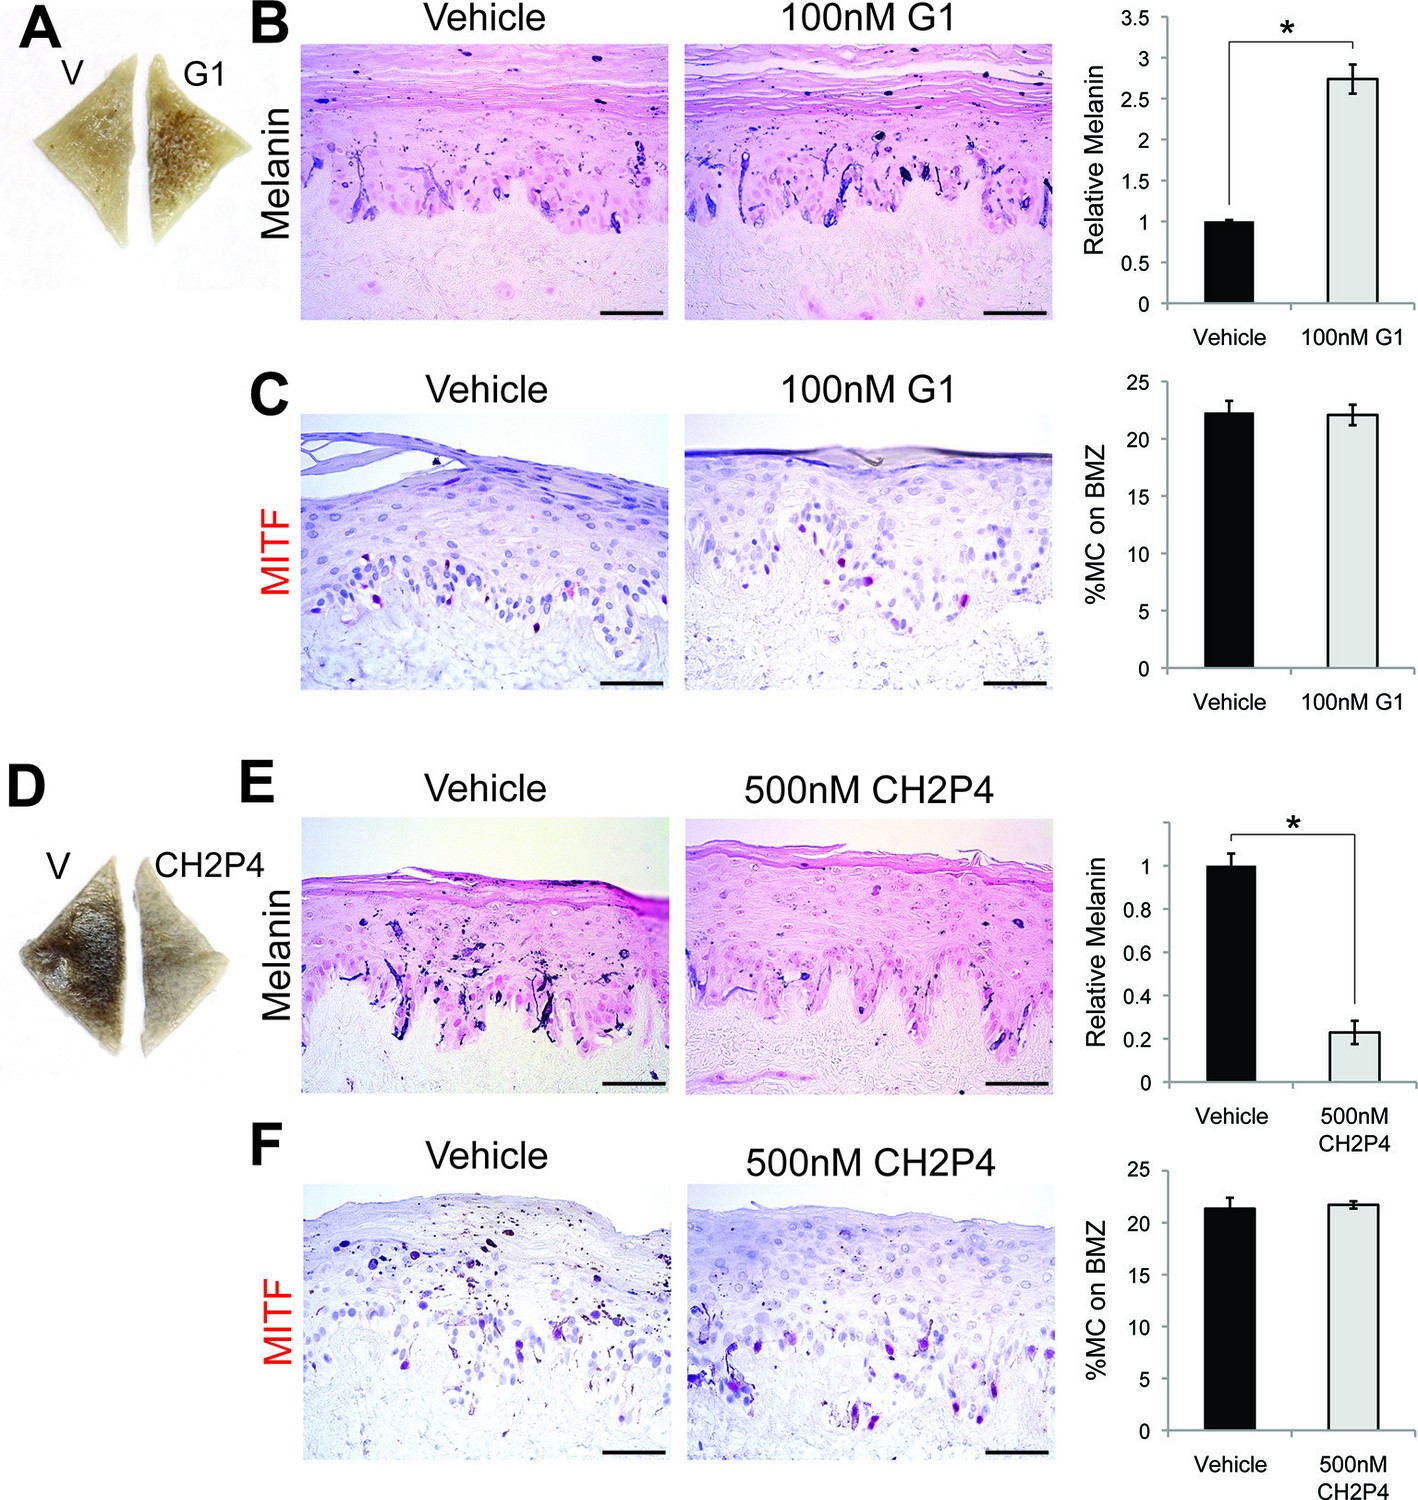
GPER and PAQR7 signaling is sufficient to alter melanin production in organotypic human tissue.
(A) Organotypic skin treated with vehicle (left) or G-1 (right). (B) Fontana-Masson (melanin) staining of organotypic skin treated with vehicle or G-1. Quantification of melanin content is shown on the right. (C) MITF immunohistochemistry of organotypic skin treated with vehicle or G-1. Quantification of melanocyte population density is shown on the right. (D) Organotypic skin treated with vehicle (left) or CH2P4 (right). (E) Fontana-Masson (melanin) staining of organotypic skin treated with vehicle or CH2P4. Quantification of melanin content is shown on the right. (F) MITF immunohistochemistry of organotypic skin treated with vehicle or CH2P4. Quantification of melanocyte population density is shown on the right. n=3 biologic replicates for each experiment. Error bars denote +/- s.d., *p<0.05, scale bar = 50 μm.
Figure 3—figure supplement 1

Melanin production is altered by sex steroid analogs currently in clinical use.
The effect of clinically relevant GPER agonists. (A) Melanin production in response to tamoxifen (TMX). n=3 biologic replicates for each experiment. Error bars denote +/- s.d., *p<0.05
Figure 3—figure supplement 2
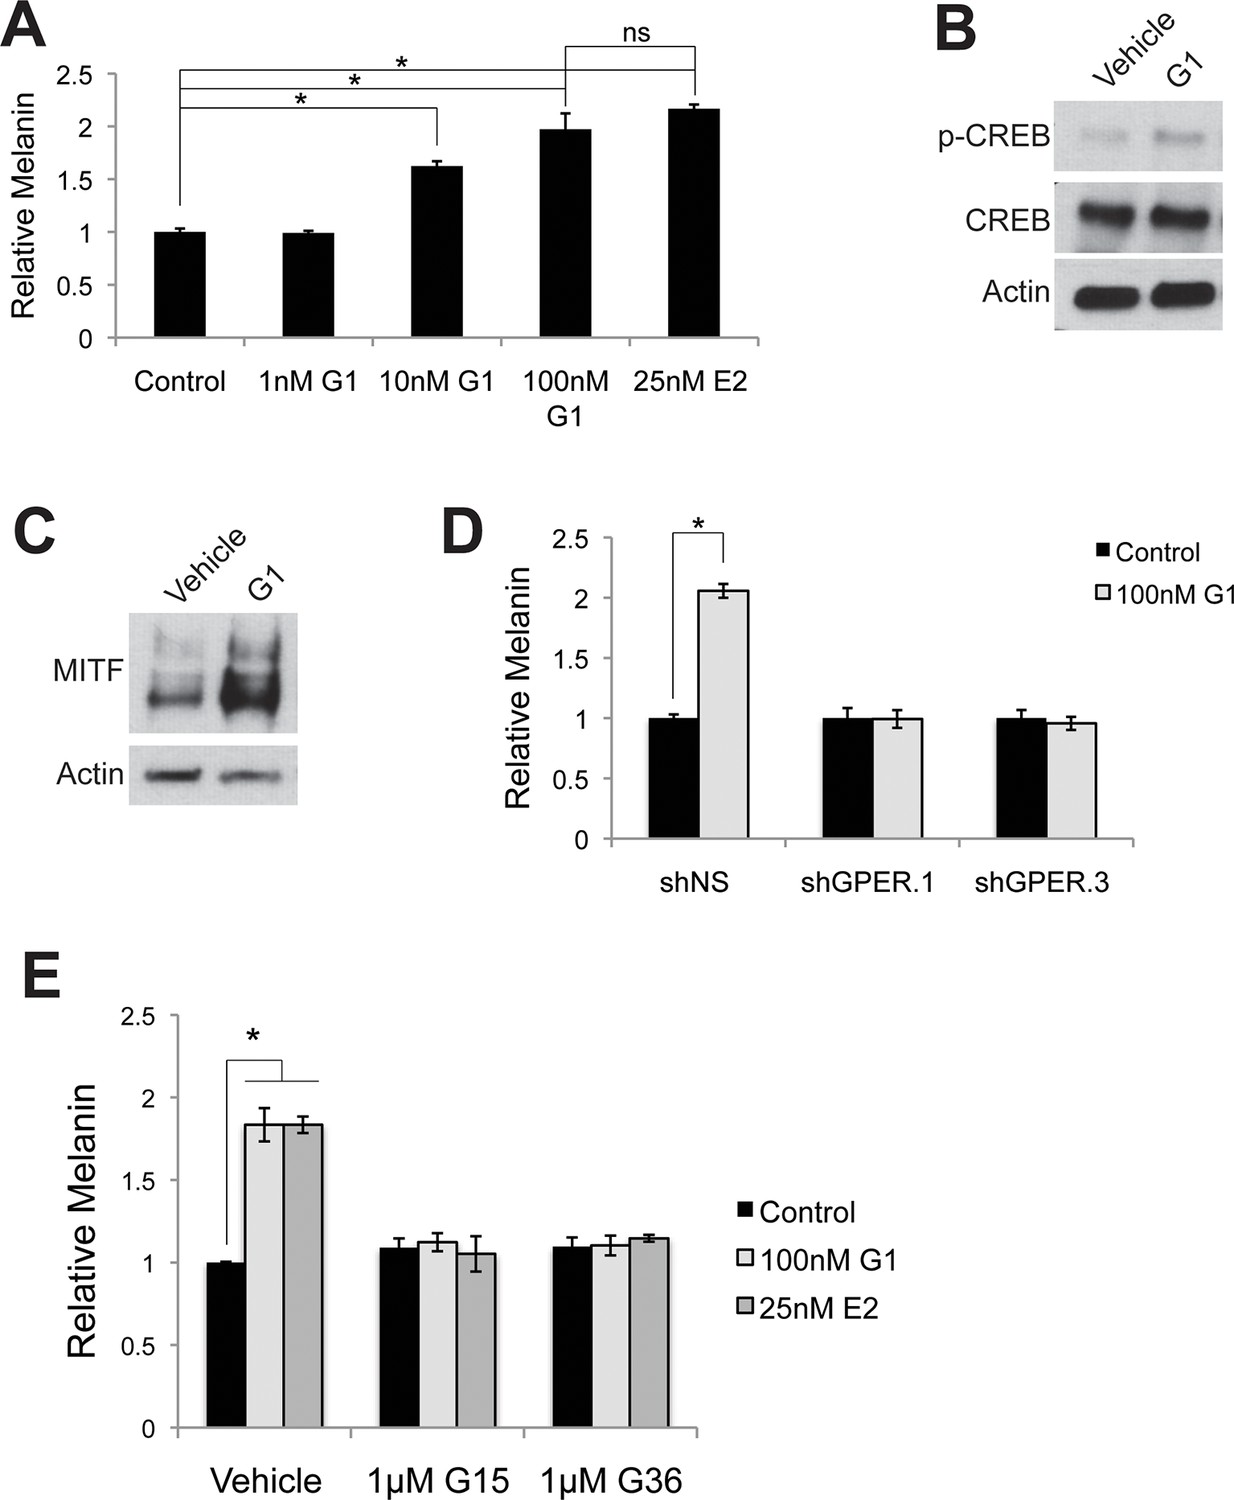
Targeting GPER with specific agonists and antagonists.
(A) Melanin production in response to G-1, a specific GPER agonist. (B) Western blot demonstrating an increase in pCREB after a 30 min G-1 treatment. (C) Western blot demonstrating an increase in MITF after a 16 hr G-1 treatment. (D) Melanin assay performed on melanocytes lentivirally transduced with control shRNA or shRNA targeting GPER. These cells were treated with either vehicle or G-1. (E) Melanin production by melanocytes treated with vehicle, G-1, or estrogen, in the presence of selective GPER antagonists G-15 or G-36. n=3 biologic replicates for each experiment. Error bars denote +/- s.d., *p<0.05
Figure 3—figure supplement 3
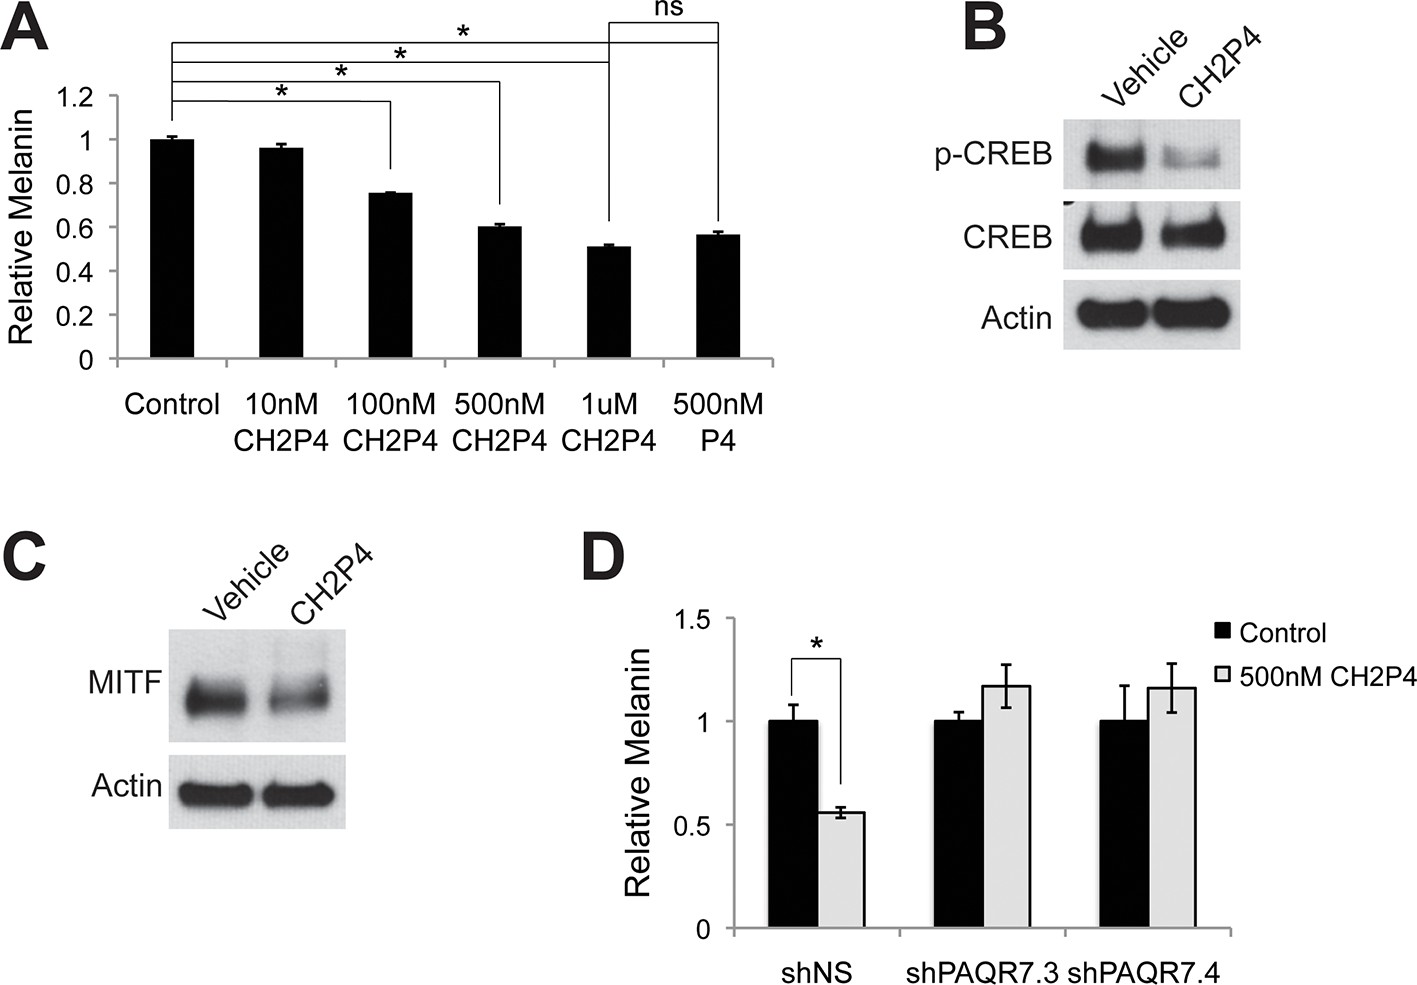
Targeting PAQR7 with specific agonists.
(A) Melanin production in response to CH2P4, a specific PAQR7 agonist. (B) Western blot demonstrating a decrease in pCREB after a 30 min CH2P4 treatment. (C) Western blot demonstrating a decrease in MITF after a 16 hr CH2P4 treatment. (D) Melanin assay performed on melanocytes lentivirally transduced with control shRNA or shRNA targeting PAQR7, cells were treated with either vehicle or CH2P4. n=3 biologic replicates for each experiment. Error bars denote +/- s.d., *p<0.05.
Figure 4 with 1 supplement

Topical GPER agonists increase pigmentation in vivo.
(A) Mouse ear skin treated for 3 weeks with vehicle only on the left ear, and 2% (w/v) G-1 on the right ear. (B) Melanin assay on whole ear tissue that was treated with either vehicle or 2% G-1 for 3 weeks. (C) Fontana-Masson (melanin) staining of tissue sections from ears treated with either vehicle or 2% G-1, quantification of staining on right. (D) Schematic model of estrogen and progesterone signaling in melanocytes. n=3 biologic replicates for each experiment. Error bars denote +/- s.d., *p<0.05, scale bar = 20 μm.
Figure 4—figure supplement 1
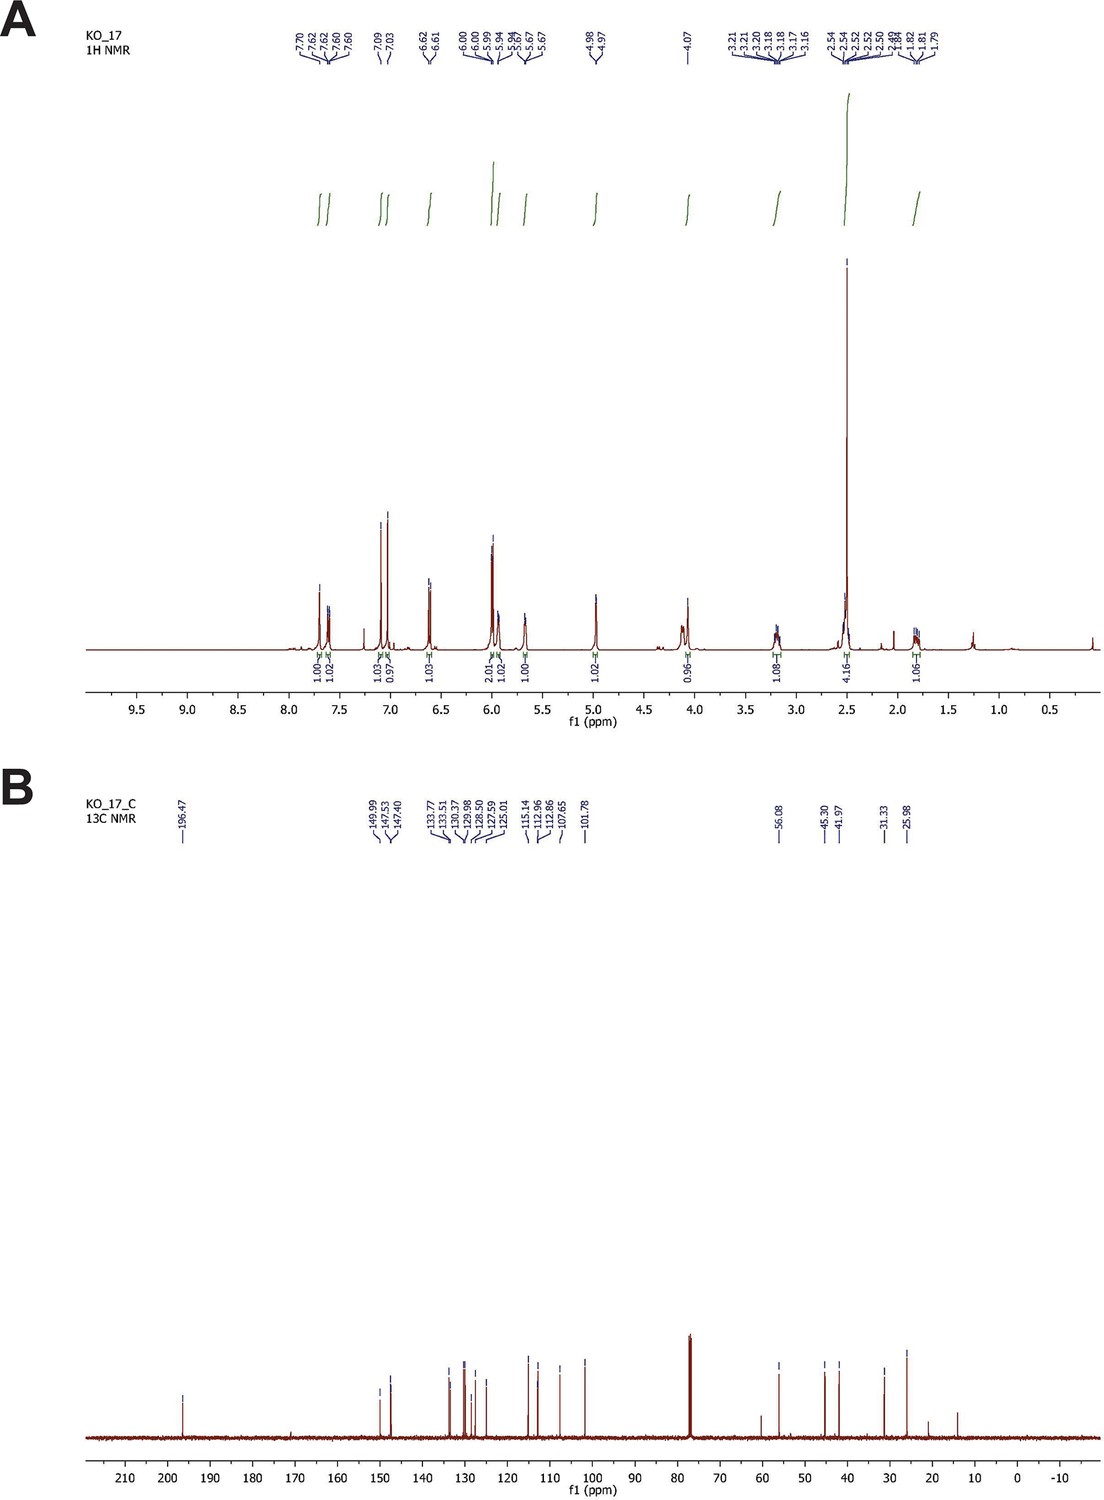
NMR spectrometry of synthesized G-1.
(A) H-NMR spectrometry of synthesized G-1. 1H-NMR (500 MHz, CDCl3) δ 7.70 (s, 1H), 7.61 (dd, J = 5.0, 2.5 Hz, 1H), 7.09 (s, 1H), 7.01 (s, 1H), 6.61 (d, J = 8.5 Hz, 1H), 5.99 (d, J = 6.0 Hz, 2H), 5.93 (m, 1H), 5.67 (d, J = 4.5 Hz, 1H), 4.97 (d, J = 3.0 Hz, 1H), 4.12 (d, J = 9.0 Hz, 1H), 3.19 (q, J = 8.5 Hz, 1H), 2.54–2.48 (m, 4H), 1.84–1.79 (m, 1H). (B) 13C-NMR spectrometry of G-1. 13C-NMR (125 MHz, CDCl3) δ 196.5, 150.0, 147.5, 147.4, 133.8, 133.5, 130.4, 130.0, 128.5, 127.6, 125.0, 115.1, 112.9, 112.8, 107.6, 101.8, 56.1, 45.3, 42.0, 31.3, 26.0.
Download links
A two-part list of links to download the article, or parts of the article, in various formats.
Downloads (link to download the article as PDF)
Open citations (links to open the citations from this article in various online reference manager services)
Cite this article (links to download the citations from this article in formats compatible with various reference manager tools)
Sex steroids regulate skin pigmentation through nonclassical membrane-bound receptors
eLife 5:e15104.
https://doi.org/10.7554/eLife.15104


