Physical determinants of vesicle mobility and supply at a central synapse
- University College London, United Kingdom
- Hungarian Academy of Sciences, Hungary
- Max Planck Institute of Experimental Medicine, Germany
- Université de Bordeaux, UMR 5297, F-33000, France
Figures
Figure 1 with 1 supplement
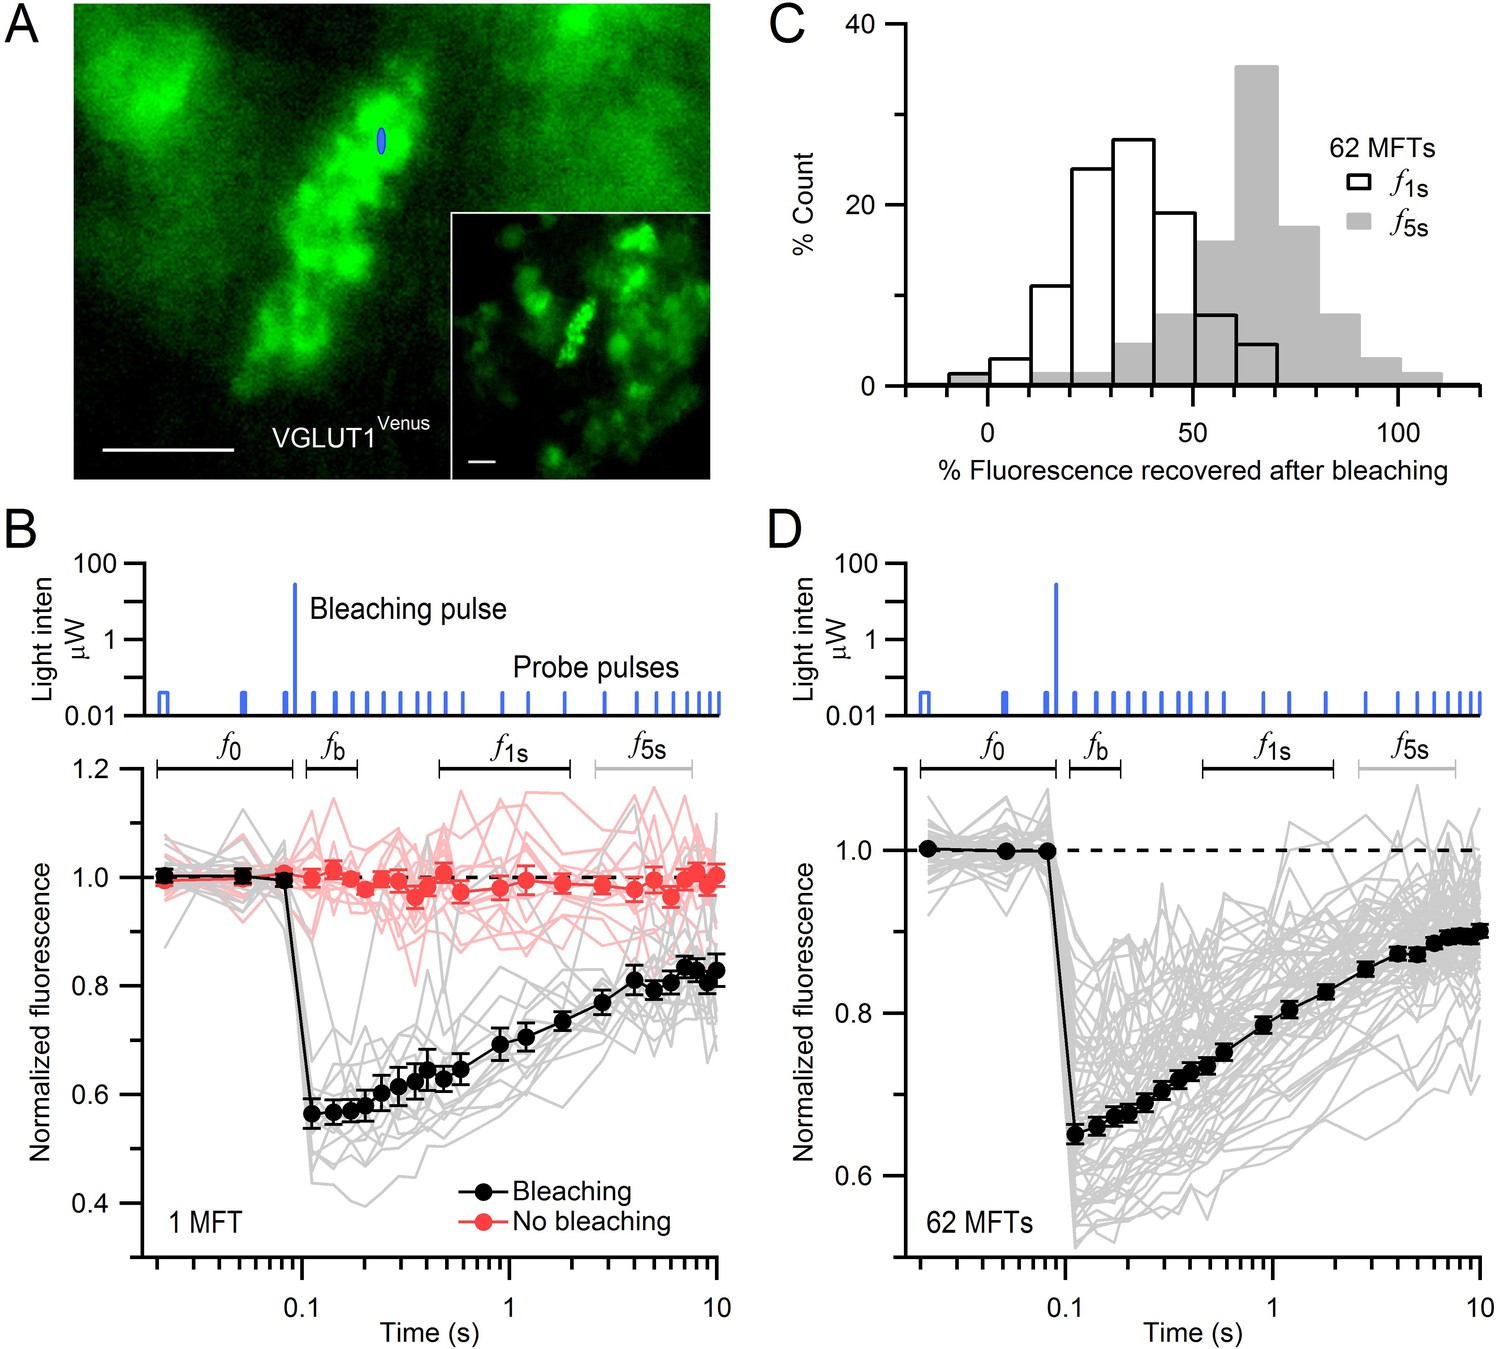
FRAP of vesicles in MFTs of VGLUT1Venus knock-in mice.
(A) A VGLUT1Venus-labelled MFT near the surface of a cerebellar slice. Blue ellipse denotes xz dimensions of iPSF. Inset, lower magnification. Scale bars: 5 µm. (B) Fluorescence recovery after photobleaching (FRAP) measurements from 15 locations within a single MFT (bottom, gray lines; note logarithmic timescale) using 2-ms low-intensity laser probe pulses before and after a single 0.5-ms high-intensity laser bleaching pulse (top; note logarithmic y-scale). Fluorescence measured without the bleaching pulse in the same MFT from 14 random locations (red lines; interleaved with recordings with bleaching). Data were normalized to the average fluorescence of the first 3 probe pulses (f0) before bleaching. Filled black and red circles are means ± SEM. Black and gray horizontal lines denote measurement windows for f1s and f5s reported in C. (C) Average fluorescence recovery for 62 MFTs at 1 s (black; f1s, average 0.4–1.7 s) and 5 s (gray; f5s, average 2.7–6.9 s) after bleaching, normalized between f0 and fb, where fb is the fluorescence just after bleaching (average 0.02–0.08 s). (D) Same as B but gray lines are averaged FRAP curves from 62 MFTs (3–24 recordings per MFT) and black circles are the weighted population average, computed by Equation (1).
Figure 1—figure supplement 1
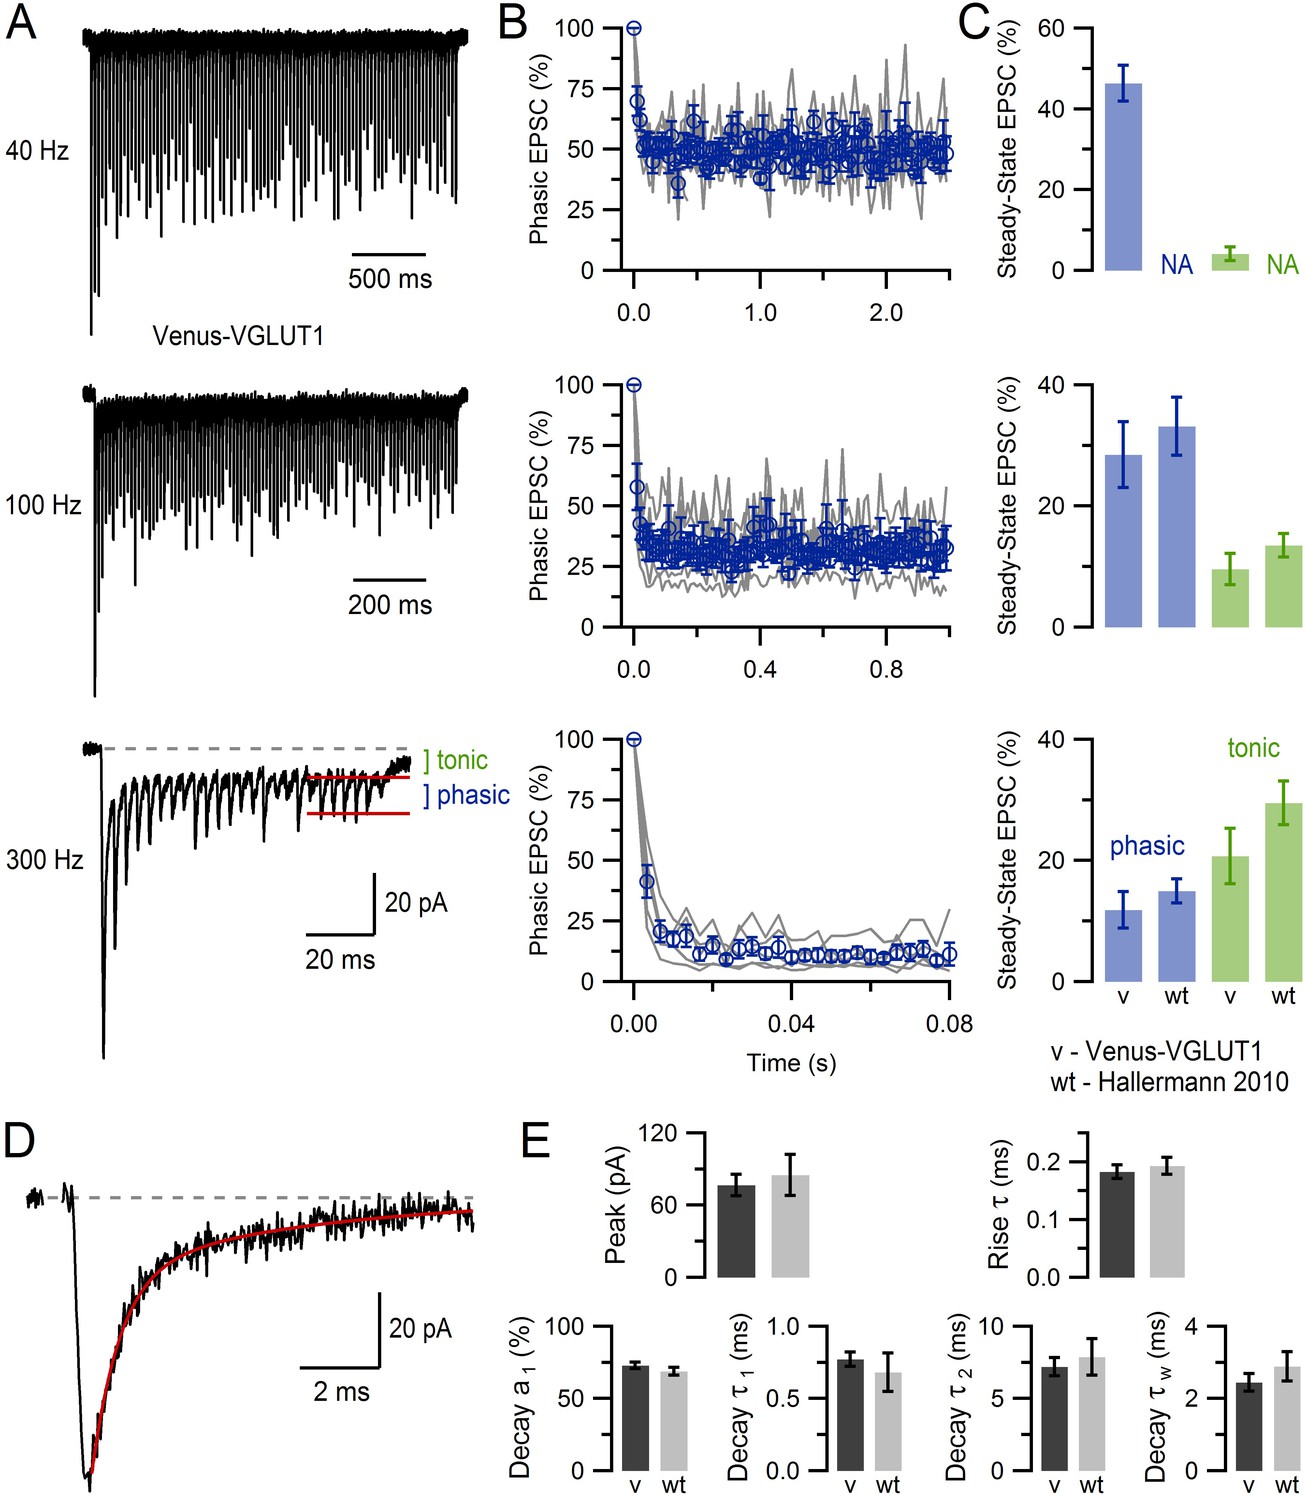
VGLUT1Venus mice show normal MFT-GC synaptic transmission.
(A) EPSCs recorded from a GC (average of 8 recordings) in response to stimulation of a single MFT at 40, 100 and 300 Hz (100, 100 and 25 stimuli, respectively) in a VGLUT1Venus mouse. Phasic refers to the fast rising EPSC peak and is measured relative to the tonic baseline current (see 300 Hz, red lines), and is related to the direct vesicle release of glutamate at the recorded MFT-GC connection. Tonic refers to the slow component of the EPSC, which is mediated by glutamate spillover from neighbouring MFT-GC connections (DiGregorio et al., 2002). (B) Average phasic EPSC amplitude (blue) of single MFT-GC connections (gray; n = 5) for 40, 100 and 300 Hz MFT stimulation, as shown in A. EPSC peak values were normalized to that of first EPSC. (C) Average steady-state EPSC amplitude of phasic (blue) and tonic (green) components for data in B. There were no statistical differences between VGLUT1Venus mice (v; n = 5) and WT mice (n = 13): p=0.6 and 0.3 at 100 Hz, p=0.4 and 0.2 at 300 Hz for phasic and tonic components respectively. Data for WT mice at 40 Hz is not available (NA). (D) Average basal EPSC recorded from a GC in response to stimulation of a single MFT (average of 5 EPSCs separated by more than 1 s). Red line is a double-exponential fit to the decay component (11 ms window starting 0.1 ms after the peak). (E) Average basal peak EPSC amplitude and 20–80% rise time (top graphs) from 29 GCs (capacitance = 2.8 ± 0.2 pF, series resistance = 27.9 ± 1.7 MΩ; 36°C; n = 12 VGLUT1Venus mice). The relative percent amplitude of the fast decay component (a1), the time constant of the fast and slow decay components (τ1 and τ2) and the weighted decay (τw = [a1τ1 + a2τ2]/[a1 + a2]) for double-exponential fits to EPSCs as shown in D (bottom graphs). There were no statistical differences between VGLUT1Venus mice (v; n = 29) and WT mice (n = 14) for any of the measures: p=0.6, 0.6, 0.3, 0.5 (unequal variance), 0.6 and 0.3, respectively. These analyses show that MFT-GC synapses in VGLUT1Venus knock-in mice have a normal glutamatergic synaptic physiology. EPSCs were recorded via an Axopatch 200B amplifier (10 kHz filter) and InstruTech ITC-18 board (40 kHz sampling) at −76.3 mV (corrected for +6.3 mV liquid junction potential) using fire-polished borosilicate micropipettes containing (in mM) 110 KmeSO3, 4 NaCl, 1.78 CaCl2, 0.3 Na-GTP, 4 Mg-ATP, 40 HEPES and 5 EGTA (pH 7.3). The ACSF contained 10 µM AP5, 20 µM 7-chlorokynurenic acid, 10 µM SR 95531 and 0.3 µM strychnine. Stimulus artefacts were removed as previously described (Saviane and Silver, 2006). Data for WT mice is from Hallermann et al. (2010) with permission.
Figure 2 with 1 supplement

Modulation and quantification of vesicle mobility in MFTs.
(A) Weighted average FRAP curve for control conditions (black circles; 35°C; 62 MFTs, 619 locations, 6 mice; from Figure 1D), 21°C (green circles; 36 MFTs, 414 locations, 2 mice), 10 µM cytochalasin-D and 10 µM latrunculin-B (blue circles; 60 MFTs, 458 locations, 3 mice) and 5 µM jasplakinolide (yellow circles; 44 MFTs, 492 locations, 2 mice). Lines show double-exponential fits. Diamonds indicate t1/2. Data were normalized between f0 and fb, where fb was estimated from the fits at t = 0. (B) Same as A but for 2 µM okadaic acid (purple circles; 42 MFTs, 388 locations, 2 mice), 50 µM roscovitine (red circles; 45 MFTs, 374 locations, 3 mice) and fixed slices (brown circles; 17 MFTs, 168 locations, 1 mouse). (C) Fit of the analytical solution of Axelrod et al. (Ax; Axelrod et al., 1976) for passive diffusion (Dlong = 0.025 ± 0.003 µm2/s; red line) and directed flow (Vo = 0.344 ± 0.012 µm/s; yellow line) to normalized drift-corrected control FRAP data (open black circles; Figure 2—figure supplement 1D). Blue line shows the best-match finite-difference (FD) simulation using iPSF and cPSF of our microscope, a 0.5 ms bleaching pulse, 2 ms probe pulses and Dlong = 0.028 µm2/s. (D) Dlong for MFTs (black), goldfish retina bipolar cells (orange; Holt et al., 2004), lizard retina cone cells (yellow; Rea et al., 2004) and mouse NMJ (brown; Gaffield and Betz, 2007). Dlong for rat hippocampal boutons at room temperature computed from fluorescence correlation spectroscopy (FCS) assuming a pure diffusion (pink circle), stick and diffuse model (diamond), a caged diffusion model (filled triangle; Yeung et al., 2007), a caged diffusion model using different FCS data (square, Jordan et al., 2005), and for single-vesicle tracking measurements (open triangle, Lee et al., 2012). Mobile fractions are given in parentheses if known (MFT value is from Figure 4)
-
Figure 2—source data 1
Average FRAP curves for single MFTs for various conditions.
- https://doi.org/10.7554/eLife.15133.005
-
Figure 2—source data 2
Average percent fluorescence recovered at 1 s and 5 s after bleaching.
- https://doi.org/10.7554/eLife.15133.006
-
Figure 2—source data 3
Parameters file for best-match finite-difference FRAP simulation.
- https://doi.org/10.7554/eLife.15133.007
Figure 2—figure supplement 1
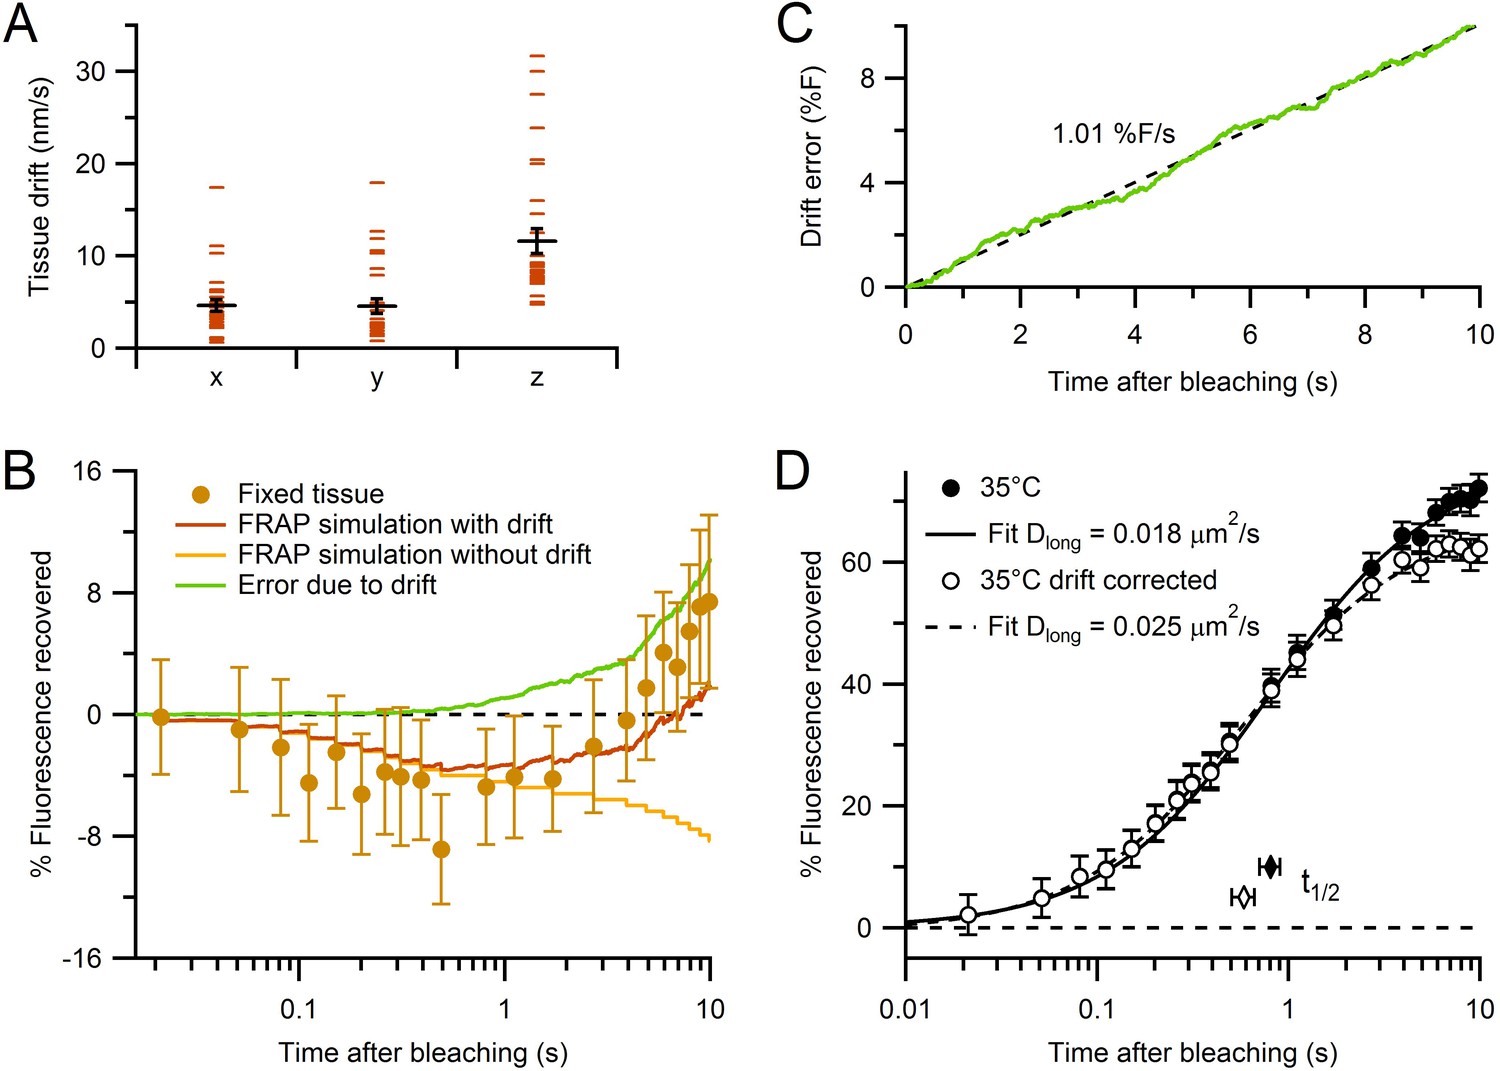
Characterization of tissue drift and correction of FRAP curves.
(A) Absolute rates of tissue drift in x, y and z directions (n = 29, 29 and 32, respectively; 35°C). Drift rates were measured by fluorescence CCD imaging of small spherical objects for 2–10 min. While x and y drift directions were random between locations, drift in z was consistently positive (i.e. upward). (B) Estimating the error due to drift using Monte Carlo FRAP simulations computed for conditions where (1) all vesicles and mitochondria were immobile (yellow) and (2) all vesicles and mitochondria moved in the same direction with average drift rates in A (brown). The difference between the two FRAP curves gave the error due to drift (green). The experimental FRAP data from fixed tissue (brown circles; Figure 2B) had similar behaviour to the simulation with added drift, but with slightly larger fluorescence recovery. (C) Time dependence of predicted error induced by tissue drift (green). Black dashed line shows fit (slope = 1.01% F/s, Pearson’s r = 1.00) to the error due to drift in B, plotted with normal x-axis. (D) The control experimental FRAP curve at 35°C (Figure 2A) before and after correction for the error due to drift computed in C (closed and open circles, respectively). Solid and dashed black lines are normalized fits (Table 1).
Figure 3 with 2 supplements
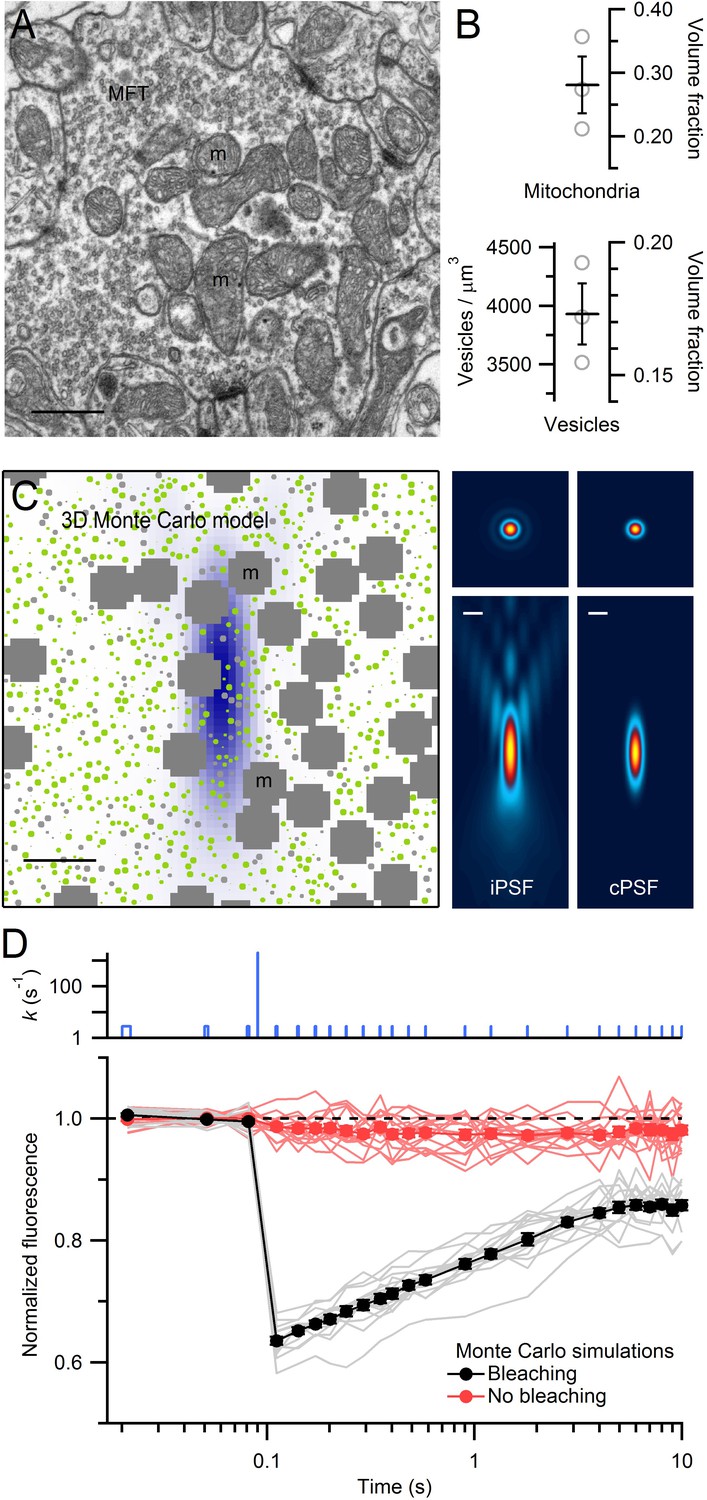
EM measurements of vesicle and mitochondrial densities within MFTs and Monte Carlo simulations of FRAP experiments.
(A) Electron micrograph of a cerebellar MFT from adult mouse showing vesicles and mitochondria (m). Scale bar: 0.5 µm. (B) Mean density of vesicles and mitochondria (black lines) computed from electron micrographs from 3 MFTs (gray circles), where the vesicle density is computed for the non-mitochondrial volume. Vesicle volume fraction was computed assuming a diameter of 44 nm in fixed tissue (Figure 3—figure supplement 1E). (C) Left: xz cross section (3 × 3 µm) through the 3D Monte Carlo model of the MFT simulating live tissue conditions, showing randomly placed 49 nm vesicles (0.17 volume fraction) that are mobile (green) or immobile (light gray, 25%), and clusters of mitochondria (dark gray, 0.28 volume fraction). Differences in vesicle diameters reflect their different cross sections in a single plane. Blue shading denotes iPSF. Right: xy (top, 3 × 3 µm) and xz (bottom: 3 × 7 µm) cross sections of iPSF and cPSF (Figure 3—figure supplement 2). Scale bars: 0.5 µm. (D) FRAP simulations for model in C with (black) and without (red) the bleaching pulse, showing individual trials (lines) and averages (filled circles). Top: bleaching rate (k) of Equation (4) used for probe and bleaching pulses.
-
Figure 3—source data 1
Density of vesicles and mitochondria.
- https://doi.org/10.7554/eLife.15133.012
Figure 3—figure supplement 1
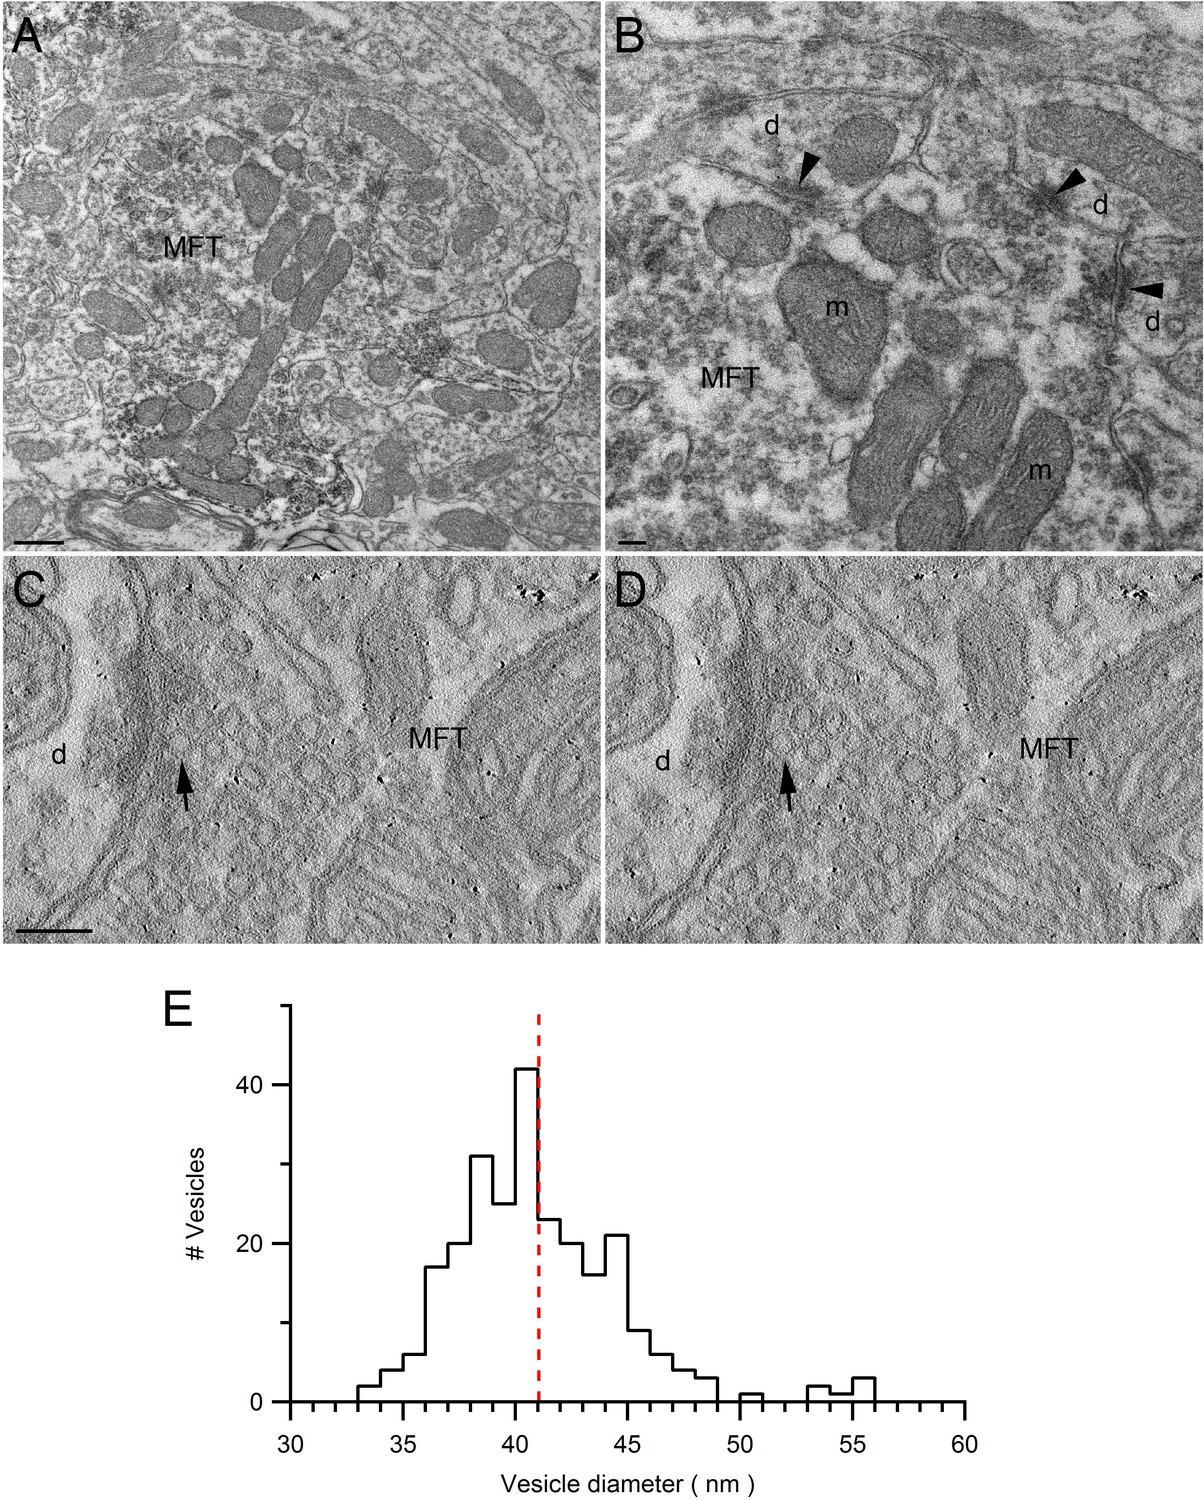
Ultrastructure of VGLUT1-Venus expressing MFTs and measurements of vesicle diameter.
(A,B) Low (A) and high (B) magnification EM images of the cerebellar GC layer showing a VGLUT1Venus-immunopositive MFT. The higher magnification in B shows asymmetrical synapses (arrowheads) made by the MFT with GC dendrites (d). The MFT contains a cluster of mitochondria (m) in the middle and high density of synaptic vesicles. Scale bars: 400 nm (A) and 100 nm (B). (C,D) EM tomographic subvolumes (0.6 nm thick, 6 nm apart) of a MFT making an asymmetrical synapse with a GC dendrite. Arrows denote a docked synaptic vesicle. Such segmentation views were used to find the largest diameter of each vesicle. Scale bar: 100 nm. (E) Distribution of synaptic vesicle diameters (n = 256; 1 nm bins) has a mean of 41.1 ± 0.2 nm (calculated from 3 tomographic subvolumes). Taking into account the proteins that extend ~1.2 nm from the vesicle membrane (Takamori et al., 2006), and the cubic relationship between vesicle radius and volume, the mean volume occupied by a vesicle is equivalent to a sphere with 44 nm diameter.
-
Figure 3—figure supplement 1—source data 1
Synaptic vesicle diameters.
- https://doi.org/10.7554/eLife.15133.014
Figure 3—figure supplement 2
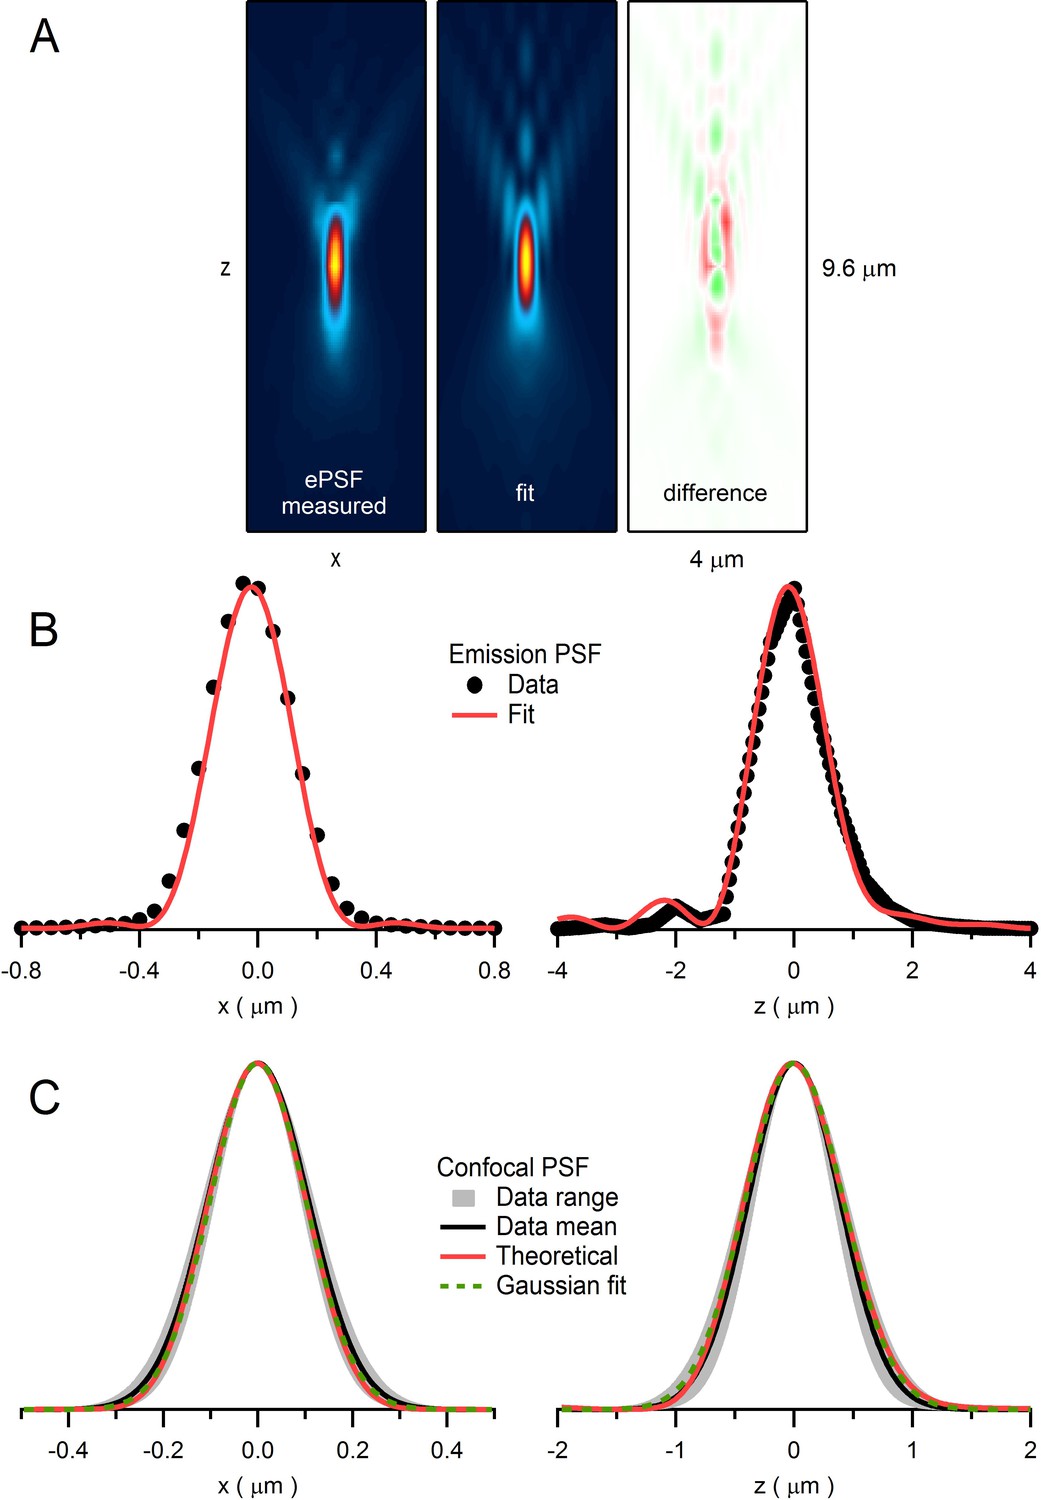
Quantification of emission and confocal point spread functions.
(A) The emission point spread function (ePSF) measured from fluorescence emitted from an imaged bead as previously described (DiGregorio et al., 2007). Left: xz plane (y = 0; 4.0 × 9.6 µm) of a 3D wide-field ePSF created from axial images (xy plane; 1 pixel = 0.05 µm) of a 110 nm fluorescent bead (Molecular Probes yellow-green FluoSpheres: 505 nm excitation, 515 nm emission) taken in multiple planes in 0.4 µm steps (dz). The resolution in the axial plane was increased by a factor of 8 (i.e. dz = 0.05 µm) by cubic spline interpolation. Vertical symmetry along x-axis was created by averaging. Values were normalized between 0 and 1, displayed with a colour scale from blue to yellow. Middle: 2D fit of ePSF to a diffraction integral representation of a high-NA objective (Sheppard and Torok, 1997) that includes a sin2θ series function to account for spherical aberrations (DiGregorio et al., 2007). Right: difference between ePSF and the 2D fit displayed with a colour scale from green (−0.14) to red (+0.14). (B) 1D profiles of ePSF and the fit in A along x-axis (left; y = 0, z = 0) and z-axis (right; x = 0, z = 0). (C) Left: 1D profile of the average confocal PSF (cPSF) in the x-axis (black line; FWHMxy = 255 nm) and range (gray; FWHMxy = 218–336 nm) computed from fluorescence measured from 110 nm beads as a focused laser spot (488 nm) was stepped across their lateral dimensions. Plots of average fluorescence versus spot location were fit with a Gaussian function and the resulting Gaussian widths were corrected for bead size using deconvolution (Chaigneau et al., 2011): FWHMactual = [(FWHMmeasured)2 – (FWHMbead)2]1/2. Red line is derived from a theoretical cPSF (Wilson and Carlini, 1987). Green dashed line is a Gaussian fit to the theoretical cPSF (FWHMxy = 238 nm). Right: 1D profile of the average cPSF in the z-axis (black line; FWHMz = 916 nm, range 780–1047 nm), with theoretical cPSF (red line) and its Gaussian fit (green dashed line; FWHMz = 975 nm).
Figure 4 with 1 supplement
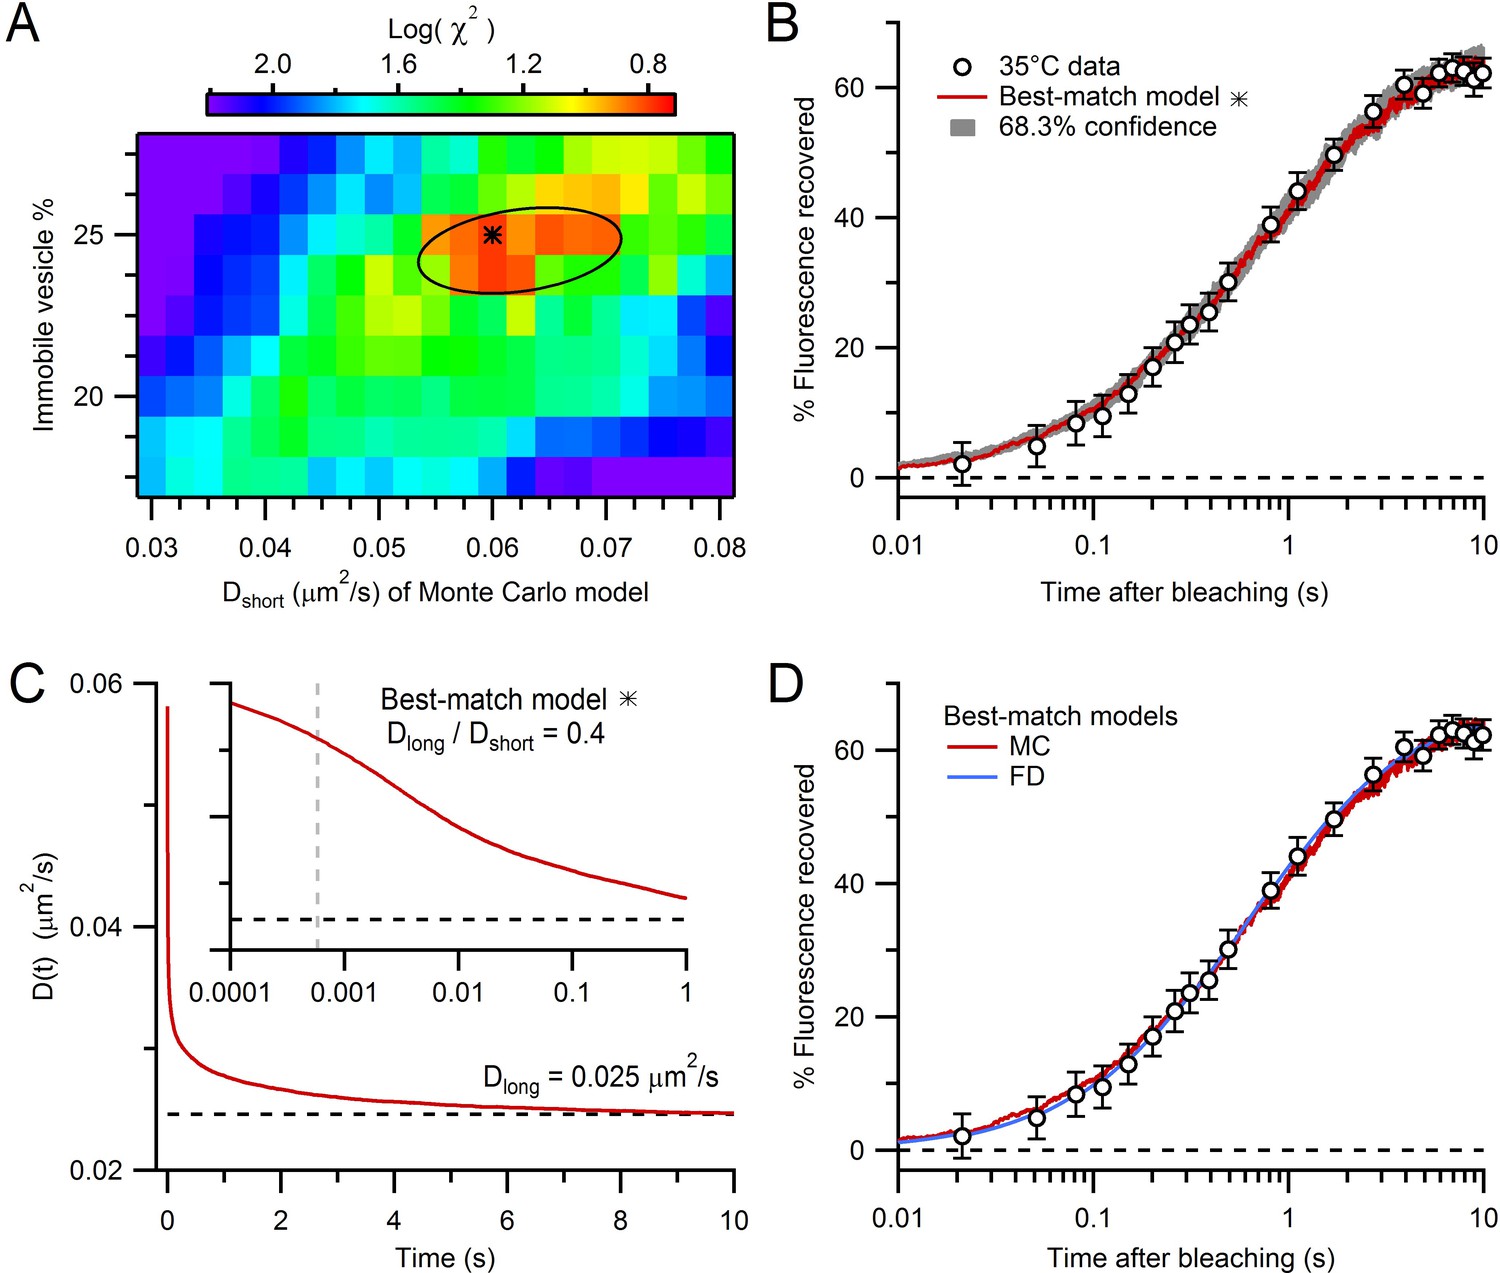
Estimation of vesicle diffusion coefficients Dshort and Dlong.
(A) Parameter search for the best match between the average drift-corrected control FRAP data (Figure 2C) and Monte Carlo (MC) simulations (Figure 3C,D) across a range of Dshort and % immobile vesicles, expressed as log(). Black star denotes smallest (Dshort = 0.060 µm2/s, 25% immobile vesicles). Ellipse denotes 68.3% confidence region for two degrees of freedom ( < 2.30). The vesicle step size (dr = 2 nm) was sufficiently small to avoid discretization error and the simulation space (a 2 µm cube) was sufficiently large to avoid boundary effects (Figure 4—figure supplement 1). (B) Best-match simulation (red) compared to control FRAP data (open circles). Gray denotes 68.3% confidence. (C) D(t) for best-match conditions in A with steady-state value (Dlong = 0.025 µm2/s; black dashed line) computed from a double-exponential fit for t > 10 ms. Inset, D(t) on a logarithmic timescale with average time to first collision (gray dashed line, 0.46 ms) when steric interactions start to reduce vesicle mobility. (D) Same as B but with added best-match finite-difference (FD) simulation with Dlong = 0.028 µm2/s (blue). Log() = 0.8 (MC) and 0.5 (FD).
-
Figure 4—source data 1
Parameters file for best-match Monte-Carlo FRAP simulation.
- https://doi.org/10.7554/eLife.15133.017
Figure 4—figure supplement 1
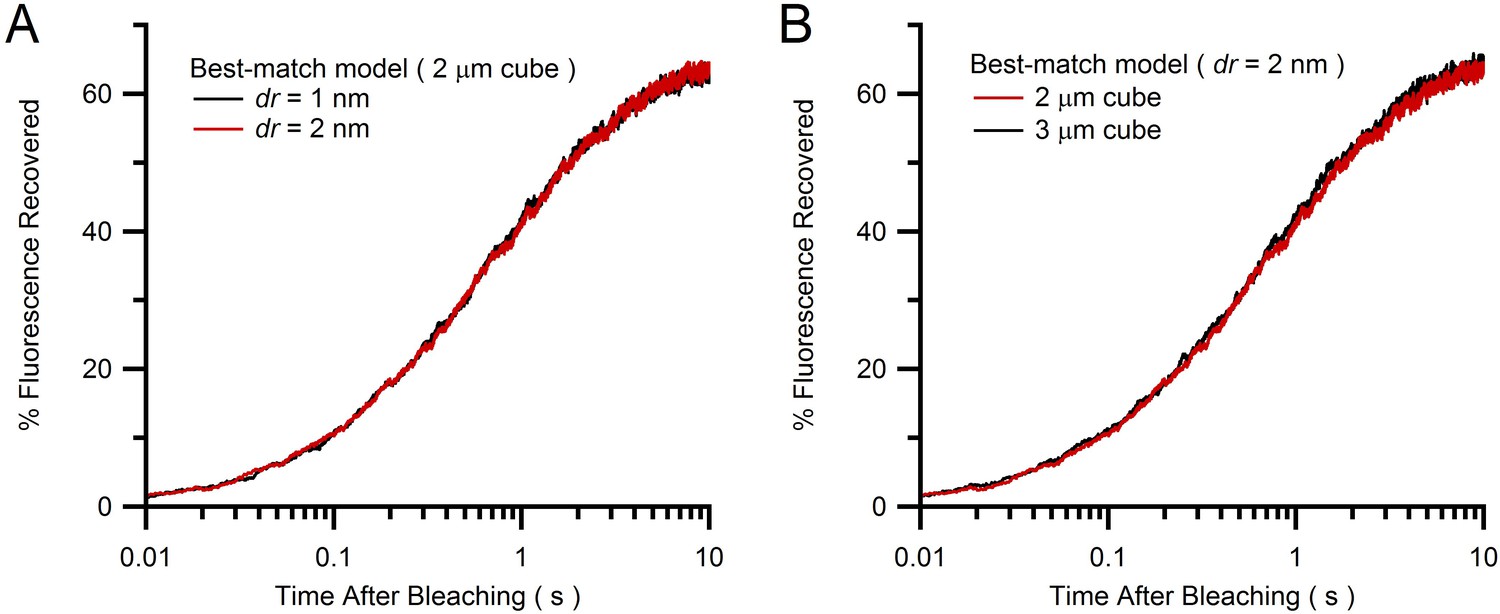
Comparison of Monte Carlo FRAP curves for different vesicle step size and simulation cube size.
(A) Average FRAP curves for vesicle step size dr = 1 and 2 nm (blue and red; see Equation 3) for best-match conditions in Figure 4B (2 µm cube geometries) showing a close overlap and therefore little discretization error for the simulation with dr = 2 nm. (B) The simulation in A for dr = 2 nm inside a 2 µm cube (red) was repeated inside a 3 µm cube (green), with both FRAP curves also showing a close overlap. Hence, a 2 µm cube is sufficiently large to avoid boundary effects and simulate the large interior of a MFT.
Figure 5 with 1 supplement
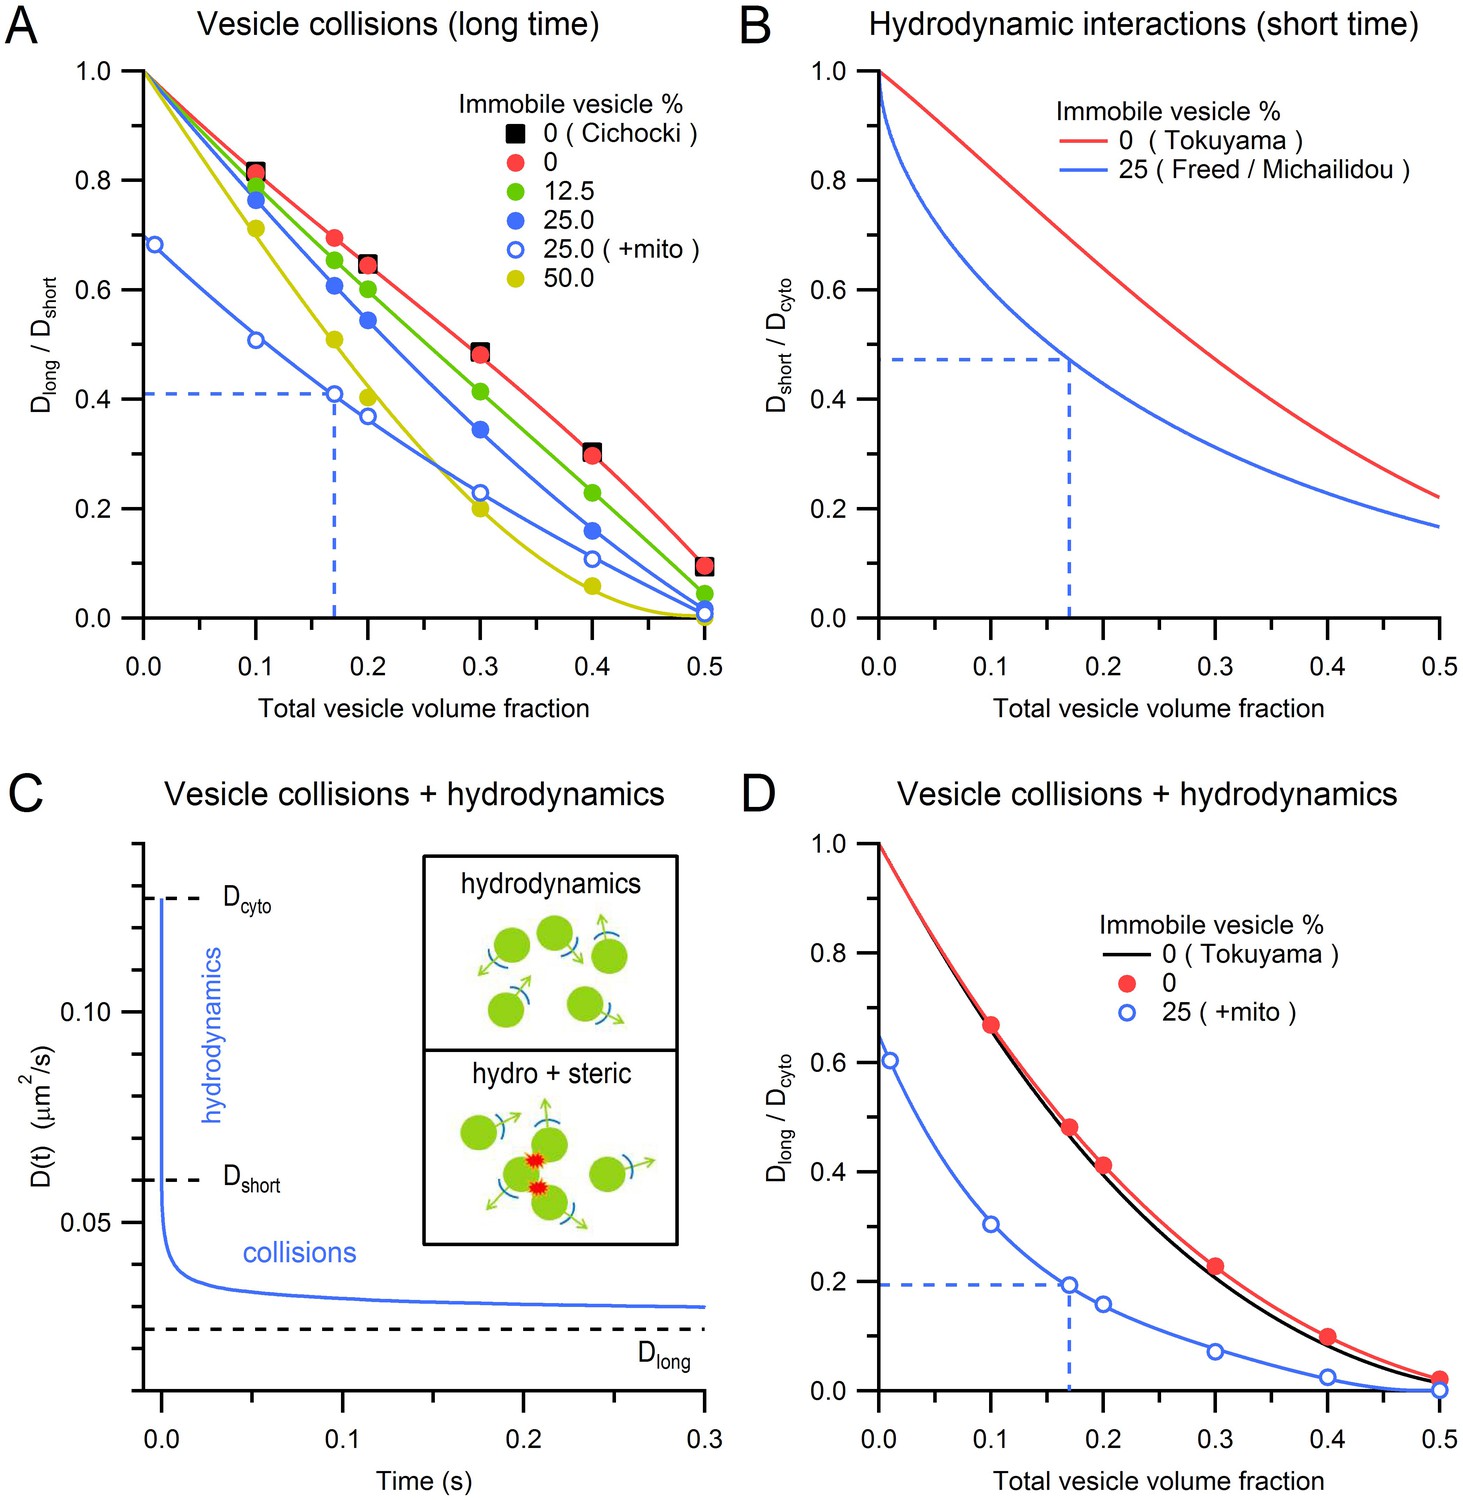
Effects of steric and hydrodynamic interactions on vesicle mobility.
(A) Effect of steric interactions on Dlong, normalized to Dshort, as a function of the vesicle volume fraction and % immobile vesicles. In the absence of immobile vesicles, the results matched those of Cichocki and Hinsen (black squares; 1990). Also shown is Dlong/Dshort for a 0.28 mitochondria volume fraction and 25% immobile vesicle fraction (blue open circles), with dashed blue line denoting average conditions at the centre of MFTs (0.17 vesicle volume fraction in the non-mitochondrial volume). Dlong was computed for an infinitely small vesicle step size (dr = 0) via linear extrapolation (Figure 5—figure supplement 1). Lines are polynomial fits. Error bars are smaller than symbols. (B) The effect of hydrodynamic interactions on Dshort, normalized to Dcyto, as a function of the vesicle volume fraction for conditions when all vesicles are mobile (red line; Equation 5; Tokuyama and Oppenheim, 1994) or when 25% are immobile (blue line; Equations 6,7). (C) D(t) for MFT conditions in A showing initial value (Dcyto), the reduction due to hydrodynamic interactions (Dshort) and to both hydrodynamic and steric interactions (Dlong). Inset, schematic diagram of hydrodynamic interactions between vesicles (top) and a combination of hydrodynamic and steric interactions (bottom). (D) Combined effect of steric and hydrodynamic interactions on Dlong/Dcyto as a function of vesicle volume fraction when all vesicles are mobile (red circles; computed via multiplication of data in A with data in B) compared to the theoretical prediction of Tokuyama and Oppenheim (black line; Equation 8). Blue circles denote the same MFT conditions as in A. Red and blue lines are polynomial fits.
Figure 5—figure supplement 1
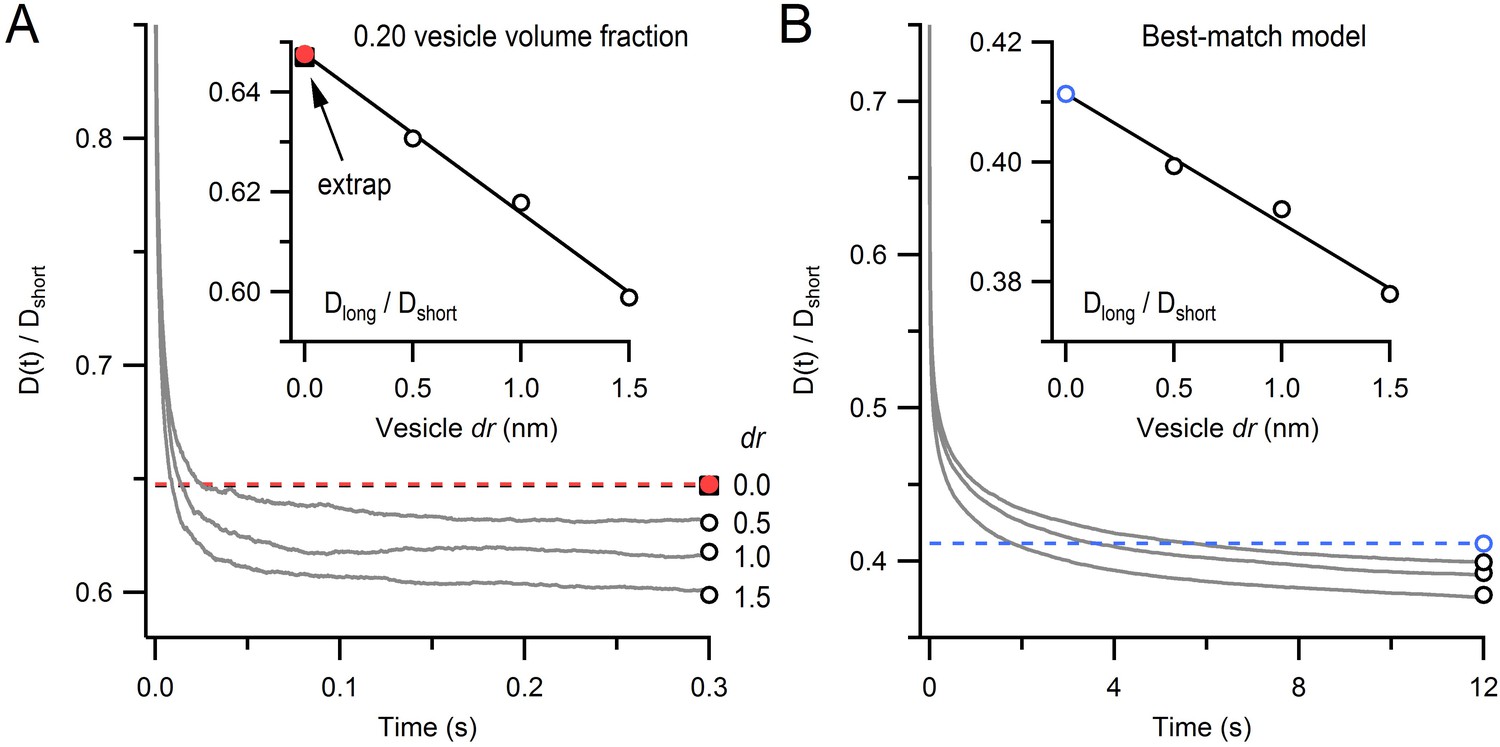
Monte Carlo estimate of D(t) for an infinitely small vesicle step size.
(A) Time course of the diffusion coefficient, D(t), for dr = 0.5, 1.0 and 2.0 nm, normalized to Dshort (gray lines; see Equation 3). Steady-state values (Dlong/Dshort; open black circles) were estimated from double-exponential fits for t > 10 ms. Inset: estimate of Dlong/Dshort for dr = 0 (red circle) computed via linear back extrapolation (black line). Black square denotes solution from (Cichocki and Hinsen, 1990) for comparison. Each line is the average of 15 simulations for a 1 µm cube, no mitochondria, 0.20 vesicle volume fraction, no immobile vesicles. Periodic boundary conditions were used to simulate infinite space. Error bars are smaller than symbols. (B) The same analysis as A except parameters were the same as those for the best-match simulation in Figure 4B.
Figure 6
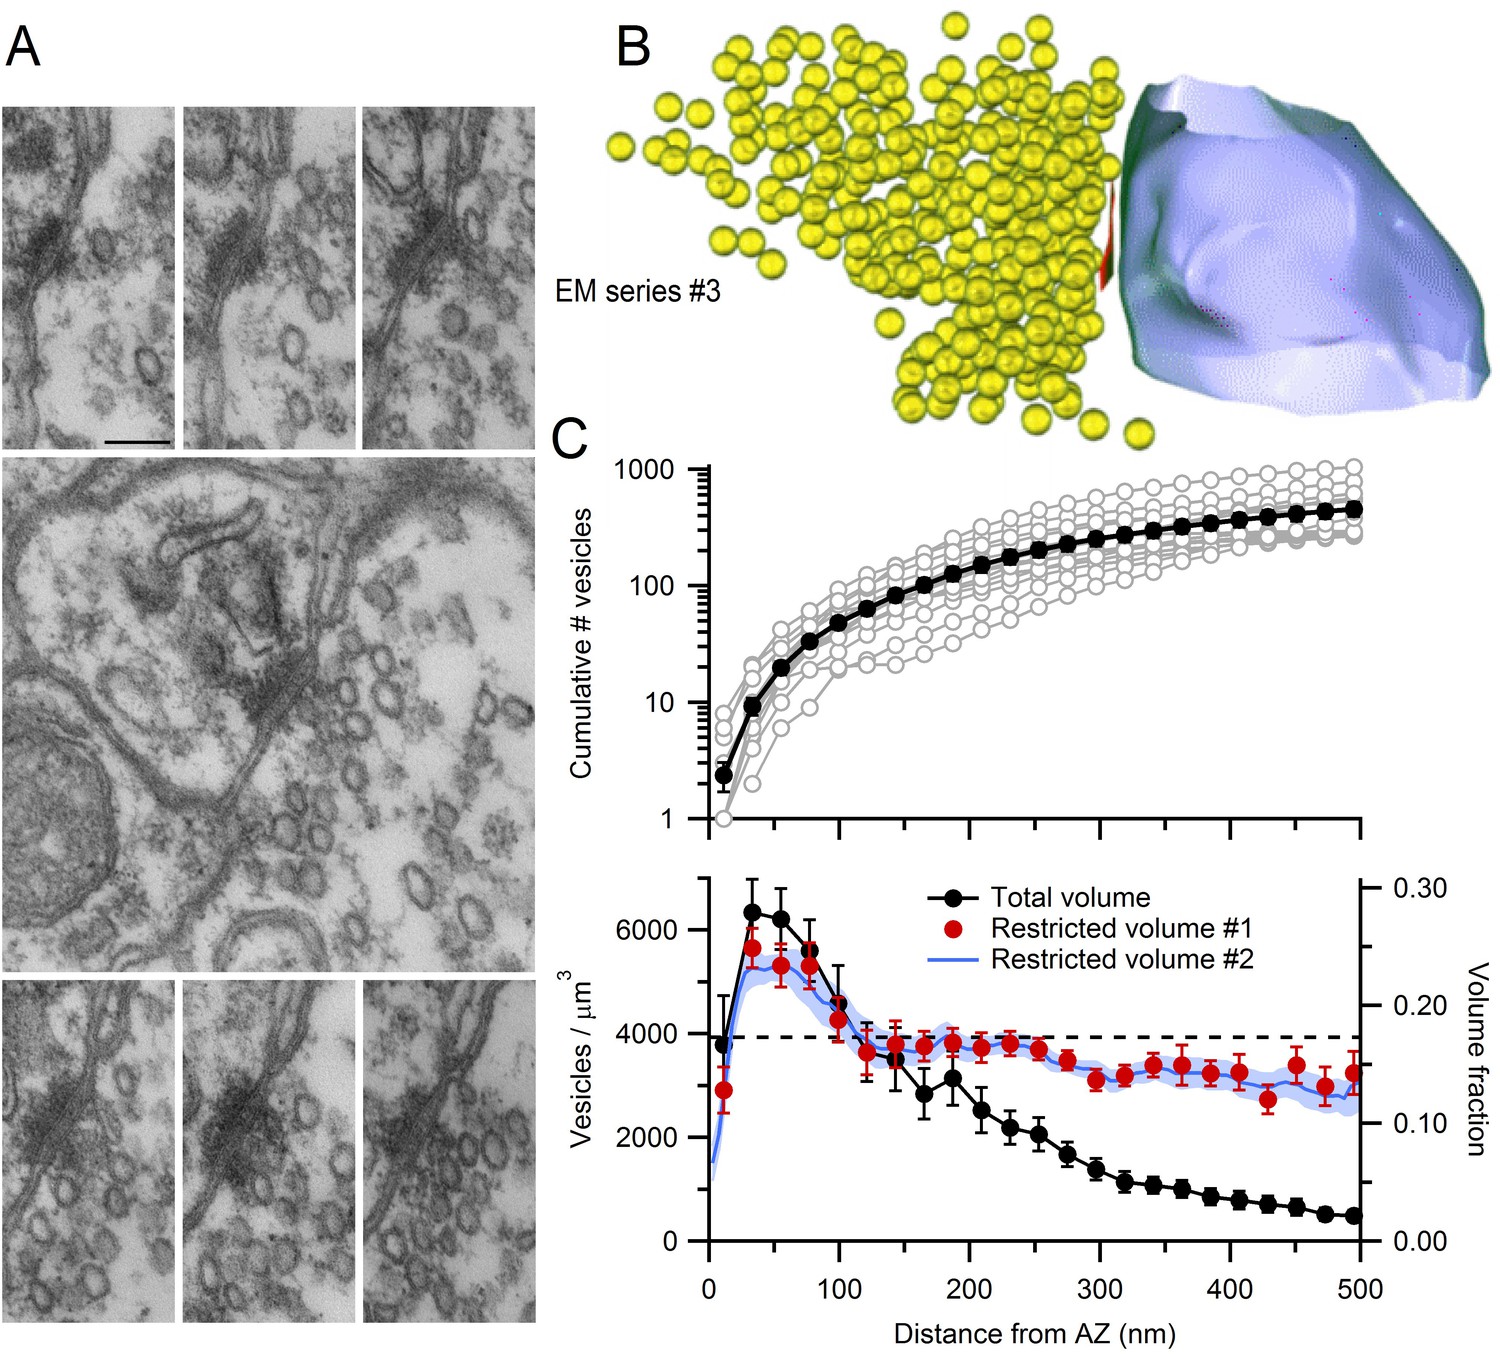
EM measurements of vesicle density near MFT AZs.
(A) Serial-section electron micrographs containing a cerebellar MFT-GC synaptic junction (EM series #3). Scale bar: 100 nm. (B) 3D reconstruction of the synapse in A showing an AZ (red), synaptic vesicles (yellow) and postsynaptic GC dendrite (blue). (C) Vesicle count (top) as a function of distance from the AZ computed from 3D reconstructions as in B (n = 14; 22 nm bins). Counts of 0 for first bin are not shown (n = 3). Vesicle density (bottom; left axis; count per volume) for the total volume surrounding the AZ (black) or restricted volume within the vesicle cloud (red circles), and the vesicle volume fraction within the vesicle cloud computed using 4.4 nm voxels (blue line; right axis). Dashed line denotes vesicle density measured at the centre of the MFT (Figure 3B).
-
Figure 6—source data 1
AZ area and vesicle densities from 3D AZ reconstructions.
- https://doi.org/10.7554/eLife.15133.022
Figure 7 with 3 supplements

Diffusion-mediated vesicle supply to 14 MFT AZs.
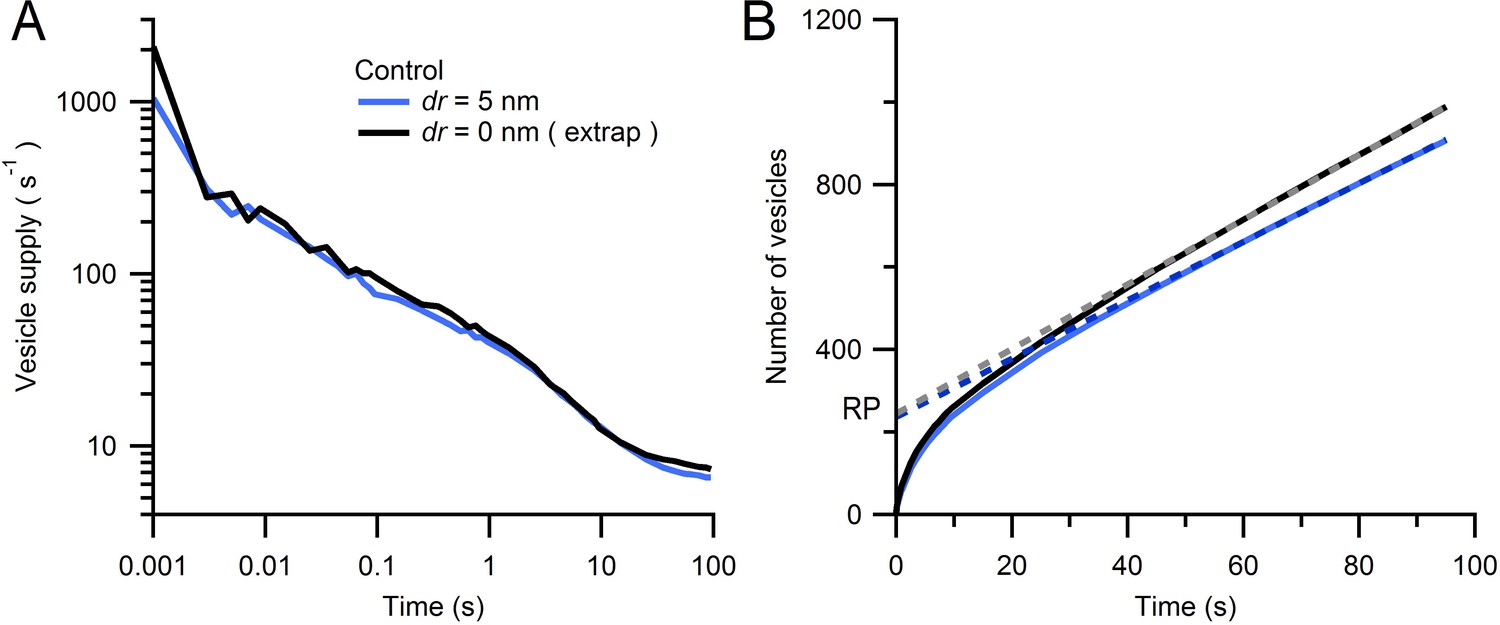
(A) xy cross sections through a Monte Carlo simulation of a 3D AZ reconstruction (Figure 6B; EM series #3) showing non-diffusible space (gray) surrounding the vesicle cloud and AZ (red), and reserve vesicles surrounding the cloud with restricted access. The immobile vesicle fraction was 25% (gray circles). For mobile vesicles within the cloud (green circles) Dshort was computed via a local density measurement, and hydrodynamic interactions arising from the plasma membrane (Equations 9 and 10) reduced Dshort as vesicles approached the AZ (Figure 7—figure supplement 1B). Vesicles that touched the AZ were instantaneously released. Only the central part of the simulation is shown. Scale bar: 0.5 µm. (B) Vesicle supply rate to the AZ for 14 AZ reconstructions (Figure 6) and their average (blue line). Black line denotes AZ in A. (C) Average control in B compared to the same simulations repeated for: vesicle-to-vesicle connectors and vesicle-to-AZ tethers with 100-ms lifetime for vesicles <150 nm of the AZ (orange; C-100 ms), no hydrodynamic interactions (No HI; yellow), no hydrodynamic or steric interactions between vesicles (No HI or SI; green; vesicles were simulated as dimensionless points; Dlong = Dcyto = 0.127 µm2/s) and an ‘open’ geometry where the vesicle cloud is continuous with the reserve (red). See Figure 7—figure supplement 2. (D,E) Average supply rate between 0–2 ms and at 100 ms computed for conditions in C and for connectors and tethers with 1 ms lifetime (C-1 ms). (F) Cumulative number of vesicles supplied to the AZ for simulations in C. (G) Same as F but for 100 s. Line fit to the control (black dashed line; 50–100 s) illustrates back extrapolation used to compute the RP size and the vesicle supply rate from the slope. (H,I) Supply rate between 50–100 s and pool size (as illustrated in G) for conditions in C. Estimates for an infinitely small vesicle step (dr = 0) for control conditions are similar to those shown here for dr = 5 nm (Figure 7—figure supplement 3). Gray shaded regions denote range of experimentally measured values.
-
Figure 7—source data 1
Vesicle supply rates and pool sizes computed from Monte Carlo AZ simulations.
- https://doi.org/10.7554/eLife.15133.024
-
Figure 7—source data 2
Parameters file for one Monte-Carlo AZ simulation of EM series #3.
- https://doi.org/10.7554/eLife.15133.025
Figure 7—figure supplement 1
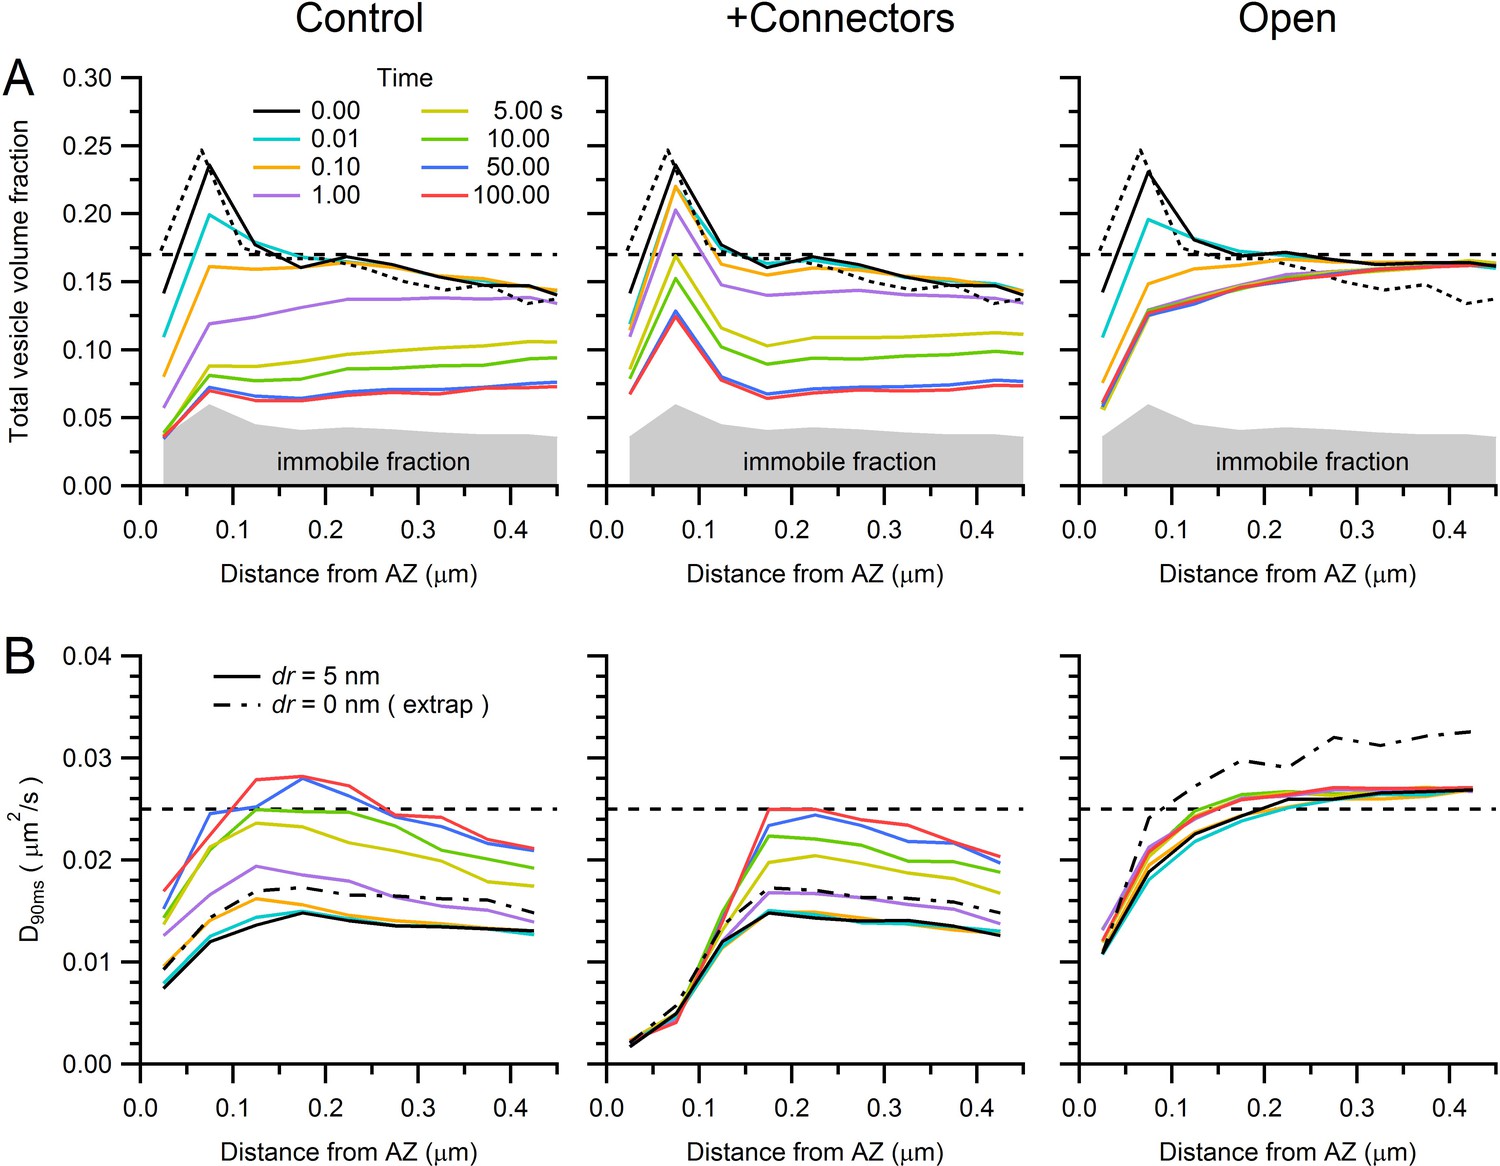
Predicted vesicle mobility near the AZ.
(A) Average vesicle density near the AZ (computed in 50 nm bins for 14 AZs) at various times during the simulations of sustained release in Figure 7B for control (left), in the presence of connectors and tethers (middle; 100 ms lifetime) and for open-geometry conditions (without connectors and tethers; right). Gray region denotes the immobile vesicle volume fraction. Dashed black line denotes vesicle density measured at the centre of the MFT. Dotted black line denotes vesicle density computed with the original vesicle positions from our EM reconstructions in Figure 6, which is only slightly different to the vesicle density at the start of the simulations (solid black line) due to the algorithm that removes vesicle overlaps. (B) Estimated vesicle diffusion constant near the AZ (D90ms; computed as for Dlong in Figure 5C, but using an average of D(t) between 80–100 ms, where D(t) is computed from the MSD starting at times specified by the line colours in legend A) for different times during sustained release, across different conditions. Dashed black line denotes measured Dlong at the centre of the MFT. The vesicle step size used in the simulations was the same as that in Figure 7 (dr = 5 nm; solid lines). However, the dashed-dotted black line denotes D90ms at t = 0 estimated for an infinitely small vesicle step (dr = 0) computed via linear extrapolation using simulations for dr = 1, 2 and 5 nm (see Figure 7—figure supplement 3). Note, vesicle mobility in the open-geometry simulations is higher than Dlong at the centre of the MFT because the reserve pool in these simulations does not contain mitochondria.
Figure 7—figure supplement 2
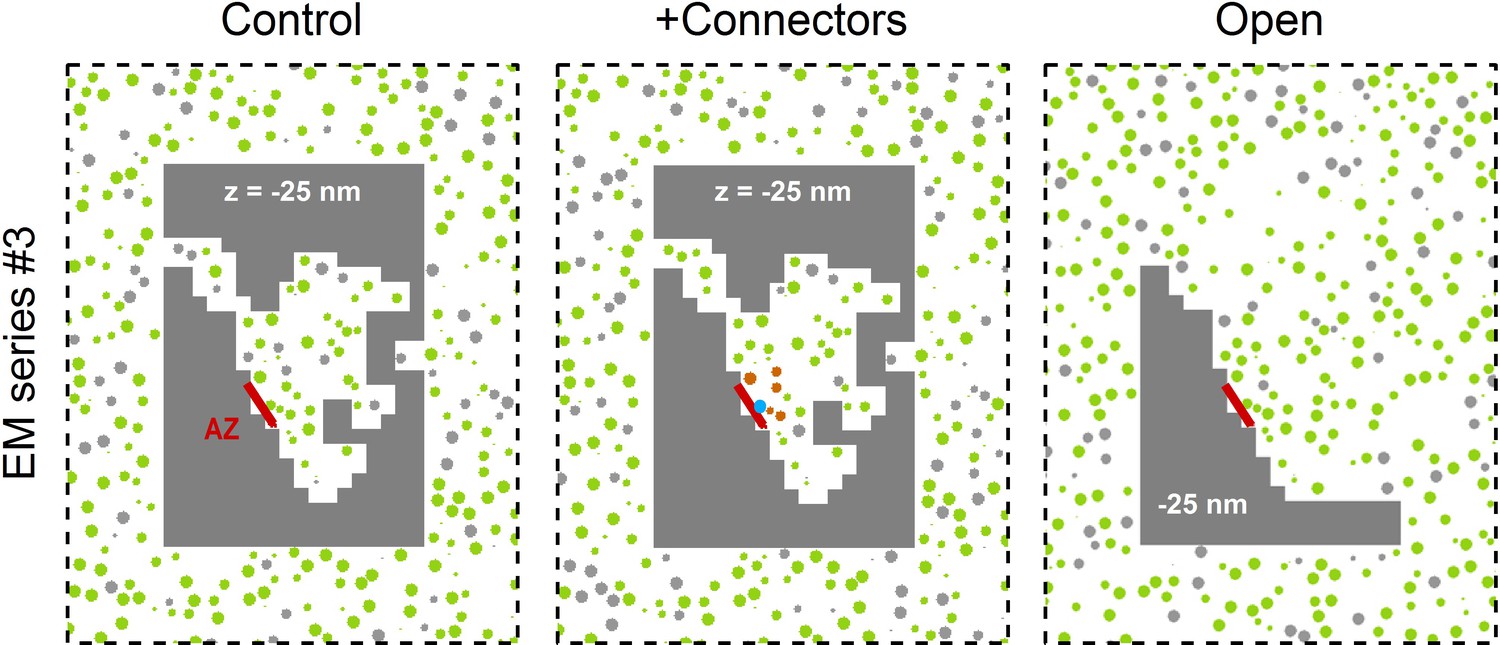
Three Monte Carlo simulation configurations for the 3D AZ reconstruction of EM series #3.
The control xy cross section (left) is from Figure 7A. For simulations with connectors (middle) vesicles <150 nm from the AZ are connected to each other if they are <10 nm from each other (orange), and tethered to the AZ if they are <8 nm from the AZ (blue). For the open geometry (right) non-diffusible space (gray) away from the AZ was converted to diffusible space and populated with vesicles at a 0.17 volume fraction; this effectively combines the RP with the reserve pool.
Figure 7—figure supplement 3
Estimate of Monte Carlo AZ simulations for an infinitely small vesicle step size.
(A) Average rate of vesicle supply to the AZ for dr = 5 nm (blue; from Figure 7B; n = 14 AZs) and dr = 0 nm (black) computed via linear extrapolation using simulations for dr = 2, 3 and 5 nm (see Equation 3). At early times (0–2 ms) the vesicle supply rate was higher for dr = 0 nm than for dr = 5 nm (2097 ± 346 vs. 1052 ± 294 s−1) but was comparable at intermediate times (100 ms; 94 ± 10 vs. 73 ± 13 s−1). (B) Cumulative number of vesicles supplied to the AZ for data in A with linear fits over 50–100 s (dashed lines). The RP sizes estimated via back extrapolation are similar (245 ± 40 vs. 237 ± 40 vesicles for dr = 0 and 5 nm, respectively) as are the steady-state vesicle supply rates (8 ± 1 vs. 7 ± 1 s−1).
Figure 8 with 1 supplement

AZ simulations of release during a 100 Hz stimulus train with vesicle docking, priming and stochastic release.
(A) Average vesicle release rate during simulations of a 100 Hz stimulus train across 14 AZs (control geometries) each with an RRP of 1 (dark blue line) or 2 (light blue line) vesicles (i.e. 1 or 2 release sites) and a release probability of 0.5. Reloading of the RRP was mediated by diffusion followed by a delay of 16.7 ms to account for docking/priming (τd+p; Figure 8—figure supplement 1). Diffusion-limited vesicle supply rate to the AZ is shown for comparison (dashed blue line; instantaneous release condition from Figure 7C). Dark gray lines denote the maximal steady-state release rates (after the initial release of the RRP) for 1 or 2 release sites (30 and 60 s−1, respectively); rates falling below these lines indicate vesicle diffusion is limiting vesicle release. Red line shows release from an AZ with an RRP of 1 and the same τd+p for open geometry conditions during a 100 Hz train. Diffusion-limited vesicle supply rate to the open geometry AZ is shown for comparison (dashed red line; instantaneous release condition from Figure 7C). (B) Average release rate between 0–10 ms computed for conditions in A (note difference in window length of early release compared to Figure 7D due to 10 ms inter-stimulus intervals). Open symbols denote instantaneous release conditions (INST). RS: release site. (C) Average release rate at 100 ms computed for conditions in A. At these times the release rates are limited by τd+p and the release probability (horizontal dark gray lines for 1 and 2 release sites), not by vesicle diffusion. (D) Cumulative number of vesicles released during 100 Hz train for control conditions (solid blue lines). At late times the simulations of stochastic release during the train overlap with those for instantaneous release (dashed blue line) and have similar slopes (dashed and solid black linear fits, respectively). (E) Cumulative number of vesicles released for open-geometry conditions. Release during the 100 Hz train simulation with one release site (solid red line) is approximately half the diffusion-mediated AZ supply rate for the open-geometry configuration (dashed red line, and solid back line fit). (F,G) Supply rate between 50–100 s and pool size computed from linear fits to data in D and E. Dark gray lines in F as for A. Light gray shaded regions denote range of experimentally measured values.
Figure 8—figure supplement 1
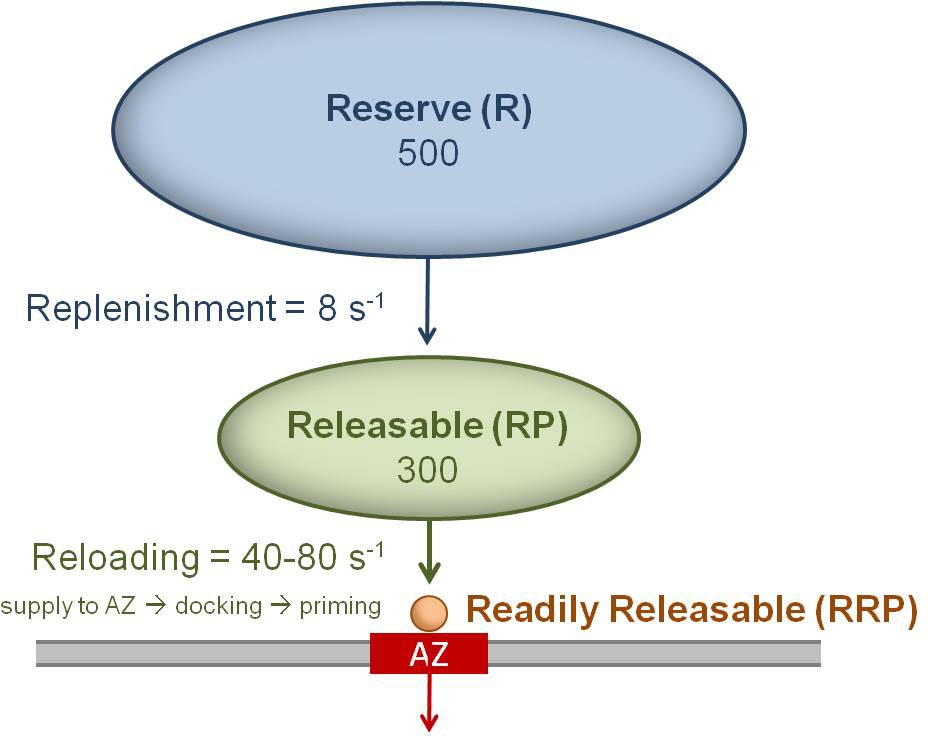
Cartoon of the three vesicle pools and their measured transition rates for a single MFT AZ.
Vesicles docked and primed at the AZ (red) are defined as the readily releasable pool (RRP = 1 or 2 vesicles for MFT AZs). Vesicles in the RRP are reloaded from a large releasable pool (RP), where the reloading rate (kreload) is determined by the time for vesicles to be supplied to the AZ (τs), plus the time for docking (τd) and priming (τp): kreload = (τs + τd + τp)−1. Vesicles in the RP are replenished from an even larger reserve (R) pool, but at a much slower rate.
Tables
Table 1
Estimates of Dlong under various experimental conditions.
| Solution | °C | t1/2 (s) | Dlong (µm2/s) | % Recovered |
|---|---|---|---|---|
| STRD (-drift) | 35 | 0.58 ± 0.08 | 0.025 ± 0.003 | 67 |
| STRD | 35 | 0.81 ± 0.10 | 0.018 ± 0.005 | 77 |
| STRD | 21 | 1.39 ± 0.24 | 0.010 ± 0.002 | 73 |
| CD + LB (10 µM) | 35 | 0.46 ± 0.05 | 0.032 ± 0.003 | 80 |
| Jaspla (2 µM) | 35 | 0.96 ± 0.13 | 0.015 ± 0.002 | 76 |
| Jaspla (5 µM) | 35 | 1.41 ± 0.15 | 0.010 ± 0.001 | 84 |
| OA (2 µM) | 35 | 0.12 ± 0.02 | 0.120 ± 0.018 | 85 |
| Rosco (50 µM) | 35 | 0.72 ± 0.11 | 0.020 ± 0.003 | 77 |
-
STRD: Standard ACSF. -drift: data corrected for tissue drift (Figure 2—figure supplement 1); all other measurements are not drift corrected. CD + LB: 10 µM cytochalasin-D plus 10 µM latrunculin-B. Jaspla: jasplakinolide. OA: okadaic acid. Rosco: roscovitine. Values for Dlong and t1/2 (± STDV) were computed by fitting experimental FRAP curves (Figure 2A,B) to Equation (2).
-
The effect of OA on vesicle mobility in the MFT is in close agreement with that reported by Shtrahman et al. (2005) who report Dlong = 0.10 µm2/s for hippocampal boutons in OA. While our results do show a reduction in the immobile vesicle fraction, this reduction is not enough to account for the large increase in Dlong. Instead, the increase in Dlong is more likely due to a reduction in protein interactions between the vesicles and cytoskeleton, as suggested by Shtrahman et al., in which case the effects of OA will be reflected in a change in Dcyto. Using data from Figure 5, we estimate Dcyto = 0.515 µm2/s in OA, a four-fold increase from control conditions (0.127 µm2/s).
-
Table 1—source data 1
Fits of Axelrod equation to FRAP curves.
- https://doi.org/10.7554/eLife.15133.010
Table 2
Predictions of vesicle mobility for different types of synaptic terminals.
| MFT | MFT | MFT | NMJ | Boutons | Ribbon | |
|---|---|---|---|---|---|---|
| Centre | Cloud | AZ face | AZ cluster | AZ cluster | Centre | |
| Ves. density (per µm2) | 118 | 103 | 170 | 224 | 200 | |
| Ves. density (per µm3) | 3930 | 3444 | 5652 | 4421 | ||
| Total ves. volume % | 17 | 17 | 25 | 33 | 29 | 29 |
| Immobile vesicle % | 25 | 25 | 17 | 40 | 73 | 13 |
| Imm. ves. volume % | 4 | 4 | 4 | 13 | 20 | 4 |
| Non-diffusible vol. % | 28 | 36 | 29 | 0 | 0 | 0 |
| Dcyto / D0 | 0.01 | 0.01 | 0.01 | 0.01 | 0.01 | 0.01 |
| Dshort / Dcyto | 0.47 | 0.47 | 0.39 | 0.24 | 0.19 | 0.37 |
| Dlong / Dshort | 0.41 | 0.30 | 0.29 | 0.20 | 0.09 | 0.43 |
| Dlong / Dcyto | 0.19 | 0.14 | 0.11 | 0.05 | 0.02 | 0.16 |
| D0 (µm2/s) | 12.682 | 12.682 | 12.682 | 12.764 | 12.764 | 9.055 |
| Dcyto | 0.127 | 0.127 | 0.127 | 0.128 | 0.128 | 0.091 |
| Dshort | 0.060 | 0.060 | 0.050 | 0.031 | 0.025 | 0.033 |
| AZ wall hydro. (β) | 0.84 | |||||
| Dlong | 0.025 | 0.018 | 0.012 | 0.006 | 0.002 | 0.014 |
| Dlong measured | 0.025 | NA | NA | 0.005 | 0.004 | 0.110 (0.015) |
-
For the MFT, 3D vesicle (ves) densities were computed from 2D densities by diving by the slice thickness (0.03 µm). The total vesicle volume % was computed assuming a 44 nm vesicle diameter in fixed tissue. It was assumed the immobile vesicle volume fraction near the AZ was the same as in the MFT centre (4%). For the MFT centre computation, the non-diffusible volume (vol) is the mitochondria volume fraction; for the cloud and AZ face computations, the non-diffusible volume is the non-diffusible space within the vesicle clouds computed from the 14 AZ reconstructions. D0 was computed via the Stokes-Einstein equation assuming a 49 nm vesicle diameter for in vitro conditions at 35°C. Diffusion constants and ratios are from Results (see Figure 5). Hydrodynamic (hydro) effects from the membrane wall near the AZ were computed via Equations (9) and (10), and are average β between 50 and 100 nm from the wall, where β = (2β||+β⊥)/3. Measured Dlong near the AZ face is not available (NA): vesicles close to AZs are too small to be detected by our FRAP measurements.
-
For the NMJ, the 2D vesicle density is the average of those reported in Mantilla et al. (2004) and Coleman et al. (2008). The total vesicle volume % was computed assuming a proportional relationship with the MFT vesicle density and volume fraction. The immobile vesicle % and measured Dlong is from Gaffield and Betz (2007). D0 was computed assuming a 49 nm vesicle diameter and 37°C.
-
Data for the ribbon synapse is from Rea et al. (2004). The 3D vesicle density was computed assuming 250,000 vesicles with 50 nm diameter inside a hemisphere with 6 µm diameter. The non-diffusible volume was set to zero since Figure 3A of Rea et al. shows few mitochondria. D0 was computed assuming a 50 nm vesicle diameter and 22°C. Note, our estimate of Dlong is 10-fold smaller than the measured Dlong of Rea et al., but is comparable to the measured Dlong of another study of ribbon-type synapses in bipolar cells (value shown in brackets; 0.015 µm2/s; Holt et al., 2004).
-
For the hippocampal boutons, the 2D vesicle density is from Li et al. (1995) and Schikorski and Stevens (2001). The total vesicle volume % was computed assuming a proportional relationship with the MFT vesicle density and volume fraction. The immobile vesicle % is from Shtrahman et al. (2005). D0 was computed assuming a 49 nm vesicle diameter and 37°C. Values for measured Dlong derived from fluorescence correlation spectroscopy (FCS) vary widely, depending on the model used to fit to the data (5 × 10⁻⁵ to 0.054 µm2/s; Figure 2D, pink symbols), but our predicted Dlong most closely matches that of a fit to pure diffusion (0.0043 µm2/s; Shtrahman et al., 2005) and the measured Dlong of Lee et al. (0.003 µm2/s; 2012) who tracked single vesicles using quantum dots.
Download links
A two-part list of links to download the article, or parts of the article, in various formats.
Downloads (link to download the article as PDF)
Open citations (links to open the citations from this article in various online reference manager services)
Cite this article (links to download the citations from this article in formats compatible with various reference manager tools)
Physical determinants of vesicle mobility and supply at a central synapse
eLife 5:e15133.
https://doi.org/10.7554/eLife.15133


