Adenosine diphosphate restricts the protein remodeling activity of the Hsp104 chaperone to Hsp70 assisted disaggregation
- Intercollegiate Faculty of Biotechnology, University of Gdańsk and the Medical University of Gdańsk, Poland
Figures
Figure 1 with 2 supplements

ADP restricts Hsp104 activities.
(A,B) ADP strongly inhibits the ATPase activity of Hsp104. The rate of ATP hydrolysis by Hsp104 was assessed (A) at 10 mM ATP or (B) at 2.6 mM ATP and at the indicated concentrations of ADP. Data are the mean of three independent experiments (± SD). (C) ADP inhibits fRCMLa translocation and proteolysis by HAP-ClpP. fRCMLa (5 μM) was incubated at 2.6 mM ATP with HAP (1 μM) and ClpP (1.8 μM) at the indicated concentrations of ADP and its proteolysis was measured by following changes in fluorescence anisotropy. In a control fRCMLa was incubated with ClpP without HAP (grey). (D) The rates of fRCMLa proteolysis by HAP-ClpP were calculated from the slopes of the fluorescence anisotropy curves for each ADP concentration shown in (C) and normalized to the HAP activity in the absence of ADP. (E) ADP impairs binding of Hsp104 to fRCMLa. Hsp104 E285Q (12 μM) was injected to the reaction mixture containing fRCMLa (1 μM), at 2.6 mM ATP and at the ADP concentrations indicated in the legend. After 200 s, non-labeled RCMLa was added to the final concentration of 40 μM. (F) The relative initial rates of fRCMLa binding by Hsp104 E285Q at the indicated ADP concentrations were calculated basing on the fluorescence anisotropy curves. a. u. – arbitrary units.
Figure 1—figure supplement 1
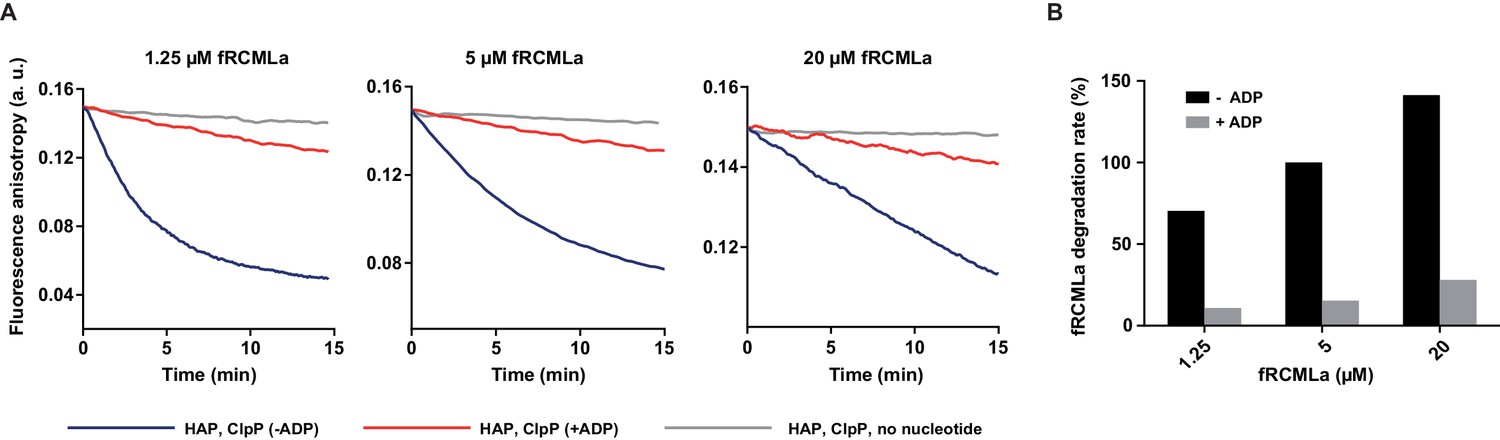
ADP inhibition of protein translocation through HAP.
(A) fRCMLa at the concentrations indicated in the figure legend was incubated with HAP (0.5 μM) and ClpP (0.5 μM) at 10 mM ATP (blue) or at 10 mM ATP and 2 mM ADP (red) or in the absence of nucleotides (grey). (B) The rates of fRCMLa proteolysis were calculated from the initial slopes of the fluorescence anisotropy curves from (A), normalized to the fRCMLa concentration and shown relatively to the degradation rate at 5 μM fRCMLa and 10 mM ATP. a. u. – arbitrary units.
Figure 1—figure supplement 2
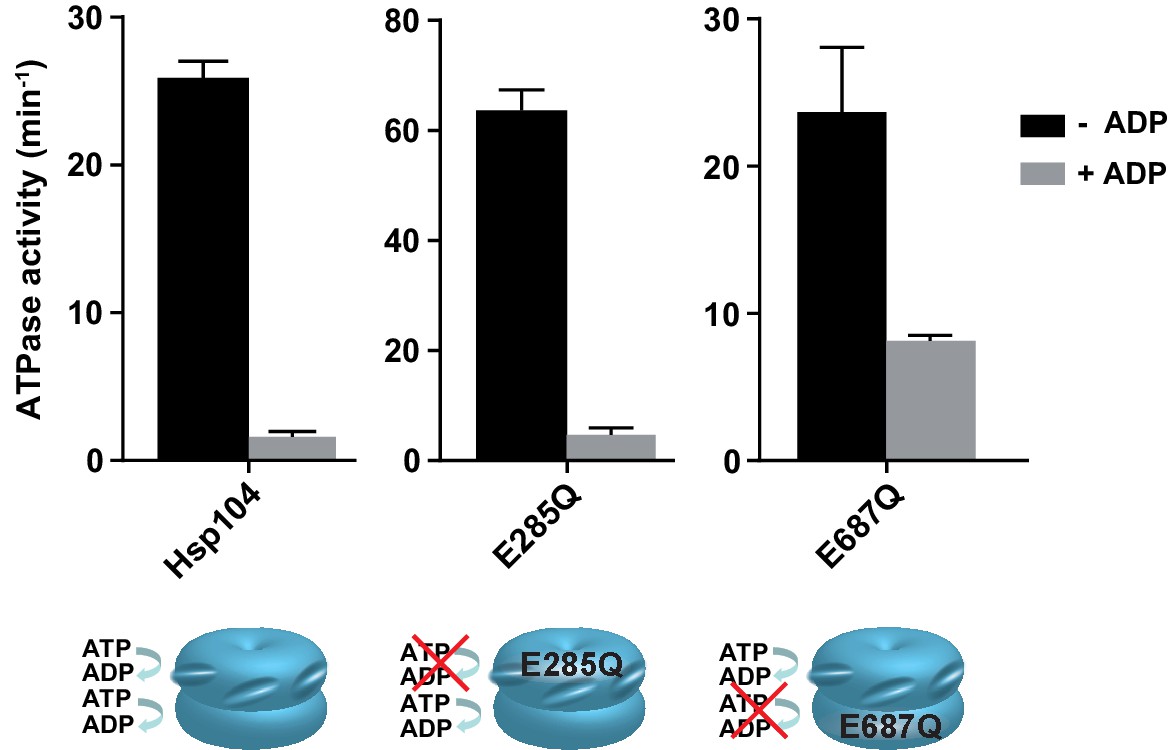
ADP effect on ATP hydrolysis by Hsp104 Walker B mutants.
ATPase activity of Hsp104 WT, E285Q (with only NBD2 hydrolytically active), and E687Q (with only NBD1 hydrolytically active) variants was measured at 2.6 mM ATP in the presence (grey) or absence (black) of 1 mM ADP. Data are the average of three experiments (± SD).
Figure 2
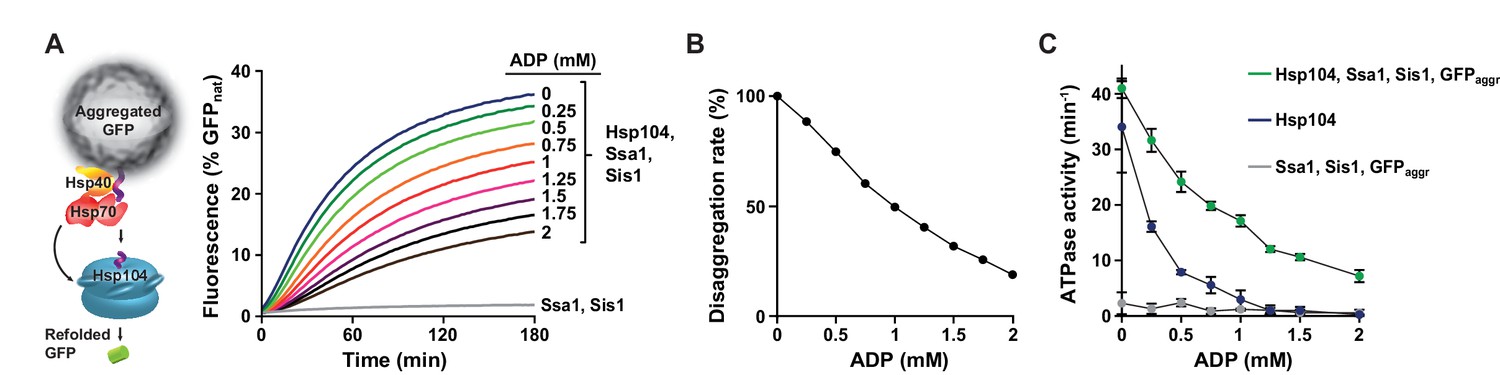
Hsp70 allows Hsp104 to overcome ADP inhibition.
(A) ADP impact on GFP disaggregation by Hsp104 and the Hsp70 system. Heat-aggregated GFP (0.04 mg ml-1) was incubated with Hsp104 (1 μM), Ssa1 (2 μM) and Sis1 (0.4 μM) at 2.6 mM ATP and at the indicated concentrations of ADP. A control experiment was performed without Hsp104 (grey). (B) The relative GFP renaturation rates by Hsp104 and Hsp70-Hsp40 at the indicated ADP concentrations were calculated from the initial slope of the fluorescence curves from (A). (C) ADP effect on ATP hydrolysis by Hsp104 during the Hsp70-assisted disaggregation. ATPase activity was measured for Hsp104 (1 μM) in the presence of Ssa1 (1 μM), Sis1 (0.1 μM) and aggregated GFP (0.2 mg ml-1) (green) or for Hsp104 alone (blue) under the conditions as in (A). For comparison, the ATPase activity of Ssa1, with Sis1 and GFP and without Hsp104 was assessed under the same conditions (grey). Data are the average of three experiments (± SD).
Figure 3 with 4 supplements
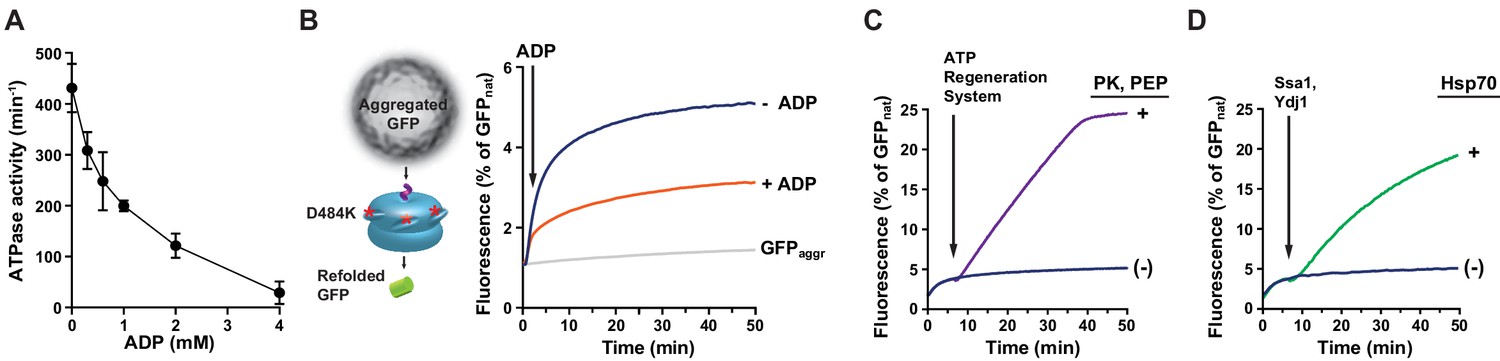
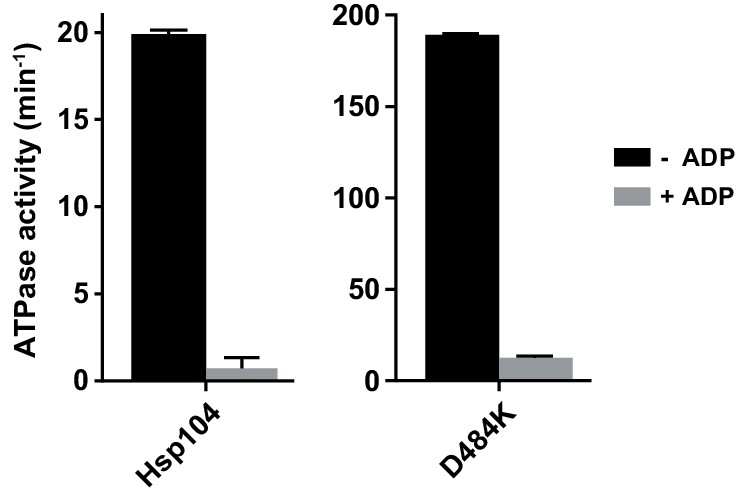
The derepressed D484K variant of Hsp104 is inhibited by ADP.
(A) The ATPase activity of Hsp104 D484K is strongly affected by ADP. ATPase activity of D484K variant was measured at 10 mM ATP and at the indicated concentrations of ADP. Values are the average of three independent experiments (± SD). (B) ADP inhibits the disaggregation activity of Hsp104 D484K in the absence of Hsp70. Disaggregation of heat-aggregated GFP (0.04 mg ml-1) by Hsp104 D484K (0.5 μM) at 10 mM ATP (blue). After 60 s of the reaction, ADP was added to 2 mM concentration (red). (C) ATP regeneration system or (D) The Hsp70 system restores the disaggregation activity of Hsp104 D484K. The experiment was initiated as in (B), and after 5 min (C) an ATP regeneration system comprising PK (0.1 mg ml-1) and PEP (40 mM) (purple) or (D) the Hsp70 chaperone system: Ssa1 (2 μM) and Ydj1 (0.5 μM) (green) was added to the reaction mixture.
Figure 3—figure supplement 1
Hsp104 D484K is affected by ADP similarly as the WT Hsp104.
ATPase activity of WT and D484K variant was measured at the physiological ATP concentration (2.6 mM) in the absence (black) or in the presence of 1 mM ADP (grey). Values are the average of three experiments (± SD).
Figure 3—figure supplement 2
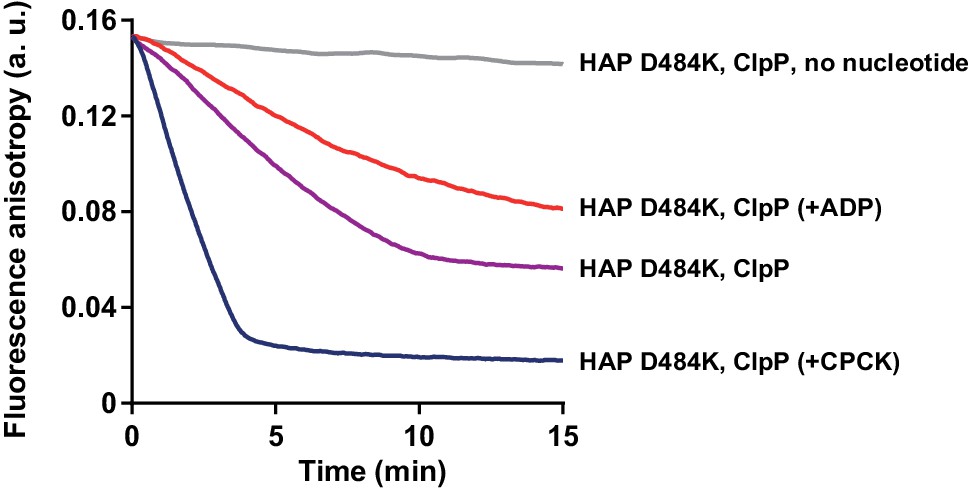
Protein translocation activity of HAP D484K is inhibited by ADP.
Proteolysis of fRCMLa (5 μM) by HAP D484K (0.5 μM) and ClpP (0.5 μM) was carried out at 10 mM ATP (purple) or in the absence of nucleotide (grey). Two other reactions were performed at 10 mM ATP and either in the presence of extra 2 mM ADP (red) or with an ATP regeneration system (0.2 mg ml-1 creatine kinase and 120 mM creatine phosphate) (blue). a. u. – arbitrary units.
Figure 3—figure supplement 3
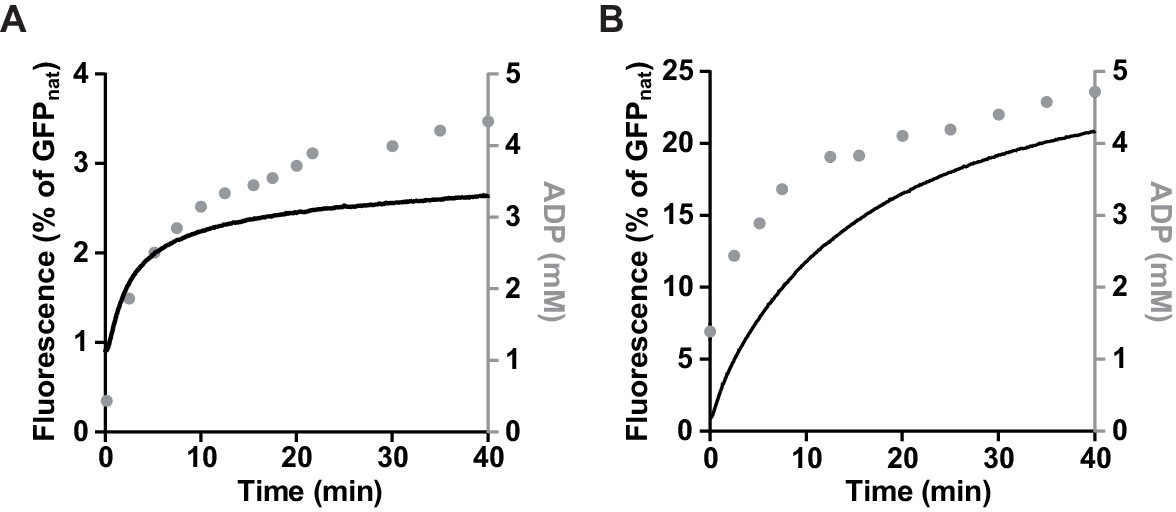
Hsp70 allows efficient disaggregation at low ATP:ADP ratio.
Disaggregation of heat-aggregated GFP (0.04 mg ml-1) (black) by Hsp104 D484K (1 μM) measured (A) in the absence or (B) in the presence of the Hsp70 system: Ssa1 (2 μM) and Ydj1 (0.5 μM). The total concentration of adenine nucleotides was 10 mM. At the indicated time points samples were taken from the reaction mixture and subjected to HPLC analysis to assess ADP concentration (grey).
Figure 3—figure supplement 4
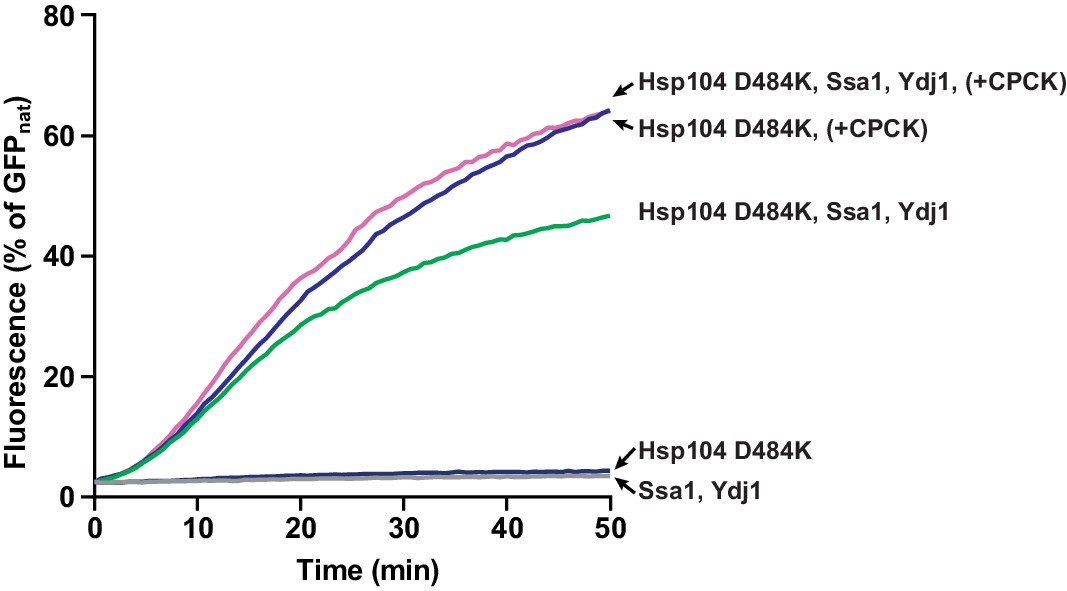
In the absence of ADP the derepressed Hsp104 D484K is independent of Hsp70 in disaggregation.
Disaggregation of heat-aggregated GFP (0.04 mg ml-1) by Hsp104 D484K (0.5 μM) was carried out at 10 mM ATP in the presence or absence of Ssa1 (2 μM) and Ydj1 (0.5 μM) or an ATP regeneration system (0.2 mg ml-1 creatine kinase and 120 mM creatine phosphate), as indicated. In a control experiment GFP was incubated with Ssa1 (2 μM), Ydj1 (0.5 μM), without Hsp104.
Figure 4
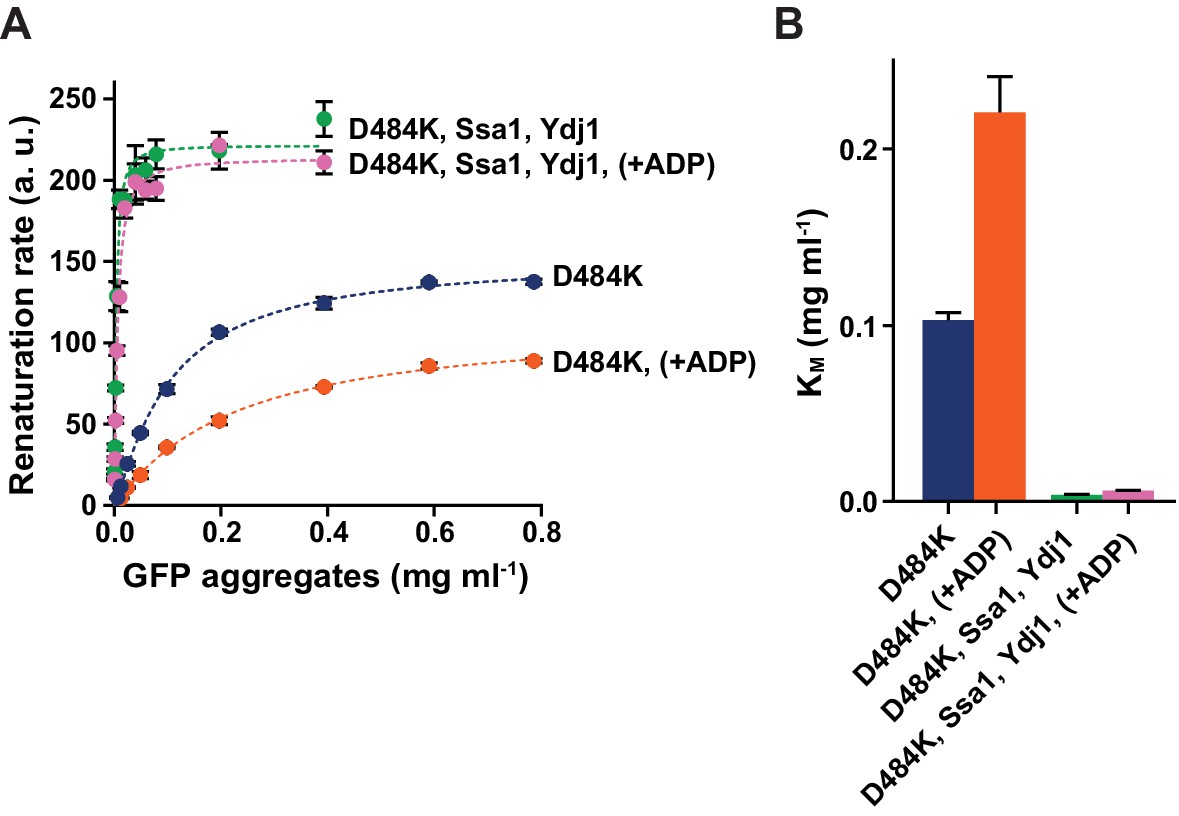
Hsp70 supports Hsp104 in disaggregation, compensating the effect of ADP.
(A) The opposing effects of ADP and Hsp70 on Hsp104 affinity towards aggregates. Disaggregation of heat-aggregated GFP present at different concentrations by Hsp104 D484K variant (0.06 μM) was assessed at 10 mM ATP, with or without ADP (1 mM), in the presence or absence of Ssa1 (2 μM) and Ydj1 (0.5 μM), as indicated in the legend. The initial rate of recovery of GFP fluorescence was plotted against GFP concentration. Data are the means of three measurements (± SD). Dashed lines represent Michaelis-Menten curves fitted to each set of experimental data using least squares fitting with the GraphPrism software. a. u. – arbitrary units. (B) Apparent KM values calculated for each experiment described in (A). Values are average of three experiments (± SD).
Figure 5 with 3 supplements
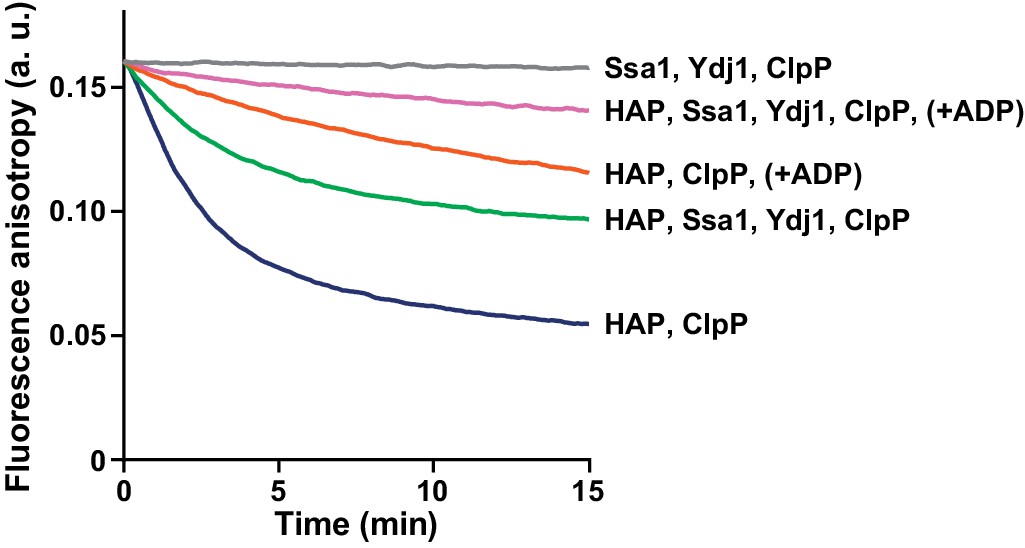
Hsp70 does not support Hsp104 in processing of disordered, non-aggregated proteins.
Proteolysis of fRCMLa (5 μM) by HAP (1 μM) and ClpP (1.8 μM), carried out at 2.6 mM ATP with or without 1 mM ADP and in the presence or absence of Ssa1 (2 μM) and Ydj1 (0.5 μM), as indicated. Grey line shows a control experiment, in which HAP was omitted. a. u. – arbitrary units.
Figure 5—figure supplement 1
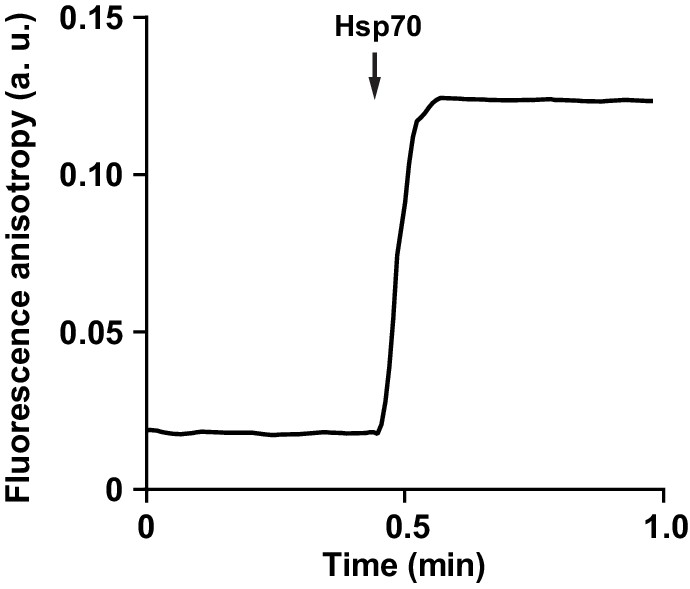
Hsp70 interaction with fRCMLa.
Ssa1 (2 μM) and Ydj1 (0.5 μM) were injected to the reaction mixture containing fRCMLa (5 μM) at 2.6 mM ATP. Complex formation was monitored by following fluorescence anisotropy. a. u. – arbitrary units.
Figure 5—figure supplement 2
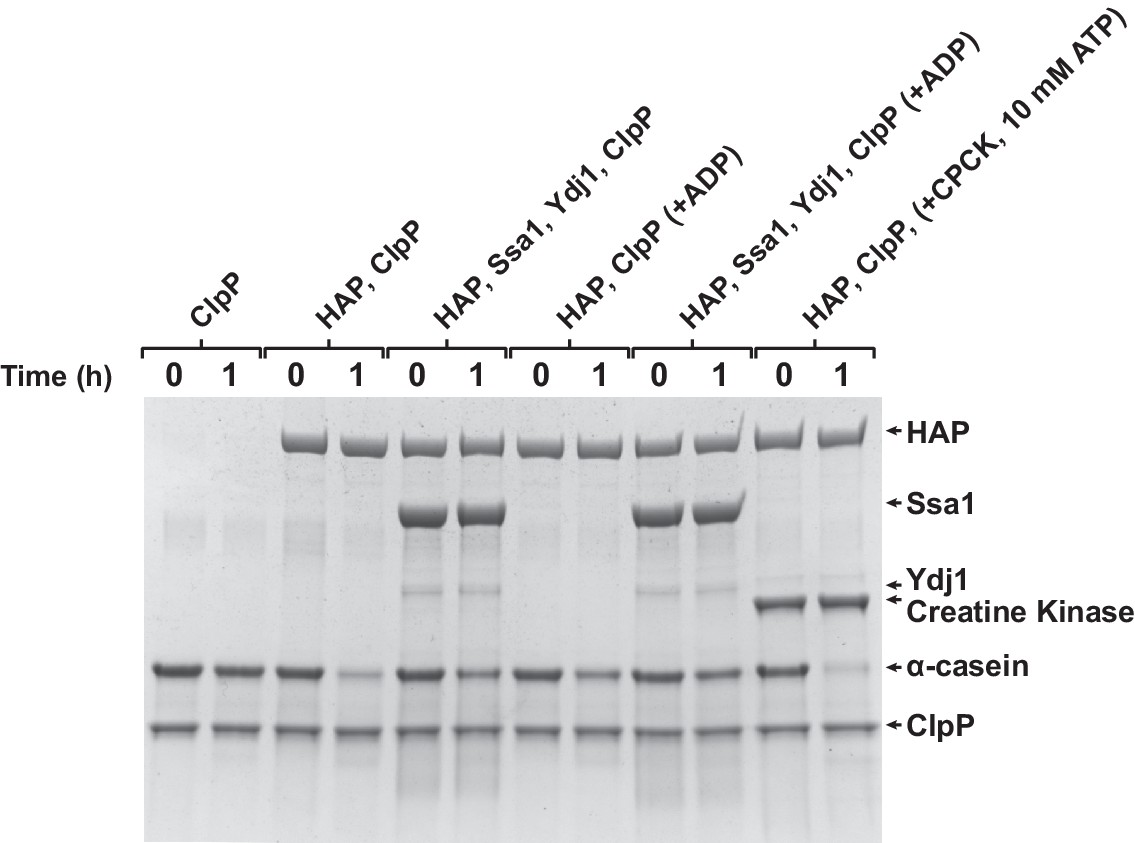
Hsp70 does not support Hsp104 in processing of α-casein.
α-casein (20 μM) was incubated with HAP (1 μM) and ClpP (3.6 μM) at 2.6 mM ATP in the presence of, optionally, 1 mM ADP, 2 μM Ssa1 and 0.5 μM Ydj1, as indicated, or at 10 mM ATP with an ATP regeneration system comprising 0.2 mg ml-1 creatine kinase and 20 mM creatine phosphate (two last lines). In a control experiment α-casein was incubated with ClpP only (two first lines). Proteolysis of α-casein was assessed after 1 hour with SDS-PAGE.
Figure 5—figure supplement 3
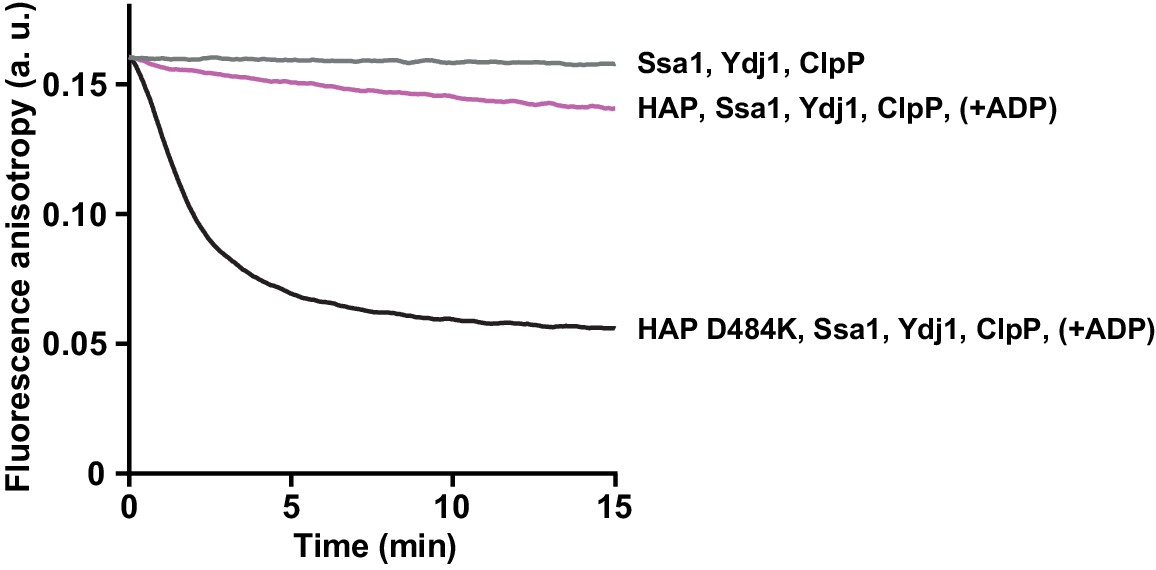
Derepressed HAP D484K is efficient in translocation of disordered proteins at the physiological ATP and ADP concentrations.
fRCMLa (5 μM) proteolysis by HAP (1 μM) or HAP D484K (1 μM) and ClpP (1.8 μM), was carried out at 2.6 mM ATP and 1 mM ADP and in the presence of the Hsp70 chaperone system comprising Ssa1 (2 μM) and Ydj1 (0.5 μM). In a control experiment HAP was omitted (grey).
Figure 6 with 1 supplement
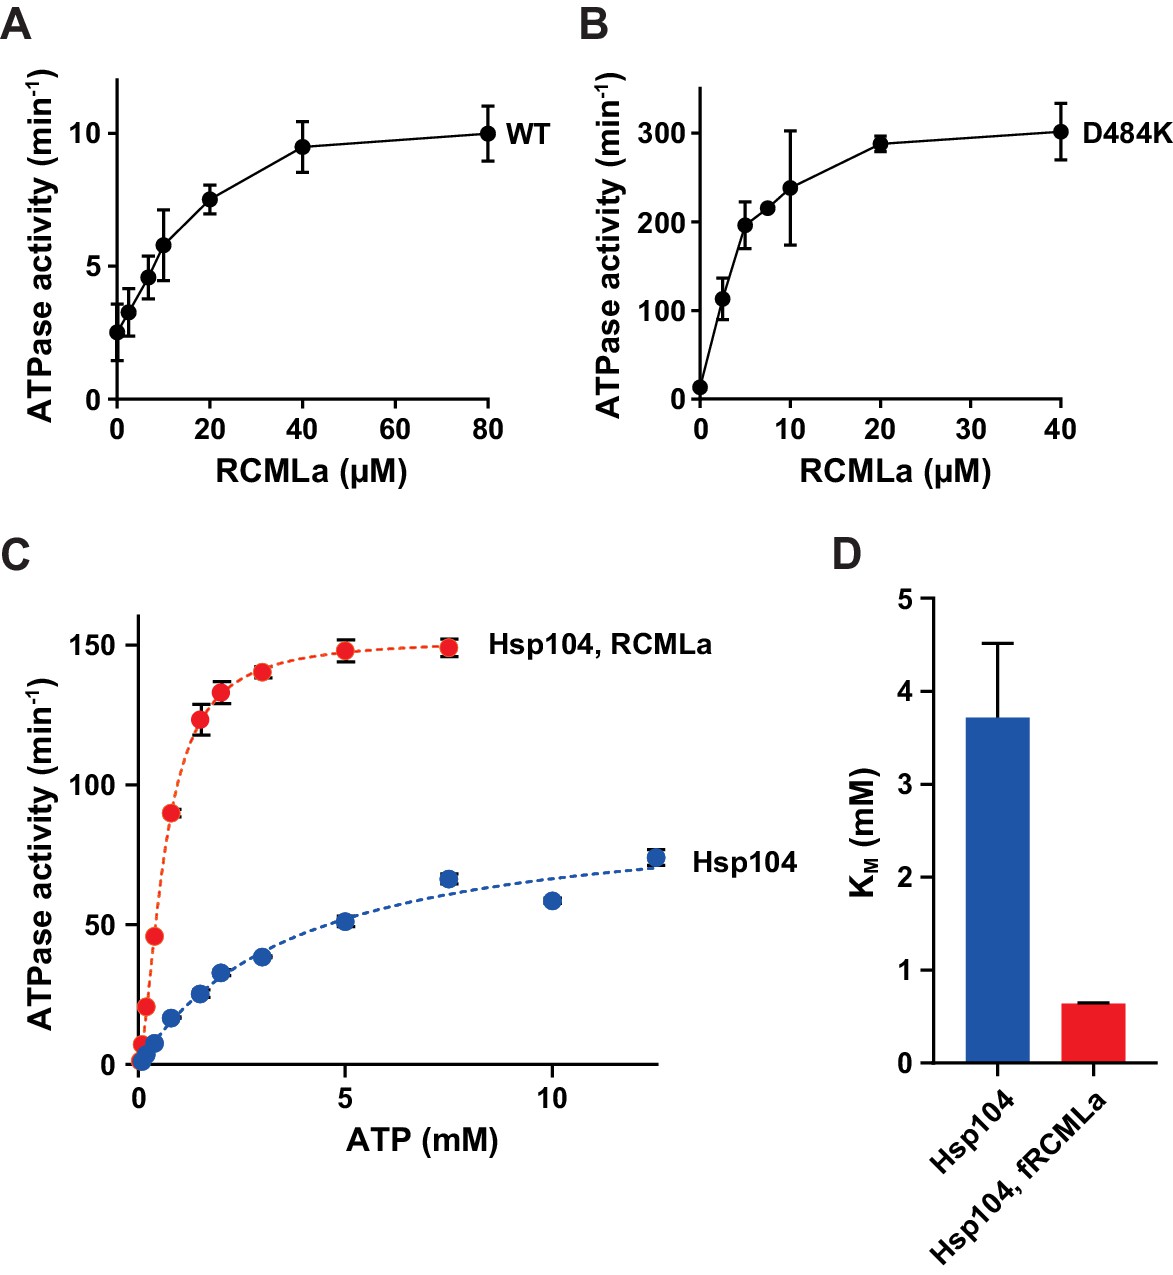
ADP inhibition is released during protein translocation by Hsp104.
Protein substrate allows efficient ATP hydrolysis at the physiological concentrations of adenine nucleotides. ATPase activity measured for (A) Hsp104 or (B) Hsp104 D484K variant incubated with different concentrations of RCMLa at 2.6 mM ATP and 1 mM ADP. (C) Steady-state ATPase activity of Hsp104 plotted against ATP concentration in the presence (red) or absence (blue) of 50 μM RCMLa. Dashed lines show Michaelis-Menten curves fitted to the experimental data. (D) Apparent KM values calculated for the experiments presented in (C). Data represent the mean of three experiments (± SD).
Figure 6—figure supplement 1
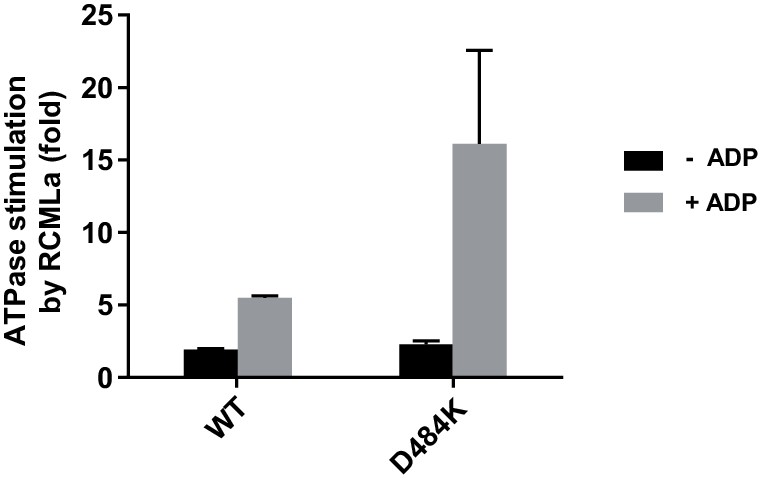
Impact of fRCMLa on ATP hydrolysis by Hsp104 is stronger in the presence of ADP.
Fold stimulation of the ATPase activity of Hsp104 WT and D484K proteins by the excess of RCMLa (100 μM). Measurements were carried out at 2.6 mM ATP in the presence (black) or absence of 1 mM ADP (grey). Data represent the mean of three experiments (± SD).
Figure 7
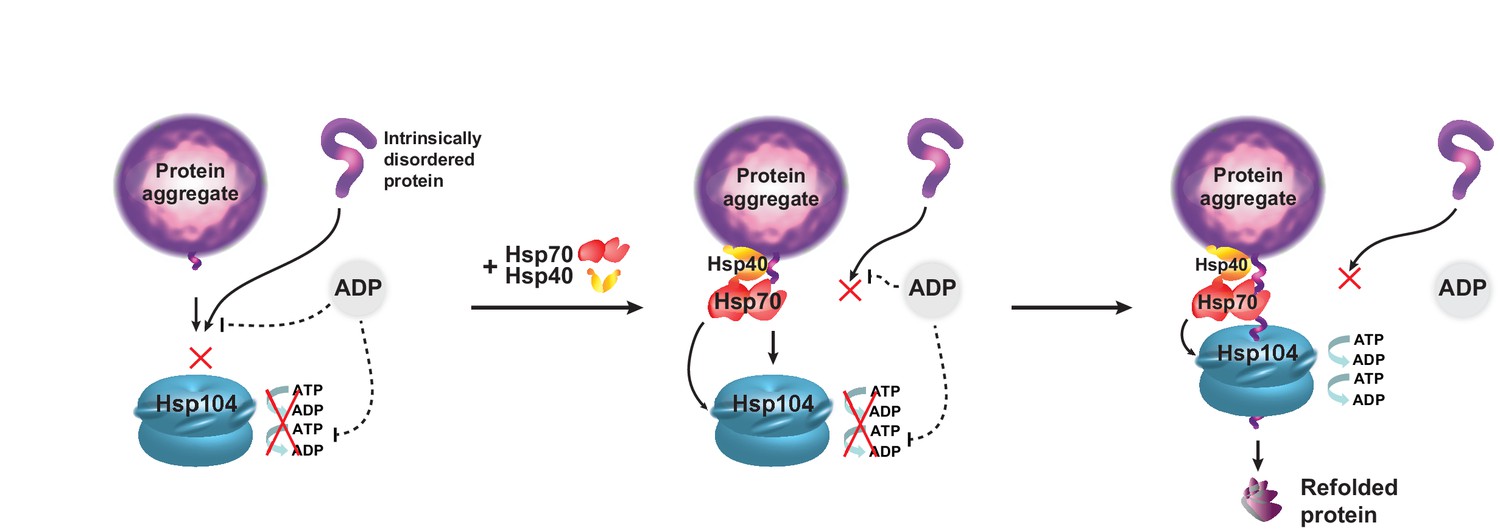
The mechanism of Hsp70-mediated Hsp104 activation in the presence of ADP.
The cellular level of ADP limits the ATPase activity and restricts Hsp104 interaction with protein substrates. Hsp70 promotes Hsp104 binding to aggregates, but not to intrinsically disordered proteins. When Hsp104 binds a polypeptide and translocation occurs, inhibition by ADP is overcome and the ATPase activity is restored.
Author response image 1
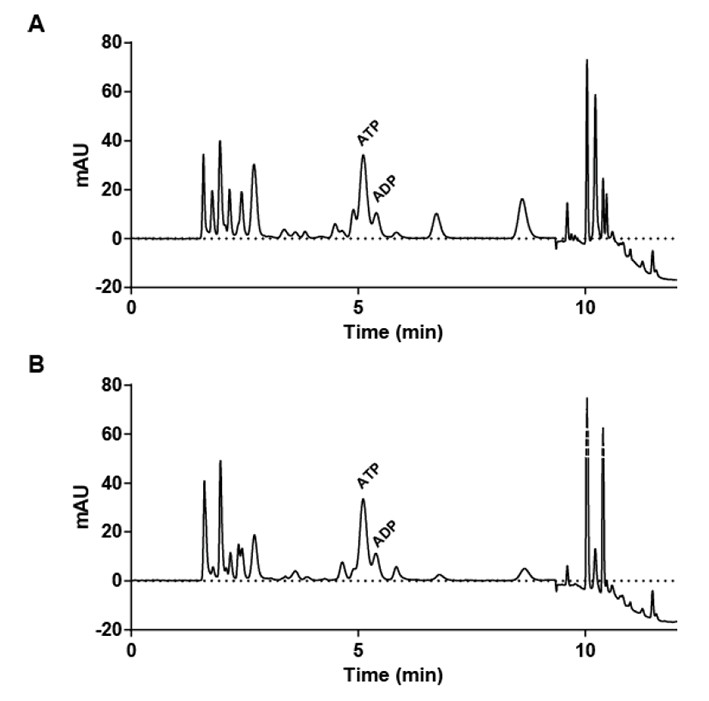
ATP:ADP ratio in yeast cell extracts.
Yeast cells (diploid strain X2180) were grown at 30°C to 1.4 * 108 cells ml-1 in YPD (A) or 0.7 * 108 cells ml-1 in YPGal medium (B). Cells were quickly harvested through centrifugation (5000 g, 1’), washed twice in distilled water and resuspended in 0.2 M perchloric acid (400 μl per 100 mg of wet weight). Cell lysis was performed by two series of freezing/thawing and the extracts were neutralized by adding potassium phosphate (3M) to the final pH 7. Extracts were centrifuged twice (10 000 g, 10’) and supernatant was analyzed using reversed-phase high performance liquid chromatography (RP-HPLC) according to (Smolenski et al, 1990) on GBC 1150 HPLC Pump, Spectra System AS3000 autosampler, Thermo Finnigan Spectra System UV6000LP. The separation was performed on 50 x 4,6 mm HyperClone 3u BDS C18, 130 A column (Phenomenex).
Tables
Author response table 1
ATP and ADP proportions in yeast.
Reference | ATP:ADP ratio | ATP (mM) | ADP (mM) | Growth conditions |
|---|---|---|---|---|
Theobald et al., 1997* | 7.1:1 | 3.36 | 0.47 | Glucose-limited |
Teusink et al., 2000* | 1.9:1 | 2.52 | 1.32 | Glucose excess |
Hynne et al., 2001* | 1.4:1 | 2.1 | 1.5 | Glucose excess |
Visser et al., 2004* | 3.7:1 | 2.65 | 0.72 | Glucose-limited |
Osorio et al., 2003 | 5.9:1 | 1.07 ± 0.08 | 0.18 ± 0.02 | Glucose excess |
Osorio et al., 2003 | 2.9:1 | 1.51 ± 0.32 | 0.52 ± 0.18 | Galactose excess |
Ozalp et al, 2010 | 2.6:1 | 2.6‡ | 1‡ | Glucose-limited |
This study† | 3.9:1 - 4.8:1 | – | – | Glucose excess |
This study† | 3.5:1 - 3.8:1 | – | – | Galactose excess |
-
*Adopted from Canelas et al. (2008).
-
†Each measurement was performed in two biological repeats (and samples from each biological repeat were analyzed twice). Representative result is shown in Author response image 1.
-
‡ Estimated, assuming total ATP and ADP concentration of 3.6 mM.
Download links
A two-part list of links to download the article, or parts of the article, in various formats.
Downloads (link to download the article as PDF)
Open citations (links to open the citations from this article in various online reference manager services)
Cite this article (links to download the citations from this article in formats compatible with various reference manager tools)
Adenosine diphosphate restricts the protein remodeling activity of the Hsp104 chaperone to Hsp70 assisted disaggregation
eLife 5:e15159.
https://doi.org/10.7554/eLife.15159


