Different promoter affinities account for specificity in MYC-dependent gene regulation
- Biocenter, University of Würzburg, Germany
- Max-Delbrück-Center for Molecular Medicine, Germany
- University of Würzburg, Germany
Figures
Figure 1 with 1 supplement
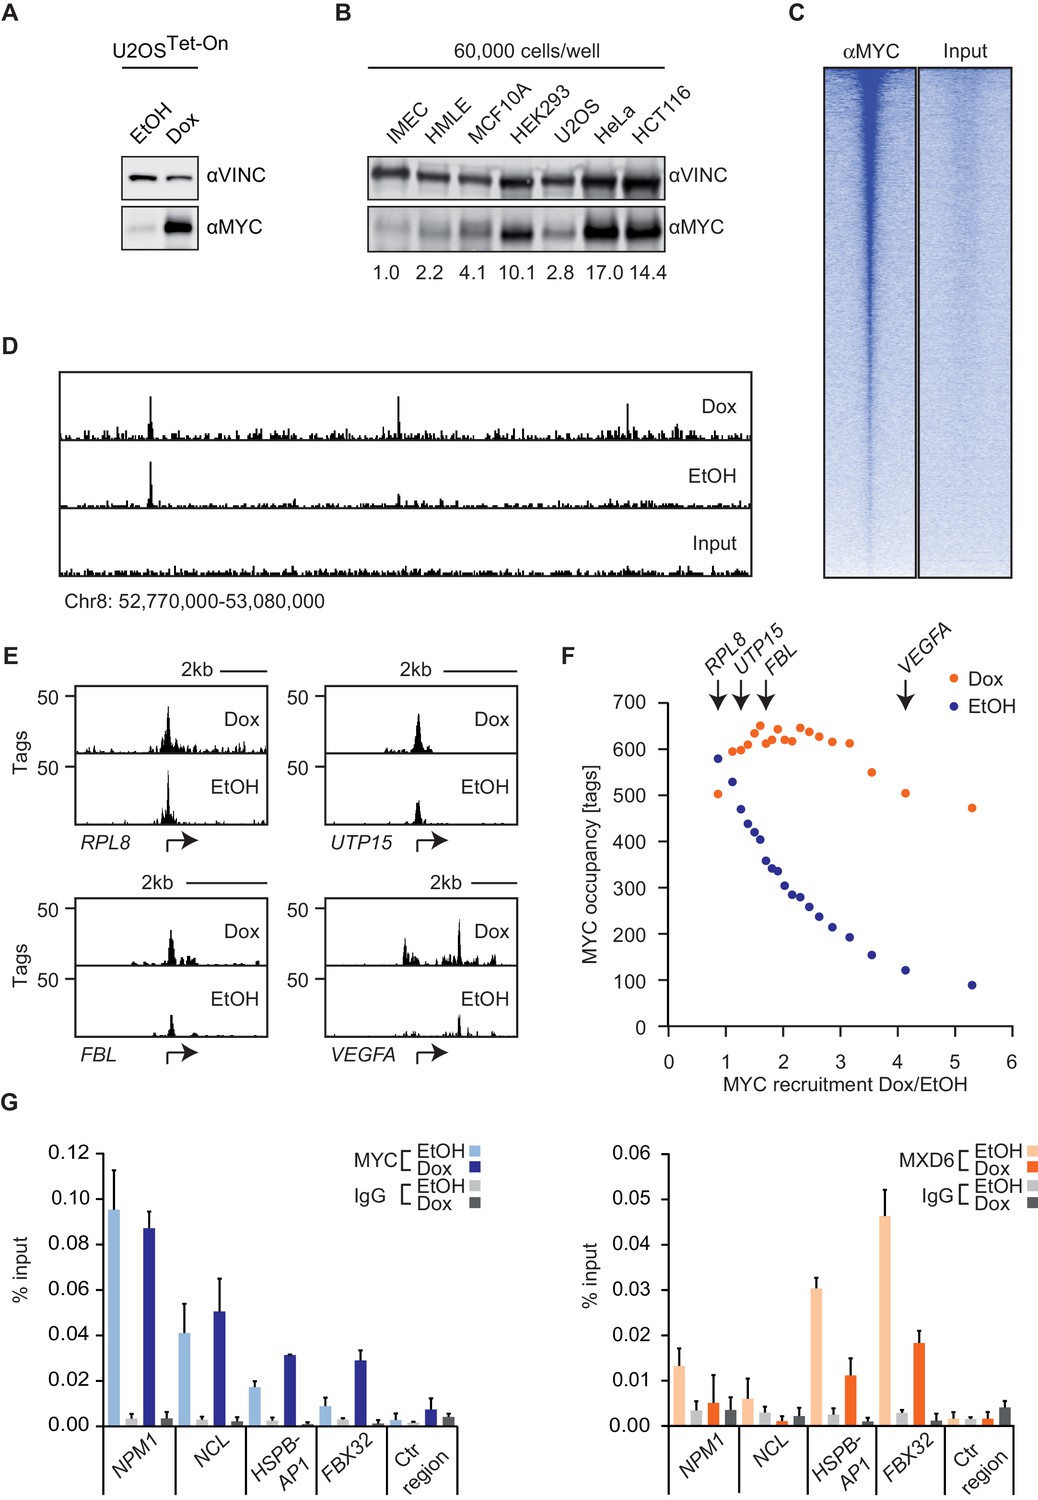
MYC saturates certain binding sites.
(A) Immunoblot of MYC and Vinculin in U2OSTet-On cells treated with EtOH or with 1 µg/ml of doxycycline. (B) Immunoblot of MYC and Vinculin in several transformed (U2OS, HeLa, HCT116) and untransformed cell lines (IMECs, HMLE, MCF10A, HEK293). For each sample, 60,000 cells were loaded. A quantification is shown at the bottom. (C) Heat maps for binding of endogenous MYC in U2OSTet-On cells to all UCSC annotated promoters in a window of 5 kb around the transcriptional start site (TSS). Input is shown as control and intensity of color indicates binding strength. (D) ChIP-sequencing traces of MYC for one genomic region as an example. Input is shown as control. (E) ChIP-sequencing traces of MYC for four bound genes. RPL8 is a ribosomal protein, UTP15 and FBL are ribosomal biogenesis factors and VEGFA takes part in cellular signaling. A scale bar is shown at the top of each browser picture. (F) Binned plot for the comparison of MYC recruitment (change in occupancy, x-axis) and MYC occupancy (y-axis) in U2OSTet-On cells expressing endogenous levels of MYC (EtOH, blue dots) or overexpressing MYC (Dox, orange dots). 8,425 genes bound by MYC upon treatment with doxycycline were sorted according to MYC recruitment and divided in 20 equally sized bins. Each dot represents the average value of the bin. The bins containing the genes shown in panel E are indicated. (G) Quantitative ChIP experiments for MYC (left panel) and MXD6 (right panel) at four MYC target genes and a control region. IgG were used as control. U2OSTet-On were treated either with EtOH or with 1 µg/ml doxycycline to induce exogenous MYC expression. Data are shown as mean ± standard deviation of technical triplicates.
Figure 1—figure supplement 1
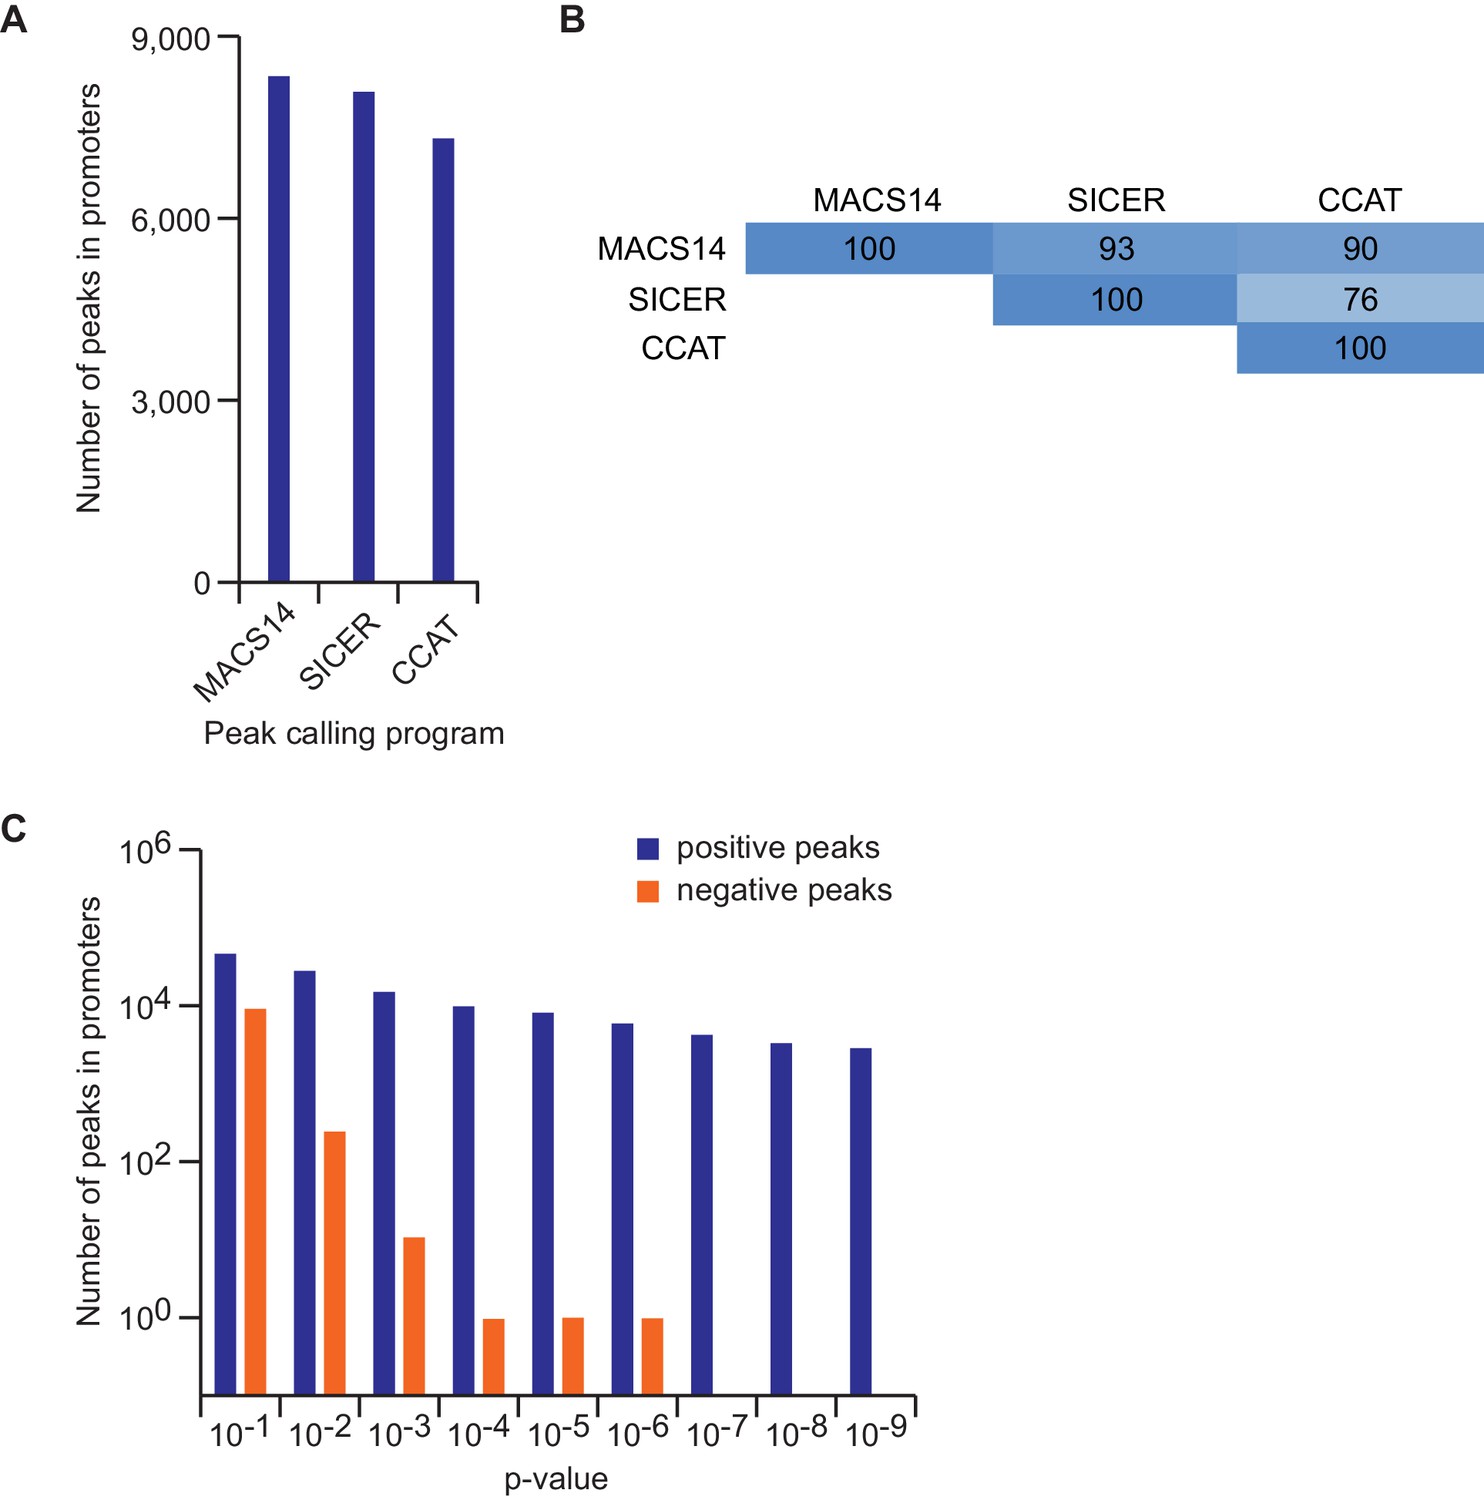
Effect of different peak calling programs and parameters on peak numbers.
(A) Number of peaks for endogenous MYC according to different peak calling programs at default parameters. (B) Percentage of overlapping MYC peaks called by different peak calling programs. Shown is the percentage of joint peaks relative to the dataset with the smaller number of total peaks. (C) Number of peaks for endogenous MYC according to different p-value adjustments in MACS14. The number of positive and negative peaks is shown with a logarithmic scale.
Figure 2 with 2 supplements
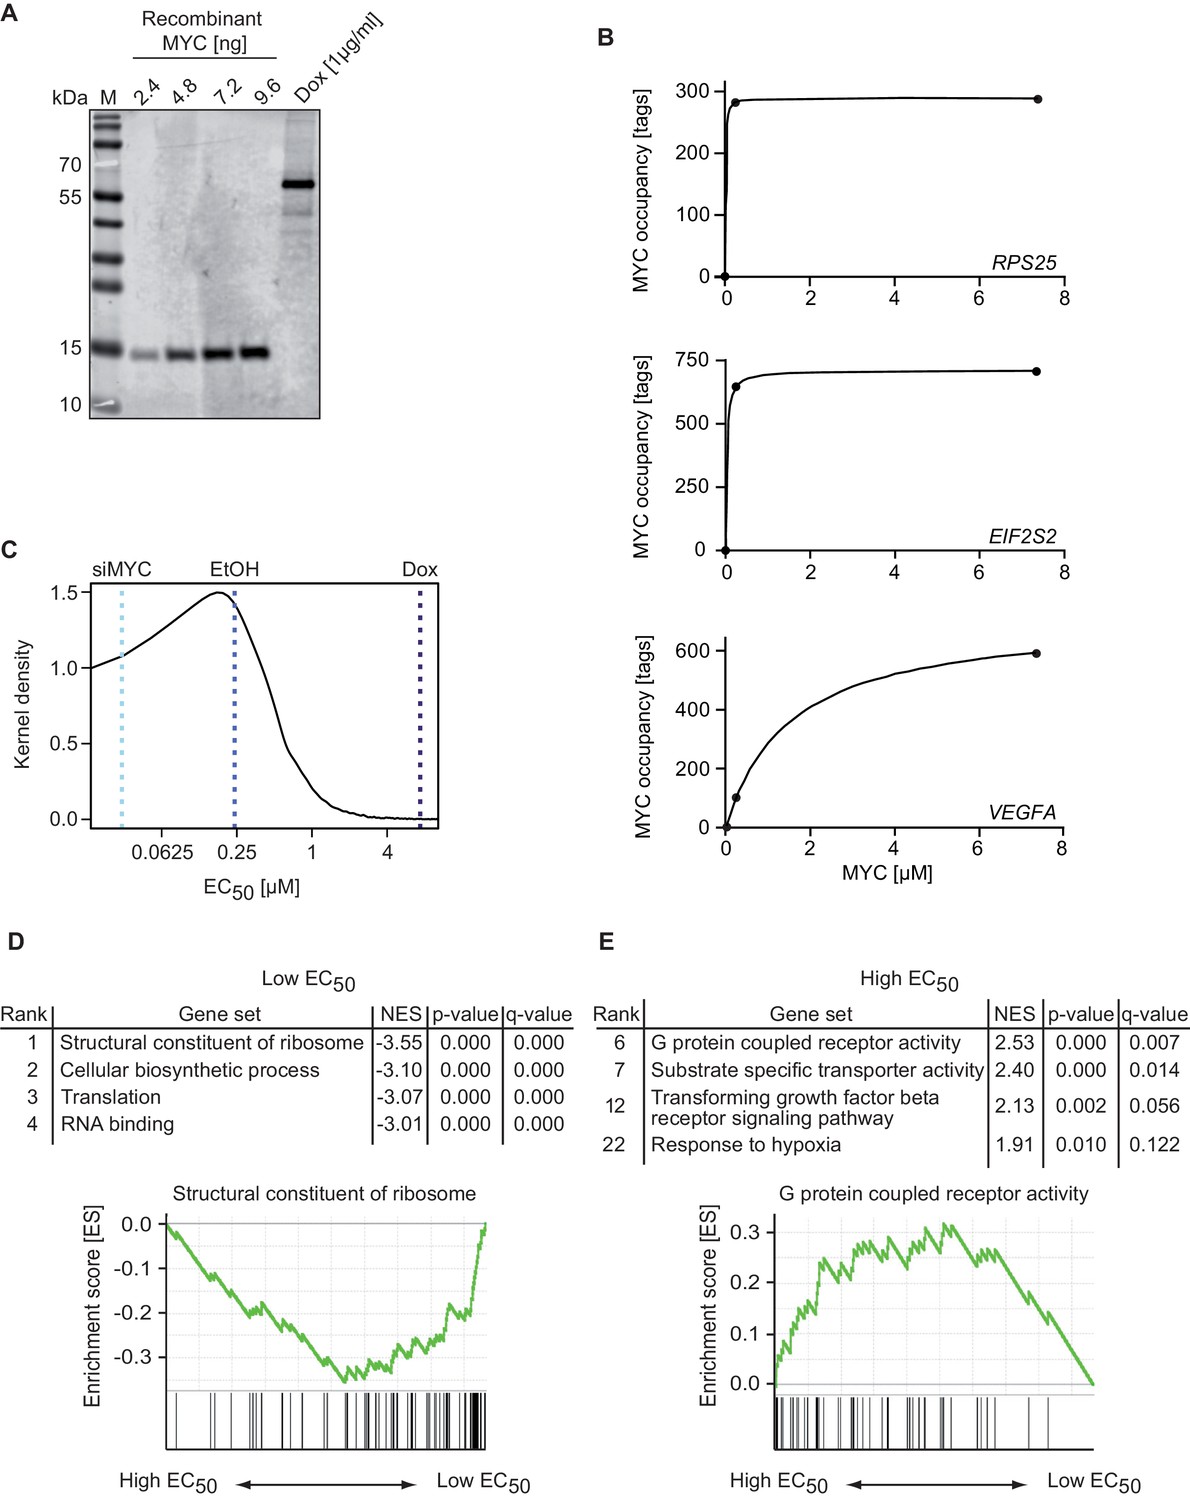
MYC binds with a wide range of affinity (EC50 values) to target genes.
(A) Immunoblot of MYC in U2OSTet-On cells treated with 1 µg/ml doxycycline and a recombinant MYC protein fragment, which was used for absolute quantification of cellular MYC levels (M: marker). Absolute quantification is based on biological triplicates shown in Figure 2—figure supplement 1D–F. (B) Diagram of MYC occupancy calculated in ChIP-sequencing experiments of EtOH- or doxycycline-treated U2OSTet-On cells (y-axis) versus the cellular MYC concentration (x-axis). The line was fitted using a Michaelis-Menten model and non-linear regression. (C) Density plot of the distribution of the EC50 values calculated for all MYC-bound genes. Dashed lines indicate the cellular MYC concentration in uninduced (EtOH, blue line), 1 µg/ml doxycycline treated (Dox, dark blue line), or MYC-depleted (siMYC, light blue) U2OSTet-On cells. (D, E) GSE analysis using the MSigDB C5 (GO gene sets) collection, of genes sorted according to EC50 values. Enrichment plots of two gene sets enriched in the GSE analysis are shown as examples. NES: normalized enrichment score. Both, gene sets with very low (D) and very high (E) EC50 values are shown.
Figure 2—figure supplement 1
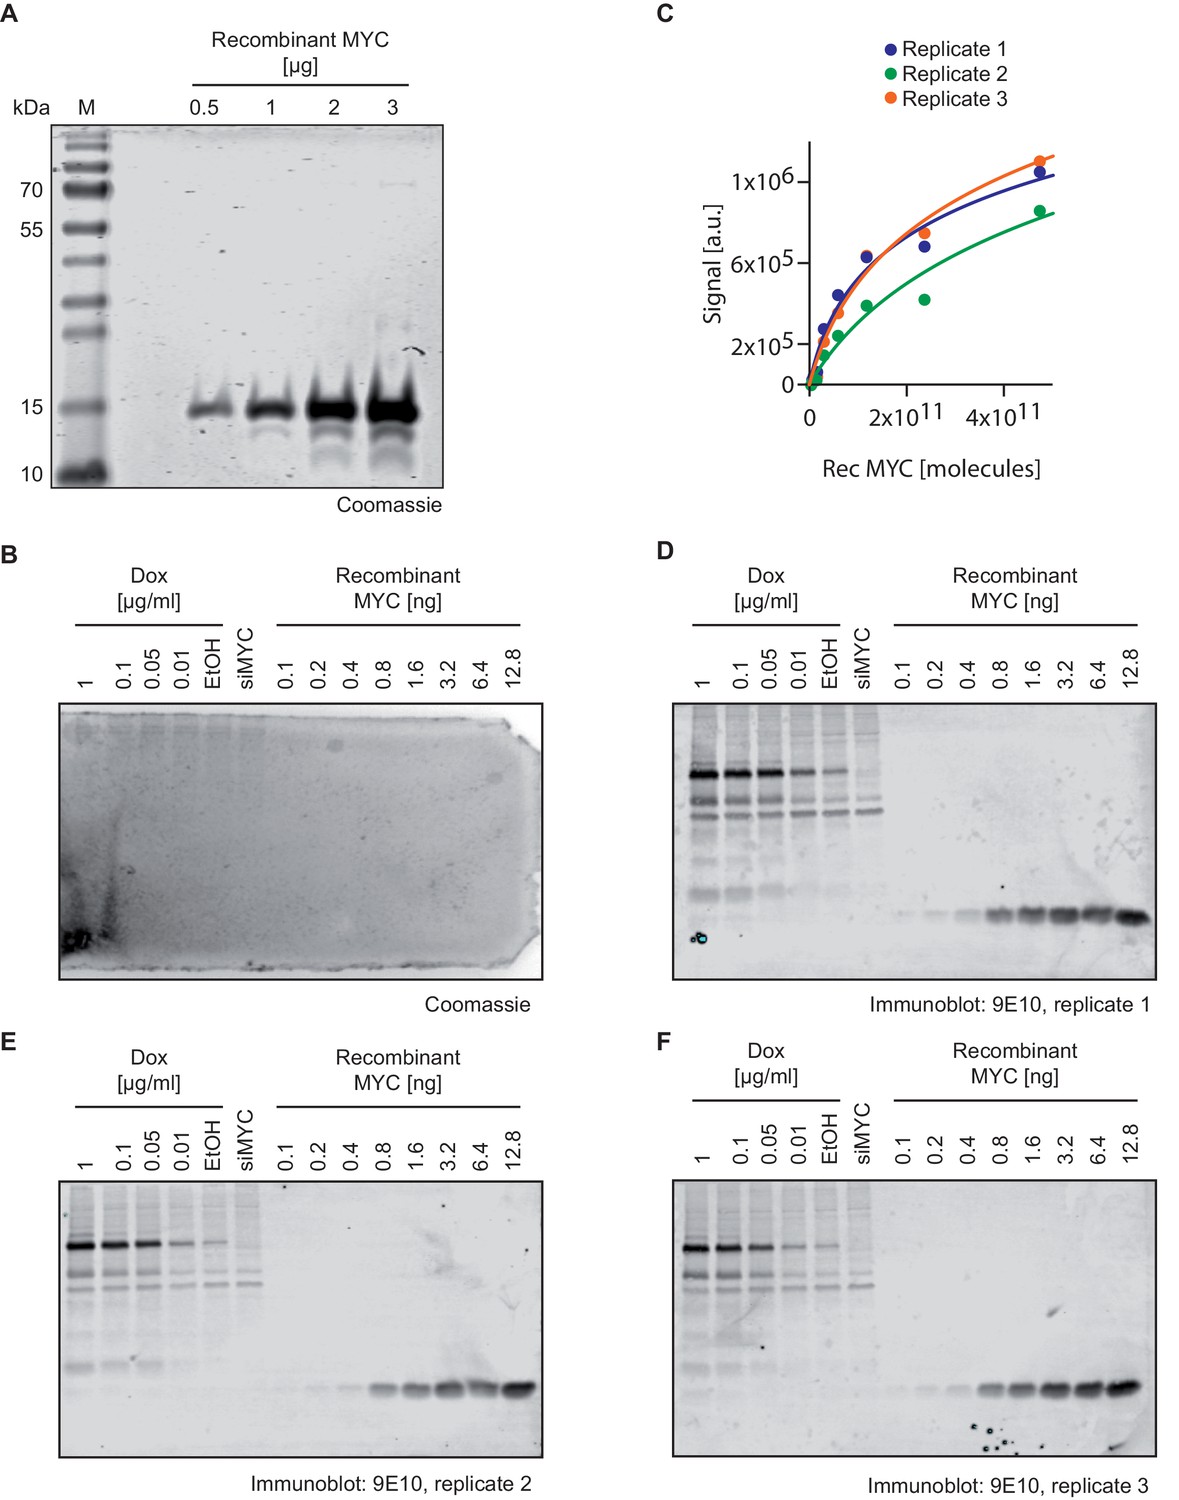
Quantification of MYC molecules per U2OS cell.
(A) Coomassie staining of the recombinant MYC fragment used to quantify cellular MYC levels documenting the purity of the protein. (B) Coomassie staining of a polyacrylamide gel after the transfer of protein to a PVDF membrane (used for immunostainings in one of the panels D–F) documenting complete transfer. (C) Plot showing the quantification of signals by recombinant MYC protein in relation its protein amount (D–F). Fitting curves were used for estimating cellular MYC concentrations (see numbers in Supplementary file 1). (D–F) Immunoblots of recombinant MYC protein and MYC in U2OSTet-On cells treated with different doxycycline concentrations, EtOH and a siRNA against MYC. The 9E10 antibody was used to detect both; recombinant and cellular MYC. Immunoblots were analyzed by fluorescence-based quantitative immunoblotting. The absolute cellular MYC levels were calculated as described in Supplementary file 1 based on triplicate experiments (M: marker).
Figure 2—figure supplement 2
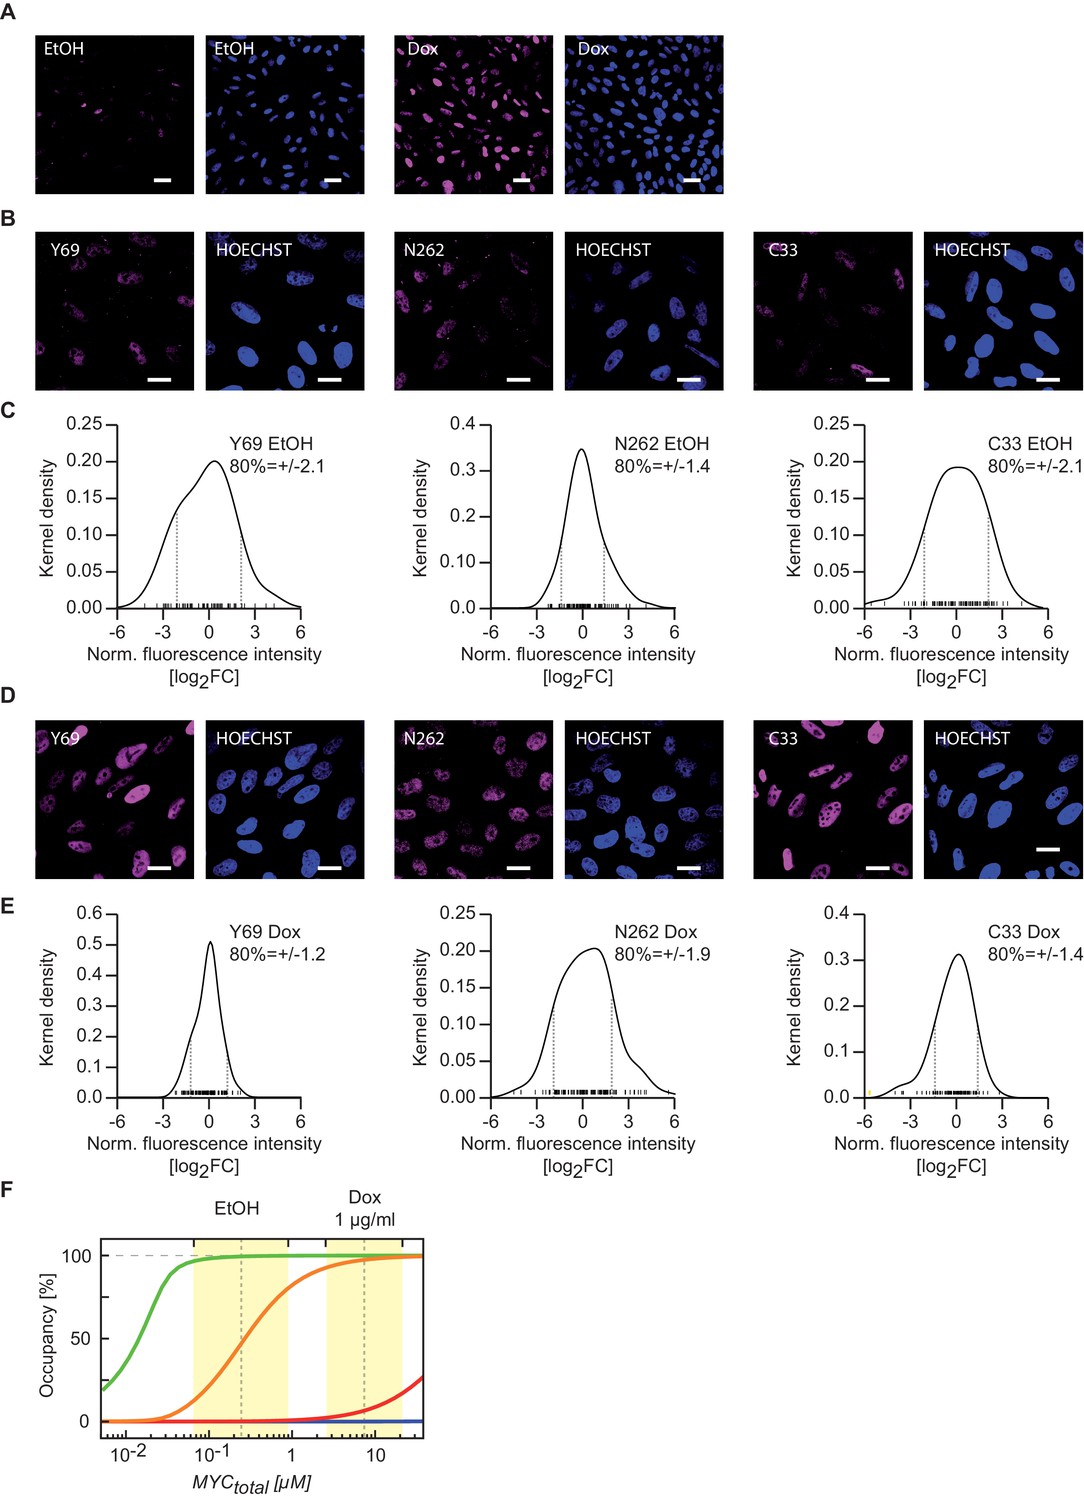
Variation of MYC levels within the cell population demonstrates validity of the model conclusions for the majority of cells.
(A) Confocal fluorescence showing the variation of MYC expression in U2OSTet-On cells treated with 1 µg/ml doxycycline and ethanol control. Images were taken under the same imaging conditions. The scale bar represents 20 µm (blue: HOECHST, violet: Y69). (B, D) Confocal fluorescence images showing the variation of MYC expression in U2OSTet-On cells treated with 1 µg/ml doxycycline (D) and ethanol (B). The scale bar represents 10 µm. (C, E) Kernel density plots showing the quantification of MYC staining as shown in B and D. Grey dashed line: log2FC value defining a region containing 80% of all cells, yellow bar: outlier. (F) Simulations as in Figure 3G, but yellow areas here indicate the fold variation of MYC expression in the cell population as calculated from panels (C) and (E).
Figure 3
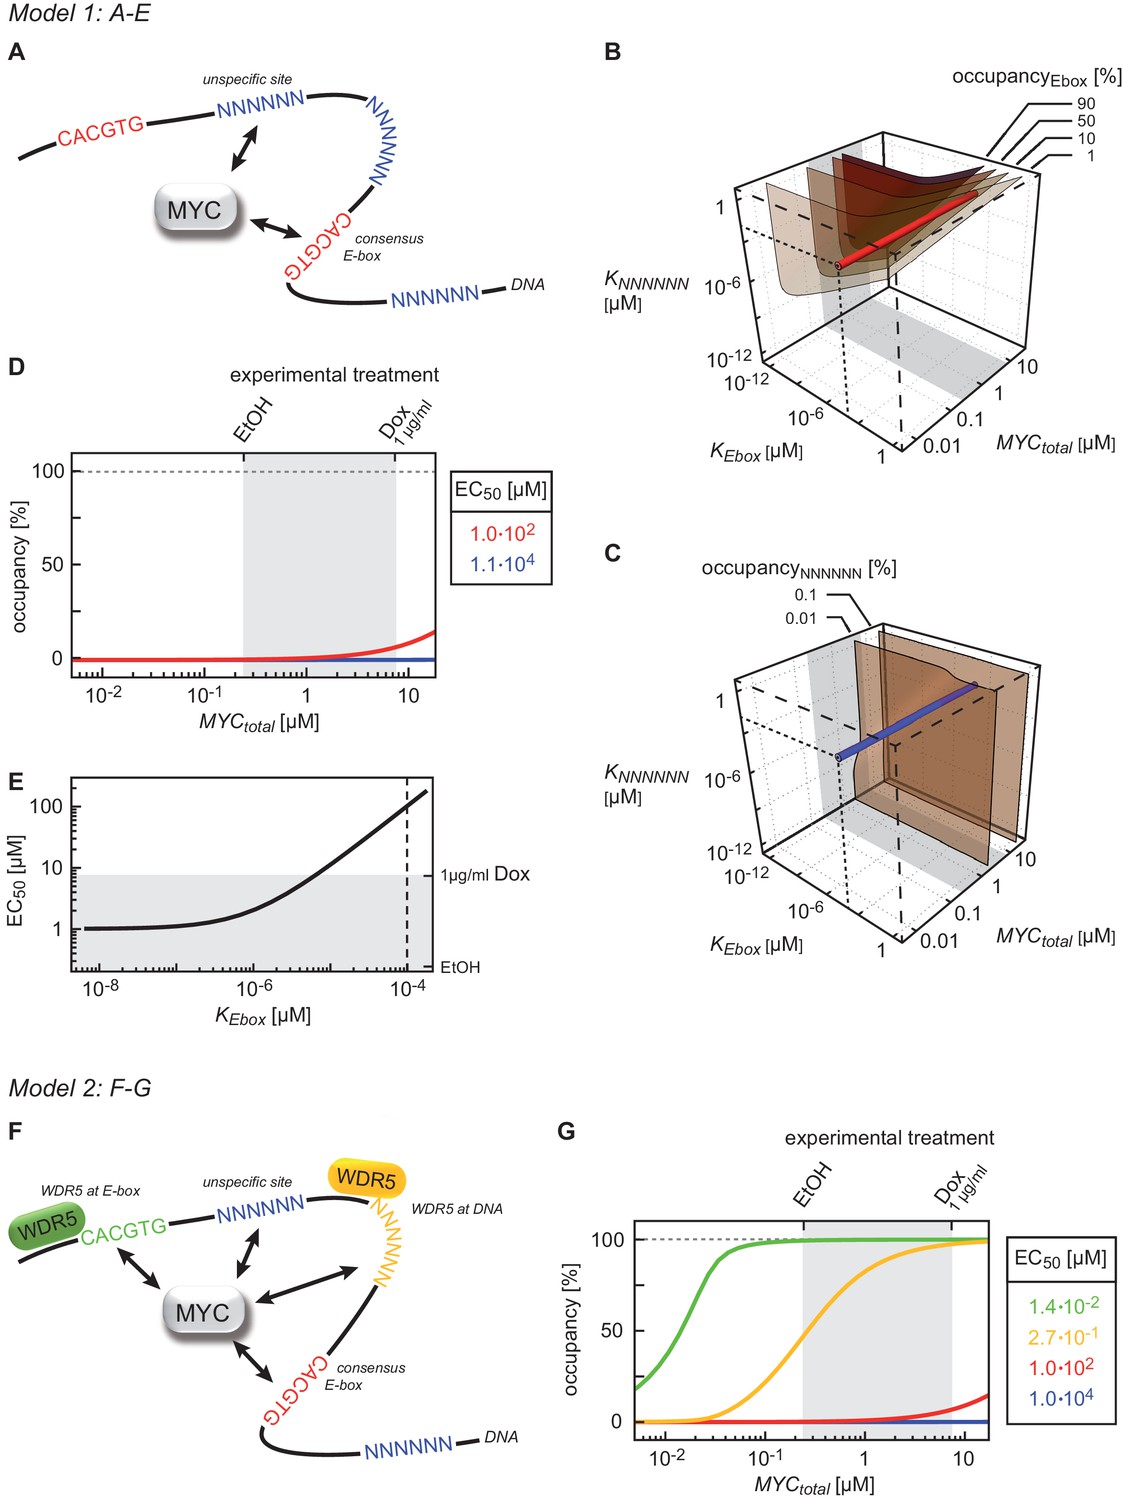
Binding behavior of MYC in U2OS cells analyzed by mathematical modeling.
(A) Schematic representation of model 1. For details see Appendix 1. (B, C) Plot illustrating regions of occupancy in the parameter space of dissociation constants KEbox and KNNNNNN as well as total amount of MYC. The grey area indicates the experimentally available concentration range, that is, EtOH to 1 µg/ml doxycycline (Dox) treatment. Regions of 1, 10, 50 and 90% occupancy of E-boxes (B) as well as 0.01% and 0.1% occupancy of NNNNNN sequences (C) are shown. The red line (B) and blue line (C) give the combination of the particular dissociation constants published by Guo et al. (2014). (D) Simulations show that occupancy of E-boxes (red line) by MYC is less than 10% in the measured range of MYC (grey area) while occupancy of NNNNNN (blue line) is below 1%. The EC50, which is the concentration of total MYC to obtain 50% occupancy, is calculated to be 1x10² μM for E-boxes. (E) The EC50 of E-boxes (1x10² μM estimated in D) can be reduced by decreasing the value of KEbox. Simulations predict that a reduction of KEbox (value published by Guo et al., 2014, is indicated by the dashed line) by about one order of magnitude already shifts the EC50 into the measured range of MYC (grey area). (F) Schematic representation of model 2. For details see Appendix 1. (G) In model 2, a reduction of the apparent dissociation constant of MYC and E-boxes as well as that of MYC and unspecific DNA sites are assumed by means of additional regulatory proteins such as WDR5. In the presence of WDR5, occupancy of E-boxes by MYC is above 95% (green line, EC50= 1.4x10⁻² μM) and occupancy of unspecific DNA sites by MYC is above 50% (yellow line, EC50 =2.7x10⁻¹ μM). Occupancy of E-boxes or unspecific DNA sites that are not bound by WDR5 (red and blue line, respectively) remain however below 10% and 1%, respectively, in the measured range of MYC (grey area).
Figure 4 with 2 supplements
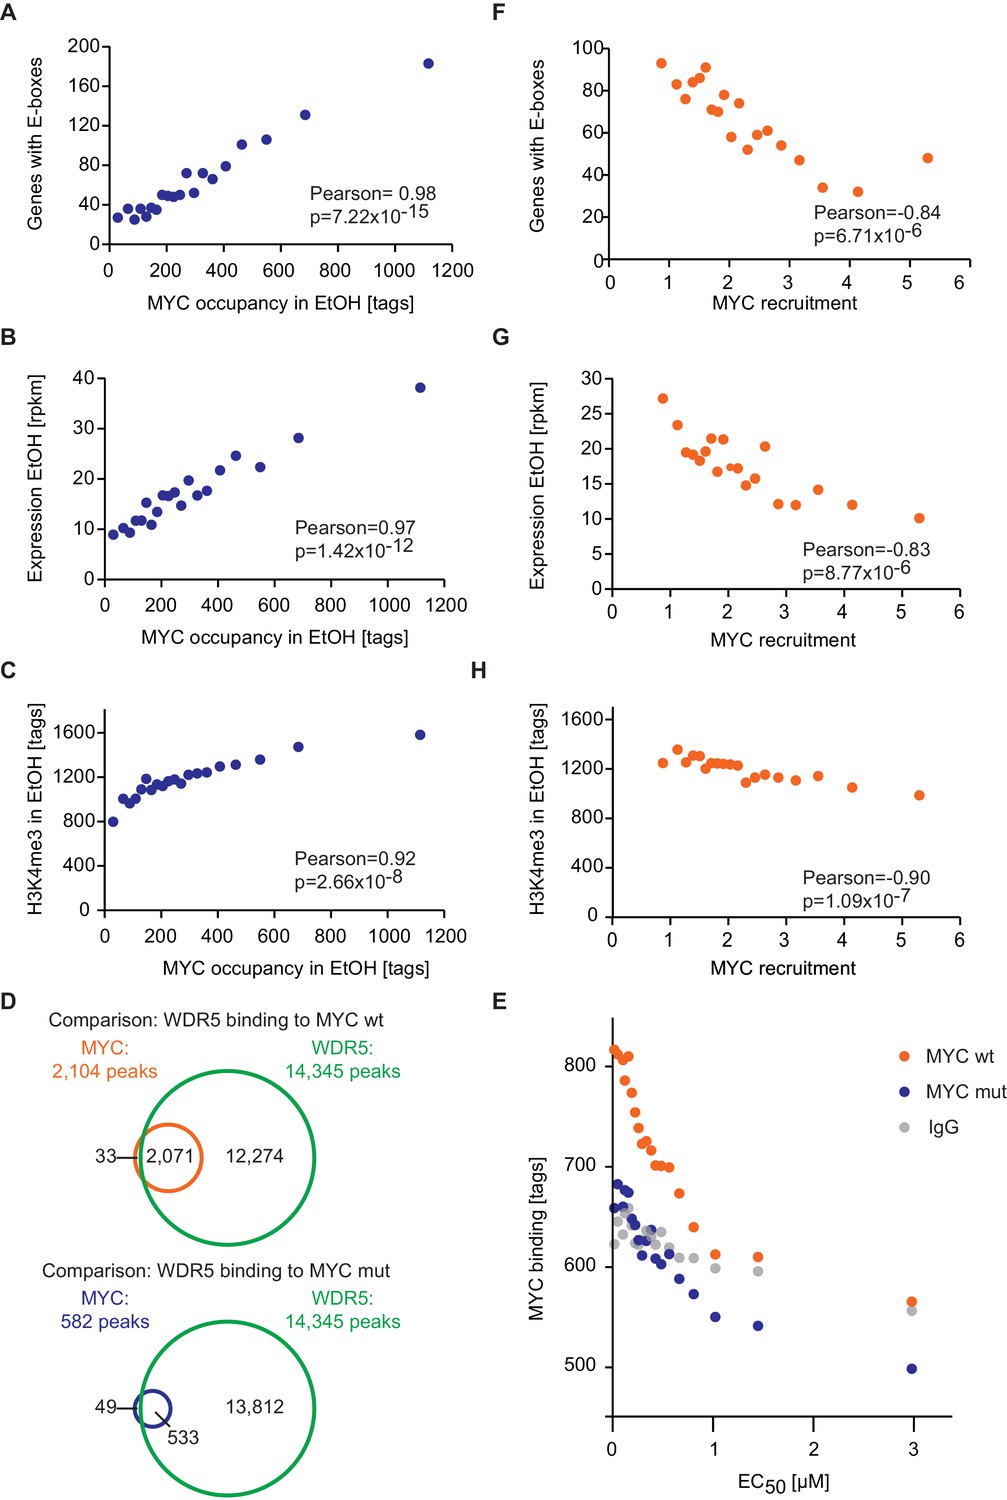
E-box occurrence, expression level and chromatin status of target genes influence MYC binding.
(A) Binned plot for the number of genes in each bin with a canonical E-box (CACGTG) in the MYC peak versus MYC occupancy in U2OSTet-On treated with EtOH. Genes were sorted according to MYC occupancy and divided into 20 bins. Each dot represents the average of 422 genes. (B) Binned plot as in A, but with the mRNA expression of the respective gene. Reads per kilobase per million (rpkm) are shown on the y-axis. (C) Binned plot as in A, but with H3K4me3 status of the respective gene. (D) Venn diagram displaying the promoter-close (+/− 5 kb) binding site overlap of WDR5, wild-type MYC (top), and a MYC mutant, which is compromised in binding to WDR5 ('MYC mut', bottom). Both, wild-type and mutant MYC were fused to a Flag epitope and stably expressed in HEK293 cells by Thomas et al. (2015). (E) Binned plot for MYC binding vs EC50 values. Genes bound by MYC in U2OS cells were sorted according to their EC50 values and correlated to average occupancy of a MYC mutant compromised in binding to WDR5 (blue dots) or wildtype MYC (orange dots). Values for IgG are shown as a background control (grey dots). Panel D and E are re-analyses based on published data (Thomas et al., 2015). (F) Binned plot for the number of genes in each bin having a canonical E-box (CACGTG) in the MYC peak versus MYC recruitment. Genes were sorted according to MYC recruitment and divided in 20 bins. Each bin represents 422 genes. (G) Binned plot as in F, but the mRNA expression of the respective gene. Reads per kilobase per million (rpkm) is shown on the y-axis. (H) Binned plot as in F, but H3K4me3 status of the respective gene was analyzed.
Figure 4—figure supplement 1
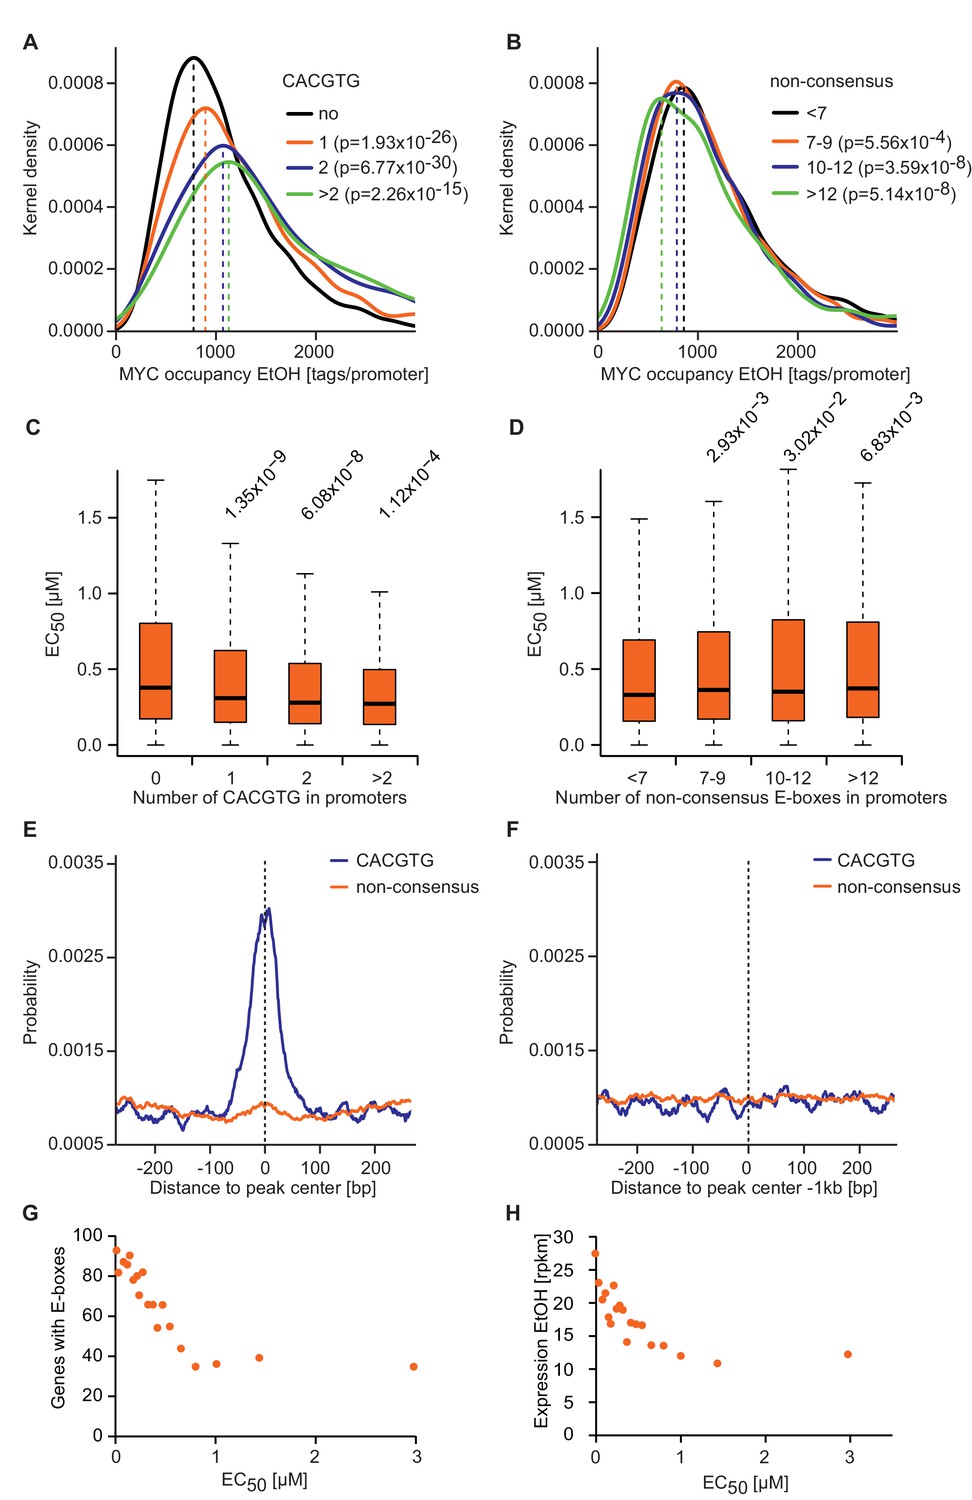
E-box occurrence and level of expression correlate with MYC binding and EC50 values.
(A, B) Gaussian kernel density estimate of endogenous MYC occupancy stratified by the number of consensus (A) or non-consensus (B) E-boxes in the promoter. p-Values were calculated with a two-sided Wilcoxon rank-sum test. (C, D) Boxplots showing EC50 values of promoters with different numbers of consensus (C) or non-consensus (D) E-boxes. p-Values were calculated with a two-sided Wilcoxon rank-sum test comparing promoters without E-boxes to the indicated group. Outliers are not shown. (E, F) Distribution of consensus and non-consensus E-boxes around the MYC peak center (E) in promoter-close peaks (doxycycline) and control regions 1 kb upstream (F). (G) Binned plot for the number of genes in each bin with a canonical E-box (CACGTG) in the MYC peaks versus the EC50 values for MYC binding. Genes were sorted according to their EC50 values and divided into 20 bins. Each dot represents the average of 417 genes. (H) Binned plot as in G, but the mRNA expression of the respective genes (rpkm: reads per kilobase per million) is shown in the y-axis.
Figure 4—figure supplement 2
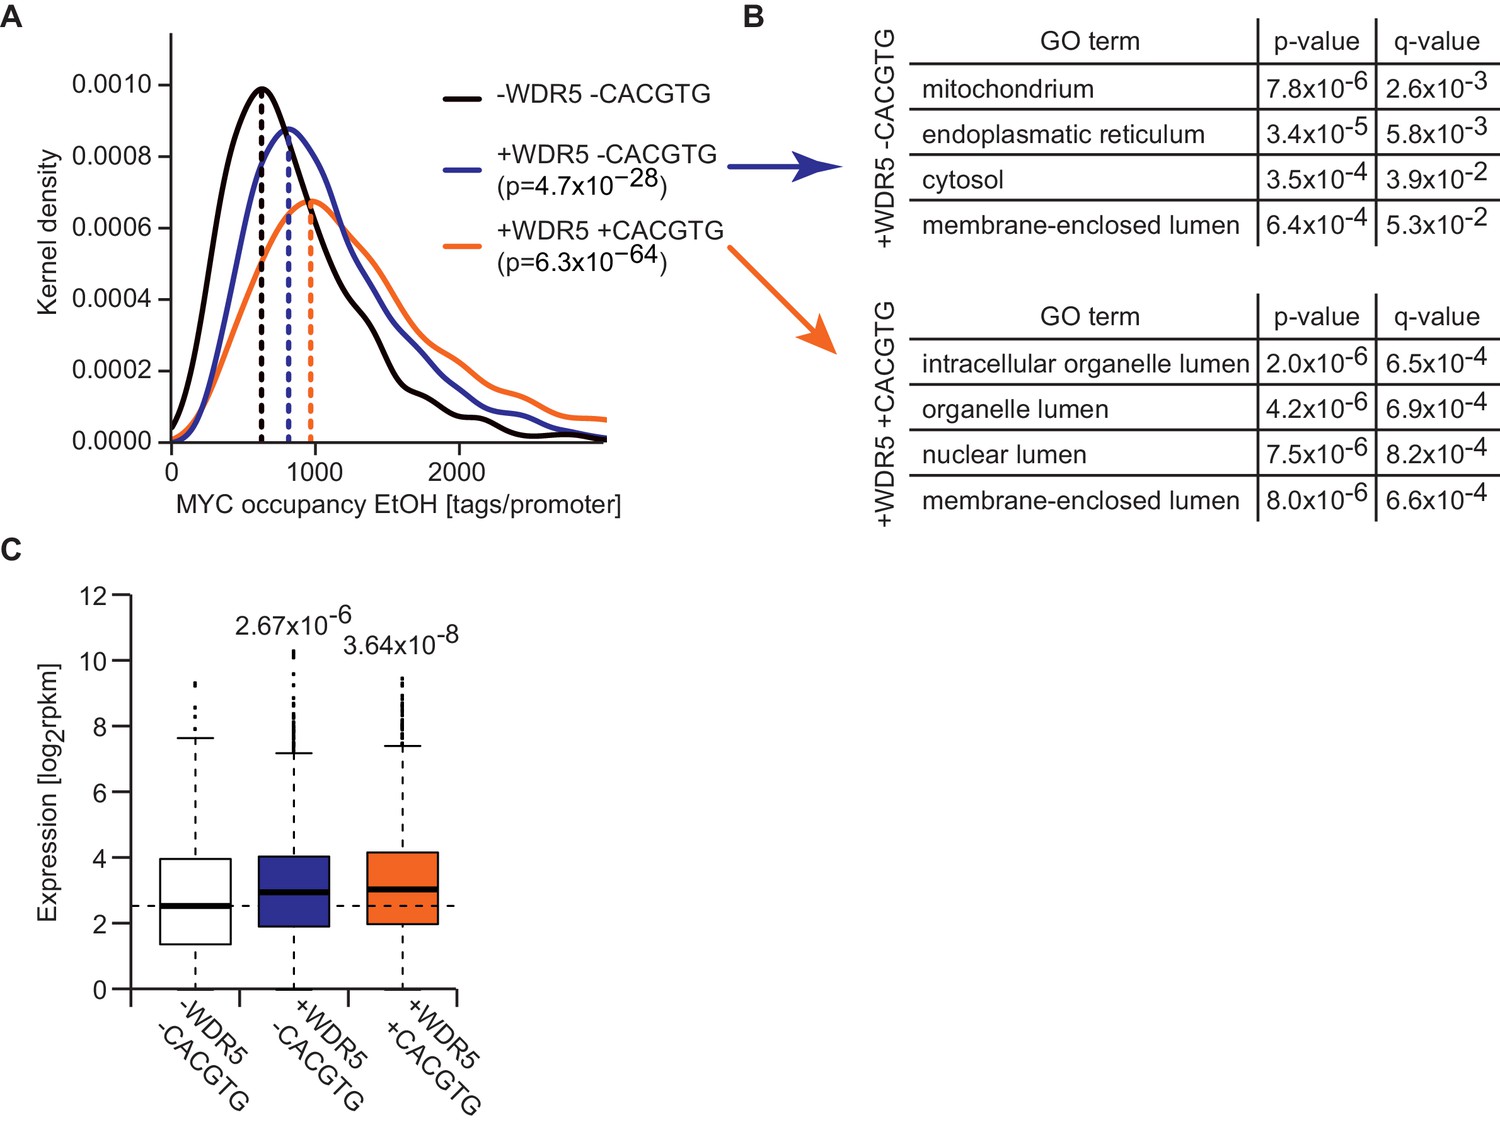
Promoters that are bound by WDR5 and contain E-boxes are most strongly occupied by MYC.
(A) Gaussian kernel density estimate of endogenous MYC occupancy stratified by the number of consensus E-boxes in concert with WDR5 peaks in the promoter. p-values were calculated with a two-sided Wilcoxon rank-sum test. (B) Gene ontology analysis of 400 randomly chosen genes with WDR5 peak and consensus E-box (bottom) or WDR5 peak but without E-box (top) in the promoter. For each class, the top four enriched GO terms are shown. q-values are calculated using a Benjamini-Höchberg correction for multiple testing. (C) Box plot showing expression level (rpkm: reads per kilobase per million) of MYC-bound genes with WDR5 peak and E-box (n =2,593), WDR5 peak without E-box (n =4,771) and MYC-bound genes with neither WDR5 peak nor E-box (n =699). p-Values were calculated with a two-sided Wilcoxon-rank sum test.
Figure 5 with 1 supplement
Promoter affinity for MYC stratifies functionally different gene sets.
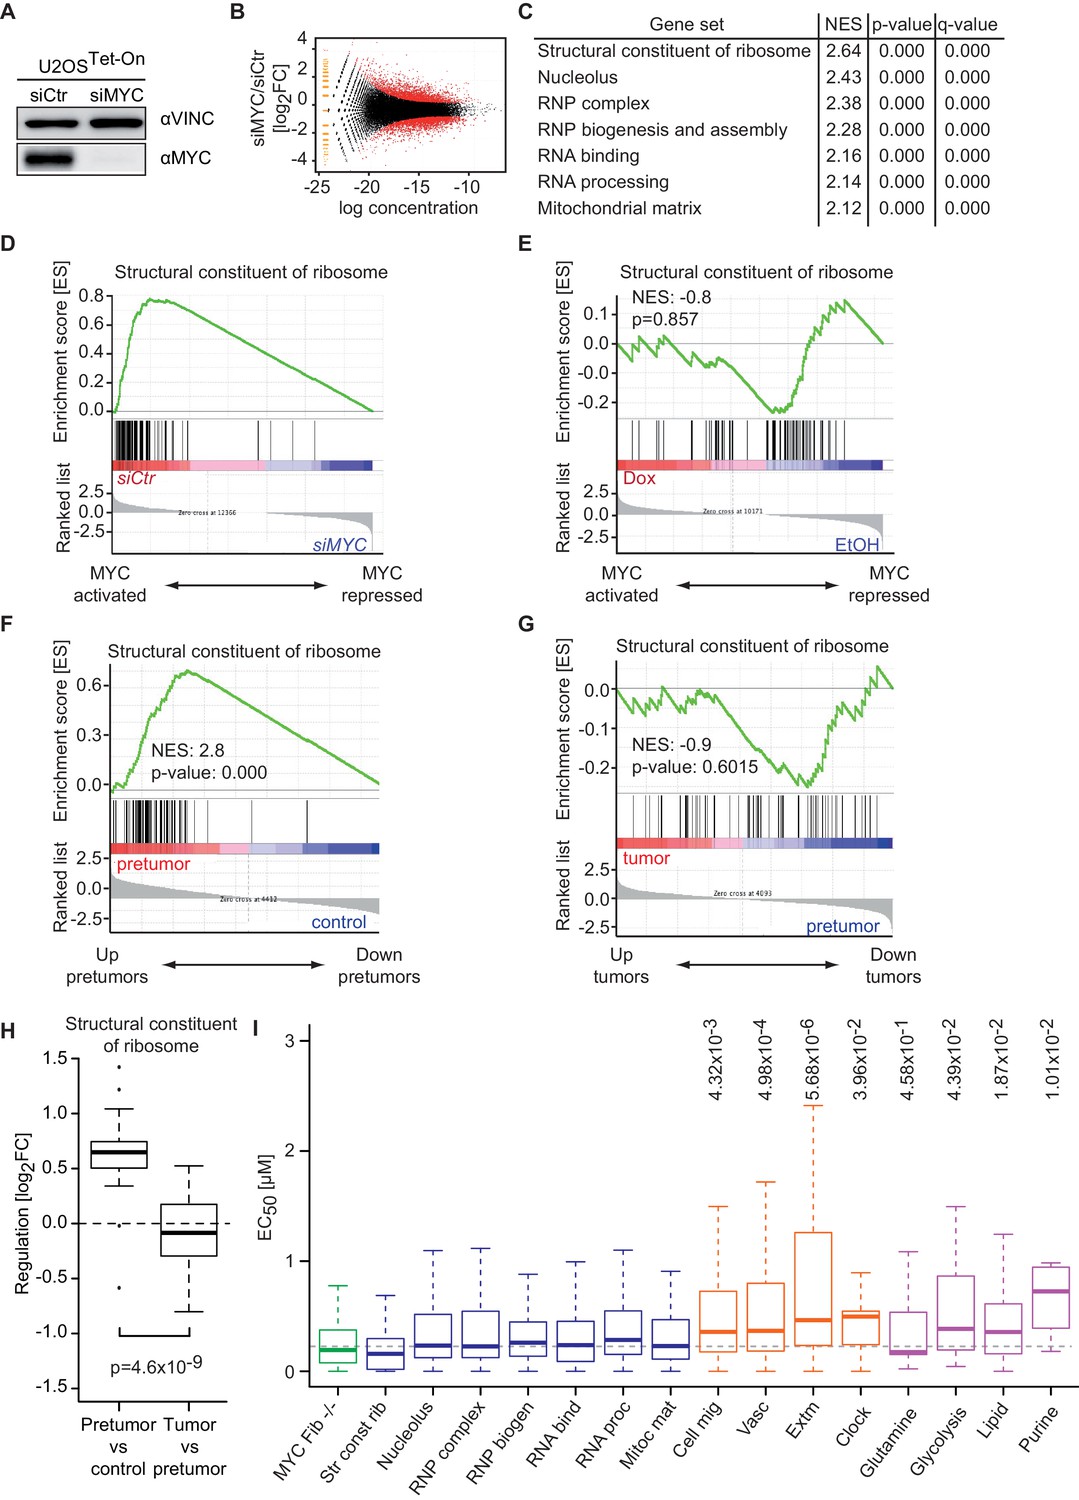
(A) Immunoblot of MYC upon transfection of U2OSTet-On cells with the indicated siRNA. Vinculin was used as loading control. (B) Plot for regulation of genes upon siRNA-mediated depletion of MYC vs relative expression levels (known as M/A-plot). Red dots represent significantly regulated genes (q-value <0.01, q-values were estimated by Benjamini-Hoechberg-corrected p-values calculated by EdgeR). The experiment was performed in biological triplicates. (C) GSE analysis comparing gene expression profiles of siCtr- or siMYC-transfected U2OSTet-On cells. NES: normalized enrichment score. (D) Enrichment plot of the 'Structural constituent of ribosome' gene set found in C upon depletion of endogenous MYC by siRNA. (E) Enrichment plot of the same gene set as in D, but gene expression profiles of U2OSTet-On cells uninduced (EtOH) or induced with 1 µg/ml doxycycline were used. (F-H) Gene expression analysis comparing the gene expression profile of a ribosomal gene set in the Eµ-MYC model of B cell lymphomagenesis in three different conditions. Differential expression is shown by GSE analysis comparing a pre-tumor condition to control condition (F) and a tumor condition to a pre-tumor condition (G) or by boxplots (H). Panel F to H are re-analyses of published B cell expression profiles (Sabò et al., 2014). (I) Boxplots of gene sets found in panel C (blue), genes regulated upon MYC knockout in fibroblasts (green) (Perna et al., 2012), gene sets regulated by MYC overexpression (orange) (Walz et al., 2014) and selected metabolic processes (violet). The y-axis shows EC50 values calculated as shown in Figure 2. p-values: One-sided Mann-Whitney-Wilcoxon test comparing the indicated GO terms to the median of 'RNP complex' (dashed line). Outliers not shown.
Figure 5—figure supplement 1
Changes in chromatin binding upon MYC depletion correlate with transcriptional responses.
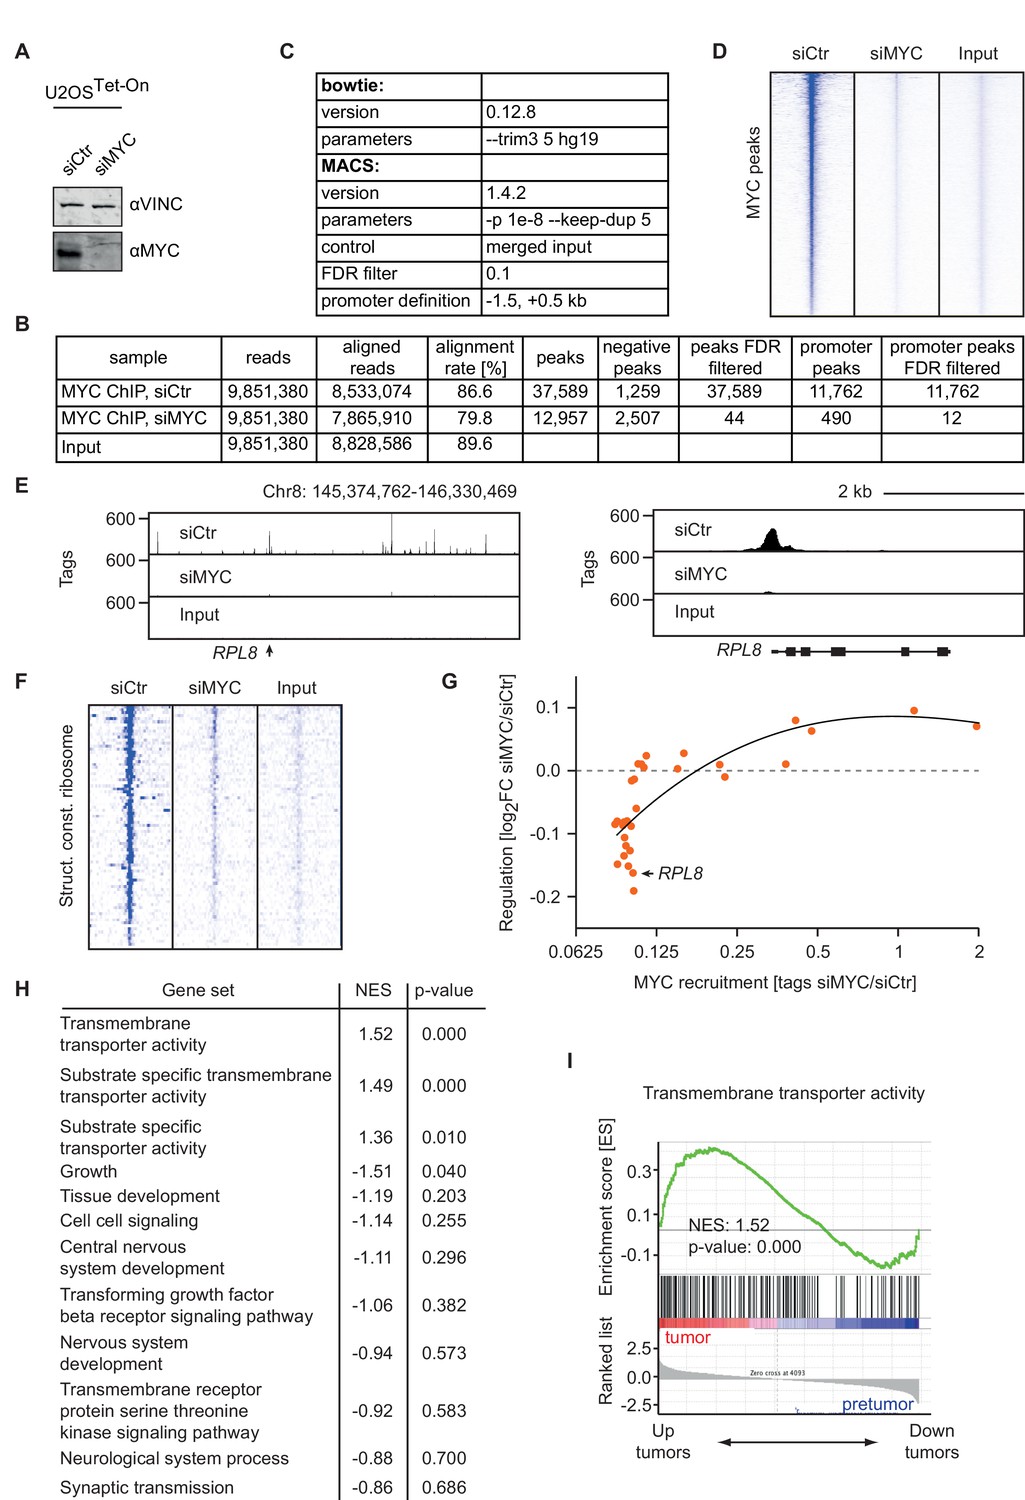
(A) Immunoblot of MYC in U2OSTet-On cells tranfected with siRNA targeting MYC and control siRNA. (B) Summary of MYC ChIP-sequencing results of MYC-depleted U2OSTet-On cells and control cells. (C) List of parameters used for alignment and peak calling in the ChIP-sequencing experiment. (D) Heat maps documenting binding of MYC in U2OSTet-On cells transfected with siRNA targeting MYC or control cells. A window of 5 kb around all MYC peaks is shown. Input is used as control and intensity of color indicates binding strength. (E) ChIP-sequencing traces for MYC of a large genomic region including the RPL8 gene (left). MYC binding to the RPL8 promoter is shown enlarged on the right side. (F) Heat maps documenting binding of MYC to the promoters of ribosomal protein genes (Structural constituent of ribosome: GO0003735, see list of genes in Supplementary file 2). (G) Binned plot for the comparison of MYC-mediated changes in gene expression (y-axis) in U2OSTet-On cells upon siRNA-mediated depletion of MYC versus MYC recruitment (change in occupancy, x-axis). MYC-bound genes were sorted by EC50 values and divided in 30 equally sized bins. Each dot represents the mean value of the bin. The bin containing the RPL8 gene shown in panel E is indicated. The black curve shows quadratic LOESS fitting. (H) Gene expression analysis in the Eµ-MYC model of B cell lymphomagenesis (Sabò et al., 2014) of biological processes with low affinity for MYC. Biological processes with low EC50 values (as in Figure 2E) were analyzed by gene set enrichment analysis. The normalized enrichment score (NES) indicates regulation of these gene sets between tumors (T) and pre-tumors (P) in the Eµ-MYC model as in U2OS cells (positive NES: MYC-activated processes, negative NES: MYC-repressed processes). (I) Enrichment plot of one gene set from H in the Eµ-MYC model (Sabò et al., 2014).
Figure 6
MYC levels determine the regulation of different transcriptional response programs.
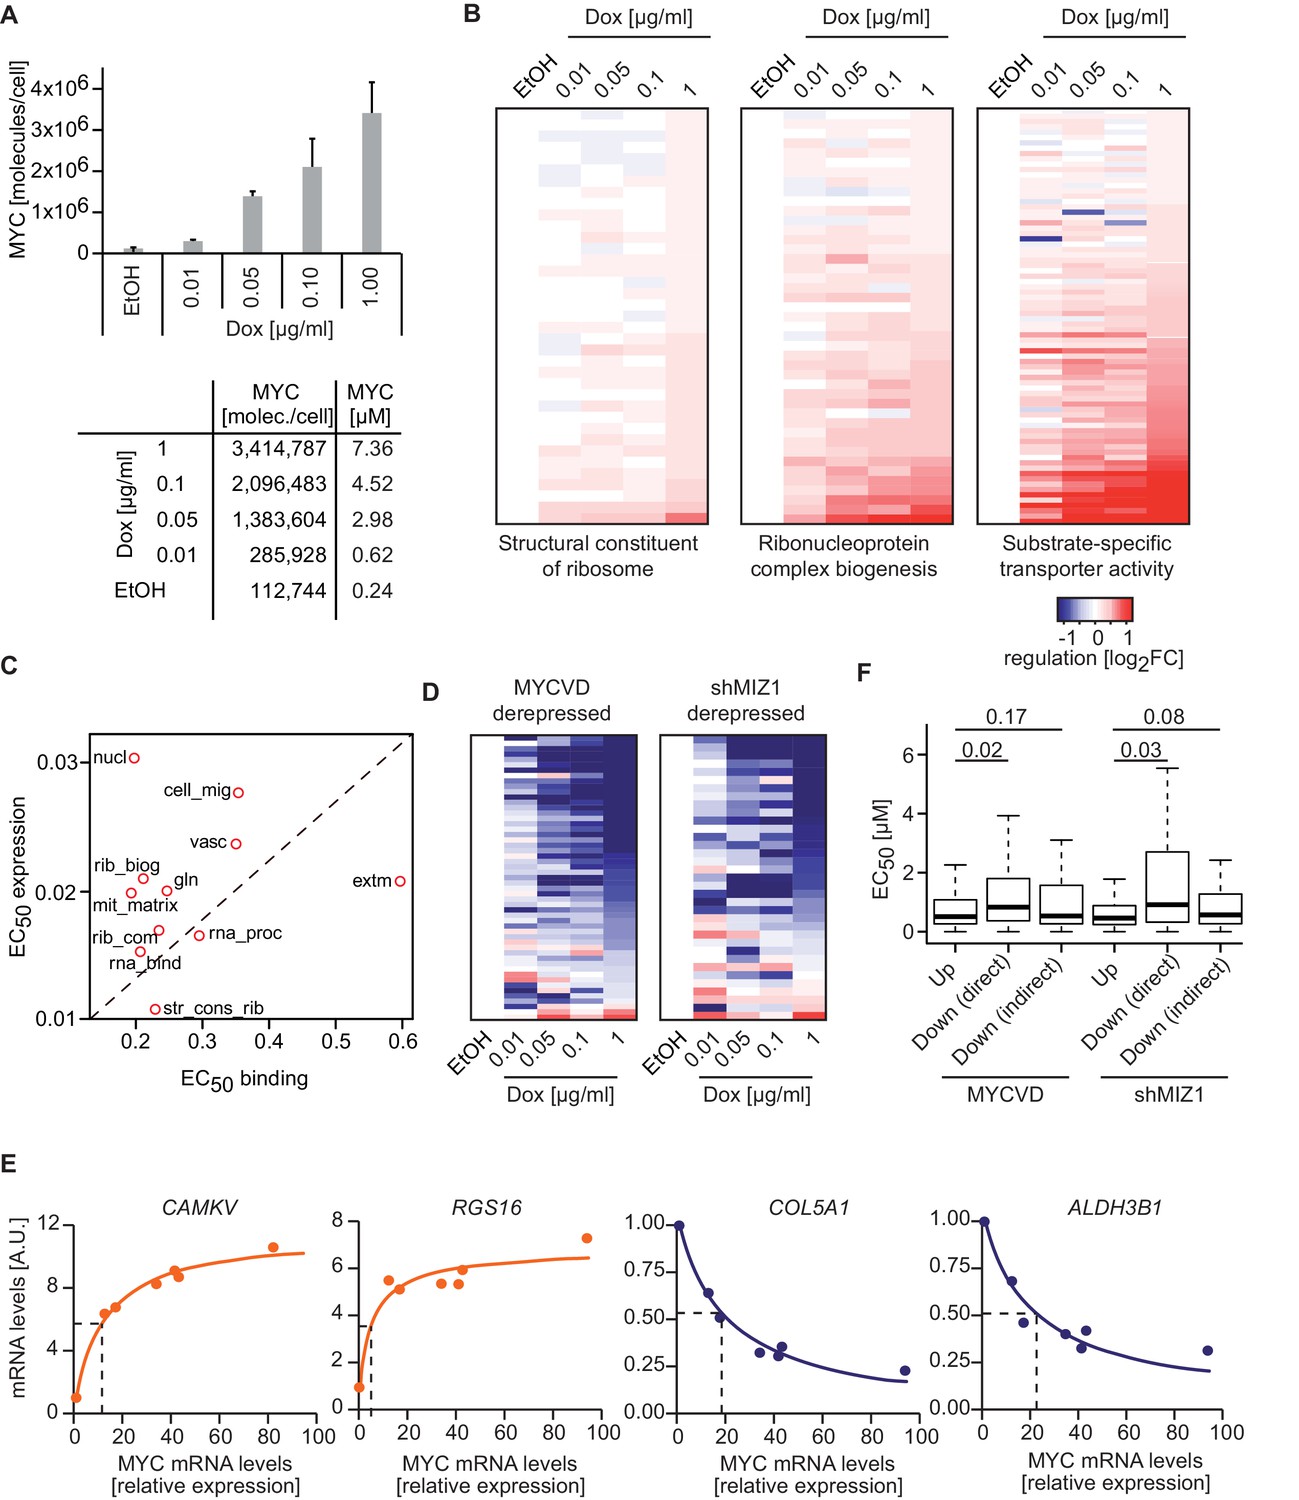
(A) Bar plot indicating MYC levels in U2OSTet-On cells treated with EtOH or with different concentrations of doxycycline. Data are shown as mean ± standard deviation of three independent biological replicates, which are shown in Figure 2—figure supplement 1D–-F. Table of calculated MYC molecules and concentration per cell (see Supplementary file 1 for calculation). (B) Heat maps for regulation of genes belonging to the three gene sets (Structural constituent of ribosome: GO_0003735; Ribonucleoprotein complex biogenesis: GO_0022613; substrate-specific transporter activity: GO_0022892) identified by GSEA in Figure 2D,E and Figure 5C. For all conditions, log2FC was calculated relative to the EtOH sample and only transactivated genes are shown. Supplementary file 2 contains gene set lists used in this study. (C) Plot for median EC50 values for binding and regulation of gene sets from Figure 5I. EC50 values for regulation were calculated using RNA-sequencing data from the MYC depletion (Figure 5A) and the MYC titration experiments (Figure 6A). (D) Heat maps documenting the regulation of genes down-regulated by wild-type MYC and derepressed by MYCV394D or in cells depleted of MIZ1. Log2FC calculated as in B. (E) qRT-PCR analysis from U2OSTet-On induced for MYC overexpression with increasing doxycycline concentrations. Both, MYC mRNA levels (x-axis) and mRNA levels of MYC target genes (y-axis) are plotted. Dashed lines indicate half-maximal gene regulation. Please note the differences in MYC expression needed for half maximal target gene regulation between transactivated (orange curve) and repressed (blue curve) genes. The x-axis shows MYC mRNA levels relative to the EtOH control. (F) Boxplots of genes repressed by wild-type MYC but not by MYCV394D (MYCVD, 'Down (direct)') or by wild-type MYC when MIZ1 is depleted via shRNA (shMIZ1, 'Down (direct)'). MYC-activated genes ('Up') and genes, which are repressed in the absence of a functional MYC/MIZ1 complex ('Down (indirect)') were used as reference gene sets. p-values (p), One-sided Mann-Whitney-Wilcoxon test. Outliers are not shown in the plot.
Figure 7

Schematic models.
(A) High-affinity binding sites, for instance characterized by E-boxes and WDR5 binding, are already highly occupied at physiological MYC levels (medium MYC) in dividing cells. At oncogenic concentration (high MYC) also low-affinity (low aff.) binding sites can become occupied by MYC and regulation of these low-affinity genes is indicative for transformation (ECM: extracellular matrix). (B) MYC regulates distinct biological processes at different cellular concentrations.
Appendix 1—figure 1
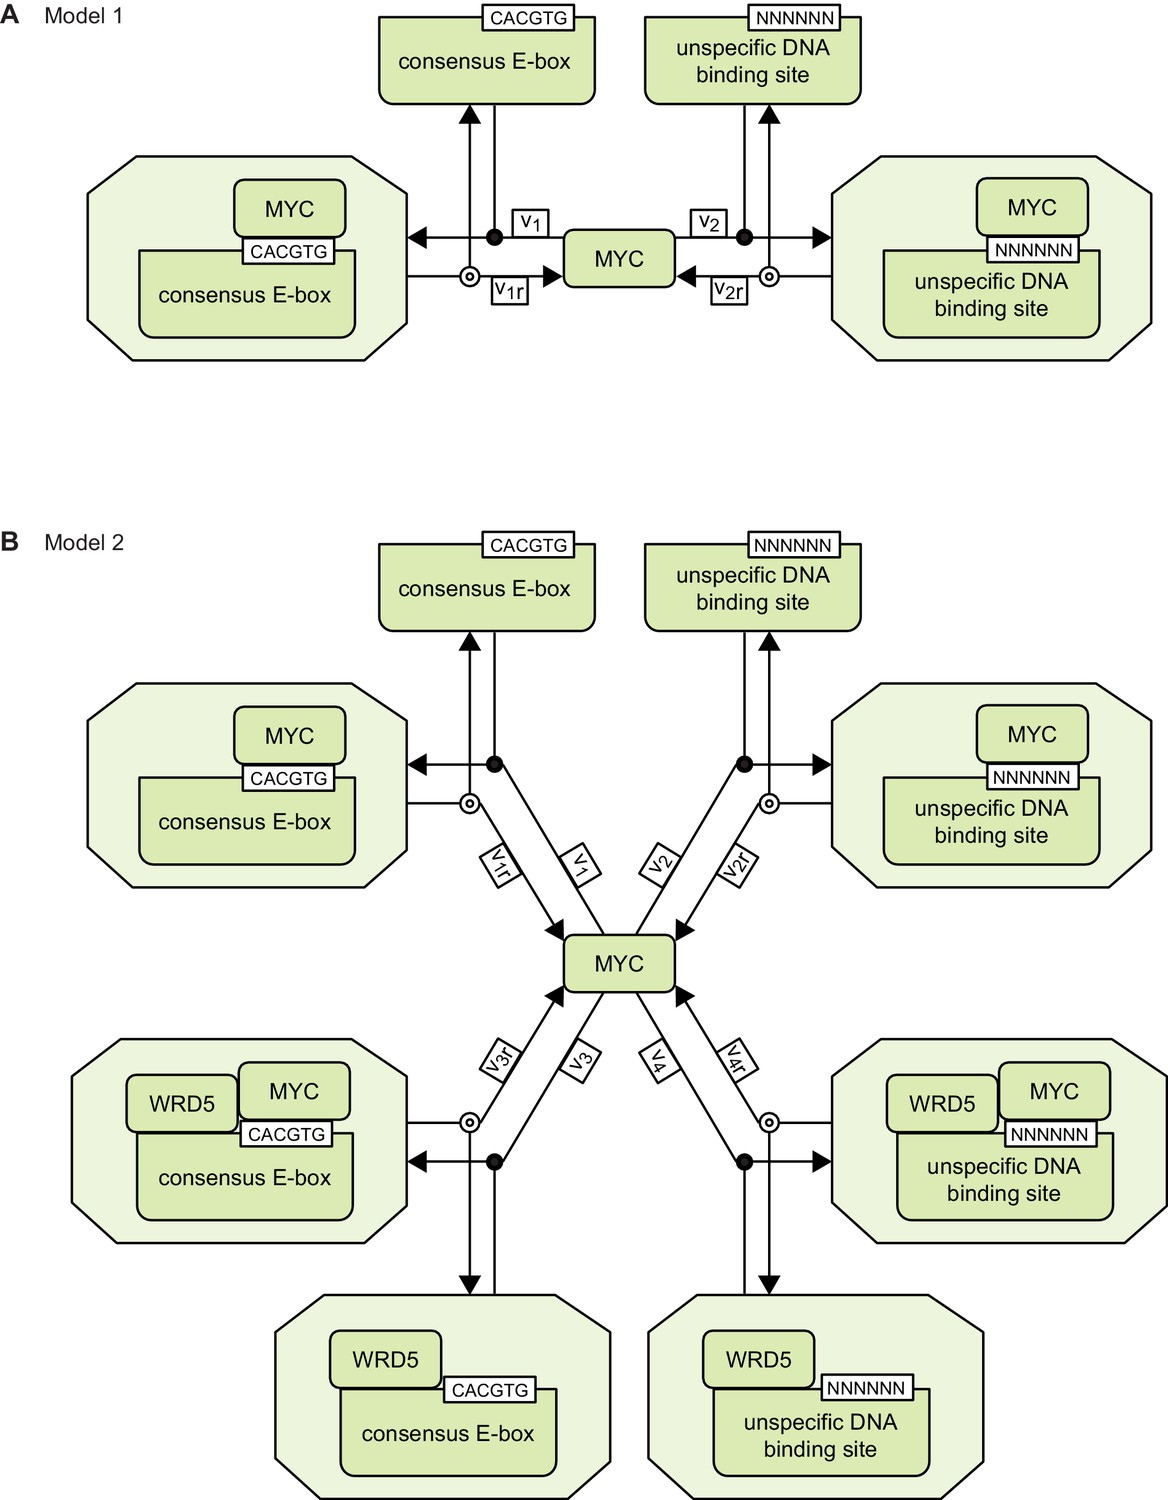
Schemes of models 1 and 2.
https://doi.org/10.7554/eLife.15161.019
Appendix 2–figure 1
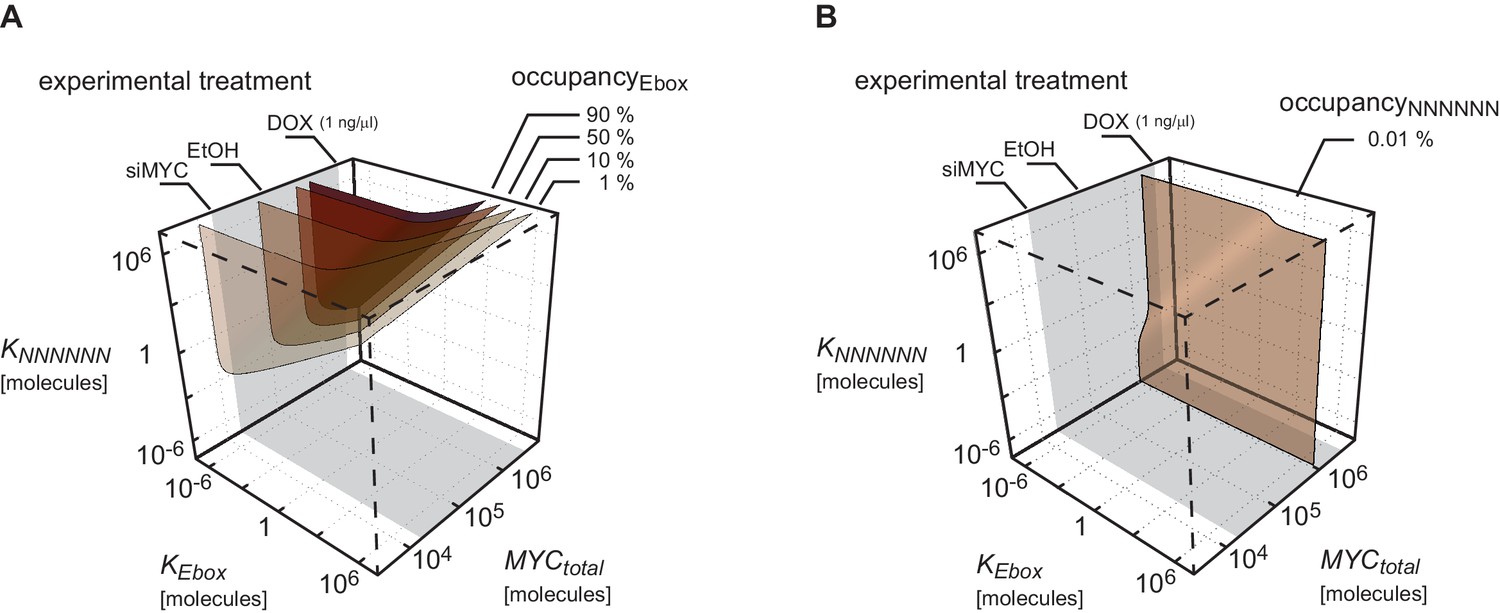
Plot shows surfaces of equal occupancy as function of dissociation constants and as well as total amount of MYC.
Different regions of occupancy of E-boxes (A) and NNNNNN sequences (B) are shown in this parameter space. The experimentally measured range of the total amount of MYC is marked in grey. Total MYC concentrations of U2OS cells were changed by different experimental treatments as indicated on the upper axis. To simulate U2OS cells, and are assumed.
Appendix 2–figure 2

Plot shows surface of of Appendix 2–figure 1A in two different orientations: rotated into the - -plane and into the - -plane.
https://doi.org/10.7554/eLife.15161.024
Appendix 2–figure 3
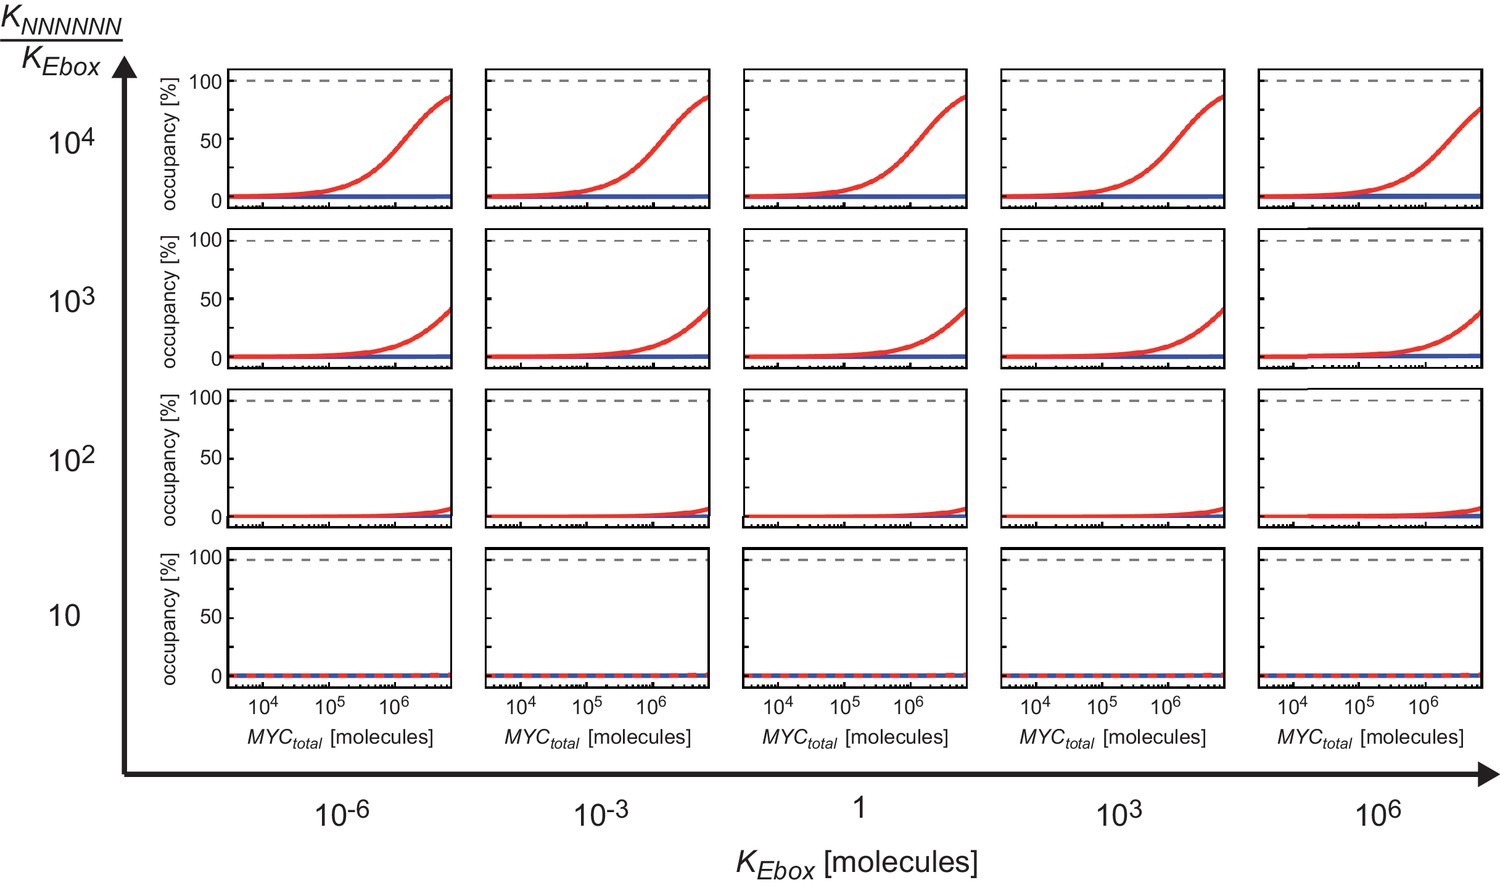
Ratio of the dissociation constants and determines how much occupancy of E-boxes differs from occupancy of NNNNNN sequences.
The panels show the dependency of the occupancies of E-boxes (red curve) and NNNNNN sequences (blue curves) on total number of MYC molecules. For each panel a different combination of dissociation constants and are chosen. The panels are displayed in a matrix sorted for increasing values of and increasing ratios to .
Appendix 2–figure 4

Impact of number of E-boxes and NNNNNN sequences.
Different combinations of number of E-boxes and NNNNNN sequences are assumed in the simulations: and represent the reference values and the range of 50% to 200% of these reference values is taken into account. Surfaces of equal occupancy of E-boxes are shown as function of dissociation constants and as well as total amount of MYC.
Tables
Appendix 1—table 1
Parameters generally applicable to models 1 and 2.
| Parameter | Value | Unit | Comment, Reference |
|---|---|---|---|
| Vol | 7.7·10–13 | L | 1) |
| Genometotal | 9.5·109 | base pairs | 2) |
Appendix 1—table 2
Parameters of model 1.
| Parameter | Value | Unit | Comment, Reference |
|---|---|---|---|
| Eboxtotal | 9.3·105 | molecules | 3) |
| NNNNNNtotal | 9.5·109 | molecules | 4) |
| KEbox | 4.6·101 | molecules | 5); 0.1 nM (Guo et al., 2014) |
| KNNNNNN | 9.3·103 | molecules | 5); 20 nM (Guo et al., 2014) |
Appendix 1—table 3
Parameters of model 2.
| Parameter | Value | Unit | Comment, Reference |
|---|---|---|---|
| Eboxtotal | 9.2·105 | molecules | 6) |
| NNNNNNtotal | 9.5·109 | molecules | 6) |
| EboxWDR5total | 1.2·104 | molecules | 6) |
| NNNNNNWDR5total | 4.7·104 | molecules | 6) |
| KEbox | 4.6·101 | molecules | 5); 0.1 nM (Guo et al., 2014) |
| KNNNNNN | 9.3·103 | molecules | 5); 20 nM (Guo et al., 2014) |
| KEboxWDR5 | 4.3·10–4 | molecules | 7) |
| KNNNNNNWDR5 | 8.6·10–2 | molecules | 7) |
Additional files
-
Supplementary file 1
This file provides the raw data and calculation for absolute protein quantification.
- https://doi.org/10.7554/eLife.15161.016
-
Supplementary file 2
This file lists gene sets used in this study.
- https://doi.org/10.7554/eLife.15161.017
-
Supplementary file 3
This file lists primer sequences used in this study.
- https://doi.org/10.7554/eLife.15161.018
Download links
A two-part list of links to download the article, or parts of the article, in various formats.
Downloads (link to download the article as PDF)
Open citations (links to open the citations from this article in various online reference manager services)
Cite this article (links to download the citations from this article in formats compatible with various reference manager tools)
Different promoter affinities account for specificity in MYC-dependent gene regulation
eLife 5:e15161.
https://doi.org/10.7554/eLife.15161


